Immigrants from Micronesia 1 or more Vehicles in Household
COMPARE
Immigrants from Micronesia
Select to Compare
1 or more Vehicles in Household
Immigrants from Micronesia 1 or more Vehicles in Household
90.1%
1+ VEHICLES AVAILABLE
75.9/ 100
METRIC RATING
150th/ 347
METRIC RANK
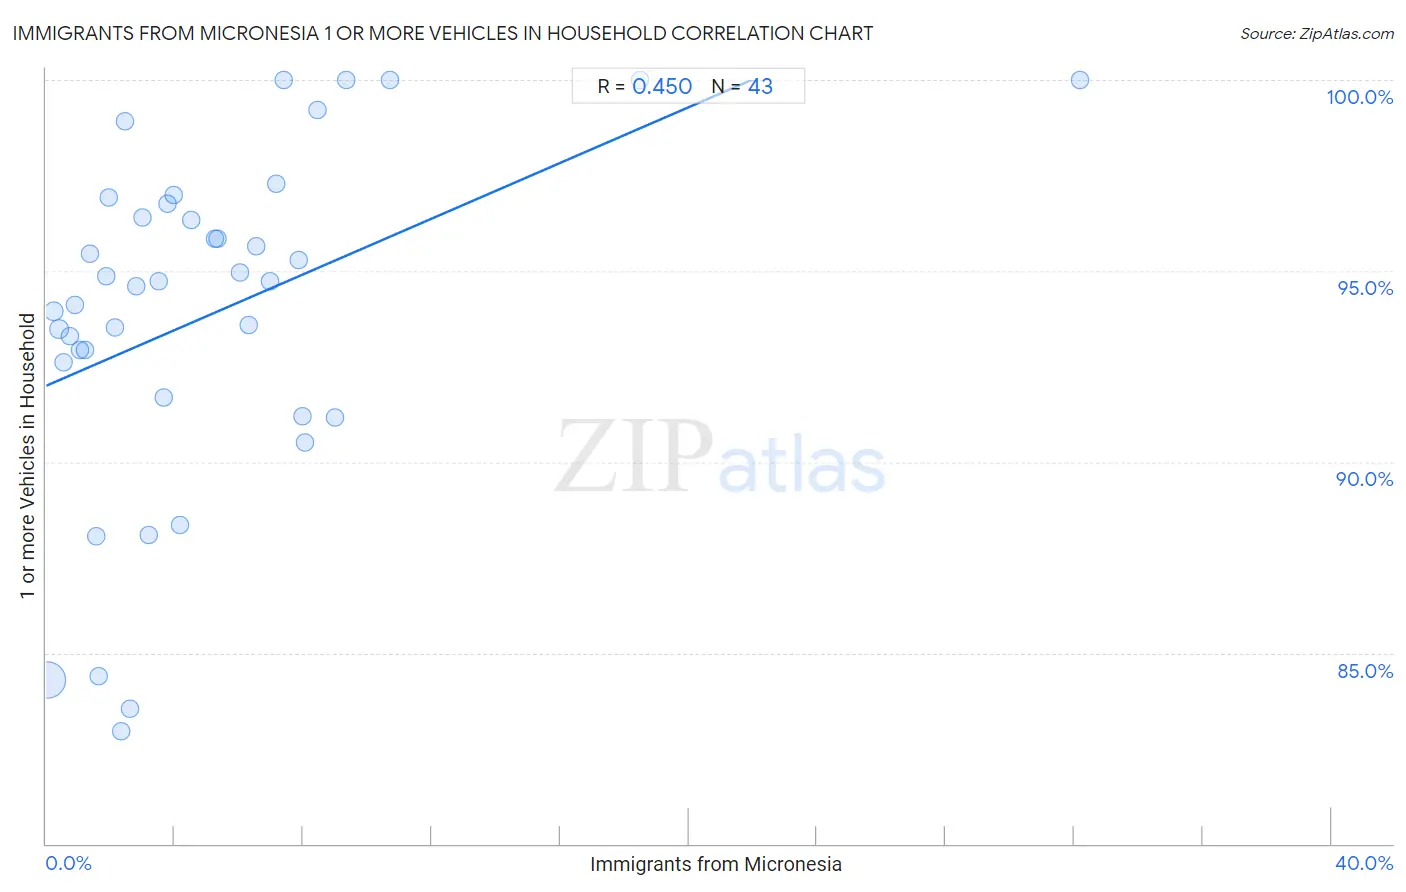
Immigrants from Micronesia 1 or more Vehicles in Household Correlation Chart
The statistical analysis conducted on geographies consisting of 61,591,588 people shows a moderate positive correlation between the proportion of Immigrants from Micronesia and percentage of households with 1 or more vehicles available in the United States with a correlation coefficient (R) of 0.450 and weighted average of 90.1%. On average, for every 1% (one percent) increase in Immigrants from Micronesia within a typical geography, there is an increase of 0.36% in percentage of households with 1 or more vehicles available.
It is essential to understand that the correlation between the percentage of Immigrants from Micronesia and percentage of households with 1 or more vehicles available does not imply a direct cause-and-effect relationship. It remains uncertain whether the presence of Immigrants from Micronesia influences an upward or downward trend in the level of percentage of households with 1 or more vehicles available within an area, or if Immigrants from Micronesia simply ended up residing in those areas with higher or lower levels of percentage of households with 1 or more vehicles available due to other factors.
Demographics Similar to Immigrants from Micronesia by 1 or more Vehicles in Household
In terms of 1 or more vehicles in household, the demographic groups most similar to Immigrants from Micronesia are Immigrants from Bosnia and Herzegovina (90.1%, a difference of 0.010%), Immigrants from Nicaragua (90.1%, a difference of 0.020%), Tlingit-Haida (90.1%, a difference of 0.030%), New Zealander (90.1%, a difference of 0.040%), and Immigrants from Uganda (90.1%, a difference of 0.040%).
| Demographics | Rating | Rank | 1 or more Vehicles in Household |
| Immigrants from Bahamas | 81.5 /100 | #143 | Excellent 90.2% |
| Immigrants from Zimbabwe | 81.5 /100 | #144 | Excellent 90.2% |
| Sioux | 81.3 /100 | #145 | Excellent 90.2% |
| Bahamians | 80.5 /100 | #146 | Excellent 90.2% |
| Chileans | 79.8 /100 | #147 | Good 90.2% |
| Immigrants from Eastern Africa | 78.2 /100 | #148 | Good 90.1% |
| Immigrants from Nicaragua | 76.7 /100 | #149 | Good 90.1% |
| Immigrants from Micronesia | 75.9 /100 | #150 | Good 90.1% |
| Immigrants from Bosnia and Herzegovina | 75.4 /100 | #151 | Good 90.1% |
| Tlingit-Haida | 74.3 /100 | #152 | Good 90.1% |
| New Zealanders | 73.8 /100 | #153 | Good 90.1% |
| Immigrants from Uganda | 73.8 /100 | #154 | Good 90.1% |
| Immigrants | 73.6 /100 | #155 | Good 90.1% |
| Australians | 72.4 /100 | #156 | Good 90.0% |
| Immigrants from Congo | 71.2 /100 | #157 | Good 90.0% |
Immigrants from Micronesia 1 or more Vehicles in Household Correlation Summary
| Measurement | Immigrants from Micronesia Data | 1 or more Vehicles in Household Data |
| Minimum | 0.022% | 83.0% |
| Maximum | 32.2% | 100.0% |
| Range | 32.1% | 17.0% |
| Mean | 5.1% | 93.8% |
| Median | 3.7% | 94.7% |
| Interquartile 25% (IQ1) | 1.6% | 91.7% |
| Interquartile 75% (IQ3) | 7.1% | 96.8% |
| Interquartile Range (IQR) | 5.5% | 5.1% |
| Standard Deviation (Sample) | 5.6% | 4.5% |
| Standard Deviation (Population) | 5.5% | 4.5% |
Correlation Details
| Immigrants from Micronesia Percentile | Sample Size | 1 or more Vehicles in Household |
[ 0.0% - 0.5% ] 0.022% | 53,363,867 | 84.3% |
[ 0.0% - 0.5% ] 0.22% | 3,462,055 | 93.9% |
[ 0.0% - 0.5% ] 0.39% | 1,633,111 | 93.5% |
[ 0.5% - 1.0% ] 0.54% | 910,389 | 92.6% |
[ 0.5% - 1.0% ] 0.73% | 522,252 | 93.3% |
[ 0.5% - 1.0% ] 0.90% | 465,458 | 94.1% |
[ 1.0% - 1.5% ] 1.05% | 183,115 | 92.9% |
[ 1.0% - 1.5% ] 1.22% | 79,622 | 92.9% |
[ 1.0% - 1.5% ] 1.35% | 37,868 | 95.5% |
[ 1.5% - 2.0% ] 1.56% | 130,257 | 88.0% |
[ 1.5% - 2.0% ] 1.63% | 382,524 | 84.4% |
[ 1.5% - 2.0% ] 1.86% | 10,989 | 94.9% |
[ 1.5% - 2.0% ] 1.95% | 667 | 96.9% |
[ 2.0% - 2.5% ] 2.13% | 133,478 | 93.5% |
[ 2.0% - 2.5% ] 2.33% | 78,526 | 83.0% |
[ 2.0% - 2.5% ] 2.46% | 1,907 | 98.9% |
[ 2.5% - 3.0% ] 2.59% | 55,473 | 83.5% |
[ 2.5% - 3.0% ] 2.81% | 3,701 | 94.6% |
[ 2.5% - 3.0% ] 2.99% | 8,254 | 96.4% |
[ 3.0% - 3.5% ] 3.19% | 58,742 | 88.1% |
[ 3.0% - 3.5% ] 3.48% | 9,702 | 94.7% |
[ 3.5% - 4.0% ] 3.66% | 9,383 | 91.7% |
[ 3.5% - 4.0% ] 3.79% | 10,786 | 96.8% |
[ 3.5% - 4.0% ] 3.95% | 11,207 | 97.0% |
[ 4.0% - 4.5% ] 4.17% | 624 | 88.4% |
[ 4.5% - 5.0% ] 4.52% | 1,129 | 96.3% |
[ 5.0% - 5.5% ] 5.26% | 2,356 | 95.8% |
[ 5.0% - 5.5% ] 5.31% | 414 | 95.8% |
[ 6.0% - 6.5% ] 6.04% | 844 | 95.0% |
[ 6.0% - 6.5% ] 6.28% | 2,005 | 93.6% |
[ 6.5% - 7.0% ] 6.52% | 3,801 | 95.6% |
[ 6.5% - 7.0% ] 6.97% | 201 | 94.7% |
[ 7.0% - 7.5% ] 7.14% | 196 | 97.3% |
[ 7.0% - 7.5% ] 7.41% | 81 | 100.0% |
[ 7.5% - 8.0% ] 7.87% | 4,842 | 95.3% |
[ 7.5% - 8.0% ] 7.96% | 5,391 | 91.2% |
[ 8.0% - 8.5% ] 8.05% | 2,820 | 90.5% |
[ 8.0% - 8.5% ] 8.44% | 379 | 99.2% |
[ 8.5% - 9.0% ] 9.00% | 1,278 | 91.2% |
[ 9.0% - 9.5% ] 9.32% | 429 | 100.0% |
[ 10.5% - 11.0% ] 10.70% | 374 | 100.0% |
[ 18.0% - 18.5% ] 18.47% | 693 | 100.0% |
[ 32.0% - 32.5% ] 32.16% | 398 | 100.0% |