Immigrants from Micronesia 4 or more Vehicles in Household
COMPARE
Immigrants from Micronesia
Select to Compare
4 or more Vehicles in Household
Immigrants from Micronesia 4 or more Vehicles in Household
7.6%
4+ VEHICLES AVAILABLE
100.0/ 100
METRIC RATING
63rd/ 347
METRIC RANK
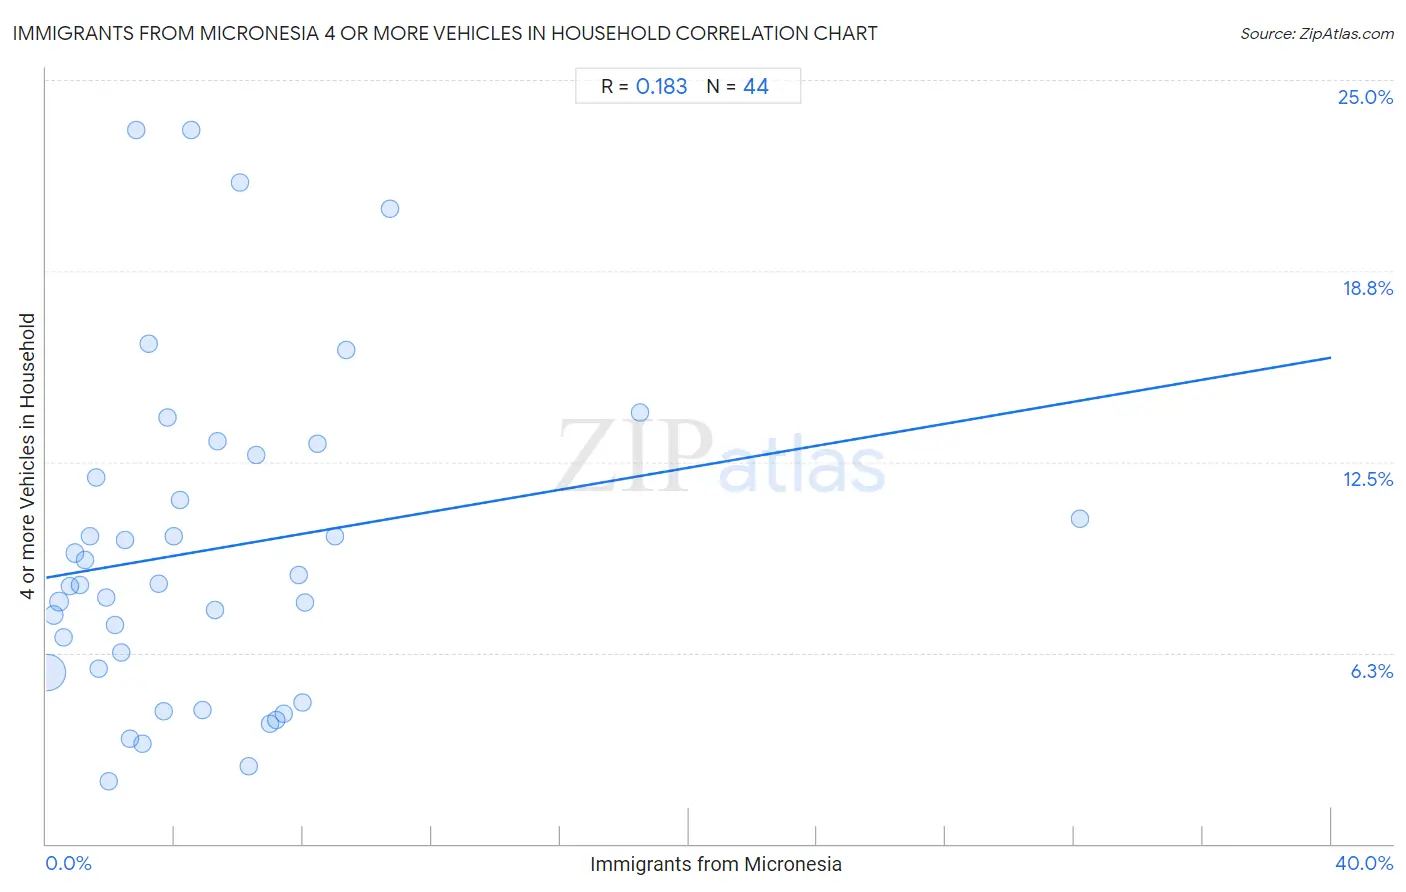
Immigrants from Micronesia 4 or more Vehicles in Household Correlation Chart
The statistical analysis conducted on geographies consisting of 61,547,693 people shows a poor positive correlation between the proportion of Immigrants from Micronesia and percentage of households with 4 or more vehicles available in the United States with a correlation coefficient (R) of 0.183 and weighted average of 7.6%. On average, for every 1% (one percent) increase in Immigrants from Micronesia within a typical geography, there is an increase of 0.18% in percentage of households with 4 or more vehicles available.
It is essential to understand that the correlation between the percentage of Immigrants from Micronesia and percentage of households with 4 or more vehicles available does not imply a direct cause-and-effect relationship. It remains uncertain whether the presence of Immigrants from Micronesia influences an upward or downward trend in the level of percentage of households with 4 or more vehicles available within an area, or if Immigrants from Micronesia simply ended up residing in those areas with higher or lower levels of percentage of households with 4 or more vehicles available due to other factors.
Demographics Similar to Immigrants from Micronesia by 4 or more Vehicles in Household
In terms of 4 or more vehicles in household, the demographic groups most similar to Immigrants from Micronesia are Chippewa (7.6%, a difference of 0.010%), Bangladeshi (7.6%, a difference of 0.24%), European (7.6%, a difference of 0.27%), Immigrants from the Azores (7.5%, a difference of 0.28%), and Spaniard (7.6%, a difference of 0.53%).
| Demographics | Rating | Rank | 4 or more Vehicles in Household |
| English | 100.0 /100 | #56 | Exceptional 7.6% |
| Pennsylvania Germans | 100.0 /100 | #57 | Exceptional 7.6% |
| Swedes | 100.0 /100 | #58 | Exceptional 7.6% |
| Hispanics or Latinos | 100.0 /100 | #59 | Exceptional 7.6% |
| Spaniards | 100.0 /100 | #60 | Exceptional 7.6% |
| Europeans | 100.0 /100 | #61 | Exceptional 7.6% |
| Chippewa | 100.0 /100 | #62 | Exceptional 7.6% |
| Immigrants from Micronesia | 100.0 /100 | #63 | Exceptional 7.6% |
| Bangladeshis | 100.0 /100 | #64 | Exceptional 7.6% |
| Immigrants from the Azores | 100.0 /100 | #65 | Exceptional 7.5% |
| Immigrants from Taiwan | 99.9 /100 | #66 | Exceptional 7.5% |
| Americans | 99.9 /100 | #67 | Exceptional 7.5% |
| Welsh | 99.9 /100 | #68 | Exceptional 7.5% |
| Germans | 99.9 /100 | #69 | Exceptional 7.5% |
| Scottish | 99.9 /100 | #70 | Exceptional 7.4% |
Immigrants from Micronesia 4 or more Vehicles in Household Correlation Summary
| Measurement | Immigrants from Micronesia Data | 4 or more Vehicles in Household Data |
| Minimum | 0.022% | 2.1% |
| Maximum | 32.2% | 23.4% |
| Range | 32.1% | 21.3% |
| Mean | 5.1% | 9.6% |
| Median | 3.7% | 8.5% |
| Interquartile 25% (IQ1) | 1.7% | 5.7% |
| Interquartile 75% (IQ3) | 7.1% | 12.4% |
| Interquartile Range (IQR) | 5.3% | 6.7% |
| Standard Deviation (Sample) | 5.5% | 5.4% |
| Standard Deviation (Population) | 5.4% | 5.3% |
Correlation Details
| Immigrants from Micronesia Percentile | Sample Size | 4 or more Vehicles in Household |
[ 0.0% - 0.5% ] 0.022% | 53,354,946 | 5.6% |
[ 0.0% - 0.5% ] 0.22% | 3,462,055 | 7.5% |
[ 0.0% - 0.5% ] 0.39% | 1,608,896 | 7.9% |
[ 0.5% - 1.0% ] 0.54% | 908,170 | 6.8% |
[ 0.5% - 1.0% ] 0.73% | 508,252 | 8.4% |
[ 0.5% - 1.0% ] 0.90% | 465,458 | 9.5% |
[ 1.0% - 1.5% ] 1.05% | 183,115 | 8.5% |
[ 1.0% - 1.5% ] 1.22% | 79,622 | 9.3% |
[ 1.0% - 1.5% ] 1.35% | 37,868 | 10.1% |
[ 1.5% - 2.0% ] 1.56% | 129,601 | 12.0% |
[ 1.5% - 2.0% ] 1.63% | 381,942 | 5.7% |
[ 1.5% - 2.0% ] 1.86% | 10,989 | 8.1% |
[ 1.5% - 2.0% ] 1.95% | 667 | 2.1% |
[ 2.0% - 2.5% ] 2.13% | 133,478 | 7.2% |
[ 2.0% - 2.5% ] 2.33% | 78,526 | 6.2% |
[ 2.0% - 2.5% ] 2.46% | 1,907 | 10.0% |
[ 2.5% - 3.0% ] 2.59% | 55,473 | 3.4% |
[ 2.5% - 3.0% ] 2.79% | 681 | 23.4% |
[ 2.5% - 3.0% ] 2.99% | 8,254 | 3.3% |
[ 3.0% - 3.5% ] 3.19% | 58,742 | 16.3% |
[ 3.0% - 3.5% ] 3.48% | 9,702 | 8.5% |
[ 3.5% - 4.0% ] 3.66% | 9,383 | 4.3% |
[ 3.5% - 4.0% ] 3.79% | 10,786 | 14.0% |
[ 3.5% - 4.0% ] 3.95% | 11,207 | 10.1% |
[ 4.0% - 4.5% ] 4.17% | 624 | 11.2% |
[ 4.5% - 5.0% ] 4.52% | 1,129 | 23.4% |
[ 4.5% - 5.0% ] 4.87% | 10,042 | 4.4% |
[ 5.0% - 5.5% ] 5.26% | 2,356 | 7.7% |
[ 5.0% - 5.5% ] 5.31% | 414 | 13.2% |
[ 6.0% - 6.5% ] 6.04% | 844 | 21.7% |
[ 6.0% - 6.5% ] 6.28% | 2,005 | 2.5% |
[ 6.5% - 7.0% ] 6.53% | 3,477 | 12.7% |
[ 6.5% - 7.0% ] 6.97% | 201 | 3.9% |
[ 7.0% - 7.5% ] 7.14% | 196 | 4.1% |
[ 7.0% - 7.5% ] 7.41% | 81 | 4.3% |
[ 7.5% - 8.0% ] 7.87% | 4,842 | 8.8% |
[ 7.5% - 8.0% ] 7.96% | 5,391 | 4.6% |
[ 8.0% - 8.5% ] 8.05% | 2,820 | 7.9% |
[ 8.0% - 8.5% ] 8.44% | 379 | 13.1% |
[ 8.5% - 9.0% ] 9.00% | 1,278 | 10.1% |
[ 9.0% - 9.5% ] 9.32% | 429 | 16.1% |
[ 10.5% - 11.0% ] 10.70% | 374 | 20.8% |
[ 18.0% - 18.5% ] 18.47% | 693 | 14.1% |
[ 32.0% - 32.5% ] 32.16% | 398 | 10.7% |