Immigrants from Lebanon vs Polish Disability Age 5 to 17
COMPARE
Immigrants from Lebanon
Polish
Disability Age 5 to 17
Disability Age 5 to 17 Comparison
Immigrants from Lebanon
Poles
4.8%
DISABILITY AGE 5 TO 17
100.0/ 100
METRIC RATING
24th/ 347
METRIC RANK
5.9%
DISABILITY AGE 5 TO 17
1.5/ 100
METRIC RATING
250th/ 347
METRIC RANK
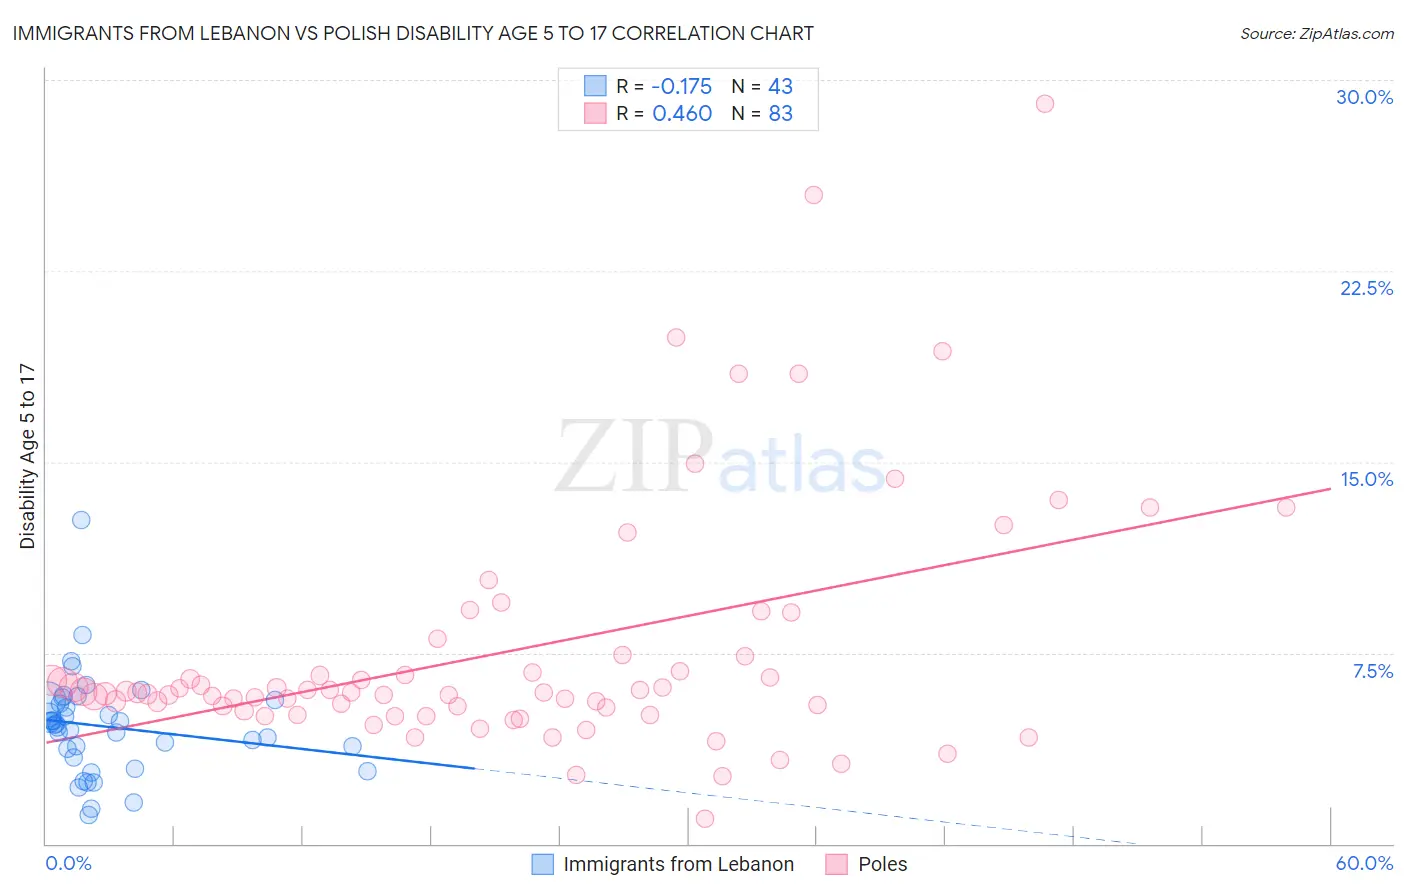
Immigrants from Lebanon vs Polish Disability Age 5 to 17 Correlation Chart
The statistical analysis conducted on geographies consisting of 216,408,470 people shows a poor negative correlation between the proportion of Immigrants from Lebanon and percentage of population with a disability between the ages 5 and 17 in the United States with a correlation coefficient (R) of -0.175 and weighted average of 4.8%. Similarly, the statistical analysis conducted on geographies consisting of 547,751,801 people shows a moderate positive correlation between the proportion of Poles and percentage of population with a disability between the ages 5 and 17 in the United States with a correlation coefficient (R) of 0.460 and weighted average of 5.9%, a difference of 21.5%.
Disability Age 5 to 17 Correlation Summary
| Measurement | Immigrants from Lebanon | Polish |
| Minimum | 1.1% | 0.99% |
| Maximum | 12.7% | 29.1% |
| Range | 11.6% | 28.1% |
| Mean | 4.6% | 7.5% |
| Median | 4.7% | 5.9% |
| Interquartile 25% (IQ1) | 3.4% | 5.2% |
| Interquartile 75% (IQ3) | 5.6% | 7.4% |
| Interquartile Range (IQR) | 2.2% | 2.2% |
| Standard Deviation (Sample) | 2.0% | 4.9% |
| Standard Deviation (Population) | 2.0% | 4.9% |
Similar Demographics by Disability Age 5 to 17
Demographics Similar to Immigrants from Lebanon by Disability Age 5 to 17
In terms of disability age 5 to 17, the demographic groups most similar to Immigrants from Lebanon are Immigrants from Asia (4.8%, a difference of 0.11%), Immigrants from Bolivia (4.8%, a difference of 0.15%), Asian (4.8%, a difference of 0.81%), Bhutanese (4.9%, a difference of 0.98%), and Yup'ik (4.8%, a difference of 1.1%).
| Demographics | Rating | Rank | Disability Age 5 to 17 |
| Arapaho | 100.0 /100 | #17 | Exceptional 4.7% |
| Immigrants | South Central Asia | 100.0 /100 | #18 | Exceptional 4.7% |
| Immigrants | Uzbekistan | 100.0 /100 | #19 | Exceptional 4.8% |
| Burmese | 100.0 /100 | #20 | Exceptional 4.8% |
| Yup'ik | 100.0 /100 | #21 | Exceptional 4.8% |
| Asians | 100.0 /100 | #22 | Exceptional 4.8% |
| Immigrants | Bolivia | 100.0 /100 | #23 | Exceptional 4.8% |
| Immigrants | Lebanon | 100.0 /100 | #24 | Exceptional 4.8% |
| Immigrants | Asia | 100.0 /100 | #25 | Exceptional 4.8% |
| Bhutanese | 100.0 /100 | #26 | Exceptional 4.9% |
| Taiwanese | 100.0 /100 | #27 | Exceptional 4.9% |
| Immigrants | Japan | 100.0 /100 | #28 | Exceptional 4.9% |
| Immigrants | Serbia | 100.0 /100 | #29 | Exceptional 4.9% |
| Immigrants | Malaysia | 100.0 /100 | #30 | Exceptional 5.0% |
| Immigrants | Pakistan | 100.0 /100 | #31 | Exceptional 5.0% |
Demographics Similar to Poles by Disability Age 5 to 17
In terms of disability age 5 to 17, the demographic groups most similar to Poles are Immigrants from Cambodia (5.9%, a difference of 0.020%), Honduran (5.9%, a difference of 0.040%), Scandinavian (5.9%, a difference of 0.11%), Immigrants from Ghana (5.9%, a difference of 0.12%), and British (5.9%, a difference of 0.13%).
| Demographics | Rating | Rank | Disability Age 5 to 17 |
| Indonesians | 2.0 /100 | #243 | Tragic 5.9% |
| Immigrants | Germany | 1.9 /100 | #244 | Tragic 5.9% |
| Immigrants | Micronesia | 1.9 /100 | #245 | Tragic 5.9% |
| Tlingit-Haida | 1.9 /100 | #246 | Tragic 5.9% |
| Immigrants | Honduras | 1.8 /100 | #247 | Tragic 5.9% |
| British | 1.7 /100 | #248 | Tragic 5.9% |
| Immigrants | Ghana | 1.7 /100 | #249 | Tragic 5.9% |
| Poles | 1.5 /100 | #250 | Tragic 5.9% |
| Immigrants | Cambodia | 1.5 /100 | #251 | Tragic 5.9% |
| Hondurans | 1.5 /100 | #252 | Tragic 5.9% |
| Scandinavians | 1.4 /100 | #253 | Tragic 5.9% |
| Barbadians | 1.3 /100 | #254 | Tragic 5.9% |
| Italians | 1.2 /100 | #255 | Tragic 5.9% |
| Hopi | 1.0 /100 | #256 | Tragic 5.9% |
| Hispanics or Latinos | 1.0 /100 | #257 | Tragic 5.9% |