Immigrants from Egypt vs Ute Disability Age 5 to 17
COMPARE
Immigrants from Egypt
Ute
Disability Age 5 to 17
Disability Age 5 to 17 Comparison
Immigrants from Egypt
Ute
5.0%
DISABILITY AGE 5 TO 17
100.0/ 100
METRIC RATING
36th/ 347
METRIC RANK
5.5%
DISABILITY AGE 5 TO 17
80.6/ 100
METRIC RATING
152nd/ 347
METRIC RANK
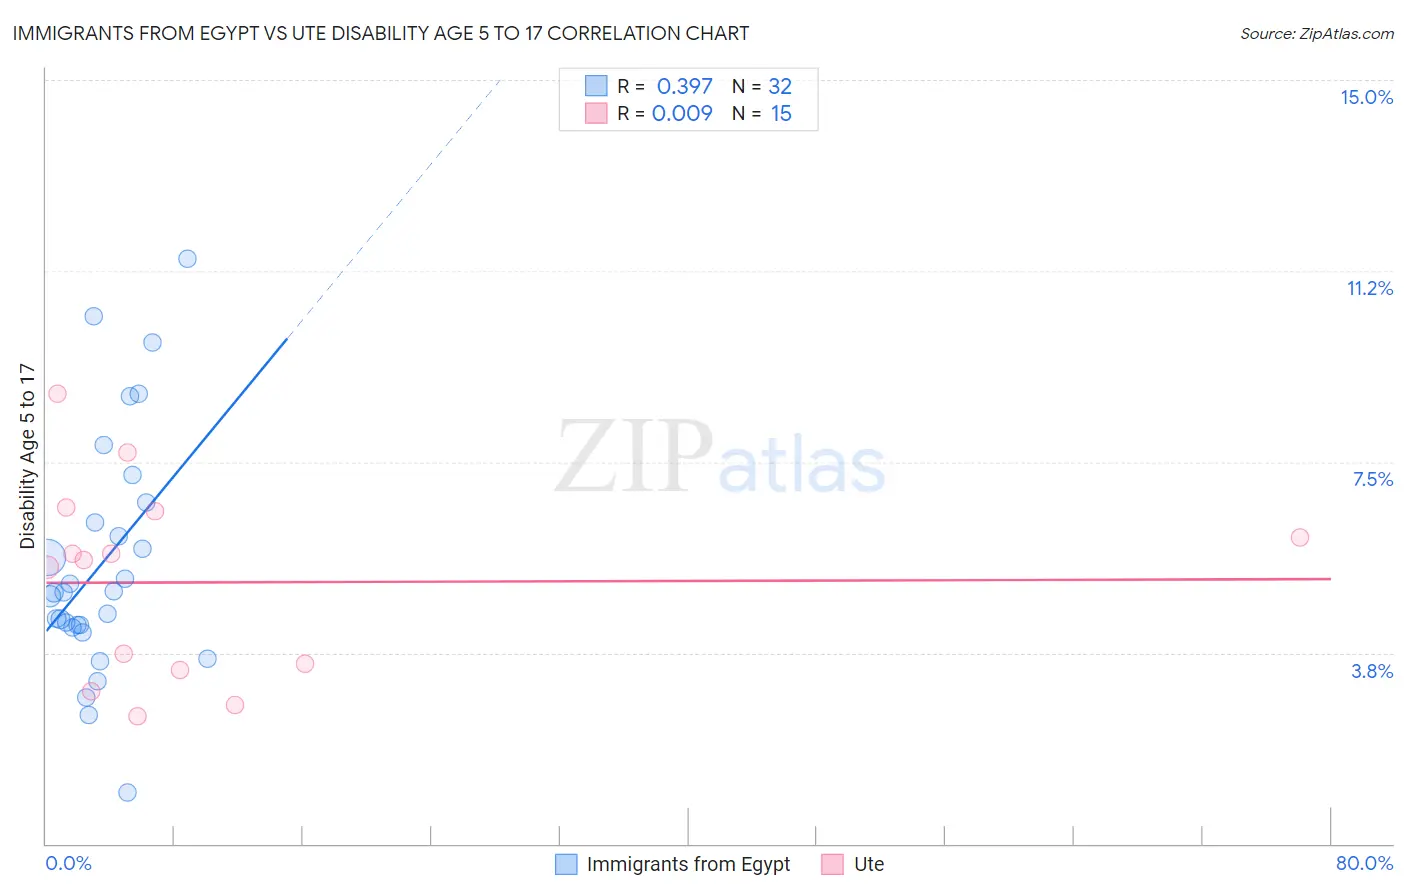
Immigrants from Egypt vs Ute Disability Age 5 to 17 Correlation Chart
The statistical analysis conducted on geographies consisting of 244,261,461 people shows a mild positive correlation between the proportion of Immigrants from Egypt and percentage of population with a disability between the ages 5 and 17 in the United States with a correlation coefficient (R) of 0.397 and weighted average of 5.0%. Similarly, the statistical analysis conducted on geographies consisting of 55,569,017 people shows no correlation between the proportion of Ute and percentage of population with a disability between the ages 5 and 17 in the United States with a correlation coefficient (R) of 0.009 and weighted average of 5.5%, a difference of 9.9%.
Disability Age 5 to 17 Correlation Summary
| Measurement | Immigrants from Egypt | Ute |
| Minimum | 1.0% | 2.5% |
| Maximum | 11.5% | 8.8% |
| Range | 10.5% | 6.3% |
| Mean | 5.5% | 5.1% |
| Median | 4.9% | 5.6% |
| Interquartile 25% (IQ1) | 4.3% | 3.4% |
| Interquartile 75% (IQ3) | 6.5% | 6.5% |
| Interquartile Range (IQR) | 2.2% | 3.1% |
| Standard Deviation (Sample) | 2.4% | 1.9% |
| Standard Deviation (Population) | 2.3% | 1.8% |
Similar Demographics by Disability Age 5 to 17
Demographics Similar to Immigrants from Egypt by Disability Age 5 to 17
In terms of disability age 5 to 17, the demographic groups most similar to Immigrants from Egypt are Immigrants from Belarus (5.0%, a difference of 0.030%), Bolivian (5.0%, a difference of 0.050%), Immigrants from Philippines (5.0%, a difference of 0.070%), Immigrants from Argentina (5.0%, a difference of 0.080%), and Okinawan (5.0%, a difference of 0.15%).
| Demographics | Rating | Rank | Disability Age 5 to 17 |
| Immigrants | Serbia | 100.0 /100 | #29 | Exceptional 4.9% |
| Immigrants | Malaysia | 100.0 /100 | #30 | Exceptional 5.0% |
| Immigrants | Pakistan | 100.0 /100 | #31 | Exceptional 5.0% |
| Soviet Union | 100.0 /100 | #32 | Exceptional 5.0% |
| Immigrants | Indonesia | 100.0 /100 | #33 | Exceptional 5.0% |
| Israelis | 100.0 /100 | #34 | Exceptional 5.0% |
| Bolivians | 100.0 /100 | #35 | Exceptional 5.0% |
| Immigrants | Egypt | 100.0 /100 | #36 | Exceptional 5.0% |
| Immigrants | Belarus | 100.0 /100 | #37 | Exceptional 5.0% |
| Immigrants | Philippines | 100.0 /100 | #38 | Exceptional 5.0% |
| Immigrants | Argentina | 100.0 /100 | #39 | Exceptional 5.0% |
| Okinawans | 100.0 /100 | #40 | Exceptional 5.0% |
| Immigrants | Australia | 100.0 /100 | #41 | Exceptional 5.0% |
| Immigrants | Sri Lanka | 100.0 /100 | #42 | Exceptional 5.0% |
| Immigrants | Russia | 100.0 /100 | #43 | Exceptional 5.0% |
Demographics Similar to Ute by Disability Age 5 to 17
In terms of disability age 5 to 17, the demographic groups most similar to Ute are Estonian (5.5%, a difference of 0.010%), Guatemalan (5.5%, a difference of 0.070%), Ecuadorian (5.5%, a difference of 0.070%), Central American (5.5%, a difference of 0.080%), and Samoan (5.5%, a difference of 0.11%).
| Demographics | Rating | Rank | Disability Age 5 to 17 |
| Immigrants | Guatemala | 86.6 /100 | #145 | Excellent 5.5% |
| Albanians | 83.7 /100 | #146 | Excellent 5.5% |
| Immigrants | Albania | 83.1 /100 | #147 | Excellent 5.5% |
| Samoans | 81.9 /100 | #148 | Excellent 5.5% |
| Central Americans | 81.6 /100 | #149 | Excellent 5.5% |
| Guatemalans | 81.5 /100 | #150 | Excellent 5.5% |
| Estonians | 80.8 /100 | #151 | Excellent 5.5% |
| Ute | 80.6 /100 | #152 | Excellent 5.5% |
| Ecuadorians | 79.7 /100 | #153 | Good 5.5% |
| Australians | 78.8 /100 | #154 | Good 5.5% |
| Immigrants | Ecuador | 78.3 /100 | #155 | Good 5.5% |
| Hawaiians | 78.0 /100 | #156 | Good 5.5% |
| Immigrants | Costa Rica | 77.9 /100 | #157 | Good 5.5% |
| Immigrants | Nepal | 77.1 /100 | #158 | Good 5.5% |
| Immigrants | Zimbabwe | 75.3 /100 | #159 | Good 5.5% |