Icelander vs Immigrants from Czechoslovakia Disability Age 5 to 17
COMPARE
Icelander
Immigrants from Czechoslovakia
Disability Age 5 to 17
Disability Age 5 to 17 Comparison
Icelanders
Immigrants from Czechoslovakia
5.7%
DISABILITY AGE 5 TO 17
14.6/ 100
METRIC RATING
200th/ 347
METRIC RANK
5.2%
DISABILITY AGE 5 TO 17
99.7/ 100
METRIC RATING
73rd/ 347
METRIC RANK
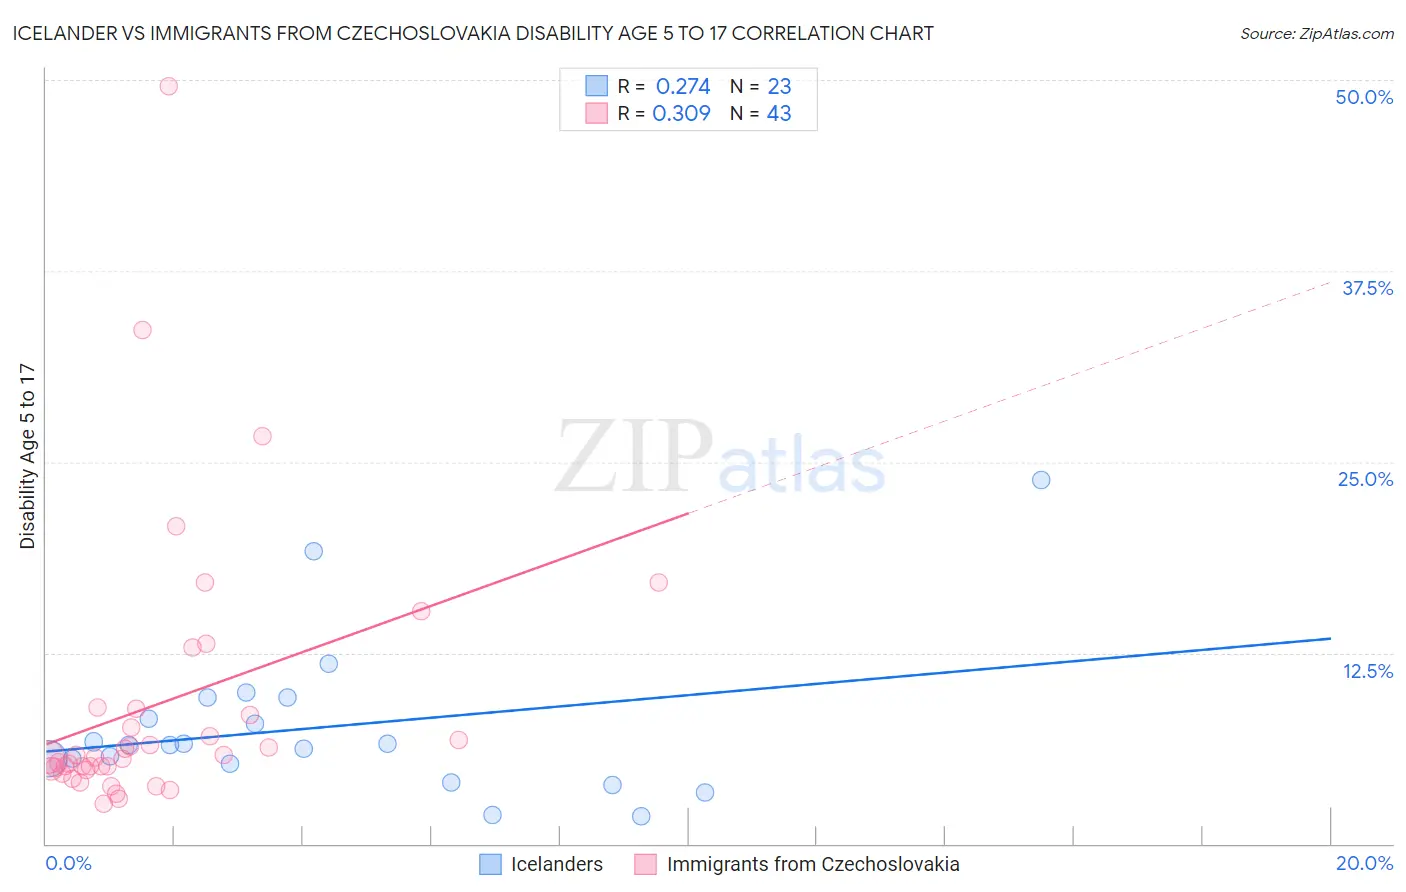
Icelander vs Immigrants from Czechoslovakia Disability Age 5 to 17 Correlation Chart
The statistical analysis conducted on geographies consisting of 158,852,183 people shows a weak positive correlation between the proportion of Icelanders and percentage of population with a disability between the ages 5 and 17 in the United States with a correlation coefficient (R) of 0.274 and weighted average of 5.7%. Similarly, the statistical analysis conducted on geographies consisting of 194,293,746 people shows a mild positive correlation between the proportion of Immigrants from Czechoslovakia and percentage of population with a disability between the ages 5 and 17 in the United States with a correlation coefficient (R) of 0.309 and weighted average of 5.2%, a difference of 10.0%.
Disability Age 5 to 17 Correlation Summary
| Measurement | Icelander | Immigrants from Czechoslovakia |
| Minimum | 1.8% | 2.6% |
| Maximum | 23.8% | 49.6% |
| Range | 22.0% | 47.0% |
| Mean | 7.6% | 9.1% |
| Median | 6.5% | 5.7% |
| Interquartile 25% (IQ1) | 5.2% | 4.9% |
| Interquartile 75% (IQ3) | 9.5% | 8.8% |
| Interquartile Range (IQR) | 4.3% | 4.0% |
| Standard Deviation (Sample) | 5.1% | 9.0% |
| Standard Deviation (Population) | 5.0% | 8.9% |
Similar Demographics by Disability Age 5 to 17
Demographics Similar to Icelanders by Disability Age 5 to 17
In terms of disability age 5 to 17, the demographic groups most similar to Icelanders are Northern European (5.7%, a difference of 0.060%), Basque (5.7%, a difference of 0.090%), Austrian (5.7%, a difference of 0.14%), Spanish American Indian (5.7%, a difference of 0.18%), and Paiute (5.7%, a difference of 0.36%).
| Demographics | Rating | Rank | Disability Age 5 to 17 |
| Immigrants | Canada | 26.1 /100 | #193 | Fair 5.7% |
| Croatians | 23.6 /100 | #194 | Fair 5.7% |
| Immigrants | Nigeria | 23.4 /100 | #195 | Fair 5.7% |
| Inupiat | 23.3 /100 | #196 | Fair 5.7% |
| Immigrants | North America | 23.1 /100 | #197 | Fair 5.7% |
| Norwegians | 20.9 /100 | #198 | Fair 5.7% |
| Northern Europeans | 15.2 /100 | #199 | Poor 5.7% |
| Icelanders | 14.6 /100 | #200 | Poor 5.7% |
| Basques | 13.7 /100 | #201 | Poor 5.7% |
| Austrians | 13.2 /100 | #202 | Poor 5.7% |
| Spanish American Indians | 12.8 /100 | #203 | Poor 5.7% |
| Paiute | 11.2 /100 | #204 | Poor 5.7% |
| Trinidadians and Tobagonians | 10.8 /100 | #205 | Poor 5.7% |
| Immigrants | Africa | 10.8 /100 | #206 | Poor 5.7% |
| Moroccans | 10.4 /100 | #207 | Poor 5.7% |
Demographics Similar to Immigrants from Czechoslovakia by Disability Age 5 to 17
In terms of disability age 5 to 17, the demographic groups most similar to Immigrants from Czechoslovakia are Immigrants from Vietnam (5.2%, a difference of 0.020%), Jordanian (5.2%, a difference of 0.050%), Immigrants from Romania (5.2%, a difference of 0.070%), Immigrants from Belgium (5.2%, a difference of 0.090%), and Guyanese (5.2%, a difference of 0.13%).
| Demographics | Rating | Rank | Disability Age 5 to 17 |
| Palestinians | 99.8 /100 | #66 | Exceptional 5.2% |
| Macedonians | 99.8 /100 | #67 | Exceptional 5.2% |
| Immigrants | Syria | 99.7 /100 | #68 | Exceptional 5.2% |
| Guyanese | 99.7 /100 | #69 | Exceptional 5.2% |
| Immigrants | Belgium | 99.7 /100 | #70 | Exceptional 5.2% |
| Jordanians | 99.7 /100 | #71 | Exceptional 5.2% |
| Immigrants | Vietnam | 99.7 /100 | #72 | Exceptional 5.2% |
| Immigrants | Czechoslovakia | 99.7 /100 | #73 | Exceptional 5.2% |
| Immigrants | Romania | 99.7 /100 | #74 | Exceptional 5.2% |
| Immigrants | Moldova | 99.6 /100 | #75 | Exceptional 5.2% |
| Immigrants | Guyana | 99.6 /100 | #76 | Exceptional 5.2% |
| Immigrants | Kazakhstan | 99.6 /100 | #77 | Exceptional 5.2% |
| Immigrants | Cuba | 99.6 /100 | #78 | Exceptional 5.2% |
| Afghans | 99.6 /100 | #79 | Exceptional 5.2% |
| Sri Lankans | 99.6 /100 | #80 | Exceptional 5.2% |