Zip Codes with the Highest Poverty Level Among Children Under the Age of 5 in South Dakota
RELATED REPORTS & OPTIONS
Highest Poverty | Child 0-5
South Dakota
Compare Zip Codes
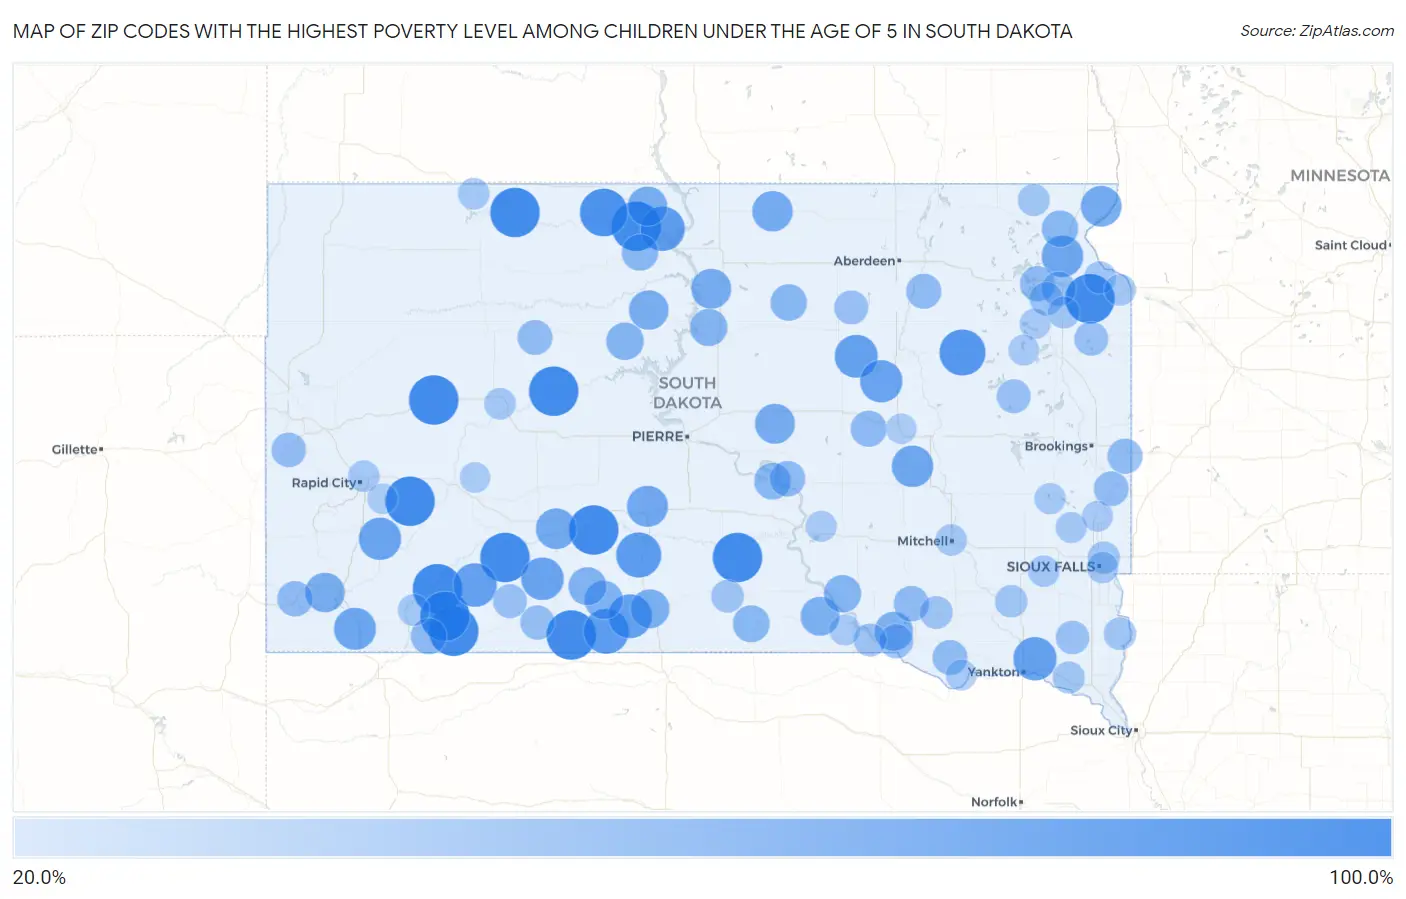
Map of Zip Codes with the Highest Poverty Level Among Children Under the Age of 5 in South Dakota
20.0%
100.0%
Zip Codes with the Highest Poverty Level Among Children Under the Age of 5 in South Dakota
| Zip Code | Child Poverty | vs State | vs National | |
| 1. | 57772 | 100.0% | 17.4%(+82.6)#1 | 18.1%(+81.9)#53 |
| 2. | 57794 | 100.0% | 17.4%(+82.6)#2 | 18.1%(+81.9)#113 |
| 3. | 57756 | 100.0% | 17.4%(+82.6)#3 | 18.1%(+81.9)#166 |
| 4. | 57787 | 100.0% | 17.4%(+82.6)#4 | 18.1%(+81.9)#169 |
| 5. | 57639 | 100.0% | 17.4%(+82.6)#5 | 18.1%(+81.9)#305 |
| 6. | 57622 | 100.0% | 17.4%(+82.6)#6 | 18.1%(+81.9)#346 |
| 7. | 57725 | 100.0% | 17.4%(+82.6)#7 | 18.1%(+81.9)#370 |
| 8. | 57521 | 100.0% | 17.4%(+82.6)#8 | 18.1%(+81.9)#411 |
| 9. | 57750 | 100.0% | 17.4%(+82.6)#9 | 18.1%(+81.9)#419 |
| 10. | 57541 | 100.0% | 17.4%(+82.6)#10 | 18.1%(+81.9)#421 |
| 11. | 57269 | 100.0% | 17.4%(+82.6)#11 | 18.1%(+81.9)#437 |
| 12. | 57634 | 100.0% | 17.4%(+82.6)#12 | 18.1%(+81.9)#458 |
| 13. | 57574 | 100.0% | 17.4%(+82.6)#13 | 18.1%(+81.9)#503 |
| 14. | 57621 | 92.5% | 17.4%(+75.1)#14 | 18.1%(+74.4)#608 |
| 15. | 57258 | 85.3% | 17.4%(+67.9)#15 | 18.1%(+67.2)#700 |
| 16. | 57572 | 81.6% | 17.4%(+64.2)#16 | 18.1%(+63.6)#776 |
| 17. | 57579 | 81.4% | 17.4%(+64.0)#17 | 18.1%(+63.4)#780 |
| 18. | 57658 | 79.3% | 17.4%(+61.9)#18 | 18.1%(+61.2)#836 |
| 19. | 57570 | 76.3% | 17.4%(+58.9)#19 | 18.1%(+58.3)#916 |
| 20. | 57752 | 75.2% | 17.4%(+57.8)#20 | 18.1%(+57.1)#948 |
| 21. | 57046 | 73.7% | 17.4%(+56.2)#21 | 18.1%(+55.6)#1,021 |
| 22. | 57470 | 72.7% | 17.4%(+55.3)#22 | 18.1%(+54.7)#1,059 |
| 23. | 57577 | 70.7% | 17.4%(+53.3)#23 | 18.1%(+52.7)#1,125 |
| 24. | 57476 | 70.0% | 17.4%(+52.6)#24 | 18.1%(+51.9)#1,147 |
| 25. | 57744 | 69.6% | 17.4%(+52.2)#25 | 18.1%(+51.6)#1,164 |
| 26. | 57763 | 68.4% | 17.4%(+51.0)#26 | 18.1%(+50.4)#1,215 |
| 27. | 57312 | 66.7% | 17.4%(+49.2)#27 | 18.1%(+48.6)#1,287 |
| 28. | 57257 | 66.7% | 17.4%(+49.2)#28 | 18.1%(+48.6)#1,290 |
| 29. | 57559 | 64.5% | 17.4%(+47.1)#29 | 18.1%(+46.5)#1,410 |
| 30. | 57543 | 63.1% | 17.4%(+45.7)#30 | 18.1%(+45.0)#1,499 |
| 31. | 57260 | 62.7% | 17.4%(+45.3)#31 | 18.1%(+44.7)#1,510 |
| 32. | 57437 | 61.9% | 17.4%(+44.5)#32 | 18.1%(+43.8)#1,562 |
| 33. | 57420 | 60.0% | 17.4%(+42.6)#33 | 18.1%(+41.9)#1,702 |
| 34. | 57540 | 60.0% | 17.4%(+42.6)#34 | 18.1%(+41.9)#1,704 |
| 35. | 57652 | 58.3% | 17.4%(+40.9)#35 | 18.1%(+40.3)#1,807 |
| 36. | 57747 | 58.1% | 17.4%(+40.6)#36 | 18.1%(+40.0)#1,822 |
| 37. | 57642 | 58.0% | 17.4%(+40.6)#37 | 18.1%(+40.0)#1,824 |
| 38. | 57523 | 55.6% | 17.4%(+38.1)#38 | 18.1%(+37.5)#2,028 |
| 39. | 57555 | 55.5% | 17.4%(+38.0)#39 | 18.1%(+37.4)#2,045 |
| 40. | 57356 | 54.4% | 17.4%(+36.9)#40 | 18.1%(+36.3)#2,114 |
| 41. | 57566 | 53.3% | 17.4%(+35.9)#41 | 18.1%(+35.3)#2,218 |
| 42. | 57560 | 51.9% | 17.4%(+34.4)#42 | 18.1%(+33.8)#2,356 |
| 43. | 57625 | 49.9% | 17.4%(+32.4)#43 | 18.1%(+31.8)#2,621 |
| 44. | 57369 | 49.4% | 17.4%(+31.9)#44 | 18.1%(+31.3)#2,654 |
| 45. | 57442 | 48.6% | 17.4%(+31.1)#45 | 18.1%(+30.5)#2,744 |
| 46. | 57528 | 46.8% | 17.4%(+29.4)#46 | 18.1%(+28.7)#2,945 |
| 47. | 57548 | 46.2% | 17.4%(+28.8)#47 | 18.1%(+28.1)#3,020 |
| 48. | 57466 | 46.2% | 17.4%(+28.7)#48 | 18.1%(+28.1)#3,036 |
| 49. | 57657 | 45.5% | 17.4%(+28.0)#49 | 18.1%(+27.4)#3,124 |
| 50. | 57262 | 45.4% | 17.4%(+27.9)#50 | 18.1%(+27.3)#3,131 |
| 51. | 57381 | 43.8% | 17.4%(+26.3)#51 | 18.1%(+25.7)#3,381 |
| 52. | 57770 | 43.1% | 17.4%(+25.7)#52 | 18.1%(+25.1)#3,458 |
| 53. | 57339 | 41.9% | 17.4%(+24.5)#53 | 18.1%(+23.9)#3,672 |
| 54. | 57735 | 41.6% | 17.4%(+24.1)#54 | 18.1%(+23.5)#3,738 |
| 55. | 57313 | 41.3% | 17.4%(+23.9)#55 | 18.1%(+23.2)#3,781 |
| 56. | 57273 | 40.4% | 17.4%(+22.9)#56 | 18.1%(+22.3)#3,948 |
| 57. | 57026 | 40.3% | 17.4%(+22.8)#57 | 18.1%(+22.2)#3,967 |
| 58. | 57474 | 40.0% | 17.4%(+22.6)#58 | 18.1%(+21.9)#4,035 |
| 59. | 57315 | 39.3% | 17.4%(+21.9)#59 | 18.1%(+21.3)#4,143 |
| 60. | 57623 | 39.3% | 17.4%(+21.9)#60 | 18.1%(+21.3)#4,144 |
| 61. | 57028 | 38.5% | 17.4%(+21.0)#61 | 18.1%(+20.4)#4,309 |
| 62. | 57754 | 37.7% | 17.4%(+20.3)#62 | 18.1%(+19.6)#4,459 |
| 63. | 57551 | 37.2% | 17.4%(+19.7)#63 | 18.1%(+19.1)#4,560 |
| 64. | 57266 | 36.5% | 17.4%(+19.1)#64 | 18.1%(+18.4)#4,704 |
| 65. | 57367 | 35.7% | 17.4%(+18.3)#65 | 18.1%(+17.7)#4,897 |
| 66. | 57221 | 35.3% | 17.4%(+17.9)#66 | 18.1%(+17.2)#5,005 |
| 67. | 57435 | 35.0% | 17.4%(+17.6)#67 | 18.1%(+16.9)#5,074 |
| 68. | 57265 | 35.0% | 17.4%(+17.6)#68 | 18.1%(+16.9)#5,075 |
| 69. | 57714 | 34.9% | 17.4%(+17.4)#69 | 18.1%(+16.8)#5,097 |
| 70. | 57014 | 33.3% | 17.4%(+15.9)#70 | 18.1%(+15.3)#5,451 |
| 71. | 57256 | 33.3% | 17.4%(+15.9)#71 | 18.1%(+15.3)#5,525 |
| 72. | 57330 | 31.0% | 17.4%(+13.5)#72 | 18.1%(+12.9)#6,108 |
| 73. | 57335 | 30.8% | 17.4%(+13.3)#73 | 18.1%(+12.7)#6,158 |
| 74. | 57580 | 29.7% | 17.4%(+12.3)#74 | 18.1%(+11.7)#6,432 |
| 75. | 57029 | 29.2% | 17.4%(+11.8)#75 | 18.1%(+11.2)#6,585 |
| 76. | 57034 | 29.2% | 17.4%(+11.7)#76 | 18.1%(+11.1)#6,608 |
| 77. | 57227 | 28.3% | 17.4%(+10.9)#77 | 18.1%(+10.2)#6,885 |
| 78. | 57104 | 27.9% | 17.4%(+10.4)#78 | 18.1%(+9.81)#6,998 |
| 79. | 57069 | 27.7% | 17.4%(+10.2)#79 | 18.1%(+9.62)#7,061 |
| 80. | 57263 | 27.6% | 17.4%(+10.1)#80 | 18.1%(+9.52)#7,111 |
| 81. | 57270 | 26.8% | 17.4%(+9.32)#81 | 18.1%(+8.70)#7,384 |
| 82. | 57764 | 26.0% | 17.4%(+8.57)#82 | 18.1%(+7.95)#7,637 |
| 83. | 57748 | 25.9% | 17.4%(+8.48)#83 | 18.1%(+7.86)#7,670 |
| 84. | 57701 | 25.7% | 17.4%(+8.23)#84 | 18.1%(+7.61)#7,744 |
| 85. | 57216 | 25.4% | 17.4%(+7.96)#85 | 18.1%(+7.33)#7,852 |
| 86. | 57638 | 25.4% | 17.4%(+7.93)#86 | 18.1%(+7.31)#7,859 |
| 87. | 57047 | 25.0% | 17.4%(+7.56)#87 | 18.1%(+6.94)#8,033 |
| 88. | 57103 | 25.0% | 17.4%(+7.54)#88 | 18.1%(+6.92)#8,046 |
| 89. | 57301 | 24.9% | 17.4%(+7.49)#89 | 18.1%(+6.87)#8,053 |
| 90. | 57042 | 23.9% | 17.4%(+6.49)#90 | 18.1%(+5.87)#8,375 |
| 91. | 57018 | 23.9% | 17.4%(+6.44)#91 | 18.1%(+5.82)#8,406 |
| 92. | 57317 | 22.9% | 17.4%(+5.42)#92 | 18.1%(+4.79)#8,816 |
| 93. | 57062 | 22.7% | 17.4%(+5.29)#93 | 18.1%(+4.66)#8,869 |
| 94. | 57370 | 22.7% | 17.4%(+5.29)#94 | 18.1%(+4.66)#8,874 |
| 95. | 57022 | 22.7% | 17.4%(+5.27)#95 | 18.1%(+4.65)#8,878 |
| 96. | 57235 | 22.2% | 17.4%(+4.78)#96 | 18.1%(+4.16)#9,089 |
| 97. | 57243 | 22.2% | 17.4%(+4.78)#97 | 18.1%(+4.16)#9,096 |
| 98. | 57790 | 21.5% | 17.4%(+4.10)#98 | 18.1%(+3.48)#9,370 |
| 99. | 57703 | 21.4% | 17.4%(+3.93)#99 | 18.1%(+3.31)#9,447 |
| 100. | 57384 | 20.8% | 17.4%(+3.34)#100 | 18.1%(+2.72)#9,690 |
Common Questions
What are the Top 10 Zip Codes with the Highest Poverty Level Among Children Under the Age of 5 in South Dakota?
Top 10 Zip Codes with the Highest Poverty Level Among Children Under the Age of 5 in South Dakota are:
What zip code has the Highest Poverty Level Among Children Under the Age of 5 in South Dakota?
57772 has the Highest Poverty Level Among Children Under the Age of 5 in South Dakota with 100.0%.
What is the Poverty Level Among Children Under the Age of 5 in the State of South Dakota?
Poverty Level Among Children Under the Age of 5 in South Dakota is 17.4%.
What is the Poverty Level Among Children Under the Age of 5 in the United States?
Poverty Level Among Children Under the Age of 5 in the United States is 18.1%.