Zip Codes with the Highest Poverty Level Among Children Under the Age of 5 in South Carolina
RELATED REPORTS & OPTIONS
Highest Poverty | Child 0-5
South Carolina
Compare Zip Codes
Map of Zip Codes with the Highest Poverty Level Among Children Under the Age of 5 in South Carolina
30.0%
100.0%
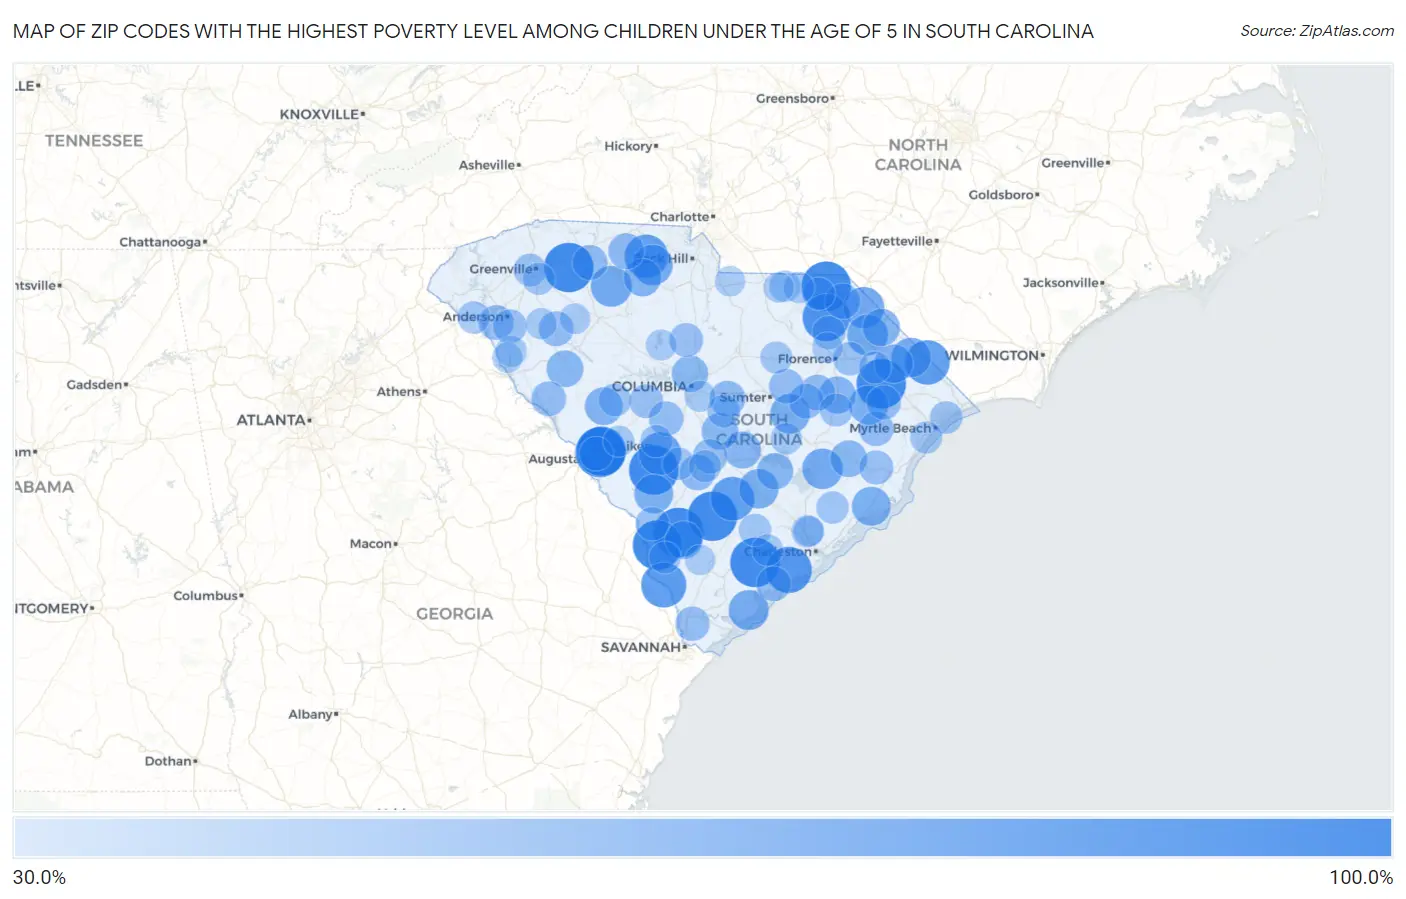
Zip Codes with the Highest Poverty Level Among Children Under the Age of 5 in South Carolina
| Zip Code | Child Poverty | vs State | vs National | |
| 1. | 29596 | 100.0% | 22.4%(+77.6)#1 | 18.1%(+81.9)#30 |
| 2. | 29911 | 100.0% | 22.4%(+77.6)#2 | 18.1%(+81.9)#45 |
| 3. | 29834 | 100.0% | 22.4%(+77.6)#3 | 18.1%(+81.9)#120 |
| 4. | 29828 | 100.0% | 22.4%(+77.6)#4 | 18.1%(+81.9)#172 |
| 5. | 29932 | 100.0% | 22.4%(+77.6)#5 | 18.1%(+81.9)#344 |
| 6. | 29519 | 100.0% | 22.4%(+77.6)#6 | 18.1%(+81.9)#348 |
| 7. | 29452 | 100.0% | 22.4%(+77.6)#7 | 18.1%(+81.9)#369 |
| 8. | 29493 | 100.0% | 22.4%(+77.6)#8 | 18.1%(+81.9)#384 |
| 9. | 29826 | 100.0% | 22.4%(+77.6)#9 | 18.1%(+81.9)#393 |
| 10. | 29375 | 100.0% | 22.4%(+77.6)#10 | 18.1%(+81.9)#465 |
| 11. | 29593 | 92.4% | 22.4%(+70.0)#11 | 18.1%(+74.3)#609 |
| 12. | 29487 | 88.8% | 22.4%(+66.4)#12 | 18.1%(+70.7)#649 |
| 13. | 29922 | 85.1% | 22.4%(+62.8)#13 | 18.1%(+67.1)#708 |
| 14. | 29545 | 82.7% | 22.4%(+60.4)#14 | 18.1%(+64.7)#752 |
| 15. | 29471 | 80.5% | 22.4%(+58.1)#15 | 18.1%(+62.4)#800 |
| 16. | 29717 | 79.2% | 22.4%(+56.8)#16 | 18.1%(+61.1)#842 |
| 17. | 29146 | 77.0% | 22.4%(+54.6)#17 | 18.1%(+58.9)#897 |
| 18. | 29525 | 71.2% | 22.4%(+48.8)#18 | 18.1%(+53.1)#1,108 |
| 19. | 29321 | 70.9% | 22.4%(+48.5)#19 | 18.1%(+52.8)#1,118 |
| 20. | 29565 | 70.5% | 22.4%(+48.1)#20 | 18.1%(+52.4)#1,134 |
| 21. | 29479 | 69.6% | 22.4%(+47.2)#21 | 18.1%(+51.5)#1,166 |
| 22. | 29742 | 69.6% | 22.4%(+47.2)#22 | 18.1%(+51.5)#1,168 |
| 23. | 29920 | 67.9% | 22.4%(+45.6)#23 | 18.1%(+49.9)#1,229 |
| 24. | 29001 | 66.5% | 22.4%(+44.1)#24 | 18.1%(+48.4)#1,322 |
| 25. | 29581 | 66.5% | 22.4%(+44.1)#25 | 18.1%(+48.4)#1,324 |
| 26. | 29448 | 66.0% | 22.4%(+43.6)#26 | 18.1%(+47.9)#1,341 |
| 27. | 29555 | 64.9% | 22.4%(+42.6)#27 | 18.1%(+46.9)#1,384 |
| 28. | 29812 | 64.4% | 22.4%(+42.0)#28 | 18.1%(+46.4)#1,415 |
| 29. | 29458 | 64.0% | 22.4%(+41.6)#29 | 18.1%(+45.9)#1,449 |
| 30. | 29574 | 63.2% | 22.4%(+40.8)#30 | 18.1%(+45.1)#1,489 |
| 31. | 29832 | 60.4% | 22.4%(+38.1)#31 | 18.1%(+42.4)#1,651 |
| 32. | 29924 | 60.1% | 22.4%(+37.7)#32 | 18.1%(+42.0)#1,666 |
| 33. | 29364 | 60.0% | 22.4%(+37.6)#33 | 18.1%(+41.9)#1,688 |
| 34. | 29536 | 59.3% | 22.4%(+37.0)#34 | 18.1%(+41.3)#1,738 |
| 35. | 29047 | 57.9% | 22.4%(+35.5)#35 | 18.1%(+39.8)#1,838 |
| 36. | 29591 | 57.4% | 22.4%(+35.1)#36 | 18.1%(+39.4)#1,868 |
| 37. | 29510 | 57.0% | 22.4%(+34.6)#37 | 18.1%(+38.9)#1,912 |
| 38. | 29646 | 56.8% | 22.4%(+34.4)#38 | 18.1%(+38.7)#1,926 |
| 39. | 29135 | 56.6% | 22.4%(+34.2)#39 | 18.1%(+38.5)#1,938 |
| 40. | 29203 | 56.2% | 22.4%(+33.9)#40 | 18.1%(+38.2)#1,972 |
| 41. | 29048 | 55.8% | 22.4%(+33.4)#41 | 18.1%(+37.8)#2,002 |
| 42. | 29340 | 54.1% | 22.4%(+31.7)#42 | 18.1%(+36.0)#2,136 |
| 43. | 29044 | 53.8% | 22.4%(+31.5)#43 | 18.1%(+35.8)#2,154 |
| 44. | 29114 | 53.1% | 22.4%(+30.8)#44 | 18.1%(+35.1)#2,239 |
| 45. | 29038 | 53.0% | 22.4%(+30.7)#45 | 18.1%(+35.0)#2,244 |
| 46. | 29512 | 52.9% | 22.4%(+30.6)#46 | 18.1%(+34.9)#2,256 |
| 47. | 29306 | 51.0% | 22.4%(+28.6)#47 | 18.1%(+32.9)#2,426 |
| 48. | 29692 | 50.5% | 22.4%(+28.1)#48 | 18.1%(+32.4)#2,483 |
| 49. | 29835 | 50.3% | 22.4%(+28.0)#49 | 18.1%(+32.3)#2,492 |
| 50. | 29162 | 50.3% | 22.4%(+28.0)#50 | 18.1%(+32.3)#2,493 |
| 51. | 29554 | 50.3% | 22.4%(+27.9)#51 | 18.1%(+32.2)#2,497 |
| 52. | 29626 | 50.1% | 22.4%(+27.7)#52 | 18.1%(+32.0)#2,514 |
| 53. | 29438 | 50.0% | 22.4%(+27.6)#53 | 18.1%(+31.9)#2,526 |
| 54. | 29104 | 50.0% | 22.4%(+27.6)#54 | 18.1%(+31.9)#2,538 |
| 55. | 29123 | 49.6% | 22.4%(+27.3)#55 | 18.1%(+31.6)#2,634 |
| 56. | 29115 | 49.0% | 22.4%(+26.6)#56 | 18.1%(+30.9)#2,693 |
| 57. | 29546 | 48.8% | 22.4%(+26.4)#57 | 18.1%(+30.7)#2,721 |
| 58. | 29927 | 48.7% | 22.4%(+26.3)#58 | 18.1%(+30.6)#2,737 |
| 59. | 29816 | 47.7% | 22.4%(+25.3)#59 | 18.1%(+29.6)#2,848 |
| 60. | 29440 | 47.6% | 22.4%(+25.3)#60 | 18.1%(+29.6)#2,853 |
| 61. | 29180 | 47.5% | 22.4%(+25.2)#61 | 18.1%(+29.5)#2,865 |
| 62. | 29624 | 47.2% | 22.4%(+24.8)#62 | 18.1%(+29.1)#2,904 |
| 63. | 29070 | 47.1% | 22.4%(+24.7)#63 | 18.1%(+29.0)#2,910 |
| 64. | 29506 | 46.6% | 22.4%(+24.2)#64 | 18.1%(+28.5)#2,972 |
| 65. | 29810 | 46.5% | 22.4%(+24.2)#65 | 18.1%(+28.5)#2,976 |
| 66. | 29540 | 44.7% | 22.4%(+22.3)#66 | 18.1%(+26.6)#3,219 |
| 67. | 29560 | 44.3% | 22.4%(+22.0)#67 | 18.1%(+26.3)#3,292 |
| 68. | 29052 | 43.9% | 22.4%(+21.5)#68 | 18.1%(+25.8)#3,357 |
| 69. | 29166 | 43.5% | 22.4%(+21.1)#69 | 18.1%(+25.4)#3,417 |
| 70. | 29611 | 43.4% | 22.4%(+21.0)#70 | 18.1%(+25.3)#3,429 |
| 71. | 29572 | 43.3% | 22.4%(+20.9)#71 | 18.1%(+25.2)#3,440 |
| 72. | 29520 | 43.0% | 22.4%(+20.6)#72 | 18.1%(+24.9)#3,484 |
| 73. | 29435 | 42.9% | 22.4%(+20.5)#73 | 18.1%(+24.8)#3,501 |
| 74. | 29113 | 42.7% | 22.4%(+20.4)#74 | 18.1%(+24.7)#3,530 |
| 75. | 29137 | 42.6% | 22.4%(+20.3)#75 | 18.1%(+24.6)#3,543 |
| 76. | 29450 | 42.6% | 22.4%(+20.2)#76 | 18.1%(+24.5)#3,559 |
| 77. | 29643 | 42.4% | 22.4%(+20.0)#77 | 18.1%(+24.3)#3,593 |
| 78. | 29406 | 42.4% | 22.4%(+20.0)#78 | 18.1%(+24.3)#3,601 |
| 79. | 29571 | 42.0% | 22.4%(+19.6)#79 | 18.1%(+23.9)#3,662 |
| 80. | 29605 | 41.7% | 22.4%(+19.3)#80 | 18.1%(+23.6)#3,707 |
| 81. | 29575 | 41.6% | 22.4%(+19.2)#81 | 18.1%(+23.5)#3,736 |
| 82. | 29039 | 41.5% | 22.4%(+19.1)#82 | 18.1%(+23.4)#3,744 |
| 83. | 29918 | 41.2% | 22.4%(+18.8)#83 | 18.1%(+23.1)#3,798 |
| 84. | 29010 | 41.1% | 22.4%(+18.7)#84 | 18.1%(+23.0)#3,819 |
| 85. | 29426 | 39.4% | 22.4%(+17.0)#85 | 18.1%(+21.3)#4,134 |
| 86. | 29102 | 39.3% | 22.4%(+16.9)#86 | 18.1%(+21.2)#4,160 |
| 87. | 29741 | 38.9% | 22.4%(+16.5)#87 | 18.1%(+20.8)#4,229 |
| 88. | 29709 | 38.5% | 22.4%(+16.2)#88 | 18.1%(+20.5)#4,296 |
| 89. | 29654 | 38.3% | 22.4%(+16.0)#89 | 18.1%(+20.3)#4,339 |
| 90. | 29801 | 38.3% | 22.4%(+15.9)#90 | 18.1%(+20.2)#4,344 |
| 91. | 29209 | 38.0% | 22.4%(+15.6)#91 | 18.1%(+19.9)#4,417 |
| 92. | 29655 | 37.9% | 22.4%(+15.6)#92 | 18.1%(+19.9)#4,423 |
| 93. | 29065 | 37.5% | 22.4%(+15.1)#93 | 18.1%(+19.4)#4,495 |
| 94. | 29360 | 36.8% | 22.4%(+14.5)#94 | 18.1%(+18.8)#4,622 |
| 95. | 29532 | 36.7% | 22.4%(+14.3)#95 | 18.1%(+18.6)#4,660 |
| 96. | 29659 | 36.4% | 22.4%(+14.0)#96 | 18.1%(+18.3)#4,746 |
| 97. | 29410 | 36.3% | 22.4%(+13.9)#97 | 18.1%(+18.3)#4,753 |
| 98. | 29916 | 36.0% | 22.4%(+13.6)#98 | 18.1%(+17.9)#4,824 |
| 99. | 29720 | 35.9% | 22.4%(+13.5)#99 | 18.1%(+17.9)#4,842 |
| 100. | 29727 | 35.8% | 22.4%(+13.5)#100 | 18.1%(+17.8)#4,859 |
Common Questions
What are the Top 10 Zip Codes with the Highest Poverty Level Among Children Under the Age of 5 in South Carolina?
Top 10 Zip Codes with the Highest Poverty Level Among Children Under the Age of 5 in South Carolina are:
What zip code has the Highest Poverty Level Among Children Under the Age of 5 in South Carolina?
29596 has the Highest Poverty Level Among Children Under the Age of 5 in South Carolina with 100.0%.
What is the Poverty Level Among Children Under the Age of 5 in the State of South Carolina?
Poverty Level Among Children Under the Age of 5 in South Carolina is 22.4%.
What is the Poverty Level Among Children Under the Age of 5 in the United States?
Poverty Level Among Children Under the Age of 5 in the United States is 18.1%.