Zip Codes with the Highest Poverty Level Among Children Under the Age of 5 in Idaho
RELATED REPORTS & OPTIONS
Highest Poverty | Child 0-5
Idaho
Compare Zip Codes
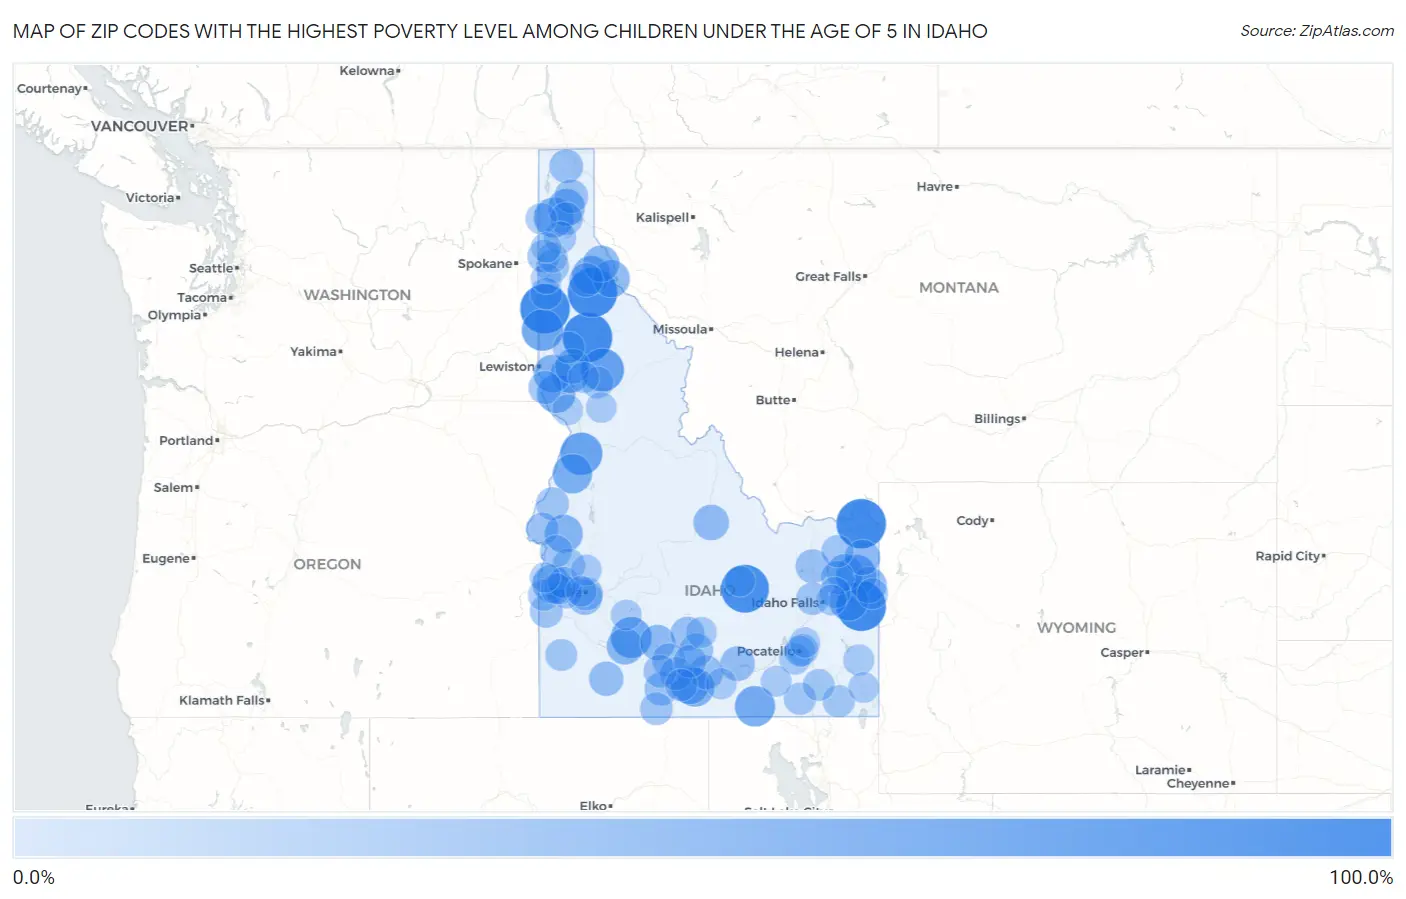
Map of Zip Codes with the Highest Poverty Level Among Children Under the Age of 5 in Idaho
0.0%
100.0%
Zip Codes with the Highest Poverty Level Among Children Under the Age of 5 in Idaho
| Zip Code | Child Poverty | vs State | vs National | |
| 1. | 83429 | 100.0% | 15.8%(+84.2)#1 | 18.1%(+81.9)#180 |
| 2. | 83824 | 100.0% | 15.8%(+84.2)#2 | 18.1%(+81.9)#278 |
| 3. | 83449 | 100.0% | 15.8%(+84.2)#3 | 18.1%(+81.9)#388 |
| 4. | 83827 | 100.0% | 15.8%(+84.2)#4 | 18.1%(+81.9)#415 |
| 5. | 83808 | 100.0% | 15.8%(+84.2)#5 | 18.1%(+81.9)#474 |
| 6. | 83213 | 92.5% | 15.8%(+76.7)#6 | 18.1%(+74.4)#607 |
| 7. | 83553 | 70.5% | 15.8%(+54.7)#7 | 18.1%(+52.4)#1,133 |
| 8. | 83549 | 66.7% | 15.8%(+50.9)#8 | 18.1%(+48.6)#1,288 |
| 9. | 83872 | 63.2% | 15.8%(+47.4)#9 | 18.1%(+45.1)#1,492 |
| 10. | 83623 | 60.7% | 15.8%(+44.9)#10 | 18.1%(+42.6)#1,644 |
| 11. | 83342 | 58.0% | 15.8%(+42.2)#11 | 18.1%(+39.9)#1,832 |
| 12. | 83436 | 57.1% | 15.8%(+41.3)#12 | 18.1%(+39.1)#1,890 |
| 13. | 83841 | 55.6% | 15.8%(+39.8)#13 | 18.1%(+37.5)#2,034 |
| 14. | 83654 | 53.4% | 15.8%(+37.7)#14 | 18.1%(+35.4)#2,196 |
| 15. | 83443 | 51.9% | 15.8%(+36.1)#15 | 18.1%(+33.9)#2,346 |
| 16. | 83334 | 50.0% | 15.8%(+34.2)#16 | 18.1%(+31.9)#2,528 |
| 17. | 83555 | 50.0% | 15.8%(+34.2)#17 | 18.1%(+31.9)#2,575 |
| 18. | 83548 | 50.0% | 15.8%(+34.2)#18 | 18.1%(+31.9)#2,608 |
| 19. | 83341 | 49.2% | 15.8%(+33.4)#19 | 18.1%(+31.2)#2,664 |
| 20. | 83837 | 48.3% | 15.8%(+32.5)#20 | 18.1%(+30.3)#2,778 |
| 21. | 83645 | 47.1% | 15.8%(+31.3)#21 | 18.1%(+29.0)#2,917 |
| 22. | 83540 | 46.9% | 15.8%(+31.1)#22 | 18.1%(+28.8)#2,935 |
| 23. | 83656 | 46.2% | 15.8%(+30.4)#23 | 18.1%(+28.1)#3,032 |
| 24. | 83846 | 43.5% | 15.8%(+27.8)#24 | 18.1%(+25.5)#3,404 |
| 25. | 83852 | 43.5% | 15.8%(+27.7)#25 | 18.1%(+25.5)#3,408 |
| 26. | 83451 | 41.3% | 15.8%(+25.5)#26 | 18.1%(+23.3)#3,778 |
| 27. | 83627 | 40.9% | 15.8%(+25.1)#27 | 18.1%(+22.8)#3,854 |
| 28. | 83873 | 40.8% | 15.8%(+25.0)#28 | 18.1%(+22.7)#3,871 |
| 29. | 83422 | 38.4% | 15.8%(+22.6)#29 | 18.1%(+20.4)#4,323 |
| 30. | 83420 | 36.5% | 15.8%(+20.7)#30 | 18.1%(+18.5)#4,692 |
| 31. | 83226 | 36.5% | 15.8%(+20.7)#31 | 18.1%(+18.4)#4,702 |
| 32. | 83314 | 35.1% | 15.8%(+19.3)#32 | 18.1%(+17.1)#5,036 |
| 33. | 83545 | 33.3% | 15.8%(+17.5)#33 | 18.1%(+15.3)#5,508 |
| 34. | 83350 | 33.0% | 15.8%(+17.2)#34 | 18.1%(+14.9)#5,594 |
| 35. | 83705 | 32.3% | 15.8%(+16.5)#35 | 18.1%(+14.3)#5,761 |
| 36. | 83604 | 30.8% | 15.8%(+15.0)#36 | 18.1%(+12.7)#6,153 |
| 37. | 83335 | 29.8% | 15.8%(+14.0)#37 | 18.1%(+11.8)#6,391 |
| 38. | 83352 | 29.3% | 15.8%(+13.5)#38 | 18.1%(+11.2)#6,576 |
| 39. | 83425 | 29.0% | 15.8%(+13.2)#39 | 18.1%(+11.0)#6,644 |
| 40. | 83850 | 28.9% | 15.8%(+13.1)#40 | 18.1%(+10.9)#6,675 |
| 41. | 83805 | 28.5% | 15.8%(+12.7)#41 | 18.1%(+10.4)#6,818 |
| 42. | 83324 | 28.0% | 15.8%(+12.2)#42 | 18.1%(+9.94)#6,964 |
| 43. | 83864 | 27.9% | 15.8%(+12.1)#43 | 18.1%(+9.83)#6,994 |
| 44. | 83321 | 27.7% | 15.8%(+11.9)#44 | 18.1%(+9.60)#7,073 |
| 45. | 83440 | 27.1% | 15.8%(+11.3)#45 | 18.1%(+9.03)#7,283 |
| 46. | 83706 | 26.7% | 15.8%(+10.9)#46 | 18.1%(+8.63)#7,400 |
| 47. | 83355 | 26.3% | 15.8%(+10.5)#47 | 18.1%(+8.27)#7,527 |
| 48. | 83501 | 25.9% | 15.8%(+10.1)#48 | 18.1%(+7.88)#7,658 |
| 49. | 83814 | 25.5% | 15.8%(+9.66)#49 | 18.1%(+7.39)#7,835 |
| 50. | 83328 | 25.3% | 15.8%(+9.45)#50 | 18.1%(+7.19)#7,902 |
| 51. | 83639 | 24.3% | 15.8%(+8.46)#51 | 18.1%(+6.20)#8,261 |
| 52. | 83610 | 24.2% | 15.8%(+8.44)#52 | 18.1%(+6.18)#8,267 |
| 53. | 83316 | 24.2% | 15.8%(+8.41)#53 | 18.1%(+6.15)#8,278 |
| 54. | 83617 | 24.2% | 15.8%(+8.39)#54 | 18.1%(+6.12)#8,281 |
| 55. | 83338 | 24.1% | 15.8%(+8.34)#55 | 18.1%(+6.08)#8,293 |
| 56. | 83302 | 24.0% | 15.8%(+8.20)#56 | 18.1%(+5.94)#8,353 |
| 57. | 83860 | 23.9% | 15.8%(+8.13)#57 | 18.1%(+5.87)#8,376 |
| 58. | 83854 | 23.9% | 15.8%(+8.11)#58 | 18.1%(+5.84)#8,392 |
| 59. | 83672 | 23.1% | 15.8%(+7.35)#59 | 18.1%(+5.08)#8,713 |
| 60. | 83402 | 23.0% | 15.8%(+7.20)#60 | 18.1%(+4.94)#8,768 |
| 61. | 83801 | 22.2% | 15.8%(+6.42)#61 | 18.1%(+4.16)#9,075 |
| 62. | 83445 | 21.7% | 15.8%(+5.93)#62 | 18.1%(+3.66)#9,303 |
| 63. | 83252 | 21.7% | 15.8%(+5.88)#63 | 18.1%(+3.62)#9,320 |
| 64. | 83301 | 21.6% | 15.8%(+5.81)#64 | 18.1%(+3.55)#9,345 |
| 65. | 83661 | 21.4% | 15.8%(+5.64)#65 | 18.1%(+3.37)#9,407 |
| 66. | 83263 | 21.0% | 15.8%(+5.23)#66 | 18.1%(+2.97)#9,586 |
| 67. | 83650 | 20.0% | 15.8%(+4.20)#67 | 18.1%(+1.94)#10,058 |
| 68. | 83687 | 19.8% | 15.8%(+4.01)#68 | 18.1%(+1.75)#10,130 |
| 69. | 83201 | 19.8% | 15.8%(+4.00)#69 | 18.1%(+1.74)#10,134 |
| 70. | 83234 | 19.5% | 15.8%(+3.71)#70 | 18.1%(+1.45)#10,260 |
| 71. | 83851 | 19.4% | 15.8%(+3.65)#71 | 18.1%(+1.38)#10,290 |
| 72. | 83536 | 19.4% | 15.8%(+3.60)#72 | 18.1%(+1.33)#10,315 |
| 73. | 83537 | 19.4% | 15.8%(+3.56)#73 | 18.1%(+1.29)#10,335 |
| 74. | 83628 | 19.2% | 15.8%(+3.45)#74 | 18.1%(+1.18)#10,383 |
| 75. | 83204 | 19.0% | 15.8%(+3.22)#75 | 18.1%(+0.958)#10,498 |
| 76. | 83605 | 18.0% | 15.8%(+2.16)#76 | 18.1%(-0.105)#10,974 |
| 77. | 83644 | 17.9% | 15.8%(+2.09)#77 | 18.1%(-0.174)#11,009 |
| 78. | 83822 | 17.8% | 15.8%(+2.01)#78 | 18.1%(-0.255)#11,053 |
| 79. | 83276 | 16.7% | 15.8%(+0.869)#79 | 18.1%(-1.40)#11,540 |
| 80. | 83455 | 16.6% | 15.8%(+0.757)#80 | 18.1%(-1.51)#11,615 |
| 81. | 83209 | 16.4% | 15.8%(+0.595)#81 | 18.1%(-1.67)#11,697 |
| 82. | 83543 | 16.2% | 15.8%(+0.418)#82 | 18.1%(-1.85)#11,805 |
| 83. | 83442 | 16.1% | 15.8%(+0.304)#83 | 18.1%(-1.96)#11,853 |
| 84. | 83349 | 16.1% | 15.8%(+0.273)#84 | 18.1%(-1.99)#11,876 |
| 85. | 83318 | 15.8% | 15.8%(-0.029)#85 | 18.1%(-2.29)#12,044 |
| 86. | 83629 | 15.6% | 15.8%(-0.224)#86 | 18.1%(-2.49)#12,144 |
| 87. | 83607 | 15.5% | 15.8%(-0.331)#87 | 18.1%(-2.60)#12,184 |
| 88. | 83522 | 15.1% | 15.8%(-0.744)#88 | 18.1%(-3.01)#12,431 |
| 89. | 83647 | 15.0% | 15.8%(-0.773)#89 | 18.1%(-3.04)#12,445 |
| 90. | 83271 | 15.0% | 15.8%(-0.798)#90 | 18.1%(-3.06)#12,466 |
| 91. | 83254 | 15.0% | 15.8%(-0.837)#91 | 18.1%(-3.10)#12,485 |
| 92. | 83401 | 14.8% | 15.8%(-0.994)#92 | 18.1%(-3.26)#12,580 |
| 93. | 83530 | 14.6% | 15.8%(-1.16)#93 | 18.1%(-3.43)#12,662 |
| 94. | 83704 | 14.6% | 15.8%(-1.18)#94 | 18.1%(-3.44)#12,671 |
| 95. | 83876 | 14.4% | 15.8%(-1.35)#95 | 18.1%(-3.62)#12,760 |
| 96. | 83815 | 13.7% | 15.8%(-2.10)#96 | 18.1%(-4.37)#13,217 |
| 97. | 83255 | 13.6% | 15.8%(-2.22)#97 | 18.1%(-4.48)#13,283 |
| 98. | 83202 | 13.5% | 15.8%(-2.26)#98 | 18.1%(-4.53)#13,310 |
| 99. | 83660 | 13.3% | 15.8%(-2.46)#99 | 18.1%(-4.73)#13,415 |
| 100. | 83858 | 13.3% | 15.8%(-2.53)#100 | 18.1%(-4.79)#13,476 |
Common Questions
What are the Top 10 Zip Codes with the Highest Poverty Level Among Children Under the Age of 5 in Idaho?
Top 10 Zip Codes with the Highest Poverty Level Among Children Under the Age of 5 in Idaho are:
What zip code has the Highest Poverty Level Among Children Under the Age of 5 in Idaho?
83429 has the Highest Poverty Level Among Children Under the Age of 5 in Idaho with 100.0%.
What is the Poverty Level Among Children Under the Age of 5 in the State of Idaho?
Poverty Level Among Children Under the Age of 5 in Idaho is 15.8%.
What is the Poverty Level Among Children Under the Age of 5 in the United States?
Poverty Level Among Children Under the Age of 5 in the United States is 18.1%.