Zip Codes with the Highest Poverty Level Among Children Under the Age of 5 in Rhode Island

RELATED REPORTS & OPTIONS

Highest Poverty | Child 0-5
Population
Families and Households
Female Fertility
Female Fertility (Unmarried)
Race (Community Size)
Race (Percentage)
Ancestry (Community Size)
AfghanAfricanAlaska NativeAlaskan AthabascanAlbanianAleutAlsatianAmericanApacheArabArapahoArgentineanArmenianAssyrian / Chaldean / SyriacAustralianAustrianBahamianBangladeshiBarbadianBasqueBelgianBelizeanBermudanBhutaneseBlackfeetBolivianBrazilianBritishBritish West IndianBulgarianBurmeseCajunCambodianCanadianCape VerdeanCarpatho RusynCelticCentral AmericanCentral American IndianCherokeeCheyenneChickasawChileanChineseChippewaChoctawColombianColvilleComancheCosta RicanCreeCreekCroatianCrowCubanCypriotCzechCzechoslovakianDanishDelawareDominicanDutchDutch West IndianEastern EuropeanEcuadorianEgyptianEnglishEstonianEthiopianEuropeanFijianFilipinoFinnishFrenchFrench American IndianFrench CanadianGermanGerman RussianGhanaianGreekGuamanian / ChamorroGuatemalanGuyaneseHaitianHmongHonduranHopiHoumaHungarianIcelanderIndian (Asian)IndonesianInupiatIranianIraqiIrishIroquoisIsraeliItalianJamaicanJapaneseJordanianKenyanKiowaKoreanLaotianLatvianLebaneseLiberianLithuanianLumbeeLuxembourgerMacedonianMalaysianMalteseMarshalleseMenomineeMexicanMexican American IndianMongolianMoroccanNative HawaiianNavajoNepaleseNew ZealanderNicaraguanNigerianNorthern EuropeanNorwegianOkinawanOsageOttawaPaiutePakistaniPalestinianPanamanianParaguayanPennsylvania GermanPeruvianPimaPolishPortuguesePotawatomiPuebloPuerto RicanPuget Sound SalishRomanianRussianSalvadoranSamoanScandinavianScotch-IrishScottishSeminoleSenegaleseSerbianShoshoneSierra LeoneanSiouxSlavicSlovakSloveneSomaliSouth AfricanSouth AmericanSouth American IndianSoviet UnionSpaniardSpanishSpanish AmericanSpanish American IndianSri LankanSubsaharan AfricanSudaneseSwedishSwissSyrianTaiwaneseThaiTlingit-HaidaTohono O'OdhamTonganTrinidadian and TobagonianTsimshianTurkishU.S. Virgin IslanderUgandanUkrainianUruguayanUteVenezuelanVietnameseWelshWest IndianYakamaYaquiYugoslavianYumanYup'ikZimbabwean
Ancestry (Percentage)
AfghanAfricanAlaska NativeAlaskan AthabascanAlbanianAleutAlsatianAmericanApacheArabArapahoArgentineanArmenianAssyrian / Chaldean / SyriacAustralianAustrianBahamianBangladeshiBarbadianBasqueBelgianBelizeanBermudanBhutaneseBlackfeetBolivianBrazilianBritishBritish West IndianBulgarianBurmeseCajunCambodianCanadianCape VerdeanCarpatho RusynCelticCentral AmericanCentral American IndianCherokeeCheyenneChickasawChileanChineseChippewaChoctawColombianColvilleComancheCosta RicanCreeCreekCroatianCrowCubanCypriotCzechCzechoslovakianDanishDelawareDominicanDutchDutch West IndianEastern EuropeanEcuadorianEgyptianEnglishEstonianEthiopianEuropeanFijianFilipinoFinnishFrenchFrench American IndianFrench CanadianGermanGerman RussianGhanaianGreekGuamanian / ChamorroGuatemalanGuyaneseHaitianHmongHonduranHopiHoumaHungarianIcelanderIndian (Asian)IndonesianInupiatIranianIraqiIrishIroquoisIsraeliItalianJamaicanJapaneseJordanianKenyanKiowaKoreanLaotianLatvianLebaneseLiberianLithuanianLumbeeLuxembourgerMacedonianMalaysianMalteseMarshalleseMenomineeMexicanMexican American IndianMongolianMoroccanNative HawaiianNavajoNepaleseNew ZealanderNicaraguanNigerianNorthern EuropeanNorwegianOkinawanOsageOttawaPaiutePakistaniPalestinianPanamanianParaguayanPennsylvania GermanPeruvianPimaPolishPortuguesePotawatomiPuebloPuerto RicanPuget Sound SalishRomanianRussianSalvadoranSamoanScandinavianScotch-IrishScottishSeminoleSenegaleseSerbianShoshoneSierra LeoneanSiouxSlavicSlovakSloveneSomaliSouth AfricanSouth AmericanSouth American IndianSoviet UnionSpaniardSpanishSpanish AmericanSpanish American IndianSri LankanSubsaharan AfricanSudaneseSwedishSwissSyrianTaiwaneseThaiTlingit-HaidaTohono O'OdhamTonganTrinidadian and TobagonianTsimshianTurkishU.S. Virgin IslanderUgandanUkrainianUruguayanUteVenezuelanVietnameseWelshWest IndianYakamaYaquiYugoslavianYumanYup'ikZimbabwean
Immigrant Origin (Total)
AfghanistanAfricaAlbaniaArgentinaArmeniaAsiaAustraliaAustriaAzoresBahamasBangladeshBarbadosBelarusBelgiumBelizeBoliviaBosnia and HerzegovinaBrazilBulgariaBurma / MyanmarCabo VerdeCambodiaCameroonCanadaCaribbeanCentral AmericaChileChinaColombiaCongoCosta RicaCroatiaCubaCzechoslovakiaDenmarkDominicaDominican RepublicEastern AfricaEastern AsiaEastern EuropeEcuadorEgyptEl SalvadorEnglandEritreaEthiopiaEuropeFijiFranceGermanyGhanaGreeceGrenadaGuatemalaGuyanaHaitiHondurasHong KongHungaryIndiaIndonesiaIranIraqIrelandIsraelItalyJamaicaJapanJordanKazakhstanKenyaKoreaKuwaitLaosLatin AmericaLatviaLebanonLiberiaLithuaniaMalaysiaMexicoMicronesiaMiddle AfricaMoldovaMoroccoNepalNetherlandsNicaraguaNigeriaNorth MacedoniaNorthern AfricaNorthern EuropeNorwayOceaniaPakistanPanamaPeruPhilippinesPolandPortugalRomaniaRussiaSaudi ArabiaScotlandSenegalSerbiaSierra LeoneSingaporeSomaliaSouth AfricaSouth AmericaSouth Central AsiaSouth Eastern AsiaSouthern EuropeSpainSri LankaSt. Vincent and the GrenadinesSudanSwedenSwitzerlandSyriaTaiwanThailandTrinidad and TobagoTurkeyUgandaUkraineUruguayUzbekistanVenezuelaVietnamWest IndiesWestern AfricaWestern AsiaWestern EuropeYemenZaireZimbabwe
Immigrant Origin (Percentage)
AfghanistanAfricaAlbaniaArgentinaArmeniaAsiaAustraliaAustriaAzoresBahamasBangladeshBarbadosBelarusBelgiumBelizeBoliviaBosnia and HerzegovinaBrazilBulgariaBurma / MyanmarCabo VerdeCambodiaCameroonCanadaCaribbeanCentral AmericaChileChinaColombiaCongoCosta RicaCroatiaCubaCzechoslovakiaDenmarkDominicaDominican RepublicEastern AfricaEastern AsiaEastern EuropeEcuadorEgyptEl SalvadorEnglandEritreaEthiopiaEuropeFijiFranceGermanyGhanaGreeceGrenadaGuatemalaGuyanaHaitiHondurasHong KongHungaryIndiaIndonesiaIranIraqIrelandIsraelItalyJamaicaJapanJordanKazakhstanKenyaKoreaKuwaitLaosLatin AmericaLatviaLebanonLiberiaLithuaniaMalaysiaMexicoMicronesiaMiddle AfricaMoldovaMoroccoNepalNetherlandsNicaraguaNigeriaNorth MacedoniaNorthern AfricaNorthern EuropeNorwayOceaniaPakistanPanamaPeruPhilippinesPolandPortugalRomaniaRussiaSaudi ArabiaScotlandSenegalSerbiaSierra LeoneSingaporeSomaliaSouth AfricaSouth AmericaSouth Central AsiaSouth Eastern AsiaSouthern EuropeSpainSri LankaSt. Vincent and the GrenadinesSudanSwedenSwitzerlandSyriaTaiwanThailandTrinidad and TobagoTurkeyUgandaUkraineUruguayUzbekistanVenezuelaVietnamWest IndiesWestern AfricaWestern AsiaWestern EuropeYemenZaireZimbabwe
Income
Income (Families)
Income (Households)
Poverty
Poverty (Families)
Unemployment
Employment Occupations
Employment Industries
Employer Class
Commute Time
Commute Means
School Enrollment
Education by Degree Field
Occupancy
Finances
Physical Characteristics
Rhode Island
Compare Zip Codes
Comparison Subject

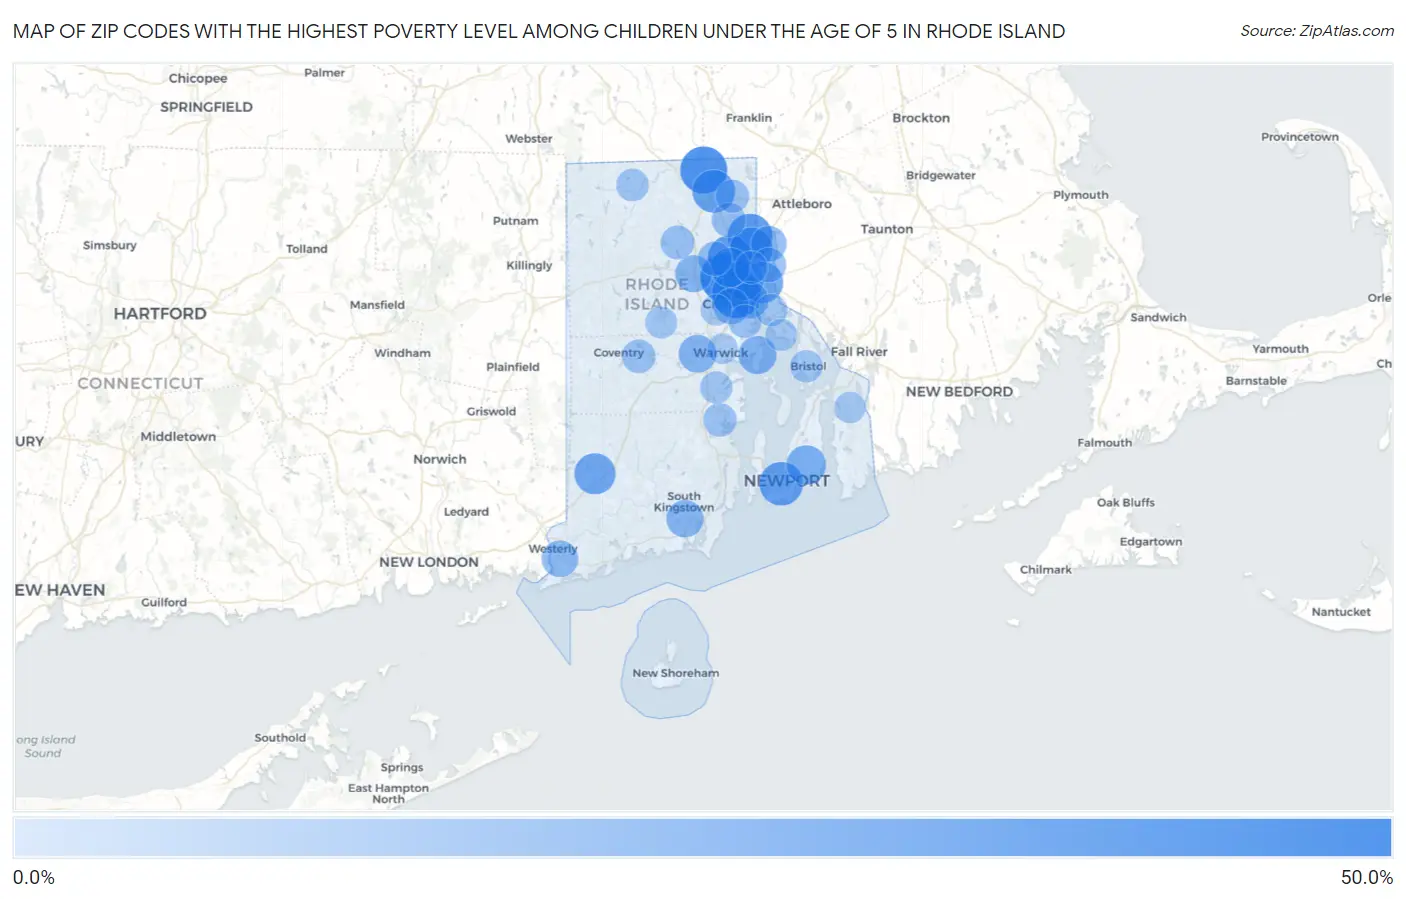
Map of Zip Codes with the Highest Poverty Level Among Children Under the Age of 5 in Rhode Island

0.0%
50.0%
Zip Codes with the Highest Poverty Level Among Children Under the Age of 5 in Rhode Island Map

Zip Codes with the Highest Poverty Level Among Children Under the Age of 5 in Rhode Island

Zip Code Child Poverty vs State vs National
1.0290940.6%15.6%(+25.1)#118.1%(+22.6)#3,905
2.0290739.4%15.6%(+23.8)#218.1%(+21.3)#4,141
3.0289535.5%15.6%(+19.9)#318.1%(+17.4)#4,957
4.0286331.1%15.6%(+15.5)#418.1%(+13.0)#6,059
5.0290429.3%15.6%(+13.8)#518.1%(+11.3)#6,563
6.0284028.1%15.6%(+12.6)#618.1%(+10.1)#6,946
7.0283826.3%15.6%(+10.7)#718.1%(+8.19)#7,565
8.0286025.8%15.6%(+10.3)#818.1%(+7.77)#7,698
9.0291423.2%15.6%(+7.60)#918.1%(+5.09)#8,708
10.0283222.6%15.6%(+7.09)#1018.1%(+4.58)#8,900
11.0290320.9%15.6%(+5.39)#1118.1%(+2.89)#9,620
12.0284219.4%15.6%(+3.80)#1218.1%(+1.29)#10,339
13.0290819.1%15.6%(+3.56)#1318.1%(+1.05)#10,456
14.0288916.2%15.6%(+0.617)#1418.1%(-1.89)#11,824
15.0289315.4%15.6%(-0.176)#1518.1%(-2.68)#12,261
16.0291914.2%15.6%(-1.31)#1618.1%(-3.81)#12,910
17.0287914.2%15.6%(-1.38)#1718.1%(-3.88)#12,941
18.0290513.5%15.6%(-2.10)#1818.1%(-4.61)#13,352
19.0289113.0%15.6%(-2.59)#1918.1%(-5.10)#13,658
20.0291010.9%15.6%(-4.65)#2018.1%(-7.16)#14,894
21.0286110.9%15.6%(-4.67)#2118.1%(-7.18)#14,908
22.029169.1%15.6%(-6.50)#2218.1%(-9.01)#16,023
23.029118.5%15.6%(-7.01)#2318.1%(-9.52)#16,387
24.028657.5%15.6%(-8.01)#2418.1%(-10.5)#17,048
25.028287.3%15.6%(-8.23)#2518.1%(-10.7)#17,173
26.028167.0%15.6%(-8.59)#2618.1%(-11.1)#17,406
27.028526.4%15.6%(-9.17)#2718.1%(-11.7)#17,804
28.028885.9%15.6%(-9.61)#2818.1%(-12.1)#18,104
29.028645.9%15.6%(-9.67)#2918.1%(-12.2)#18,147
30.029065.1%15.6%(-10.5)#3018.1%(-13.0)#18,706
31.028304.7%15.6%(-10.8)#3118.1%(-13.4)#18,965
32.028094.4%15.6%(-11.2)#3218.1%(-13.7)#19,197
33.028184.2%15.6%(-11.4)#3318.1%(-13.9)#19,350
34.029153.8%15.6%(-11.8)#3418.1%(-14.3)#19,678
35.028313.2%15.6%(-12.3)#3518.1%(-14.8)#20,027
36.028063.0%15.6%(-12.6)#3618.1%(-15.1)#20,195
37.028782.2%15.6%(-13.3)#3718.1%(-15.8)#20,678
38.029201.9%15.6%(-13.7)#3818.1%(-16.2)#20,919
39.028860.61%15.6%(-14.9)#3918.1%(-17.4)#21,575

Common Questions

What are the Top 10 Zip Codes with the Highest Poverty Level Among Children Under the Age of 5 in Rhode Island?
Top 10 Zip Codes with the Highest Poverty Level Among Children Under the Age of 5 in Rhode Island are:
#1
40.6%
#2
39.4%
#3
35.5%
#4
31.1%
#5
29.3%
#6
28.1%
#7
26.3%
#8
25.8%
#9
23.2%
#10
22.6%
What zip code has the Highest Poverty Level Among Children Under the Age of 5 in Rhode Island?
02909 has the Highest Poverty Level Among Children Under the Age of 5 in Rhode Island with 40.6%.
What is the Poverty Level Among Children Under the Age of 5 in the State of Rhode Island?
Poverty Level Among Children Under the Age of 5 in Rhode Island is 15.6%.
What is the Poverty Level Among Children Under the Age of 5 in the United States?
Poverty Level Among Children Under the Age of 5 in the United States is 18.1%.