Zip Codes with the Highest Poverty Level Among Children Under the Age of 5 in Wyoming

RELATED REPORTS & OPTIONS

Highest Poverty | Child 0-5
Population
Families and Households
Female Fertility
Female Fertility (Unmarried)
Race (Community Size)
Race (Percentage)
Ancestry (Community Size)
AfghanAfricanAlaska NativeAlaskan AthabascanAlbanianAleutAlsatianAmericanApacheArabArapahoArgentineanArmenianAssyrian / Chaldean / SyriacAustralianAustrianBahamianBangladeshiBarbadianBasqueBelgianBelizeanBermudanBhutaneseBlackfeetBolivianBrazilianBritishBritish West IndianBulgarianBurmeseCajunCambodianCanadianCape VerdeanCarpatho RusynCelticCentral AmericanCentral American IndianCherokeeCheyenneChickasawChileanChineseChippewaChoctawColombianColvilleComancheCosta RicanCreeCreekCroatianCrowCubanCypriotCzechCzechoslovakianDanishDelawareDominicanDutchDutch West IndianEastern EuropeanEcuadorianEgyptianEnglishEstonianEthiopianEuropeanFijianFilipinoFinnishFrenchFrench American IndianFrench CanadianGermanGerman RussianGhanaianGreekGuamanian / ChamorroGuatemalanGuyaneseHaitianHmongHonduranHopiHoumaHungarianIcelanderIndian (Asian)IndonesianInupiatIranianIraqiIrishIroquoisIsraeliItalianJamaicanJapaneseJordanianKenyanKiowaKoreanLaotianLatvianLebaneseLiberianLithuanianLumbeeLuxembourgerMacedonianMalaysianMalteseMarshalleseMenomineeMexicanMexican American IndianMongolianMoroccanNative HawaiianNavajoNepaleseNew ZealanderNicaraguanNigerianNorthern EuropeanNorwegianOkinawanOsageOttawaPaiutePakistaniPalestinianPanamanianParaguayanPennsylvania GermanPeruvianPimaPolishPortuguesePotawatomiPuebloPuerto RicanPuget Sound SalishRomanianRussianSalvadoranSamoanScandinavianScotch-IrishScottishSeminoleSenegaleseSerbianShoshoneSierra LeoneanSiouxSlavicSlovakSloveneSomaliSouth AfricanSouth AmericanSouth American IndianSoviet UnionSpaniardSpanishSpanish AmericanSpanish American IndianSri LankanSubsaharan AfricanSudaneseSwedishSwissSyrianTaiwaneseThaiTlingit-HaidaTohono O'OdhamTonganTrinidadian and TobagonianTsimshianTurkishU.S. Virgin IslanderUgandanUkrainianUruguayanUteVenezuelanVietnameseWelshWest IndianYakamaYaquiYugoslavianYumanYup'ikZimbabwean
Ancestry (Percentage)
AfghanAfricanAlaska NativeAlaskan AthabascanAlbanianAleutAlsatianAmericanApacheArabArapahoArgentineanArmenianAssyrian / Chaldean / SyriacAustralianAustrianBahamianBangladeshiBarbadianBasqueBelgianBelizeanBermudanBhutaneseBlackfeetBolivianBrazilianBritishBritish West IndianBulgarianBurmeseCajunCambodianCanadianCape VerdeanCarpatho RusynCelticCentral AmericanCentral American IndianCherokeeCheyenneChickasawChileanChineseChippewaChoctawColombianColvilleComancheCosta RicanCreeCreekCroatianCrowCubanCypriotCzechCzechoslovakianDanishDelawareDominicanDutchDutch West IndianEastern EuropeanEcuadorianEgyptianEnglishEstonianEthiopianEuropeanFijianFilipinoFinnishFrenchFrench American IndianFrench CanadianGermanGerman RussianGhanaianGreekGuamanian / ChamorroGuatemalanGuyaneseHaitianHmongHonduranHopiHoumaHungarianIcelanderIndian (Asian)IndonesianInupiatIranianIraqiIrishIroquoisIsraeliItalianJamaicanJapaneseJordanianKenyanKiowaKoreanLaotianLatvianLebaneseLiberianLithuanianLumbeeLuxembourgerMacedonianMalaysianMalteseMarshalleseMenomineeMexicanMexican American IndianMongolianMoroccanNative HawaiianNavajoNepaleseNew ZealanderNicaraguanNigerianNorthern EuropeanNorwegianOkinawanOsageOttawaPaiutePakistaniPalestinianPanamanianParaguayanPennsylvania GermanPeruvianPimaPolishPortuguesePotawatomiPuebloPuerto RicanPuget Sound SalishRomanianRussianSalvadoranSamoanScandinavianScotch-IrishScottishSeminoleSenegaleseSerbianShoshoneSierra LeoneanSiouxSlavicSlovakSloveneSomaliSouth AfricanSouth AmericanSouth American IndianSoviet UnionSpaniardSpanishSpanish AmericanSpanish American IndianSri LankanSubsaharan AfricanSudaneseSwedishSwissSyrianTaiwaneseThaiTlingit-HaidaTohono O'OdhamTonganTrinidadian and TobagonianTsimshianTurkishU.S. Virgin IslanderUgandanUkrainianUruguayanUteVenezuelanVietnameseWelshWest IndianYakamaYaquiYugoslavianYumanYup'ikZimbabwean
Immigrant Origin (Total)
AfghanistanAfricaAlbaniaArgentinaArmeniaAsiaAustraliaAustriaAzoresBahamasBangladeshBarbadosBelarusBelgiumBelizeBoliviaBosnia and HerzegovinaBrazilBulgariaBurma / MyanmarCabo VerdeCambodiaCameroonCanadaCaribbeanCentral AmericaChileChinaColombiaCongoCosta RicaCroatiaCubaCzechoslovakiaDenmarkDominicaDominican RepublicEastern AfricaEastern AsiaEastern EuropeEcuadorEgyptEl SalvadorEnglandEritreaEthiopiaEuropeFijiFranceGermanyGhanaGreeceGrenadaGuatemalaGuyanaHaitiHondurasHong KongHungaryIndiaIndonesiaIranIraqIrelandIsraelItalyJamaicaJapanJordanKazakhstanKenyaKoreaKuwaitLaosLatin AmericaLatviaLebanonLiberiaLithuaniaMalaysiaMexicoMicronesiaMiddle AfricaMoldovaMoroccoNepalNetherlandsNicaraguaNigeriaNorth MacedoniaNorthern AfricaNorthern EuropeNorwayOceaniaPakistanPanamaPeruPhilippinesPolandPortugalRomaniaRussiaSaudi ArabiaScotlandSenegalSerbiaSierra LeoneSingaporeSomaliaSouth AfricaSouth AmericaSouth Central AsiaSouth Eastern AsiaSouthern EuropeSpainSri LankaSt. Vincent and the GrenadinesSudanSwedenSwitzerlandSyriaTaiwanThailandTrinidad and TobagoTurkeyUgandaUkraineUruguayUzbekistanVenezuelaVietnamWest IndiesWestern AfricaWestern AsiaWestern EuropeYemenZaireZimbabwe
Immigrant Origin (Percentage)
AfghanistanAfricaAlbaniaArgentinaArmeniaAsiaAustraliaAustriaAzoresBahamasBangladeshBarbadosBelarusBelgiumBelizeBoliviaBosnia and HerzegovinaBrazilBulgariaBurma / MyanmarCabo VerdeCambodiaCameroonCanadaCaribbeanCentral AmericaChileChinaColombiaCongoCosta RicaCroatiaCubaCzechoslovakiaDenmarkDominicaDominican RepublicEastern AfricaEastern AsiaEastern EuropeEcuadorEgyptEl SalvadorEnglandEritreaEthiopiaEuropeFijiFranceGermanyGhanaGreeceGrenadaGuatemalaGuyanaHaitiHondurasHong KongHungaryIndiaIndonesiaIranIraqIrelandIsraelItalyJamaicaJapanJordanKazakhstanKenyaKoreaKuwaitLaosLatin AmericaLatviaLebanonLiberiaLithuaniaMalaysiaMexicoMicronesiaMiddle AfricaMoldovaMoroccoNepalNetherlandsNicaraguaNigeriaNorth MacedoniaNorthern AfricaNorthern EuropeNorwayOceaniaPakistanPanamaPeruPhilippinesPolandPortugalRomaniaRussiaSaudi ArabiaScotlandSenegalSerbiaSierra LeoneSingaporeSomaliaSouth AfricaSouth AmericaSouth Central AsiaSouth Eastern AsiaSouthern EuropeSpainSri LankaSt. Vincent and the GrenadinesSudanSwedenSwitzerlandSyriaTaiwanThailandTrinidad and TobagoTurkeyUgandaUkraineUruguayUzbekistanVenezuelaVietnamWest IndiesWestern AfricaWestern AsiaWestern EuropeYemenZaireZimbabwe
Income
Income (Families)
Income (Households)
Poverty
Poverty (Families)
Unemployment
Employment Occupations
Employment Industries
Employer Class
Commute Time
Commute Means
School Enrollment
Education by Degree Field
Occupancy
Finances
Physical Characteristics
Wyoming
Compare Zip Codes
Comparison Subject

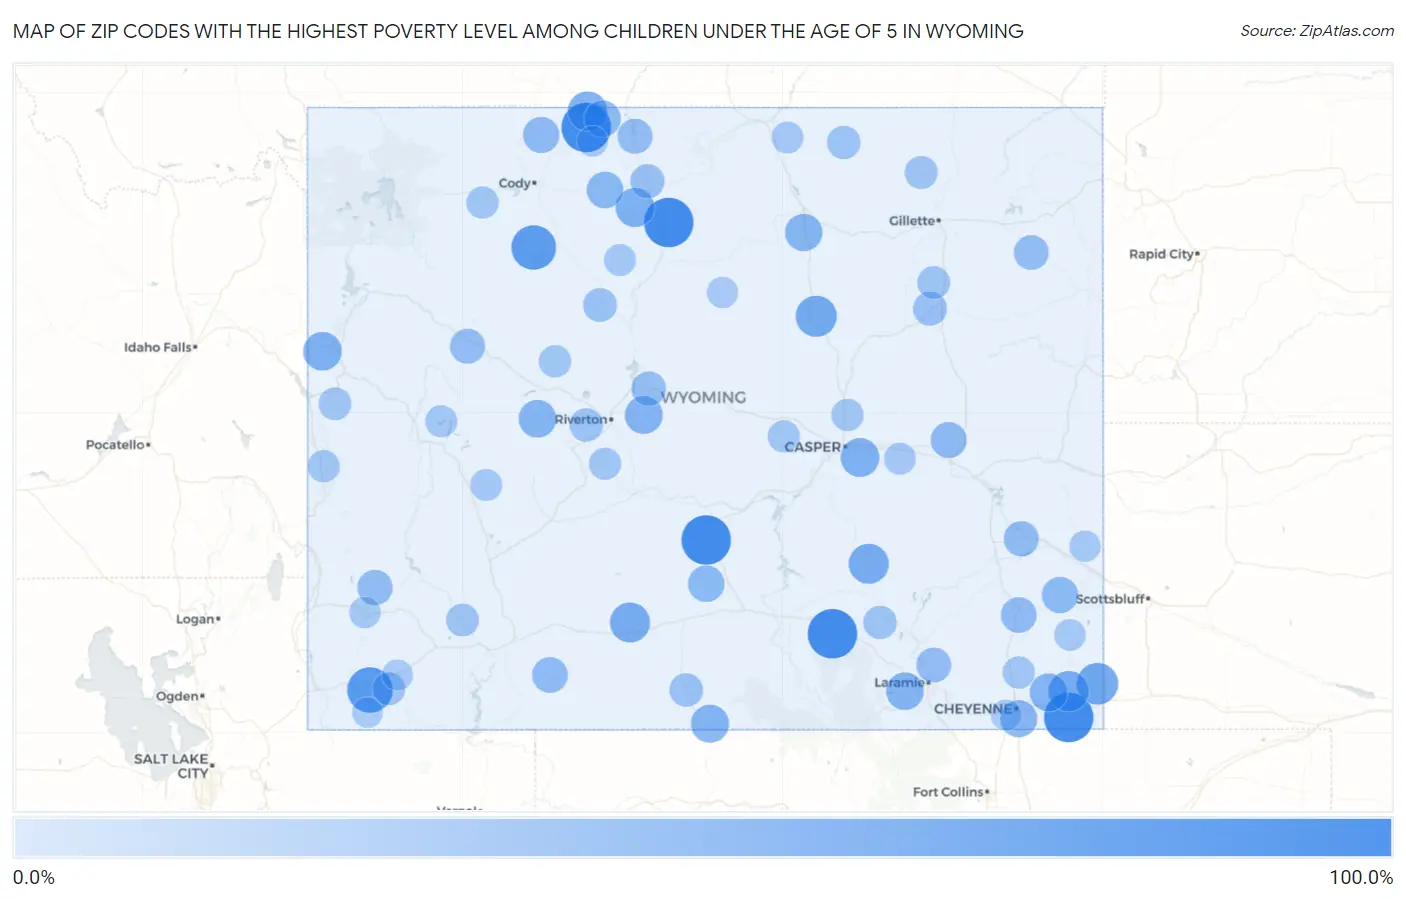
Map of Zip Codes with the Highest Poverty Level Among Children Under the Age of 5 in Wyoming

0.0%
100.0%
Zip Codes with the Highest Poverty Level Among Children Under the Age of 5 in Wyoming Map

Zip Codes with the Highest Poverty Level Among Children Under the Age of 5 in Wyoming

Zip Code Child Poverty vs State vs National
1.82054100.0%16.1%(+83.9)#118.1%(+81.9)#96
2.82421100.0%16.1%(+83.9)#218.1%(+81.9)#336
3.82432100.0%16.1%(+83.9)#318.1%(+81.9)#339
4.82322100.0%16.1%(+83.9)#418.1%(+81.9)#453
5.82324100.0%16.1%(+83.9)#518.1%(+81.9)#454
6.8293378.8%16.1%(+62.7)#618.1%(+60.8)#846
7.8243374.2%16.1%(+58.1)#718.1%(+56.1)#999
8.8208257.7%16.1%(+41.6)#818.1%(+39.6)#1,849
9.8263955.2%16.1%(+39.1)#918.1%(+37.1)#2,061
10.8205352.6%16.1%(+36.4)#1018.1%(+34.5)#2,292
11.8232950.0%16.1%(+33.9)#1118.1%(+31.9)#2,573
12.8233650.0%16.1%(+33.9)#1218.1%(+31.9)#2,590
13.8242347.6%16.1%(+31.5)#1318.1%(+29.6)#2,860
14.8241044.0%16.1%(+27.9)#1418.1%(+25.9)#3,334
15.8260942.9%16.1%(+26.8)#1518.1%(+24.8)#3,498
16.8301442.6%16.1%(+26.5)#1618.1%(+24.6)#3,548
17.8206038.9%16.1%(+22.8)#1718.1%(+20.9)#4,224
18.8232338.9%16.1%(+22.8)#1818.1%(+20.8)#4,235
19.8250138.5%16.1%(+22.4)#1918.1%(+20.5)#4,300
20.8251437.1%16.1%(+21.0)#2018.1%(+19.0)#4,578
21.8207036.8%16.1%(+20.6)#2118.1%(+18.7)#4,645
22.8283435.9%16.1%(+19.8)#2218.1%(+17.9)#4,838
23.8200733.8%16.1%(+17.7)#2318.1%(+15.7)#5,346
24.8241131.8%16.1%(+15.7)#2418.1%(+13.8)#5,884
25.8242031.4%16.1%(+15.3)#2518.1%(+13.4)#5,971
26.8230131.3%16.1%(+15.2)#2618.1%(+13.2)#6,002
27.8224430.0%16.1%(+13.9)#2718.1%(+11.9)#6,354
28.8243529.7%16.1%(+13.6)#2818.1%(+11.7)#6,431
29.8263328.8%16.1%(+12.7)#2918.1%(+10.8)#6,695
30.8221027.3%16.1%(+11.2)#3018.1%(+9.21)#7,229
31.8290127.1%16.1%(+10.9)#3118.1%(+8.99)#7,291
32.8310124.7%16.1%(+8.55)#3218.1%(+6.60)#8,126
33.8221424.1%16.1%(+7.96)#3318.1%(+6.01)#8,325
34.8251323.8%16.1%(+7.69)#3418.1%(+5.75)#8,437
35.8243123.4%16.1%(+7.33)#3518.1%(+5.39)#8,596
36.8207223.3%16.1%(+7.18)#3618.1%(+5.23)#8,649
37.8273022.5%16.1%(+6.38)#3718.1%(+4.44)#8,961
38.8264921.8%16.1%(+5.68)#3818.1%(+3.73)#9,269
39.8242619.1%16.1%(+3.00)#3918.1%(+1.05)#10,458
40.8273218.1%16.1%(+1.99)#4018.1%(+0.047)#10,911
41.8244317.4%16.1%(+1.32)#4118.1%(-0.632)#11,222
42.8232116.4%16.1%(+0.248)#4218.1%(-1.70)#11,716
43.8251015.9%16.1%(-0.262)#4318.1%(-2.21)#11,995
44.8208315.4%16.1%(-0.731)#4418.1%(-2.68)#12,258
45.8283515.1%16.1%(-1.02)#4518.1%(-2.97)#12,407
46.8271613.1%16.1%(-2.99)#4618.1%(-4.93)#13,552
47.8271813.1%16.1%(-3.02)#4718.1%(-4.97)#13,578
48.8293912.8%16.1%(-3.29)#4818.1%(-5.24)#13,732
49.8293512.4%16.1%(-3.72)#4918.1%(-5.67)#13,968
50.8312811.9%16.1%(-4.19)#5018.1%(-6.14)#14,264
51.826019.8%16.1%(-6.35)#5118.1%(-8.29)#15,548
52.825239.8%16.1%(-6.36)#5218.1%(-8.31)#15,562
53.824149.7%16.1%(-6.38)#5318.1%(-8.33)#15,573
54.820099.6%16.1%(-6.53)#5418.1%(-8.48)#15,650
55.831109.0%16.1%(-7.07)#5518.1%(-9.02)#16,034
56.825209.0%16.1%(-7.09)#5618.1%(-9.04)#16,042
57.826048.8%16.1%(-7.31)#5718.1%(-9.26)#16,192
58.829417.7%16.1%(-8.40)#5818.1%(-10.3)#16,917
59.824017.5%16.1%(-8.62)#5918.1%(-10.6)#17,075
60.828017.3%16.1%(-8.86)#6018.1%(-10.8)#17,218
61.829237.0%16.1%(-9.07)#6118.1%(-11.0)#17,357
62.826377.0%16.1%(-9.10)#6218.1%(-11.0)#17,369
63.831165.6%16.1%(-10.6)#6318.1%(-12.5)#18,396
64.822215.3%16.1%(-10.9)#6418.1%(-12.8)#18,601
65.822404.4%16.1%(-11.7)#6518.1%(-13.7)#19,196
66.824424.0%16.1%(-12.1)#6618.1%(-14.1)#19,504
67.829372.8%16.1%(-13.3)#6718.1%(-15.2)#20,277
68.824122.4%16.1%(-13.7)#6818.1%(-15.6)#20,545
69.820011.9%16.1%(-14.2)#6918.1%(-16.1)#20,891
70.829301.1%16.1%(-15.0)#7018.1%(-16.9)#21,326

Common Questions

What are the Top 10 Zip Codes with the Highest Poverty Level Among Children Under the Age of 5 in Wyoming?
Top 10 Zip Codes with the Highest Poverty Level Among Children Under the Age of 5 in Wyoming are:
#1
100.0%
#2
100.0%
#3
100.0%
#4
100.0%
#5
100.0%
#6
78.8%
#7
74.2%
#8
57.7%
#9
55.2%
#10
52.6%
What zip code has the Highest Poverty Level Among Children Under the Age of 5 in Wyoming?
82054 has the Highest Poverty Level Among Children Under the Age of 5 in Wyoming with 100.0%.
What is the Poverty Level Among Children Under the Age of 5 in the State of Wyoming?
Poverty Level Among Children Under the Age of 5 in Wyoming is 16.1%.
What is the Poverty Level Among Children Under the Age of 5 in the United States?
Poverty Level Among Children Under the Age of 5 in the United States is 18.1%.