Zip Codes with the Highest Poverty Level Among Children Under the Age of 5 in Maine
RELATED REPORTS & OPTIONS
Highest Poverty | Child 0-5
Maine
Compare Zip Codes
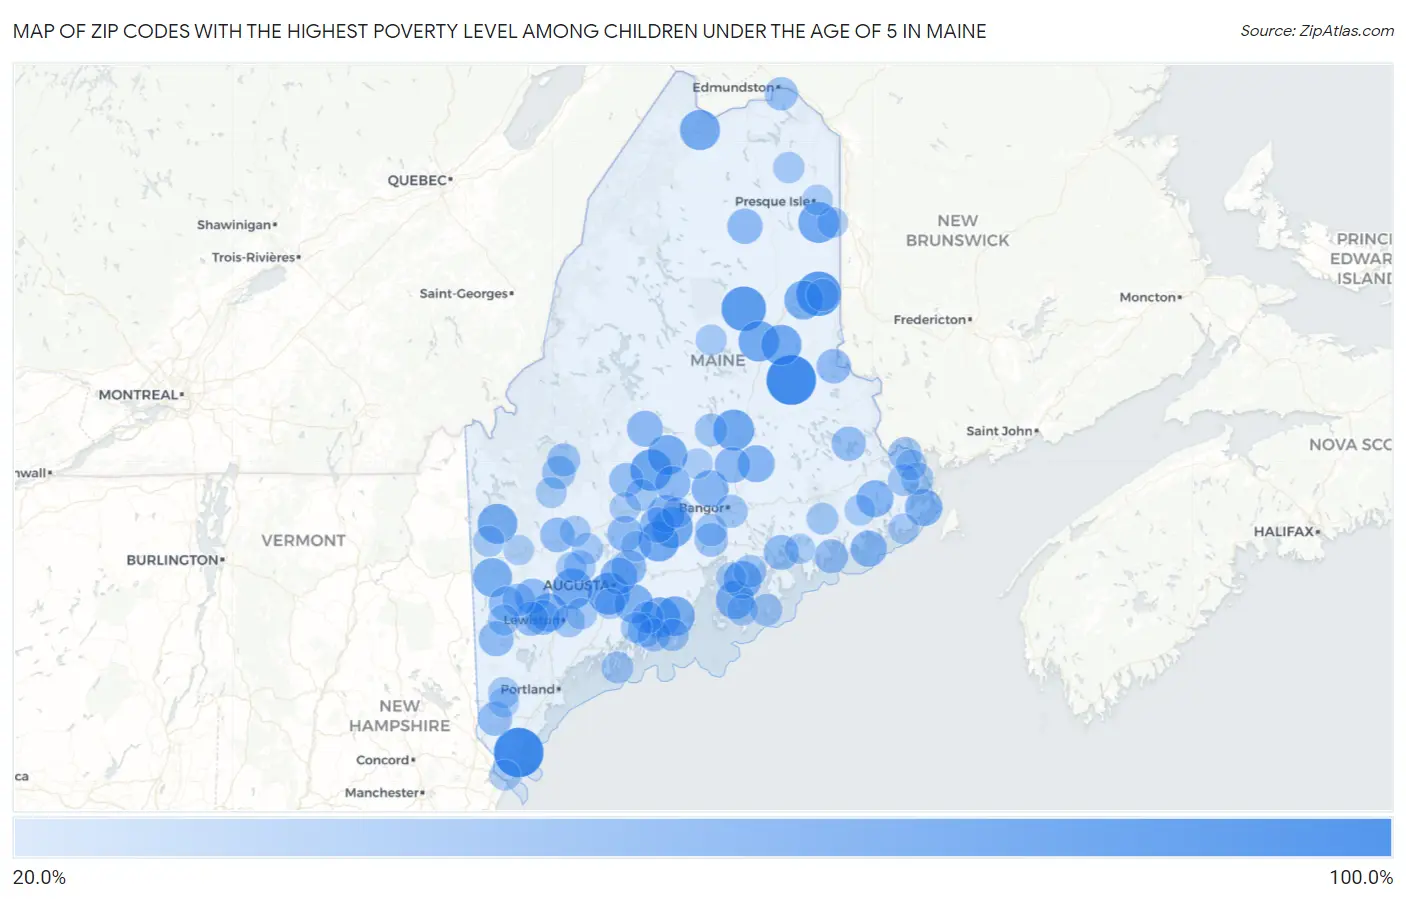
Map of Zip Codes with the Highest Poverty Level Among Children Under the Age of 5 in Maine
20.0%
100.0%
Zip Codes with the Highest Poverty Level Among Children Under the Age of 5 in Maine
| Zip Code | Child Poverty | vs State | vs National | |
| 1. | 03907 | 100.0% | 14.4%(+85.6)#1 | 18.1%(+81.9)#63 |
| 2. | 04451 | 100.0% | 14.4%(+85.6)#2 | 18.1%(+81.9)#362 |
| 3. | 04761 | 79.3% | 14.4%(+65.0)#3 | 18.1%(+61.2)#835 |
| 4. | 04765 | 79.2% | 14.4%(+64.8)#4 | 18.1%(+61.1)#843 |
| 5. | 04344 | 67.8% | 14.4%(+53.4)#5 | 18.1%(+49.7)#1,237 |
| 6. | 04923 | 66.7% | 14.4%(+52.3)#6 | 18.1%(+48.6)#1,293 |
| 7. | 04448 | 64.1% | 14.4%(+49.7)#7 | 18.1%(+46.0)#1,443 |
| 8. | 04787 | 63.6% | 14.4%(+49.3)#8 | 18.1%(+45.6)#1,472 |
| 9. | 04987 | 63.2% | 14.4%(+48.8)#9 | 18.1%(+45.1)#1,491 |
| 10. | 04988 | 62.5% | 14.4%(+48.1)#10 | 18.1%(+44.4)#1,523 |
| 11. | 04777 | 62.5% | 14.4%(+48.1)#11 | 18.1%(+44.4)#1,530 |
| 12. | 04776 | 62.2% | 14.4%(+47.9)#12 | 18.1%(+44.2)#1,549 |
| 13. | 04263 | 61.6% | 14.4%(+47.2)#13 | 18.1%(+43.5)#1,586 |
| 14. | 04572 | 61.5% | 14.4%(+47.1)#14 | 18.1%(+43.4)#1,599 |
| 15. | 04774 | 61.1% | 14.4%(+46.8)#15 | 18.1%(+43.0)#1,619 |
| 16. | 04479 | 59.5% | 14.4%(+45.2)#16 | 18.1%(+41.5)#1,726 |
| 17. | 04216 | 59.4% | 14.4%(+45.0)#17 | 18.1%(+41.3)#1,737 |
| 18. | 04864 | 59.1% | 14.4%(+44.7)#18 | 18.1%(+41.0)#1,759 |
| 19. | 04217 | 56.4% | 14.4%(+42.0)#19 | 18.1%(+38.3)#1,957 |
| 20. | 04763 | 55.6% | 14.4%(+41.2)#20 | 18.1%(+37.5)#2,033 |
| 21. | 04353 | 54.5% | 14.4%(+40.2)#21 | 18.1%(+36.5)#2,098 |
| 22. | 04627 | 53.7% | 14.4%(+39.4)#22 | 18.1%(+35.7)#2,171 |
| 23. | 04258 | 53.1% | 14.4%(+38.7)#23 | 18.1%(+35.0)#2,241 |
| 24. | 04676 | 51.9% | 14.4%(+37.5)#24 | 18.1%(+33.8)#2,355 |
| 25. | 04652 | 50.0% | 14.4%(+35.6)#25 | 18.1%(+31.9)#2,539 |
| 26. | 04929 | 48.3% | 14.4%(+33.9)#26 | 18.1%(+30.2)#2,784 |
| 27. | 04418 | 47.8% | 14.4%(+33.5)#27 | 18.1%(+29.8)#2,828 |
| 28. | 04630 | 47.8% | 14.4%(+33.5)#28 | 18.1%(+29.8)#2,829 |
| 29. | 04450 | 47.8% | 14.4%(+33.5)#29 | 18.1%(+29.8)#2,830 |
| 30. | 04330 | 47.2% | 14.4%(+32.8)#30 | 18.1%(+29.1)#2,898 |
| 31. | 04649 | 45.2% | 14.4%(+30.9)#31 | 18.1%(+27.2)#3,147 |
| 32. | 04464 | 43.9% | 14.4%(+29.5)#32 | 18.1%(+25.8)#3,352 |
| 33. | 04468 | 43.3% | 14.4%(+29.0)#33 | 18.1%(+25.3)#3,431 |
| 34. | 04922 | 43.3% | 14.4%(+29.0)#34 | 18.1%(+25.3)#3,434 |
| 35. | 04928 | 42.4% | 14.4%(+28.1)#35 | 18.1%(+24.4)#3,586 |
| 36. | 04937 | 42.2% | 14.4%(+27.9)#36 | 18.1%(+24.2)#3,618 |
| 37. | 04732 | 40.9% | 14.4%(+26.6)#37 | 18.1%(+22.8)#3,850 |
| 38. | 04989 | 40.8% | 14.4%(+26.5)#38 | 18.1%(+22.8)#3,861 |
| 39. | 04281 | 40.5% | 14.4%(+26.2)#39 | 18.1%(+22.4)#3,932 |
| 40. | 04640 | 40.3% | 14.4%(+26.0)#40 | 18.1%(+22.2)#3,962 |
| 41. | 04256 | 40.0% | 14.4%(+25.6)#41 | 18.1%(+21.9)#4,006 |
| 42. | 04022 | 40.0% | 14.4%(+25.6)#42 | 18.1%(+21.9)#4,014 |
| 43. | 04088 | 40.0% | 14.4%(+25.6)#43 | 18.1%(+21.9)#4,015 |
| 44. | 04294 | 38.5% | 14.4%(+24.1)#44 | 18.1%(+20.4)#4,304 |
| 45. | 04424 | 37.8% | 14.4%(+23.4)#45 | 18.1%(+19.7)#4,452 |
| 46. | 04543 | 37.4% | 14.4%(+23.1)#46 | 18.1%(+19.3)#4,515 |
| 47. | 04668 | 36.9% | 14.4%(+22.6)#47 | 18.1%(+18.9)#4,609 |
| 48. | 04270 | 36.3% | 14.4%(+22.0)#48 | 18.1%(+18.3)#4,750 |
| 49. | 04912 | 36.2% | 14.4%(+21.9)#49 | 18.1%(+18.2)#4,775 |
| 50. | 04083 | 36.1% | 14.4%(+21.7)#50 | 18.1%(+18.0)#4,806 |
| 51. | 04658 | 35.2% | 14.4%(+20.8)#51 | 18.1%(+17.1)#5,030 |
| 52. | 04438 | 34.4% | 14.4%(+20.0)#52 | 18.1%(+16.3)#5,208 |
| 53. | 04619 | 33.3% | 14.4%(+19.0)#53 | 18.1%(+15.3)#5,441 |
| 54. | 04947 | 33.3% | 14.4%(+19.0)#54 | 18.1%(+15.3)#5,458 |
| 55. | 04756 | 33.1% | 14.4%(+18.7)#55 | 18.1%(+15.0)#5,573 |
| 56. | 04961 | 32.4% | 14.4%(+18.0)#56 | 18.1%(+14.3)#5,756 |
| 57. | 04412 | 31.8% | 14.4%(+17.4)#57 | 18.1%(+13.7)#5,888 |
| 58. | 04551 | 31.4% | 14.4%(+17.1)#58 | 18.1%(+13.4)#5,970 |
| 59. | 04463 | 31.2% | 14.4%(+16.9)#59 | 18.1%(+13.2)#6,014 |
| 60. | 04268 | 31.1% | 14.4%(+16.8)#60 | 18.1%(+13.1)#6,043 |
| 61. | 04614 | 29.9% | 14.4%(+15.5)#61 | 18.1%(+11.8)#6,382 |
| 62. | 04730 | 29.8% | 14.4%(+15.5)#62 | 18.1%(+11.8)#6,393 |
| 63. | 04667 | 29.2% | 14.4%(+14.9)#63 | 18.1%(+11.2)#6,586 |
| 64. | 04563 | 29.1% | 14.4%(+14.8)#64 | 18.1%(+11.1)#6,617 |
| 65. | 04496 | 29.1% | 14.4%(+14.7)#65 | 18.1%(+11.0)#6,620 |
| 66. | 04555 | 28.8% | 14.4%(+14.5)#66 | 18.1%(+10.8)#6,703 |
| 67. | 04685 | 28.6% | 14.4%(+14.2)#67 | 18.1%(+10.5)#6,797 |
| 68. | 04240 | 28.5% | 14.4%(+14.1)#68 | 18.1%(+10.4)#6,825 |
| 69. | 04666 | 27.6% | 14.4%(+13.2)#69 | 18.1%(+9.52)#7,106 |
| 70. | 04943 | 27.5% | 14.4%(+13.1)#70 | 18.1%(+9.39)#7,146 |
| 71. | 04548 | 27.3% | 14.4%(+12.9)#71 | 18.1%(+9.21)#7,217 |
| 72. | 04622 | 27.3% | 14.4%(+12.9)#72 | 18.1%(+9.21)#7,218 |
| 73. | 04349 | 26.1% | 14.4%(+11.7)#73 | 18.1%(+8.02)#7,616 |
| 74. | 04280 | 25.8% | 14.4%(+11.5)#74 | 18.1%(+7.79)#7,691 |
| 75. | 04040 | 25.0% | 14.4%(+10.6)#75 | 18.1%(+6.94)#7,971 |
| 76. | 04681 | 25.0% | 14.4%(+10.6)#76 | 18.1%(+6.94)#8,004 |
| 77. | 04360 | 25.0% | 14.4%(+10.6)#77 | 18.1%(+6.94)#8,014 |
| 78. | 04766 | 25.0% | 14.4%(+10.6)#78 | 18.1%(+6.94)#8,030 |
| 79. | 04261 | 25.0% | 14.4%(+10.6)#79 | 18.1%(+6.94)#8,031 |
| 80. | 04061 | 24.7% | 14.4%(+10.4)#80 | 18.1%(+6.64)#8,112 |
| 81. | 04938 | 24.4% | 14.4%(+10.1)#81 | 18.1%(+6.35)#8,205 |
| 82. | 03904 | 24.0% | 14.4%(+9.65)#82 | 18.1%(+5.94)#8,344 |
| 83. | 04462 | 23.9% | 14.4%(+9.54)#83 | 18.1%(+5.83)#8,397 |
| 84. | 04654 | 23.7% | 14.4%(+9.33)#84 | 18.1%(+5.62)#8,495 |
| 85. | 04553 | 23.5% | 14.4%(+9.18)#85 | 18.1%(+5.47)#8,562 |
| 86. | 04983 | 23.5% | 14.4%(+9.18)#86 | 18.1%(+5.47)#8,563 |
| 87. | 04758 | 23.5% | 14.4%(+9.18)#87 | 18.1%(+5.47)#8,565 |
| 88. | 04671 | 23.5% | 14.4%(+9.18)#88 | 18.1%(+5.47)#8,572 |
| 89. | 04901 | 23.2% | 14.4%(+8.87)#89 | 18.1%(+5.16)#8,675 |
| 90. | 04626 | 22.4% | 14.4%(+8.10)#90 | 18.1%(+4.39)#8,989 |
| 91. | 04769 | 22.3% | 14.4%(+7.99)#91 | 18.1%(+4.28)#9,026 |
| 92. | 04345 | 22.3% | 14.4%(+7.93)#92 | 18.1%(+4.22)#9,055 |
| 93. | 04254 | 22.2% | 14.4%(+7.87)#93 | 18.1%(+4.16)#9,082 |
| 94. | 04969 | 22.2% | 14.4%(+7.87)#94 | 18.1%(+4.16)#9,087 |
| 95. | 04976 | 22.2% | 14.4%(+7.80)#95 | 18.1%(+4.09)#9,134 |
| 96. | 04422 | 22.0% | 14.4%(+7.60)#96 | 18.1%(+3.89)#9,209 |
| 97. | 04087 | 21.5% | 14.4%(+7.13)#97 | 18.1%(+3.42)#9,394 |
| 98. | 04276 | 21.3% | 14.4%(+6.99)#98 | 18.1%(+3.28)#9,461 |
| 99. | 04617 | 21.1% | 14.4%(+6.70)#99 | 18.1%(+2.99)#9,574 |
| 100. | 04664 | 21.0% | 14.4%(+6.66)#100 | 18.1%(+2.95)#9,592 |
Common Questions
What are the Top 10 Zip Codes with the Highest Poverty Level Among Children Under the Age of 5 in Maine?
Top 10 Zip Codes with the Highest Poverty Level Among Children Under the Age of 5 in Maine are:
What zip code has the Highest Poverty Level Among Children Under the Age of 5 in Maine?
03907 has the Highest Poverty Level Among Children Under the Age of 5 in Maine with 100.0%.
What is the Poverty Level Among Children Under the Age of 5 in the State of Maine?
Poverty Level Among Children Under the Age of 5 in Maine is 14.4%.
What is the Poverty Level Among Children Under the Age of 5 in the United States?
Poverty Level Among Children Under the Age of 5 in the United States is 18.1%.