Zip Codes with the Highest Poverty Level Among Children Under the Age of 5 in Wisconsin
RELATED REPORTS & OPTIONS
Highest Poverty | Child 0-5
Wisconsin
Compare Zip Codes
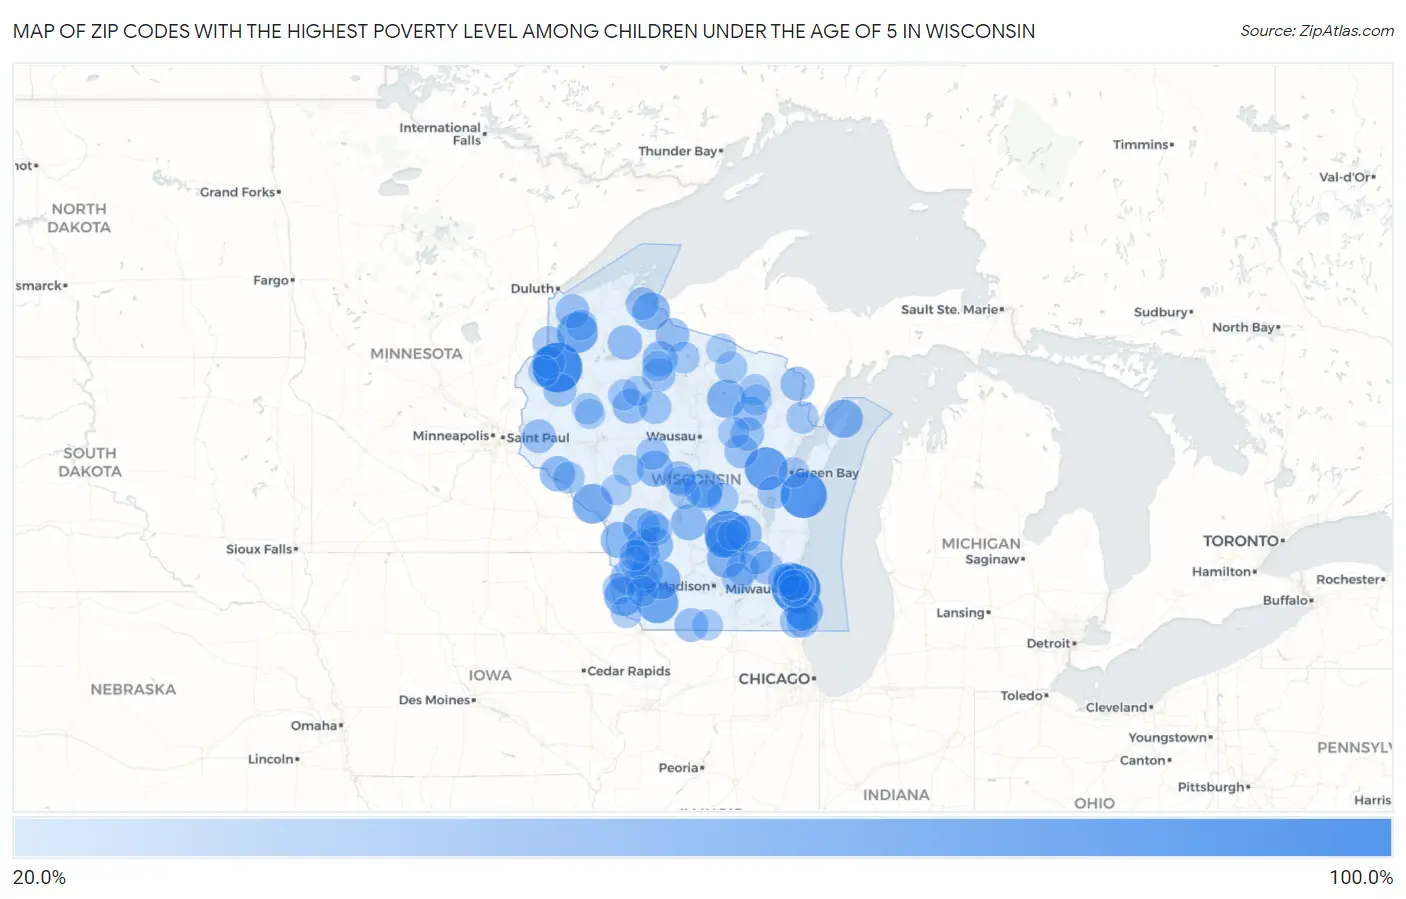
Map of Zip Codes with the Highest Poverty Level Among Children Under the Age of 5 in Wisconsin
20.0%
100.0%
Zip Codes with the Highest Poverty Level Among Children Under the Age of 5 in Wisconsin
| Zip Code | Child Poverty | vs State | vs National | |
| 1. | 54845 | 100.0% | 14.9%(+85.1)#1 | 18.1%(+81.9)#484 |
| 2. | 53233 | 96.0% | 14.9%(+81.1)#2 | 18.1%(+77.9)#571 |
| 3. | 54215 | 87.5% | 14.9%(+72.6)#3 | 18.1%(+69.4)#666 |
| 4. | 53947 | 86.5% | 14.9%(+71.6)#4 | 18.1%(+68.4)#682 |
| 5. | 54152 | 75.0% | 14.9%(+60.1)#5 | 18.1%(+56.9)#973 |
| 6. | 53580 | 69.1% | 14.9%(+54.2)#6 | 18.1%(+51.0)#1,193 |
| 7. | 54838 | 66.7% | 14.9%(+51.8)#7 | 18.1%(+48.6)#1,282 |
| 8. | 54625 | 62.5% | 14.9%(+47.6)#8 | 18.1%(+44.4)#1,532 |
| 9. | 53817 | 60.0% | 14.9%(+45.1)#9 | 18.1%(+41.9)#1,701 |
| 10. | 54921 | 57.9% | 14.9%(+43.1)#10 | 18.1%(+39.9)#1,834 |
| 11. | 53404 | 57.9% | 14.9%(+43.0)#11 | 18.1%(+39.8)#1,837 |
| 12. | 53506 | 57.5% | 14.9%(+42.7)#12 | 18.1%(+39.5)#1,863 |
| 13. | 54234 | 57.4% | 14.9%(+42.5)#13 | 18.1%(+39.4)#1,869 |
| 14. | 54428 | 57.1% | 14.9%(+42.3)#14 | 18.1%(+39.1)#1,888 |
| 15. | 53928 | 57.1% | 14.9%(+42.3)#15 | 18.1%(+39.1)#1,896 |
| 16. | 53205 | 56.1% | 14.9%(+41.2)#16 | 18.1%(+38.0)#1,983 |
| 17. | 53206 | 53.7% | 14.9%(+38.8)#17 | 18.1%(+35.6)#2,172 |
| 18. | 54559 | 53.6% | 14.9%(+38.7)#18 | 18.1%(+35.5)#2,186 |
| 19. | 53218 | 53.0% | 14.9%(+38.1)#19 | 18.1%(+34.9)#2,248 |
| 20. | 53926 | 50.6% | 14.9%(+35.7)#20 | 18.1%(+32.5)#2,469 |
| 21. | 54648 | 50.0% | 14.9%(+35.1)#21 | 18.1%(+31.9)#2,533 |
| 22. | 53931 | 50.0% | 14.9%(+35.1)#22 | 18.1%(+31.9)#2,578 |
| 23. | 54621 | 49.6% | 14.9%(+34.7)#23 | 18.1%(+31.5)#2,638 |
| 24. | 54436 | 49.4% | 14.9%(+34.6)#24 | 18.1%(+31.4)#2,644 |
| 25. | 54634 | 48.9% | 14.9%(+34.0)#25 | 18.1%(+30.9)#2,702 |
| 26. | 53910 | 47.8% | 14.9%(+32.9)#26 | 18.1%(+29.8)#2,826 |
| 27. | 54759 | 46.4% | 14.9%(+31.5)#27 | 18.1%(+28.4)#2,987 |
| 28. | 53208 | 45.9% | 14.9%(+31.0)#28 | 18.1%(+27.8)#3,067 |
| 29. | 54664 | 45.0% | 14.9%(+30.2)#29 | 18.1%(+27.0)#3,176 |
| 30. | 54552 | 44.7% | 14.9%(+29.8)#30 | 18.1%(+26.6)#3,224 |
| 31. | 54766 | 44.0% | 14.9%(+29.1)#31 | 18.1%(+25.9)#3,335 |
| 32. | 53209 | 43.0% | 14.9%(+28.2)#32 | 18.1%(+25.0)#3,475 |
| 33. | 54657 | 42.9% | 14.9%(+28.0)#33 | 18.1%(+24.8)#3,515 |
| 34. | 54517 | 42.9% | 14.9%(+28.0)#34 | 18.1%(+24.8)#3,521 |
| 35. | 54156 | 41.7% | 14.9%(+26.8)#35 | 18.1%(+23.6)#3,713 |
| 36. | 53522 | 40.9% | 14.9%(+26.0)#36 | 18.1%(+22.8)#3,853 |
| 37. | 54491 | 40.8% | 14.9%(+25.9)#37 | 18.1%(+22.7)#3,873 |
| 38. | 54842 | 40.7% | 14.9%(+25.8)#38 | 18.1%(+22.6)#3,898 |
| 39. | 54015 | 40.7% | 14.9%(+25.8)#39 | 18.1%(+22.6)#3,901 |
| 40. | 54555 | 40.1% | 14.9%(+25.2)#40 | 18.1%(+22.1)#3,992 |
| 41. | 54547 | 40.0% | 14.9%(+25.1)#41 | 18.1%(+21.9)#4,012 |
| 42. | 54150 | 40.0% | 14.9%(+25.1)#42 | 18.1%(+21.9)#4,013 |
| 43. | 54948 | 40.0% | 14.9%(+25.1)#43 | 18.1%(+21.9)#4,037 |
| 44. | 53805 | 39.9% | 14.9%(+25.0)#44 | 18.1%(+21.8)#4,051 |
| 45. | 53212 | 39.9% | 14.9%(+25.0)#45 | 18.1%(+21.8)#4,052 |
| 46. | 53518 | 39.3% | 14.9%(+24.4)#46 | 18.1%(+21.2)#4,161 |
| 47. | 54829 | 39.0% | 14.9%(+24.1)#47 | 18.1%(+20.9)#4,213 |
| 48. | 53579 | 39.0% | 14.9%(+24.1)#48 | 18.1%(+20.9)#4,219 |
| 49. | 53032 | 38.6% | 14.9%(+23.7)#49 | 18.1%(+20.6)#4,280 |
| 50. | 54490 | 38.3% | 14.9%(+23.5)#50 | 18.1%(+20.3)#4,340 |
| 51. | 53078 | 38.1% | 14.9%(+23.2)#51 | 18.1%(+20.0)#4,388 |
| 52. | 54861 | 37.9% | 14.9%(+23.0)#52 | 18.1%(+19.9)#4,428 |
| 53. | 53225 | 37.8% | 14.9%(+22.9)#53 | 18.1%(+19.7)#4,448 |
| 54. | 53204 | 37.5% | 14.9%(+22.7)#54 | 18.1%(+19.5)#4,482 |
| 55. | 53224 | 37.5% | 14.9%(+22.6)#55 | 18.1%(+19.4)#4,504 |
| 56. | 53144 | 37.3% | 14.9%(+22.4)#56 | 18.1%(+19.3)#4,533 |
| 57. | 54893 | 37.0% | 14.9%(+22.1)#57 | 18.1%(+18.9)#4,605 |
| 58. | 54489 | 36.6% | 14.9%(+21.8)#58 | 18.1%(+18.6)#4,670 |
| 59. | 53210 | 36.5% | 14.9%(+21.7)#59 | 18.1%(+18.5)#4,696 |
| 60. | 54639 | 36.4% | 14.9%(+21.5)#60 | 18.1%(+18.3)#4,727 |
| 61. | 53140 | 35.9% | 14.9%(+21.0)#61 | 18.1%(+17.8)#4,853 |
| 62. | 54446 | 35.7% | 14.9%(+20.8)#62 | 18.1%(+17.7)#4,882 |
| 63. | 54830 | 35.7% | 14.9%(+20.8)#63 | 18.1%(+17.7)#4,883 |
| 64. | 54159 | 35.6% | 14.9%(+20.7)#64 | 18.1%(+17.5)#4,937 |
| 65. | 53046 | 35.4% | 14.9%(+20.6)#65 | 18.1%(+17.4)#4,967 |
| 66. | 54136 | 35.4% | 14.9%(+20.6)#66 | 18.1%(+17.4)#4,972 |
| 67. | 53821 | 35.3% | 14.9%(+20.4)#67 | 18.1%(+17.2)#4,997 |
| 68. | 53403 | 35.1% | 14.9%(+20.2)#68 | 18.1%(+17.1)#5,041 |
| 69. | 53215 | 34.0% | 14.9%(+19.1)#69 | 18.1%(+15.9)#5,303 |
| 70. | 54984 | 33.9% | 14.9%(+19.1)#70 | 18.1%(+15.9)#5,314 |
| 71. | 54562 | 33.9% | 14.9%(+19.0)#71 | 18.1%(+15.8)#5,324 |
| 72. | 54655 | 33.8% | 14.9%(+19.0)#72 | 18.1%(+15.8)#5,334 |
| 73. | 54638 | 33.8% | 14.9%(+19.0)#73 | 18.1%(+15.8)#5,335 |
| 74. | 54538 | 33.7% | 14.9%(+18.9)#74 | 18.1%(+15.7)#5,362 |
| 75. | 54670 | 33.3% | 14.9%(+18.5)#75 | 18.1%(+15.3)#5,448 |
| 76. | 54756 | 33.3% | 14.9%(+18.5)#76 | 18.1%(+15.3)#5,474 |
| 77. | 54541 | 32.9% | 14.9%(+18.0)#77 | 18.1%(+14.8)#5,624 |
| 78. | 54450 | 32.3% | 14.9%(+17.4)#78 | 18.1%(+14.2)#5,778 |
| 79. | 54966 | 32.2% | 14.9%(+17.3)#79 | 18.1%(+14.1)#5,797 |
| 80. | 54457 | 31.9% | 14.9%(+17.0)#80 | 18.1%(+13.8)#5,868 |
| 81. | 53806 | 31.7% | 14.9%(+16.8)#81 | 18.1%(+13.6)#5,903 |
| 82. | 54563 | 31.3% | 14.9%(+16.5)#82 | 18.1%(+13.3)#5,991 |
| 83. | 54728 | 31.0% | 14.9%(+16.2)#83 | 18.1%(+13.0)#6,071 |
| 84. | 54566 | 31.0% | 14.9%(+16.2)#84 | 18.1%(+13.0)#6,073 |
| 85. | 54872 | 30.7% | 14.9%(+15.8)#85 | 18.1%(+12.6)#6,172 |
| 86. | 54746 | 30.4% | 14.9%(+15.6)#86 | 18.1%(+12.4)#6,232 |
| 87. | 54652 | 30.3% | 14.9%(+15.4)#87 | 18.1%(+12.2)#6,270 |
| 88. | 53594 | 30.2% | 14.9%(+15.4)#88 | 18.1%(+12.2)#6,281 |
| 89. | 54873 | 30.0% | 14.9%(+15.1)#89 | 18.1%(+11.9)#6,343 |
| 90. | 53550 | 30.0% | 14.9%(+15.1)#90 | 18.1%(+11.9)#6,348 |
| 91. | 53216 | 29.9% | 14.9%(+15.0)#91 | 18.1%(+11.8)#6,378 |
| 92. | 53809 | 29.9% | 14.9%(+15.0)#92 | 18.1%(+11.8)#6,380 |
| 93. | 54524 | 29.5% | 14.9%(+14.7)#93 | 18.1%(+11.5)#6,492 |
| 94. | 54495 | 29.3% | 14.9%(+14.5)#94 | 18.1%(+11.3)#6,559 |
| 95. | 54659 | 29.1% | 14.9%(+14.2)#95 | 18.1%(+11.0)#6,623 |
| 96. | 54302 | 29.0% | 14.9%(+14.1)#96 | 18.1%(+10.9)#6,656 |
| 97. | 53946 | 29.0% | 14.9%(+14.1)#97 | 18.1%(+10.9)#6,664 |
| 98. | 54519 | 28.3% | 14.9%(+13.4)#98 | 18.1%(+10.2)#6,896 |
| 99. | 54530 | 27.9% | 14.9%(+13.0)#99 | 18.1%(+9.84)#6,985 |
| 100. | 54757 | 27.6% | 14.9%(+12.7)#100 | 18.1%(+9.56)#7,084 |
Common Questions
What are the Top 10 Zip Codes with the Highest Poverty Level Among Children Under the Age of 5 in Wisconsin?
Top 10 Zip Codes with the Highest Poverty Level Among Children Under the Age of 5 in Wisconsin are:
What zip code has the Highest Poverty Level Among Children Under the Age of 5 in Wisconsin?
54845 has the Highest Poverty Level Among Children Under the Age of 5 in Wisconsin with 100.0%.
What is the Poverty Level Among Children Under the Age of 5 in the State of Wisconsin?
Poverty Level Among Children Under the Age of 5 in Wisconsin is 14.9%.
What is the Poverty Level Among Children Under the Age of 5 in the United States?
Poverty Level Among Children Under the Age of 5 in the United States is 18.1%.