Zip Codes with the Highest Poverty Level Among Children Under the Age of 5 in Montana
RELATED REPORTS & OPTIONS
Highest Poverty | Child 0-5
Montana
Compare Zip Codes
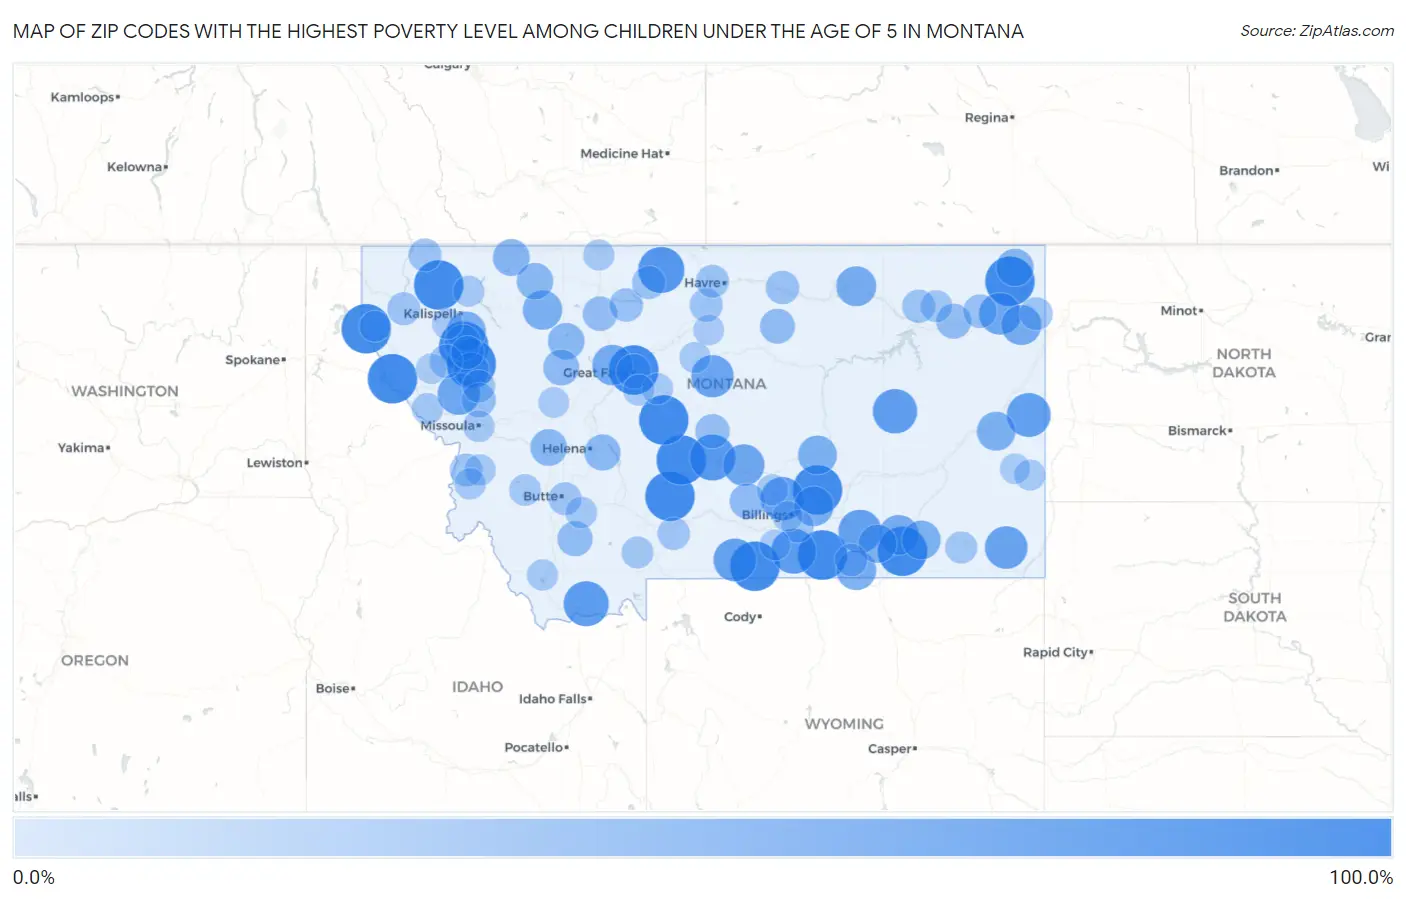
Map of Zip Codes with the Highest Poverty Level Among Children Under the Age of 5 in Montana
0.0%
100.0%
Zip Codes with the Highest Poverty Level Among Children Under the Age of 5 in Montana
| Zip Code | Child Poverty | vs State | vs National | |
| 1. | 59088 | 100.0% | 16.3%(+83.7)#1 | 18.1%(+81.9)#71 |
| 2. | 59086 | 100.0% | 16.3%(+83.7)#2 | 18.1%(+81.9)#125 |
| 3. | 59844 | 100.0% | 16.3%(+83.7)#3 | 18.1%(+81.9)#153 |
| 4. | 59414 | 100.0% | 16.3%(+83.7)#4 | 18.1%(+81.9)#171 |
| 5. | 59910 | 100.0% | 16.3%(+83.7)#5 | 18.1%(+81.9)#175 |
| 6. | 59855 | 100.0% | 16.3%(+83.7)#6 | 18.1%(+81.9)#288 |
| 7. | 59927 | 100.0% | 16.3%(+83.7)#7 | 18.1%(+81.9)#319 |
| 8. | 59053 | 100.0% | 16.3%(+83.7)#8 | 18.1%(+81.9)#409 |
| 9. | 59035 | 100.0% | 16.3%(+83.7)#9 | 18.1%(+81.9)#433 |
| 10. | 59258 | 100.0% | 16.3%(+83.7)#10 | 18.1%(+81.9)#438 |
| 11. | 59830 | 100.0% | 16.3%(+83.7)#11 | 18.1%(+81.9)#470 |
| 12. | 59007 | 100.0% | 16.3%(+83.7)#12 | 18.1%(+81.9)#481 |
| 13. | 59012 | 100.0% | 16.3%(+83.7)#13 | 18.1%(+81.9)#537 |
| 14. | 59465 | 100.0% | 16.3%(+83.7)#14 | 18.1%(+81.9)#551 |
| 15. | 59531 | 85.2% | 16.3%(+68.9)#15 | 18.1%(+67.1)#707 |
| 16. | 59036 | 83.3% | 16.3%(+67.1)#16 | 18.1%(+65.3)#740 |
| 17. | 59066 | 80.0% | 16.3%(+63.7)#17 | 18.1%(+61.9)#812 |
| 18. | 59739 | 80.0% | 16.3%(+63.7)#18 | 18.1%(+61.9)#821 |
| 19. | 59322 | 77.3% | 16.3%(+61.0)#19 | 18.1%(+59.2)#892 |
| 20. | 59353 | 75.0% | 16.3%(+58.7)#20 | 18.1%(+56.9)#958 |
| 21. | 59002 | 73.3% | 16.3%(+57.1)#21 | 18.1%(+55.3)#1,038 |
| 22. | 59022 | 71.6% | 16.3%(+55.3)#22 | 18.1%(+53.5)#1,096 |
| 23. | 59068 | 70.9% | 16.3%(+54.6)#23 | 18.1%(+52.8)#1,117 |
| 24. | 59332 | 69.2% | 16.3%(+53.0)#24 | 18.1%(+51.2)#1,187 |
| 25. | 59430 | 68.4% | 16.3%(+52.1)#25 | 18.1%(+50.4)#1,214 |
| 26. | 59831 | 67.2% | 16.3%(+51.0)#26 | 18.1%(+49.2)#1,264 |
| 27. | 59213 | 66.3% | 16.3%(+50.1)#27 | 18.1%(+48.3)#1,328 |
| 28. | 59074 | 64.3% | 16.3%(+48.0)#28 | 18.1%(+46.2)#1,429 |
| 29. | 59487 | 59.6% | 16.3%(+43.3)#29 | 18.1%(+41.5)#1,721 |
| 30. | 59261 | 58.1% | 16.3%(+41.9)#30 | 18.1%(+40.1)#1,815 |
| 31. | 59218 | 58.0% | 16.3%(+41.7)#31 | 18.1%(+39.9)#1,827 |
| 32. | 59089 | 57.9% | 16.3%(+41.6)#32 | 18.1%(+39.8)#1,840 |
| 33. | 59043 | 57.6% | 16.3%(+41.4)#33 | 18.1%(+39.6)#1,855 |
| 34. | 59006 | 56.6% | 16.3%(+40.4)#34 | 18.1%(+38.6)#1,937 |
| 35. | 59448 | 55.4% | 16.3%(+39.1)#35 | 18.1%(+37.3)#2,053 |
| 36. | 59922 | 54.8% | 16.3%(+38.5)#36 | 18.1%(+36.7)#2,083 |
| 37. | 59059 | 53.3% | 16.3%(+37.1)#37 | 18.1%(+35.3)#2,227 |
| 38. | 59003 | 52.8% | 16.3%(+36.6)#38 | 18.1%(+34.8)#2,264 |
| 39. | 59326 | 52.3% | 16.3%(+36.0)#39 | 18.1%(+34.2)#2,322 |
| 40. | 59016 | 50.6% | 16.3%(+34.3)#40 | 18.1%(+32.5)#2,470 |
| 41. | 59254 | 46.8% | 16.3%(+30.5)#41 | 18.1%(+28.7)#2,951 |
| 42. | 59411 | 44.0% | 16.3%(+27.7)#42 | 18.1%(+25.9)#3,338 |
| 43. | 59731 | 43.8% | 16.3%(+27.5)#43 | 18.1%(+25.7)#3,382 |
| 44. | 59422 | 43.2% | 16.3%(+27.0)#44 | 18.1%(+25.2)#3,448 |
| 45. | 59417 | 42.8% | 16.3%(+26.5)#45 | 18.1%(+24.7)#3,525 |
| 46. | 59635 | 41.0% | 16.3%(+24.7)#46 | 18.1%(+22.9)#3,844 |
| 47. | 59914 | 40.6% | 16.3%(+24.3)#47 | 18.1%(+22.6)#3,914 |
| 48. | 59410 | 40.0% | 16.3%(+23.7)#48 | 18.1%(+21.9)#4,022 |
| 49. | 59067 | 38.5% | 16.3%(+22.2)#49 | 18.1%(+20.4)#4,320 |
| 50. | 59754 | 36.7% | 16.3%(+20.4)#50 | 18.1%(+18.6)#4,662 |
| 51. | 59864 | 36.6% | 16.3%(+20.4)#51 | 18.1%(+18.6)#4,673 |
| 52. | 59201 | 36.3% | 16.3%(+20.0)#52 | 18.1%(+18.2)#4,757 |
| 53. | 59527 | 35.9% | 16.3%(+19.6)#53 | 18.1%(+17.8)#4,848 |
| 54. | 59401 | 34.5% | 16.3%(+18.2)#54 | 18.1%(+16.4)#5,187 |
| 55. | 59425 | 34.5% | 16.3%(+18.2)#55 | 18.1%(+16.4)#5,190 |
| 56. | 59418 | 33.3% | 16.3%(+17.1)#56 | 18.1%(+15.3)#5,532 |
| 57. | 59821 | 33.0% | 16.3%(+16.7)#57 | 18.1%(+14.9)#5,592 |
| 58. | 59255 | 30.2% | 16.3%(+13.9)#58 | 18.1%(+12.1)#6,307 |
| 59. | 59456 | 30.0% | 16.3%(+13.7)#59 | 18.1%(+11.9)#6,363 |
| 60. | 59526 | 29.2% | 16.3%(+12.9)#60 | 18.1%(+11.1)#6,595 |
| 61. | 59845 | 28.6% | 16.3%(+12.3)#61 | 18.1%(+10.5)#6,782 |
| 62. | 59522 | 28.2% | 16.3%(+11.9)#62 | 18.1%(+10.1)#6,911 |
| 63. | 59860 | 28.0% | 16.3%(+11.7)#63 | 18.1%(+9.96)#6,959 |
| 64. | 59521 | 28.0% | 16.3%(+11.7)#64 | 18.1%(+9.91)#6,971 |
| 65. | 59248 | 27.8% | 16.3%(+11.5)#65 | 18.1%(+9.71)#7,031 |
| 66. | 59917 | 27.5% | 16.3%(+11.2)#66 | 18.1%(+9.42)#7,138 |
| 67. | 59501 | 27.3% | 16.3%(+11.1)#67 | 18.1%(+9.26)#7,198 |
| 68. | 59212 | 27.3% | 16.3%(+11.0)#68 | 18.1%(+9.21)#7,228 |
| 69. | 59701 | 26.7% | 16.3%(+10.4)#69 | 18.1%(+8.66)#7,394 |
| 70. | 59923 | 26.7% | 16.3%(+10.4)#70 | 18.1%(+8.62)#7,402 |
| 71. | 59865 | 25.9% | 16.3%(+9.64)#71 | 18.1%(+7.85)#7,672 |
| 72. | 59841 | 25.9% | 16.3%(+9.61)#72 | 18.1%(+7.82)#7,685 |
| 73. | 59101 | 25.8% | 16.3%(+9.57)#73 | 18.1%(+7.78)#7,696 |
| 74. | 59050 | 25.4% | 16.3%(+9.10)#74 | 18.1%(+7.31)#7,860 |
| 75. | 59047 | 25.1% | 16.3%(+8.80)#75 | 18.1%(+7.01)#7,954 |
| 76. | 59317 | 23.3% | 16.3%(+6.98)#76 | 18.1%(+5.19)#8,663 |
| 77. | 59225 | 23.2% | 16.3%(+6.91)#77 | 18.1%(+5.13)#8,690 |
| 78. | 59730 | 22.4% | 16.3%(+6.09)#78 | 18.1%(+4.31)#9,013 |
| 79. | 59711 | 21.3% | 16.3%(+5.01)#79 | 18.1%(+3.22)#9,490 |
| 80. | 59759 | 21.3% | 16.3%(+4.98)#80 | 18.1%(+3.20)#9,504 |
| 81. | 59801 | 21.2% | 16.3%(+4.96)#81 | 18.1%(+3.17)#9,517 |
| 82. | 59872 | 20.6% | 16.3%(+4.36)#82 | 18.1%(+2.57)#9,747 |
| 83. | 59828 | 20.1% | 16.3%(+3.82)#83 | 18.1%(+2.03)#9,977 |
| 84. | 59412 | 20.0% | 16.3%(+3.72)#84 | 18.1%(+1.94)#10,027 |
| 85. | 59015 | 20.0% | 16.3%(+3.72)#85 | 18.1%(+1.94)#10,067 |
| 86. | 59840 | 20.0% | 16.3%(+3.70)#86 | 18.1%(+1.91)#10,087 |
| 87. | 59912 | 19.4% | 16.3%(+3.13)#87 | 18.1%(+1.35)#10,305 |
| 88. | 59725 | 19.4% | 16.3%(+3.11)#88 | 18.1%(+1.32)#10,319 |
| 89. | 59405 | 19.3% | 16.3%(+3.06)#89 | 18.1%(+1.28)#10,344 |
| 90. | 59482 | 18.9% | 16.3%(+2.59)#90 | 18.1%(+0.805)#10,564 |
| 91. | 59853 | 18.9% | 16.3%(+2.59)#91 | 18.1%(+0.805)#10,565 |
| 92. | 59446 | 18.7% | 16.3%(+2.39)#92 | 18.1%(+0.604)#10,657 |
| 93. | 59313 | 18.6% | 16.3%(+2.36)#93 | 18.1%(+0.571)#10,673 |
| 94. | 59029 | 17.9% | 16.3%(+1.58)#94 | 18.1%(-0.206)#11,030 |
| 95. | 59520 | 17.8% | 16.3%(+1.50)#95 | 18.1%(-0.285)#11,069 |
| 96. | 59920 | 17.5% | 16.3%(+1.27)#96 | 18.1%(-0.519)#11,186 |
| 97. | 59639 | 17.2% | 16.3%(+0.966)#97 | 18.1%(-0.821)#11,308 |
| 98. | 59859 | 16.8% | 16.3%(+0.524)#98 | 18.1%(-1.26)#11,499 |
| 99. | 59344 | 16.1% | 16.3%(-0.147)#99 | 18.1%(-1.93)#11,848 |
| 100. | 59102 | 16.1% | 16.3%(-0.170)#100 | 18.1%(-1.96)#11,851 |
Common Questions
What are the Top 10 Zip Codes with the Highest Poverty Level Among Children Under the Age of 5 in Montana?
Top 10 Zip Codes with the Highest Poverty Level Among Children Under the Age of 5 in Montana are:
What zip code has the Highest Poverty Level Among Children Under the Age of 5 in Montana?
59088 has the Highest Poverty Level Among Children Under the Age of 5 in Montana with 100.0%.
What is the Poverty Level Among Children Under the Age of 5 in the State of Montana?
Poverty Level Among Children Under the Age of 5 in Montana is 16.3%.
What is the Poverty Level Among Children Under the Age of 5 in the United States?
Poverty Level Among Children Under the Age of 5 in the United States is 18.1%.