Zip Codes with the Highest Poverty Level Among Children Under the Age of 5 in Alaska
RELATED REPORTS & OPTIONS
Highest Poverty | Child 0-5
Alaska
Compare Zip Codes
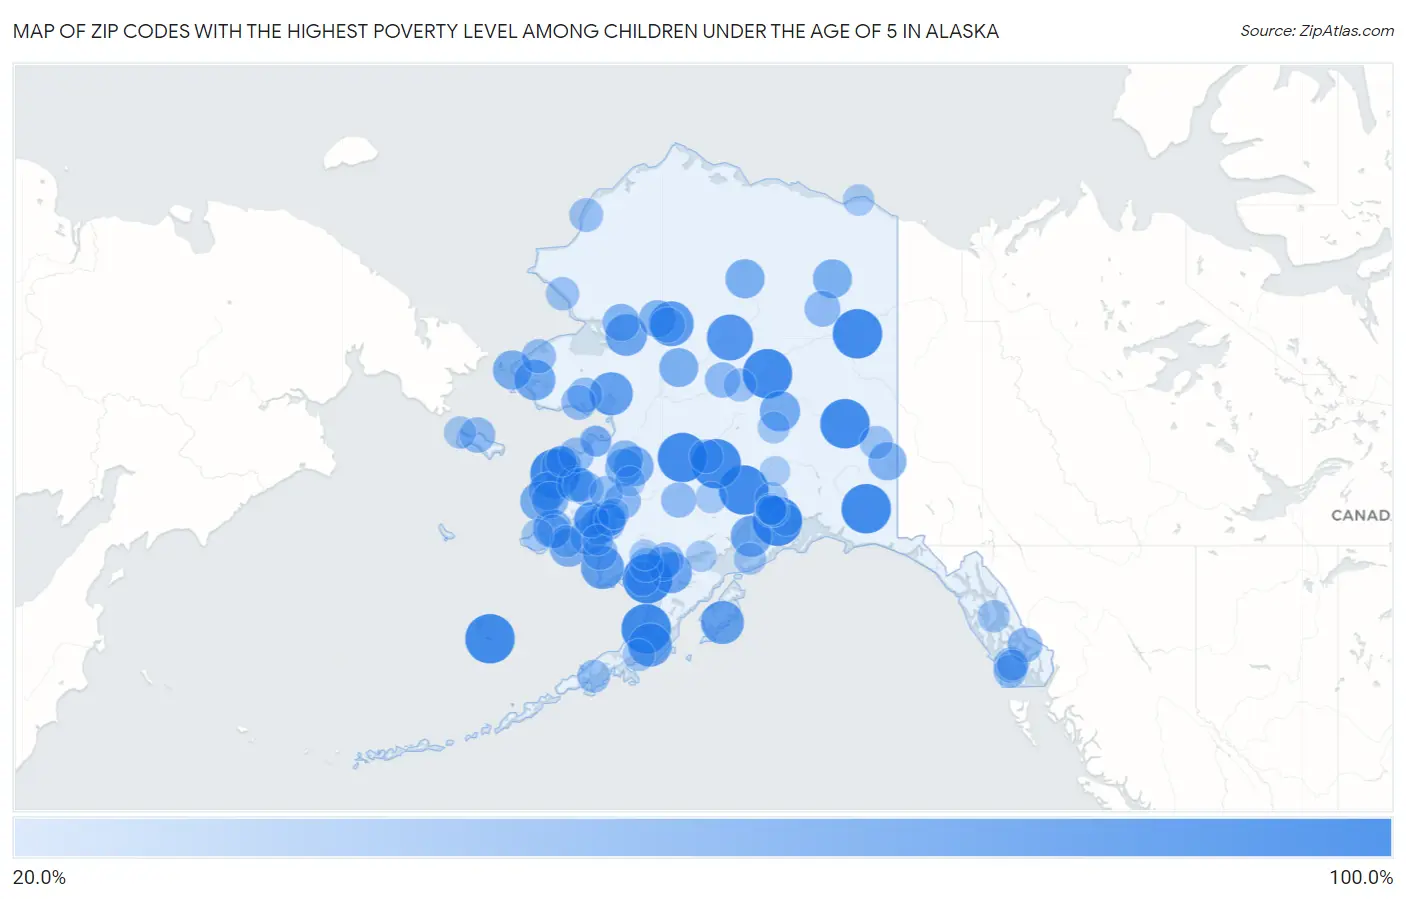
Map of Zip Codes with the Highest Poverty Level Among Children Under the Age of 5 in Alaska
20.0%
100.0%
Zip Codes with the Highest Poverty Level Among Children Under the Age of 5 in Alaska
| Zip Code | Child Poverty | vs State | vs National | |
| 1. | 99605 | 100.0% | 16.9%(+83.1)#1 | 18.1%(+81.9)#467 |
| 2. | 99667 | 100.0% | 16.9%(+83.1)#2 | 18.1%(+81.9)#492 |
| 3. | 99788 | 100.0% | 16.9%(+83.1)#3 | 18.1%(+81.9)#512 |
| 4. | 99691 | 100.0% | 16.9%(+83.1)#4 | 18.1%(+81.9)#516 |
| 5. | 99566 | 100.0% | 16.9%(+83.1)#5 | 18.1%(+81.9)#528 |
| 6. | 99549 | 100.0% | 16.9%(+83.1)#6 | 18.1%(+81.9)#535 |
| 7. | 99666 | 100.0% | 16.9%(+83.1)#7 | 18.1%(+81.9)#539 |
| 8. | 99675 | 100.0% | 16.9%(+83.1)#8 | 18.1%(+81.9)#541 |
| 9. | 99591 | 100.0% | 16.9%(+83.1)#9 | 18.1%(+81.9)#542 |
| 10. | 99767 | 100.0% | 16.9%(+83.1)#10 | 18.1%(+81.9)#550 |
| 11. | 99569 | 100.0% | 16.9%(+83.1)#11 | 18.1%(+81.9)#556 |
| 12. | 99706 | 100.0% | 16.9%(+83.1)#12 | 18.1%(+81.9)#557 |
| 13. | 99720 | 86.0% | 16.9%(+69.2)#13 | 18.1%(+68.0)#688 |
| 14. | 99751 | 81.2% | 16.9%(+64.4)#14 | 18.1%(+63.2)#789 |
| 15. | 99564 | 75.0% | 16.9%(+58.1)#15 | 18.1%(+56.9)#976 |
| 16. | 99753 | 73.9% | 16.9%(+57.0)#16 | 18.1%(+55.9)#1,011 |
| 17. | 99589 | 73.7% | 16.9%(+56.8)#17 | 18.1%(+55.6)#1,024 |
| 18. | 99643 | 73.3% | 16.9%(+56.5)#18 | 18.1%(+55.3)#1,039 |
| 19. | 99770 | 67.9% | 16.9%(+51.1)#19 | 18.1%(+49.9)#1,228 |
| 20. | 99625 | 66.7% | 16.9%(+49.8)#20 | 18.1%(+48.6)#1,317 |
| 21. | 99610 | 64.9% | 16.9%(+48.1)#21 | 18.1%(+46.9)#1,383 |
| 22. | 99785 | 64.0% | 16.9%(+47.1)#22 | 18.1%(+45.9)#1,453 |
| 23. | 99760 | 62.7% | 16.9%(+45.8)#23 | 18.1%(+44.6)#1,516 |
| 24. | 99554 | 60.1% | 16.9%(+43.3)#24 | 18.1%(+42.1)#1,665 |
| 25. | 99665 | 60.0% | 16.9%(+43.1)#25 | 18.1%(+41.9)#1,707 |
| 26. | 99604 | 59.5% | 16.9%(+42.6)#26 | 18.1%(+41.4)#1,731 |
| 27. | 99783 | 58.1% | 16.9%(+41.2)#27 | 18.1%(+40.0)#1,821 |
| 28. | 99721 | 57.6% | 16.9%(+40.7)#28 | 18.1%(+39.5)#1,859 |
| 29. | 99722 | 57.1% | 16.9%(+40.3)#29 | 18.1%(+39.1)#1,894 |
| 30. | 99746 | 57.1% | 16.9%(+40.3)#30 | 18.1%(+39.1)#1,895 |
| 31. | 99681 | 56.3% | 16.9%(+39.5)#31 | 18.1%(+38.3)#1,961 |
| 32. | 99614 | 55.2% | 16.9%(+38.4)#32 | 18.1%(+37.2)#2,058 |
| 33. | 99764 | 53.3% | 16.9%(+36.5)#33 | 18.1%(+35.3)#2,222 |
| 34. | 99662 | 52.9% | 16.9%(+36.0)#34 | 18.1%(+34.8)#2,259 |
| 35. | 99680 | 52.0% | 16.9%(+35.2)#35 | 18.1%(+34.0)#2,339 |
| 36. | 99621 | 50.7% | 16.9%(+33.8)#36 | 18.1%(+32.6)#2,454 |
| 37. | 99749 | 50.0% | 16.9%(+33.1)#37 | 18.1%(+31.9)#2,570 |
| 38. | 99786 | 50.0% | 16.9%(+33.1)#38 | 18.1%(+31.9)#2,585 |
| 39. | 99558 | 50.0% | 16.9%(+33.1)#39 | 18.1%(+31.9)#2,616 |
| 40. | 99563 | 47.8% | 16.9%(+31.0)#40 | 18.1%(+29.8)#2,834 |
| 41. | 99590 | 47.6% | 16.9%(+30.8)#41 | 18.1%(+29.6)#2,861 |
| 42. | 99551 | 46.6% | 16.9%(+29.7)#42 | 18.1%(+28.5)#2,974 |
| 43. | 99634 | 46.3% | 16.9%(+29.4)#43 | 18.1%(+28.2)#3,006 |
| 44. | 99632 | 45.0% | 16.9%(+28.1)#44 | 18.1%(+26.9)#3,183 |
| 45. | 99641 | 44.7% | 16.9%(+27.8)#45 | 18.1%(+26.7)#3,218 |
| 46. | 99626 | 44.4% | 16.9%(+27.6)#46 | 18.1%(+26.4)#3,275 |
| 47. | 99781 | 44.4% | 16.9%(+27.6)#47 | 18.1%(+26.4)#3,280 |
| 48. | 99773 | 42.9% | 16.9%(+26.0)#48 | 18.1%(+24.8)#3,518 |
| 49. | 99769 | 42.4% | 16.9%(+25.6)#49 | 18.1%(+24.4)#3,589 |
| 50. | 99925 | 42.3% | 16.9%(+25.4)#50 | 18.1%(+24.2)#3,605 |
| 51. | 99768 | 42.3% | 16.9%(+25.4)#51 | 18.1%(+24.2)#3,608 |
| 52. | 99636 | 41.9% | 16.9%(+25.0)#52 | 18.1%(+23.8)#3,677 |
| 53. | 99557 | 41.7% | 16.9%(+24.8)#53 | 18.1%(+23.6)#3,721 |
| 54. | 99655 | 41.1% | 16.9%(+24.2)#54 | 18.1%(+23.0)#3,818 |
| 55. | 99609 | 40.8% | 16.9%(+23.9)#55 | 18.1%(+22.8)#3,865 |
| 56. | 99620 | 40.4% | 16.9%(+23.5)#56 | 18.1%(+22.3)#3,951 |
| 57. | 99929 | 40.1% | 16.9%(+23.3)#57 | 18.1%(+22.1)#3,988 |
| 58. | 99739 | 40.0% | 16.9%(+23.1)#58 | 18.1%(+21.9)#4,031 |
| 59. | 99784 | 40.0% | 16.9%(+23.1)#59 | 18.1%(+21.9)#4,036 |
| 60. | 99580 | 40.0% | 16.9%(+23.1)#60 | 18.1%(+21.9)#4,041 |
| 61. | 99628 | 39.7% | 16.9%(+22.8)#61 | 18.1%(+21.6)#4,092 |
| 62. | 99772 | 38.0% | 16.9%(+21.1)#62 | 18.1%(+19.9)#4,410 |
| 63. | 99650 | 37.8% | 16.9%(+21.0)#63 | 18.1%(+19.8)#4,442 |
| 64. | 99658 | 37.7% | 16.9%(+20.9)#64 | 18.1%(+19.7)#4,454 |
| 65. | 99555 | 37.5% | 16.9%(+20.6)#65 | 18.1%(+19.4)#4,503 |
| 66. | 99627 | 36.4% | 16.9%(+19.5)#66 | 18.1%(+18.3)#4,743 |
| 67. | 99759 | 35.7% | 16.9%(+18.8)#67 | 18.1%(+17.7)#4,900 |
| 68. | 99657 | 34.8% | 16.9%(+17.9)#68 | 18.1%(+16.7)#5,124 |
| 69. | 99637 | 34.6% | 16.9%(+17.8)#69 | 18.1%(+16.6)#5,150 |
| 70. | 99750 | 34.1% | 16.9%(+17.3)#70 | 18.1%(+16.1)#5,273 |
| 71. | 99780 | 34.1% | 16.9%(+17.2)#71 | 18.1%(+16.0)#5,281 |
| 72. | 99694 | 33.3% | 16.9%(+16.5)#72 | 18.1%(+15.3)#5,466 |
| 73. | 99922 | 33.3% | 16.9%(+16.5)#73 | 18.1%(+15.3)#5,519 |
| 74. | 99777 | 33.3% | 16.9%(+16.5)#74 | 18.1%(+15.3)#5,527 |
| 75. | 99612 | 32.4% | 16.9%(+15.6)#75 | 18.1%(+14.4)#5,730 |
| 76. | 99820 | 30.6% | 16.9%(+13.7)#76 | 18.1%(+12.5)#6,202 |
| 77. | 99742 | 30.3% | 16.9%(+13.4)#77 | 18.1%(+12.2)#6,267 |
| 78. | 99508 | 30.2% | 16.9%(+13.4)#78 | 18.1%(+12.2)#6,288 |
| 79. | 99648 | 30.0% | 16.9%(+13.1)#79 | 18.1%(+11.9)#6,365 |
| 80. | 99561 | 29.8% | 16.9%(+13.0)#80 | 18.1%(+11.8)#6,398 |
| 81. | 99603 | 29.8% | 16.9%(+12.9)#81 | 18.1%(+11.7)#6,416 |
| 82. | 99743 | 29.2% | 16.9%(+12.3)#82 | 18.1%(+11.1)#6,607 |
| 83. | 99587 | 28.8% | 16.9%(+11.9)#83 | 18.1%(+10.8)#6,702 |
| 84. | 99630 | 28.6% | 16.9%(+11.7)#84 | 18.1%(+10.5)#6,799 |
| 85. | 99552 | 27.6% | 16.9%(+10.7)#85 | 18.1%(+9.52)#7,113 |
| 86. | 99503 | 27.4% | 16.9%(+10.5)#86 | 18.1%(+9.32)#7,173 |
| 87. | 99506 | 27.2% | 16.9%(+10.3)#87 | 18.1%(+9.14)#7,246 |
| 88. | 99671 | 26.7% | 16.9%(+9.80)#88 | 18.1%(+8.60)#7,420 |
| 89. | 99747 | 26.7% | 16.9%(+9.80)#89 | 18.1%(+8.60)#7,429 |
| 90. | 99606 | 26.1% | 16.9%(+9.22)#90 | 18.1%(+8.02)#7,622 |
| 91. | 99921 | 25.4% | 16.9%(+8.56)#91 | 18.1%(+7.36)#7,848 |
| 92. | 99504 | 25.3% | 16.9%(+8.39)#92 | 18.1%(+7.19)#7,899 |
| 93. | 99578 | 25.0% | 16.9%(+8.13)#93 | 18.1%(+6.94)#8,022 |
| 94. | 99679 | 25.0% | 16.9%(+8.13)#94 | 18.1%(+6.94)#8,023 |
| 95. | 99576 | 24.9% | 16.9%(+8.01)#95 | 18.1%(+6.81)#8,070 |
| 96. | 99581 | 24.5% | 16.9%(+7.66)#96 | 18.1%(+6.47)#8,167 |
| 97. | 99659 | 23.5% | 16.9%(+6.66)#97 | 18.1%(+5.47)#8,577 |
| 98. | 99501 | 23.0% | 16.9%(+6.10)#98 | 18.1%(+4.91)#8,779 |
| 99. | 99676 | 22.2% | 16.9%(+5.36)#99 | 18.1%(+4.16)#9,083 |
| 100. | 99602 | 22.2% | 16.9%(+5.36)#100 | 18.1%(+4.16)#9,105 |
Common Questions
What are the Top 10 Zip Codes with the Highest Poverty Level Among Children Under the Age of 5 in Alaska?
Top 10 Zip Codes with the Highest Poverty Level Among Children Under the Age of 5 in Alaska are:
What zip code has the Highest Poverty Level Among Children Under the Age of 5 in Alaska?
99605 has the Highest Poverty Level Among Children Under the Age of 5 in Alaska with 100.0%.
What is the Poverty Level Among Children Under the Age of 5 in the State of Alaska?
Poverty Level Among Children Under the Age of 5 in Alaska is 16.9%.
What is the Poverty Level Among Children Under the Age of 5 in the United States?
Poverty Level Among Children Under the Age of 5 in the United States is 18.1%.