Zip Codes with the Highest Poverty Level Among Children Under the Age of 5 in Puerto Rico
RELATED REPORTS & OPTIONS
Highest Poverty | Child 0-5
Puerto Rico
Compare Zip Codes
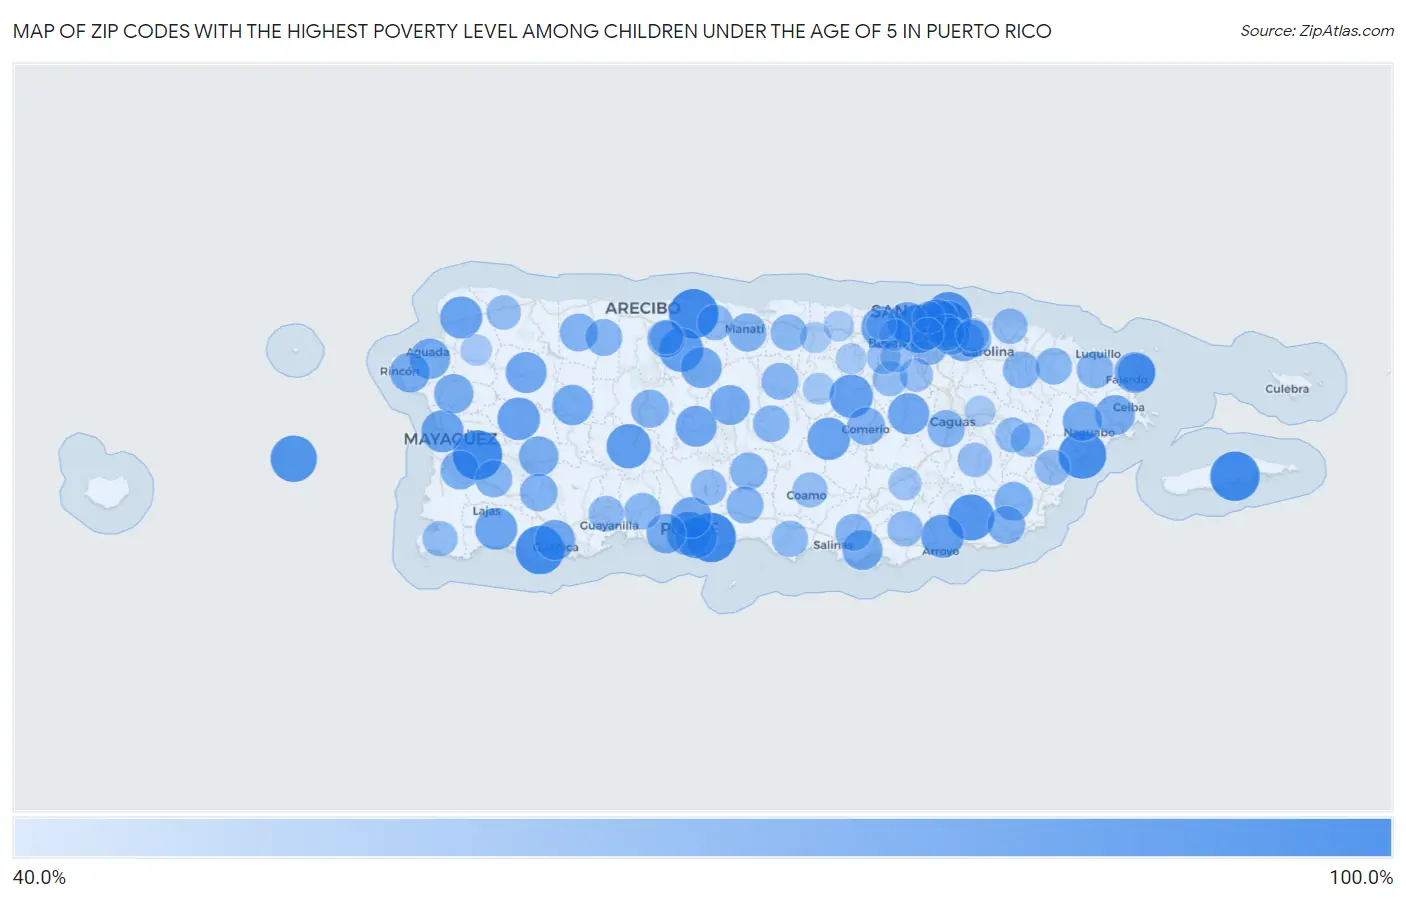
Map of Zip Codes with the Highest Poverty Level Among Children Under the Age of 5 in Puerto Rico
40.0%
100.0%
Zip Codes with the Highest Poverty Level Among Children Under the Age of 5 in Puerto Rico
| Zip Code | Child Poverty | vs State | vs National | |
| 1. | 00765 | 100.0% | 61.4%(+38.6)#1 | 18.1%(+81.9)#2 |
| 2. | 00652 | 100.0% | 61.4%(+38.6)#2 | 18.1%(+81.9)#9 |
| 3. | 00715 | 100.0% | 61.4%(+38.6)#3 | 18.1%(+81.9)#23 |
| 4. | 00636 | 100.0% | 61.4%(+38.6)#4 | 18.1%(+81.9)#83 |
| 5. | 00647 | 97.3% | 61.4%(+35.9)#5 | 18.1%(+79.2)#564 |
| 6. | 00965 | 96.4% | 61.4%(+35.1)#6 | 18.1%(+78.4)#567 |
| 7. | 00741 | 94.5% | 61.4%(+33.1)#7 | 18.1%(+76.4)#588 |
| 8. | 00680 | 91.3% | 61.4%(+29.9)#8 | 18.1%(+73.2)#625 |
| 9. | 00913 | 90.8% | 61.4%(+29.4)#9 | 18.1%(+72.7)#630 |
| 10. | 00723 | 90.7% | 61.4%(+29.3)#10 | 18.1%(+72.6)#631 |
| 11. | 00915 | 90.4% | 61.4%(+29.0)#11 | 18.1%(+72.3)#635 |
| 12. | 00601 | 85.3% | 61.4%(+23.9)#12 | 18.1%(+67.2)#701 |
| 13. | 00909 | 84.7% | 61.4%(+23.3)#13 | 18.1%(+66.6)#712 |
| 14. | 00717 | 84.5% | 61.4%(+23.1)#14 | 18.1%(+66.4)#720 |
| 15. | 00688 | 84.4% | 61.4%(+23.0)#15 | 18.1%(+66.4)#722 |
| 16. | 00719 | 82.3% | 61.4%(+20.9)#16 | 18.1%(+64.3)#764 |
| 17. | 00714 | 81.5% | 61.4%(+20.1)#17 | 18.1%(+63.4)#779 |
| 18. | 00670 | 80.8% | 61.4%(+19.4)#18 | 18.1%(+62.7)#796 |
| 19. | 00794 | 80.1% | 61.4%(+18.7)#19 | 18.1%(+62.0)#805 |
| 20. | 00952 | 79.8% | 61.4%(+18.4)#20 | 18.1%(+61.7)#829 |
| 21. | 00682 | 79.4% | 61.4%(+18.0)#21 | 18.1%(+61.3)#834 |
| 22. | 00603 | 79.3% | 61.4%(+17.9)#22 | 18.1%(+61.2)#837 |
| 23. | 00667 | 79.0% | 61.4%(+17.6)#23 | 18.1%(+60.9)#844 |
| 24. | 00716 | 78.6% | 61.4%(+17.2)#24 | 18.1%(+60.5)#856 |
| 25. | 00703 | 76.9% | 61.4%(+15.5)#25 | 18.1%(+58.9)#898 |
| 26. | 00685 | 76.3% | 61.4%(+14.9)#26 | 18.1%(+58.3)#917 |
| 27. | 00664 | 76.3% | 61.4%(+14.9)#27 | 18.1%(+58.2)#921 |
| 28. | 00650 | 76.0% | 61.4%(+14.6)#28 | 18.1%(+57.9)#928 |
| 29. | 00962 | 75.9% | 61.4%(+14.5)#29 | 18.1%(+57.8)#931 |
| 30. | 00738 | 75.8% | 61.4%(+14.4)#30 | 18.1%(+57.7)#934 |
| 31. | 00730 | 75.8% | 61.4%(+14.4)#31 | 18.1%(+57.7)#936 |
| 32. | 00602 | 74.5% | 61.4%(+13.2)#32 | 18.1%(+56.5)#983 |
| 33. | 00669 | 74.1% | 61.4%(+12.8)#33 | 18.1%(+56.1)#1,001 |
| 34. | 00653 | 73.9% | 61.4%(+12.5)#34 | 18.1%(+55.9)#1,009 |
| 35. | 00924 | 73.7% | 61.4%(+12.3)#35 | 18.1%(+55.6)#1,025 |
| 36. | 00677 | 73.4% | 61.4%(+12.0)#36 | 18.1%(+55.3)#1,033 |
| 37. | 00704 | 73.4% | 61.4%(+12.0)#37 | 18.1%(+55.3)#1,034 |
| 38. | 00638 | 73.2% | 61.4%(+11.8)#38 | 18.1%(+55.2)#1,042 |
| 39. | 00735 | 73.1% | 61.4%(+11.7)#39 | 18.1%(+55.1)#1,046 |
| 40. | 00606 | 72.5% | 61.4%(+11.2)#40 | 18.1%(+54.5)#1,064 |
| 41. | 00718 | 72.3% | 61.4%(+10.9)#41 | 18.1%(+54.2)#1,072 |
| 42. | 00728 | 72.3% | 61.4%(+10.9)#42 | 18.1%(+54.2)#1,074 |
| 43. | 00610 | 72.0% | 61.4%(+10.6)#43 | 18.1%(+53.9)#1,087 |
| 44. | 00660 | 70.4% | 61.4%(+9.04)#44 | 18.1%(+52.4)#1,136 |
| 45. | 00767 | 69.5% | 61.4%(+8.15)#45 | 18.1%(+51.5)#1,171 |
| 46. | 00740 | 68.8% | 61.4%(+7.41)#46 | 18.1%(+50.7)#1,199 |
| 47. | 00674 | 68.3% | 61.4%(+6.95)#47 | 18.1%(+50.3)#1,219 |
| 48. | 00612 | 67.9% | 61.4%(+6.53)#48 | 18.1%(+49.9)#1,231 |
| 49. | 00641 | 67.8% | 61.4%(+6.41)#49 | 18.1%(+49.7)#1,235 |
| 50. | 00627 | 67.8% | 61.4%(+6.36)#50 | 18.1%(+49.7)#1,239 |
| 51. | 00707 | 67.7% | 61.4%(+6.30)#51 | 18.1%(+49.6)#1,241 |
| 52. | 00782 | 67.5% | 61.4%(+6.13)#52 | 18.1%(+49.5)#1,254 |
| 53. | 00637 | 67.0% | 61.4%(+5.62)#53 | 18.1%(+48.9)#1,270 |
| 54. | 00982 | 66.5% | 61.4%(+5.11)#54 | 18.1%(+48.4)#1,323 |
| 55. | 00921 | 66.4% | 61.4%(+4.98)#55 | 18.1%(+48.3)#1,325 |
| 56. | 00725 | 66.0% | 61.4%(+4.58)#56 | 18.1%(+47.9)#1,343 |
| 57. | 00766 | 65.9% | 61.4%(+4.55)#57 | 18.1%(+47.9)#1,345 |
| 58. | 00923 | 65.9% | 61.4%(+4.47)#58 | 18.1%(+47.8)#1,350 |
| 59. | 00683 | 65.6% | 61.4%(+4.18)#59 | 18.1%(+47.5)#1,360 |
| 60. | 00687 | 65.1% | 61.4%(+3.71)#60 | 18.1%(+47.0)#1,374 |
| 61. | 00795 | 65.1% | 61.4%(+3.71)#61 | 18.1%(+47.0)#1,375 |
| 62. | 00659 | 65.0% | 61.4%(+3.64)#62 | 18.1%(+47.0)#1,378 |
| 63. | 00729 | 64.9% | 61.4%(+3.52)#63 | 18.1%(+46.8)#1,389 |
| 64. | 00751 | 64.8% | 61.4%(+3.41)#64 | 18.1%(+46.7)#1,395 |
| 65. | 00720 | 64.3% | 61.4%(+2.95)#65 | 18.1%(+46.3)#1,421 |
| 66. | 00773 | 64.3% | 61.4%(+2.94)#66 | 18.1%(+46.3)#1,422 |
| 67. | 00745 | 64.3% | 61.4%(+2.87)#67 | 18.1%(+46.2)#1,434 |
| 68. | 00624 | 63.9% | 61.4%(+2.51)#68 | 18.1%(+45.8)#1,456 |
| 69. | 00917 | 63.8% | 61.4%(+2.42)#69 | 18.1%(+45.7)#1,461 |
| 70. | 00693 | 63.4% | 61.4%(+1.98)#70 | 18.1%(+45.3)#1,480 |
| 71. | 00757 | 62.9% | 61.4%(+1.48)#71 | 18.1%(+44.8)#1,505 |
| 72. | 00780 | 61.8% | 61.4%(+0.438)#72 | 18.1%(+43.8)#1,568 |
| 73. | 00617 | 61.6% | 61.4%(+0.218)#73 | 18.1%(+43.5)#1,584 |
| 74. | 00791 | 61.5% | 61.4%(+0.083)#74 | 18.1%(+43.4)#1,601 |
| 75. | 00656 | 61.4% | 61.4%(-0.021)#75 | 18.1%(+43.3)#1,605 |
| 76. | 00784 | 61.0% | 61.4%(-0.420)#76 | 18.1%(+42.9)#1,625 |
| 77. | 00772 | 60.7% | 61.4%(-0.679)#77 | 18.1%(+42.6)#1,642 |
| 78. | 00622 | 60.0% | 61.4%(-1.39)#78 | 18.1%(+41.9)#1,670 |
| 79. | 00769 | 59.9% | 61.4%(-1.49)#79 | 18.1%(+41.8)#1,709 |
| 80. | 00956 | 59.6% | 61.4%(-1.74)#80 | 18.1%(+41.6)#1,718 |
| 81. | 00777 | 59.2% | 61.4%(-2.21)#81 | 18.1%(+41.1)#1,754 |
| 82. | 00754 | 58.0% | 61.4%(-3.34)#82 | 18.1%(+40.0)#1,823 |
| 83. | 00662 | 58.0% | 61.4%(-3.40)#83 | 18.1%(+39.9)#1,828 |
| 84. | 00771 | 57.4% | 61.4%(-4.03)#84 | 18.1%(+39.3)#1,872 |
| 85. | 00616 | 56.2% | 61.4%(-5.19)#85 | 18.1%(+38.1)#1,973 |
| 86. | 00971 | 56.0% | 61.4%(-5.38)#86 | 18.1%(+37.9)#1,986 |
| 87. | 00957 | 56.0% | 61.4%(-5.42)#87 | 18.1%(+37.9)#1,991 |
| 88. | 00983 | 55.0% | 61.4%(-6.34)#88 | 18.1%(+37.0)#2,065 |
| 89. | 00736 | 54.2% | 61.4%(-7.23)#89 | 18.1%(+36.1)#2,129 |
| 90. | 00907 | 52.8% | 61.4%(-8.63)#90 | 18.1%(+34.7)#2,274 |
| 91. | 00920 | 52.4% | 61.4%(-9.03)#91 | 18.1%(+34.3)#2,315 |
| 92. | 00959 | 52.2% | 61.4%(-9.14)#92 | 18.1%(+34.2)#2,324 |
| 93. | 00783 | 51.1% | 61.4%(-10.3)#93 | 18.1%(+33.0)#2,417 |
| 94. | 00961 | 50.8% | 61.4%(-10.6)#94 | 18.1%(+32.7)#2,443 |
| 95. | 00676 | 49.9% | 61.4%(-11.5)#95 | 18.1%(+31.8)#2,620 |
| 96. | 00692 | 49.4% | 61.4%(-12.0)#96 | 18.1%(+31.3)#2,651 |
| 97. | 00953 | 48.9% | 61.4%(-12.5)#97 | 18.1%(+30.8)#2,706 |
| 98. | 00778 | 48.6% | 61.4%(-12.8)#98 | 18.1%(+30.6)#2,740 |
| 99. | 00646 | 47.5% | 61.4%(-13.9)#99 | 18.1%(+29.4)#2,872 |
| 100. | 00949 | 46.7% | 61.4%(-14.7)#100 | 18.1%(+28.7)#2,957 |
1
2Common Questions
What are the Top 10 Zip Codes with the Highest Poverty Level Among Children Under the Age of 5 in Puerto Rico?
Top 10 Zip Codes with the Highest Poverty Level Among Children Under the Age of 5 in Puerto Rico are:
What zip code has the Highest Poverty Level Among Children Under the Age of 5 in Puerto Rico?
00765 has the Highest Poverty Level Among Children Under the Age of 5 in Puerto Rico with 100.0%.
What is the Poverty Level Among Children Under the Age of 5 in the State of Puerto Rico?
Poverty Level Among Children Under the Age of 5 in Puerto Rico is 61.4%.
What is the Poverty Level Among Children Under the Age of 5 in the United States?
Poverty Level Among Children Under the Age of 5 in the United States is 18.1%.