Zip Codes with the Highest Poverty Level Among Children Under the Age of 5 in Hawaii
RELATED REPORTS & OPTIONS
Highest Poverty | Child 0-5
Hawaii
Compare Zip Codes
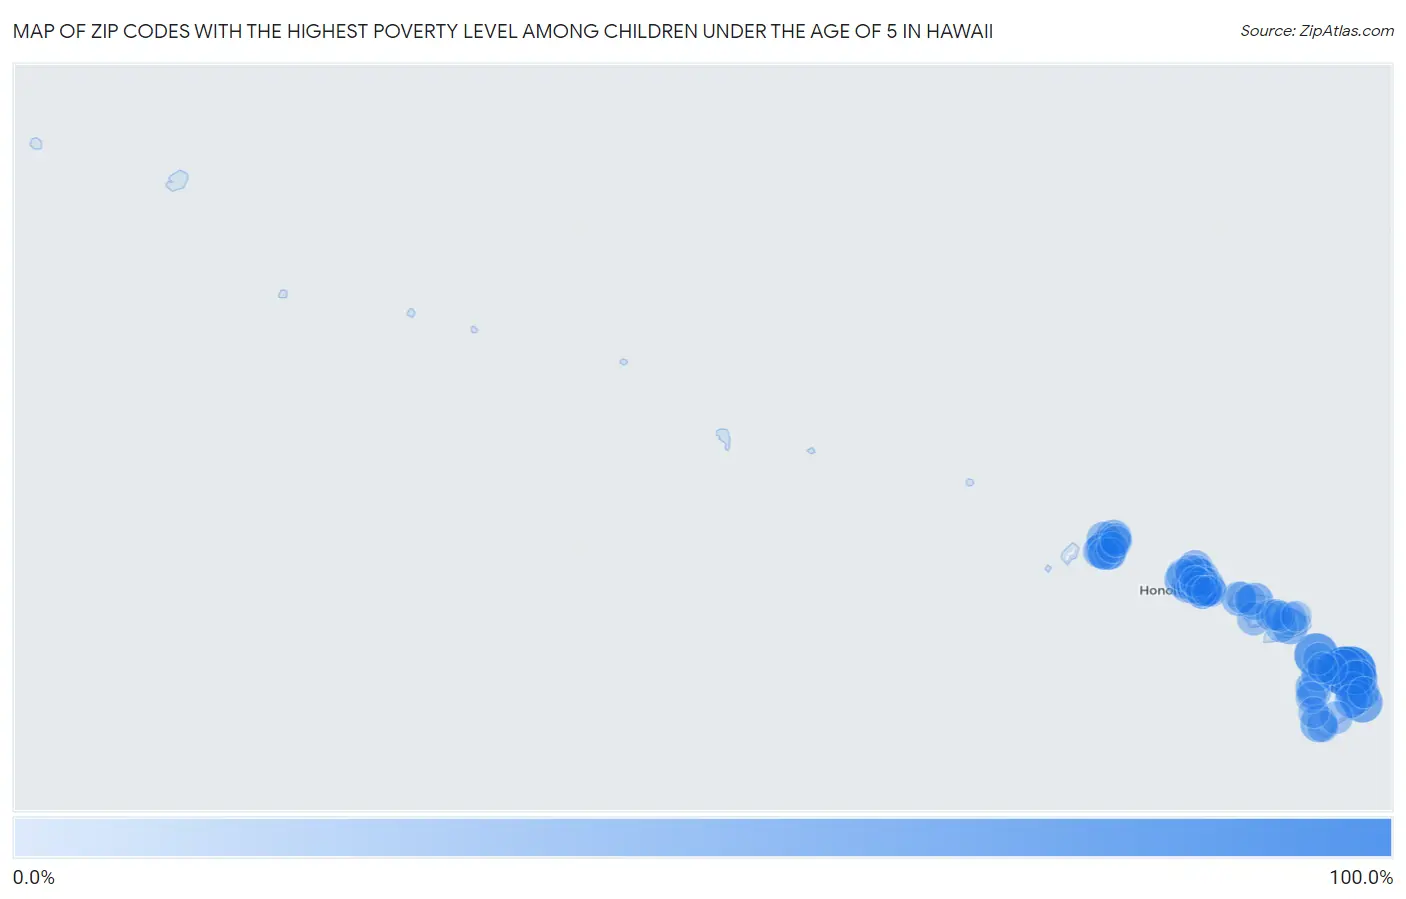
Map of Zip Codes with the Highest Poverty Level Among Children Under the Age of 5 in Hawaii
0.0%
100.0%
Zip Codes with the Highest Poverty Level Among Children Under the Age of 5 in Hawaii
| Zip Code | Child Poverty | vs State | vs National | |
| 1. | 96780 | 100.0% | 12.7%(+87.3)#1 | 18.1%(+81.9)#250 |
| 2. | 96774 | 100.0% | 12.7%(+87.3)#2 | 18.1%(+81.9)#335 |
| 3. | 96719 | 69.2% | 12.7%(+56.5)#3 | 18.1%(+51.2)#1,181 |
| 4. | 96778 | 50.6% | 12.7%(+37.9)#4 | 18.1%(+32.5)#2,472 |
| 5. | 96741 | 50.5% | 12.7%(+37.7)#5 | 18.1%(+32.4)#2,482 |
| 6. | 96783 | 48.5% | 12.7%(+35.8)#6 | 18.1%(+30.5)#2,752 |
| 7. | 96776 | 43.5% | 12.7%(+30.8)#7 | 18.1%(+25.5)#3,402 |
| 8. | 96737 | 33.7% | 12.7%(+21.0)#8 | 18.1%(+15.7)#5,367 |
| 9. | 96748 | 33.0% | 12.7%(+20.3)#9 | 18.1%(+15.0)#5,584 |
| 10. | 96792 | 29.7% | 12.7%(+16.9)#10 | 18.1%(+11.6)#6,455 |
| 11. | 96790 | 29.5% | 12.7%(+16.7)#11 | 18.1%(+11.4)#6,513 |
| 12. | 96819 | 28.5% | 12.7%(+15.8)#12 | 18.1%(+10.5)#6,811 |
| 13. | 96720 | 28.0% | 12.7%(+15.2)#13 | 18.1%(+9.92)#6,967 |
| 14. | 96754 | 26.5% | 12.7%(+13.8)#14 | 18.1%(+8.47)#7,467 |
| 15. | 96822 | 24.3% | 12.7%(+11.6)#15 | 18.1%(+6.23)#8,249 |
| 16. | 96826 | 23.1% | 12.7%(+10.3)#16 | 18.1%(+5.00)#8,749 |
| 17. | 96731 | 22.7% | 12.7%(+9.99)#17 | 18.1%(+4.66)#8,868 |
| 18. | 96730 | 21.5% | 12.7%(+8.78)#18 | 18.1%(+3.46)#9,377 |
| 19. | 96770 | 20.7% | 12.7%(+7.95)#19 | 18.1%(+2.63)#9,727 |
| 20. | 96771 | 20.4% | 12.7%(+7.71)#20 | 18.1%(+2.39)#9,825 |
| 21. | 96725 | 20.0% | 12.7%(+7.26)#21 | 18.1%(+1.94)#10,006 |
| 22. | 96740 | 19.7% | 12.7%(+7.01)#22 | 18.1%(+1.69)#10,159 |
| 23. | 96714 | 19.5% | 12.7%(+6.78)#23 | 18.1%(+1.45)#10,262 |
| 24. | 96728 | 17.9% | 12.7%(+5.12)#24 | 18.1%(-0.206)#11,032 |
| 25. | 96717 | 17.7% | 12.7%(+4.98)#25 | 18.1%(-0.346)#11,095 |
| 26. | 96769 | 17.6% | 12.7%(+4.91)#26 | 18.1%(-0.416)#11,143 |
| 27. | 96768 | 17.3% | 12.7%(+4.61)#27 | 18.1%(-0.718)#11,261 |
| 28. | 96817 | 15.7% | 12.7%(+3.01)#28 | 18.1%(-2.32)#12,055 |
| 29. | 96763 | 15.4% | 12.7%(+2.65)#29 | 18.1%(-2.68)#12,224 |
| 30. | 96785 | 15.1% | 12.7%(+2.35)#30 | 18.1%(-2.98)#12,411 |
| 31. | 96797 | 14.5% | 12.7%(+1.72)#31 | 18.1%(-3.61)#12,752 |
| 32. | 96707 | 13.1% | 12.7%(+0.412)#32 | 18.1%(-4.91)#13,545 |
| 33. | 96777 | 12.9% | 12.7%(+0.138)#33 | 18.1%(-5.19)#13,701 |
| 34. | 96815 | 12.2% | 12.7%(-0.547)#34 | 18.1%(-5.87)#14,109 |
| 35. | 96753 | 11.1% | 12.7%(-1.61)#35 | 18.1%(-6.93)#14,738 |
| 36. | 96813 | 10.9% | 12.7%(-1.81)#36 | 18.1%(-7.14)#14,876 |
| 37. | 96786 | 10.6% | 12.7%(-2.13)#37 | 18.1%(-7.46)#15,052 |
| 38. | 96738 | 10.5% | 12.7%(-2.24)#38 | 18.1%(-7.57)#15,121 |
| 39. | 96762 | 10.3% | 12.7%(-2.47)#39 | 18.1%(-7.79)#15,253 |
| 40. | 96727 | 9.6% | 12.7%(-3.17)#40 | 18.1%(-8.50)#15,663 |
| 41. | 96791 | 9.1% | 12.7%(-3.60)#41 | 18.1%(-8.93)#15,958 |
| 42. | 96703 | 8.6% | 12.7%(-4.18)#42 | 18.1%(-9.50)#16,379 |
| 43. | 96706 | 8.5% | 12.7%(-4.19)#43 | 18.1%(-9.52)#16,385 |
| 44. | 96755 | 8.5% | 12.7%(-4.25)#44 | 18.1%(-9.57)#16,420 |
| 45. | 96772 | 8.2% | 12.7%(-4.56)#45 | 18.1%(-9.89)#16,652 |
| 46. | 96756 | 7.8% | 12.7%(-4.97)#46 | 18.1%(-10.3)#16,896 |
| 47. | 96761 | 7.7% | 12.7%(-5.08)#47 | 18.1%(-10.4)#16,968 |
| 48. | 96734 | 7.2% | 12.7%(-5.51)#48 | 18.1%(-10.8)#17,233 |
| 49. | 96816 | 7.2% | 12.7%(-5.58)#49 | 18.1%(-10.9)#17,273 |
| 50. | 96782 | 7.0% | 12.7%(-5.72)#50 | 18.1%(-11.1)#17,376 |
| 51. | 96795 | 6.9% | 12.7%(-5.87)#51 | 18.1%(-11.2)#17,477 |
| 52. | 96705 | 6.8% | 12.7%(-5.89)#52 | 18.1%(-11.2)#17,492 |
| 53. | 96825 | 6.0% | 12.7%(-6.74)#53 | 18.1%(-12.1)#18,084 |
| 54. | 96793 | 5.9% | 12.7%(-6.79)#54 | 18.1%(-12.1)#18,105 |
| 55. | 96744 | 5.9% | 12.7%(-6.83)#55 | 18.1%(-12.2)#18,131 |
| 56. | 96818 | 5.9% | 12.7%(-6.86)#56 | 18.1%(-12.2)#18,182 |
| 57. | 96749 | 5.9% | 12.7%(-6.89)#57 | 18.1%(-12.2)#18,191 |
| 58. | 96701 | 5.6% | 12.7%(-7.09)#58 | 18.1%(-12.4)#18,321 |
| 59. | 96729 | 5.0% | 12.7%(-7.74)#59 | 18.1%(-13.1)#18,769 |
| 60. | 96766 | 4.7% | 12.7%(-7.99)#60 | 18.1%(-13.3)#18,950 |
| 61. | 96746 | 4.7% | 12.7%(-8.05)#61 | 18.1%(-13.4)#18,988 |
| 62. | 96750 | 4.7% | 12.7%(-8.08)#62 | 18.1%(-13.4)#19,002 |
| 63. | 96757 | 4.0% | 12.7%(-8.74)#63 | 18.1%(-14.1)#19,505 |
| 64. | 96704 | 4.0% | 12.7%(-8.77)#64 | 18.1%(-14.1)#19,530 |
| 65. | 96732 | 3.7% | 12.7%(-9.07)#65 | 18.1%(-14.4)#19,740 |
| 66. | 96712 | 2.5% | 12.7%(-10.2)#66 | 18.1%(-15.5)#20,488 |
| 67. | 96789 | 2.5% | 12.7%(-10.2)#67 | 18.1%(-15.6)#20,509 |
| 68. | 96814 | 2.2% | 12.7%(-10.5)#68 | 18.1%(-15.8)#20,681 |
| 69. | 96821 | 1.9% | 12.7%(-10.8)#69 | 18.1%(-16.2)#20,912 |
| 70. | 96708 | 1.1% | 12.7%(-11.6)#70 | 18.1%(-16.9)#21,329 |
| 71. | 96743 | 0.56% | 12.7%(-12.2)#71 | 18.1%(-17.5)#21,594 |
1
Common Questions
What are the Top 10 Zip Codes with the Highest Poverty Level Among Children Under the Age of 5 in Hawaii?
Top 10 Zip Codes with the Highest Poverty Level Among Children Under the Age of 5 in Hawaii are:
What zip code has the Highest Poverty Level Among Children Under the Age of 5 in Hawaii?
96780 has the Highest Poverty Level Among Children Under the Age of 5 in Hawaii with 100.0%.
What is the Poverty Level Among Children Under the Age of 5 in the State of Hawaii?
Poverty Level Among Children Under the Age of 5 in Hawaii is 12.7%.
What is the Poverty Level Among Children Under the Age of 5 in the United States?
Poverty Level Among Children Under the Age of 5 in the United States is 18.1%.