Zip Codes with the Highest Poverty Level Among Children Under the Age of 5 in Nevada
RELATED REPORTS & OPTIONS
Highest Poverty | Child 0-5
Nevada
Compare Zip Codes
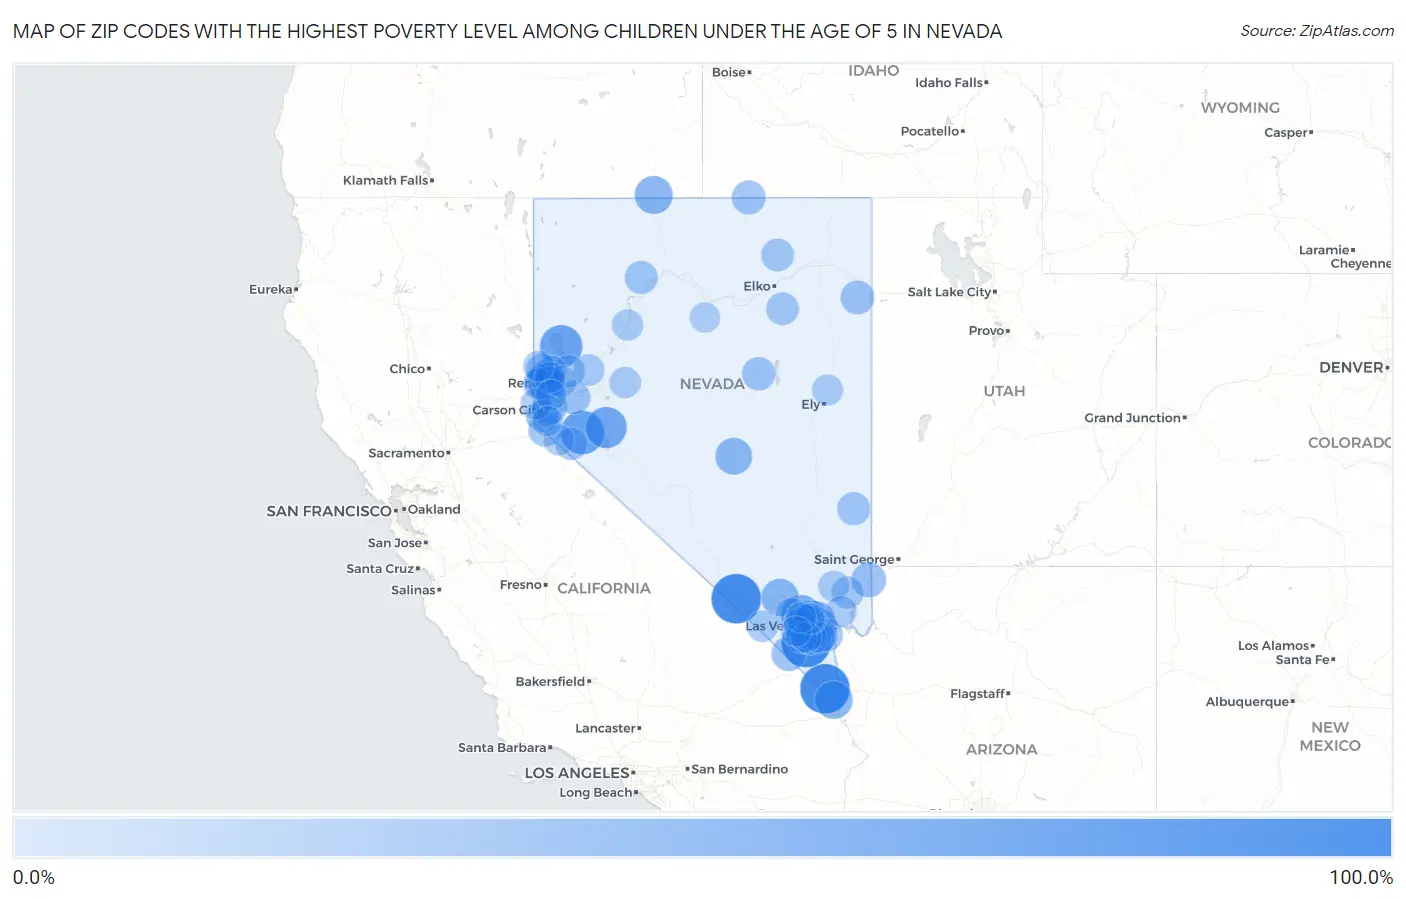
Map of Zip Codes with the Highest Poverty Level Among Children Under the Age of 5 in Nevada
0.0%
100.0%
Zip Codes with the Highest Poverty Level Among Children Under the Age of 5 in Nevada
| Zip Code | Child Poverty | vs State | vs National | |
| 1. | 89020 | 100.0% | 18.2%(+81.8)#1 | 18.1%(+81.9)#38 |
| 2. | 89039 | 100.0% | 18.2%(+81.8)#2 | 18.1%(+81.9)#322 |
| 3. | 89054 | 100.0% | 18.2%(+81.8)#3 | 18.1%(+81.9)#329 |
| 4. | 89109 | 87.5% | 18.2%(+69.3)#4 | 18.1%(+69.4)#667 |
| 5. | 89447 | 69.7% | 18.2%(+51.5)#5 | 18.1%(+51.7)#1,157 |
| 6. | 89424 | 64.1% | 18.2%(+45.9)#6 | 18.1%(+46.0)#1,440 |
| 7. | 89427 | 57.4% | 18.2%(+39.1)#7 | 18.1%(+39.3)#1,873 |
| 8. | 89143 | 51.9% | 18.2%(+33.7)#8 | 18.1%(+33.9)#2,347 |
| 9. | 89102 | 43.8% | 18.2%(+25.6)#9 | 18.1%(+25.7)#3,365 |
| 10. | 89101 | 42.7% | 18.2%(+24.5)#10 | 18.1%(+24.6)#3,535 |
| 11. | 89169 | 42.2% | 18.2%(+24.0)#11 | 18.1%(+24.1)#3,628 |
| 12. | 89421 | 42.1% | 18.2%(+23.9)#12 | 18.1%(+24.0)#3,646 |
| 13. | 89106 | 41.6% | 18.2%(+23.4)#13 | 18.1%(+23.5)#3,734 |
| 14. | 89030 | 41.2% | 18.2%(+23.0)#14 | 18.1%(+23.1)#3,796 |
| 15. | 89029 | 41.2% | 18.2%(+23.0)#15 | 18.1%(+23.1)#3,801 |
| 16. | 89018 | 38.9% | 18.2%(+20.7)#16 | 18.1%(+20.8)#4,232 |
| 17. | 89115 | 38.6% | 18.2%(+20.4)#17 | 18.1%(+20.5)#4,287 |
| 18. | 89049 | 36.0% | 18.2%(+17.8)#18 | 18.1%(+17.9)#4,823 |
| 19. | 89110 | 34.6% | 18.2%(+16.4)#19 | 18.1%(+16.5)#5,168 |
| 20. | 89156 | 33.8% | 18.2%(+15.5)#20 | 18.1%(+15.7)#5,358 |
| 21. | 89103 | 33.2% | 18.2%(+15.0)#21 | 18.1%(+15.1)#5,549 |
| 22. | 89104 | 30.9% | 18.2%(+12.7)#22 | 18.1%(+12.8)#6,124 |
| 23. | 89512 | 28.8% | 18.2%(+10.6)#23 | 18.1%(+10.7)#6,714 |
| 24. | 89108 | 28.1% | 18.2%(+9.89)#24 | 18.1%(+10.0)#6,948 |
| 25. | 89145 | 27.3% | 18.2%(+9.12)#25 | 18.1%(+9.26)#7,197 |
| 26. | 89121 | 26.8% | 18.2%(+8.58)#26 | 18.1%(+8.73)#7,370 |
| 27. | 89119 | 25.7% | 18.2%(+7.52)#27 | 18.1%(+7.67)#7,730 |
| 28. | 89027 | 25.3% | 18.2%(+7.12)#28 | 18.1%(+7.27)#7,871 |
| 29. | 89019 | 25.0% | 18.2%(+6.79)#29 | 18.1%(+6.94)#7,977 |
| 30. | 89502 | 24.6% | 18.2%(+6.43)#30 | 18.1%(+6.58)#8,130 |
| 31. | 89086 | 24.5% | 18.2%(+6.28)#31 | 18.1%(+6.43)#8,179 |
| 32. | 89706 | 24.5% | 18.2%(+6.28)#32 | 18.1%(+6.43)#8,180 |
| 33. | 89146 | 22.3% | 18.2%(+4.10)#33 | 18.1%(+4.25)#9,043 |
| 34. | 89122 | 22.2% | 18.2%(+4.00)#34 | 18.1%(+4.15)#9,113 |
| 35. | 89503 | 22.1% | 18.2%(+3.88)#35 | 18.1%(+4.03)#9,152 |
| 36. | 89832 | 21.7% | 18.2%(+3.53)#36 | 18.1%(+3.68)#9,297 |
| 37. | 89883 | 21.1% | 18.2%(+2.86)#37 | 18.1%(+3.01)#9,557 |
| 38. | 89142 | 21.0% | 18.2%(+2.74)#38 | 18.1%(+2.89)#9,616 |
| 39. | 89113 | 20.8% | 18.2%(+2.62)#39 | 18.1%(+2.77)#9,658 |
| 40. | 89118 | 20.8% | 18.2%(+2.57)#40 | 18.1%(+2.72)#9,688 |
| 41. | 89433 | 20.6% | 18.2%(+2.43)#41 | 18.1%(+2.58)#9,745 |
| 42. | 89107 | 20.1% | 18.2%(+1.86)#42 | 18.1%(+2.01)#9,987 |
| 43. | 89429 | 19.3% | 18.2%(+1.10)#43 | 18.1%(+1.25)#10,357 |
| 44. | 89460 | 19.2% | 18.2%(+1.00)#44 | 18.1%(+1.15)#10,402 |
| 45. | 89183 | 19.1% | 18.2%(+0.937)#45 | 18.1%(+1.09)#10,438 |
| 46. | 89316 | 18.9% | 18.2%(+0.656)#46 | 18.1%(+0.805)#10,563 |
| 47. | 89014 | 18.4% | 18.2%(+0.197)#47 | 18.1%(+0.346)#10,764 |
| 48. | 89005 | 18.3% | 18.2%(+0.102)#48 | 18.1%(+0.251)#10,807 |
| 49. | 89042 | 17.6% | 18.2%(-0.655)#49 | 18.1%(-0.506)#11,176 |
| 50. | 89445 | 17.3% | 18.2%(-0.919)#50 | 18.1%(-0.770)#11,282 |
| 51. | 89015 | 16.7% | 18.2%(-1.49)#51 | 18.1%(-1.34)#11,519 |
| 52. | 89801 | 16.4% | 18.2%(-1.79)#52 | 18.1%(-1.64)#11,680 |
| 53. | 89129 | 16.3% | 18.2%(-1.88)#53 | 18.1%(-1.73)#11,740 |
| 54. | 89147 | 15.9% | 18.2%(-2.32)#54 | 18.1%(-2.17)#11,973 |
| 55. | 89815 | 15.6% | 18.2%(-2.65)#55 | 18.1%(-2.50)#12,146 |
| 56. | 89506 | 15.5% | 18.2%(-2.72)#56 | 18.1%(-2.57)#12,176 |
| 57. | 89705 | 15.1% | 18.2%(-3.14)#57 | 18.1%(-2.99)#12,419 |
| 58. | 89442 | 14.5% | 18.2%(-3.72)#58 | 18.1%(-3.57)#12,732 |
| 59. | 89131 | 14.4% | 18.2%(-3.79)#59 | 18.1%(-3.64)#12,771 |
| 60. | 89139 | 14.4% | 18.2%(-3.85)#60 | 18.1%(-3.70)#12,799 |
| 61. | 89431 | 14.3% | 18.2%(-3.91)#61 | 18.1%(-3.76)#12,818 |
| 62. | 89144 | 14.3% | 18.2%(-3.96)#62 | 18.1%(-3.81)#12,908 |
| 63. | 89444 | 14.2% | 18.2%(-4.05)#63 | 18.1%(-3.90)#12,954 |
| 64. | 89021 | 13.3% | 18.2%(-4.91)#64 | 18.1%(-4.76)#13,465 |
| 65. | 89120 | 13.3% | 18.2%(-4.95)#65 | 18.1%(-4.80)#13,482 |
| 66. | 89012 | 13.2% | 18.2%(-5.05)#66 | 18.1%(-4.90)#13,536 |
| 67. | 89052 | 12.3% | 18.2%(-5.89)#67 | 18.1%(-5.74)#14,025 |
| 68. | 89032 | 12.3% | 18.2%(-5.91)#68 | 18.1%(-5.76)#14,038 |
| 69. | 89128 | 12.1% | 18.2%(-6.09)#69 | 18.1%(-5.94)#14,136 |
| 70. | 89130 | 12.0% | 18.2%(-6.25)#70 | 18.1%(-6.10)#14,239 |
| 71. | 89117 | 11.8% | 18.2%(-6.44)#71 | 18.1%(-6.29)#14,348 |
| 72. | 89166 | 11.7% | 18.2%(-6.47)#72 | 18.1%(-6.32)#14,376 |
| 73. | 89134 | 10.8% | 18.2%(-7.37)#73 | 18.1%(-7.22)#14,930 |
| 74. | 89123 | 9.9% | 18.2%(-8.36)#74 | 18.1%(-8.21)#15,507 |
| 75. | 89408 | 9.8% | 18.2%(-8.41)#75 | 18.1%(-8.26)#15,532 |
| 76. | 89148 | 9.8% | 18.2%(-8.46)#76 | 18.1%(-8.31)#15,566 |
| 77. | 89048 | 9.5% | 18.2%(-8.71)#77 | 18.1%(-8.56)#15,730 |
| 78. | 89002 | 9.3% | 18.2%(-8.89)#78 | 18.1%(-8.74)#15,843 |
| 79. | 89701 | 9.1% | 18.2%(-9.12)#79 | 18.1%(-8.97)#15,976 |
| 80. | 89441 | 8.9% | 18.2%(-9.29)#80 | 18.1%(-9.14)#16,121 |
| 81. | 89523 | 8.9% | 18.2%(-9.32)#81 | 18.1%(-9.17)#16,137 |
| 82. | 89406 | 8.8% | 18.2%(-9.41)#82 | 18.1%(-9.26)#16,194 |
| 83. | 89178 | 8.7% | 18.2%(-9.48)#83 | 18.1%(-9.33)#16,245 |
| 84. | 89419 | 8.7% | 18.2%(-9.50)#84 | 18.1%(-9.35)#16,258 |
| 85. | 89451 | 8.6% | 18.2%(-9.62)#85 | 18.1%(-9.47)#16,354 |
| 86. | 89434 | 8.5% | 18.2%(-9.67)#86 | 18.1%(-9.52)#16,384 |
| 87. | 89436 | 8.0% | 18.2%(-10.2)#87 | 18.1%(-10.1)#16,742 |
| 88. | 89081 | 7.8% | 18.2%(-10.4)#88 | 18.1%(-10.3)#16,881 |
| 89. | 89031 | 7.7% | 18.2%(-10.5)#89 | 18.1%(-10.4)#16,928 |
| 90. | 89301 | 7.7% | 18.2%(-10.5)#90 | 18.1%(-10.4)#16,964 |
| 91. | 89508 | 7.4% | 18.2%(-10.8)#91 | 18.1%(-10.7)#17,146 |
| 92. | 89025 | 7.4% | 18.2%(-10.9)#92 | 18.1%(-10.7)#17,164 |
| 93. | 89040 | 6.7% | 18.2%(-11.5)#93 | 18.1%(-11.3)#17,565 |
| 94. | 89410 | 6.3% | 18.2%(-11.9)#94 | 18.1%(-11.8)#17,867 |
| 95. | 89521 | 6.1% | 18.2%(-12.1)#95 | 18.1%(-12.0)#18,024 |
| 96. | 89141 | 5.9% | 18.2%(-12.3)#96 | 18.1%(-12.1)#18,120 |
| 97. | 89423 | 4.7% | 18.2%(-13.6)#97 | 18.1%(-13.4)#18,999 |
| 98. | 89820 | 4.5% | 18.2%(-13.7)#98 | 18.1%(-13.5)#19,096 |
| 99. | 89149 | 4.5% | 18.2%(-13.8)#99 | 18.1%(-13.6)#19,150 |
| 100. | 89135 | 4.4% | 18.2%(-13.8)#100 | 18.1%(-13.6)#19,170 |
1
2Common Questions
What are the Top 10 Zip Codes with the Highest Poverty Level Among Children Under the Age of 5 in Nevada?
Top 10 Zip Codes with the Highest Poverty Level Among Children Under the Age of 5 in Nevada are:
What zip code has the Highest Poverty Level Among Children Under the Age of 5 in Nevada?
89020 has the Highest Poverty Level Among Children Under the Age of 5 in Nevada with 100.0%.
What is the Poverty Level Among Children Under the Age of 5 in the State of Nevada?
Poverty Level Among Children Under the Age of 5 in Nevada is 18.2%.
What is the Poverty Level Among Children Under the Age of 5 in the United States?
Poverty Level Among Children Under the Age of 5 in the United States is 18.1%.