Zip Codes with the Highest Poverty Level Among Children Under the Age of 5 in Missouri
RELATED REPORTS & OPTIONS
Highest Poverty | Child 0-5
Missouri
Compare Zip Codes
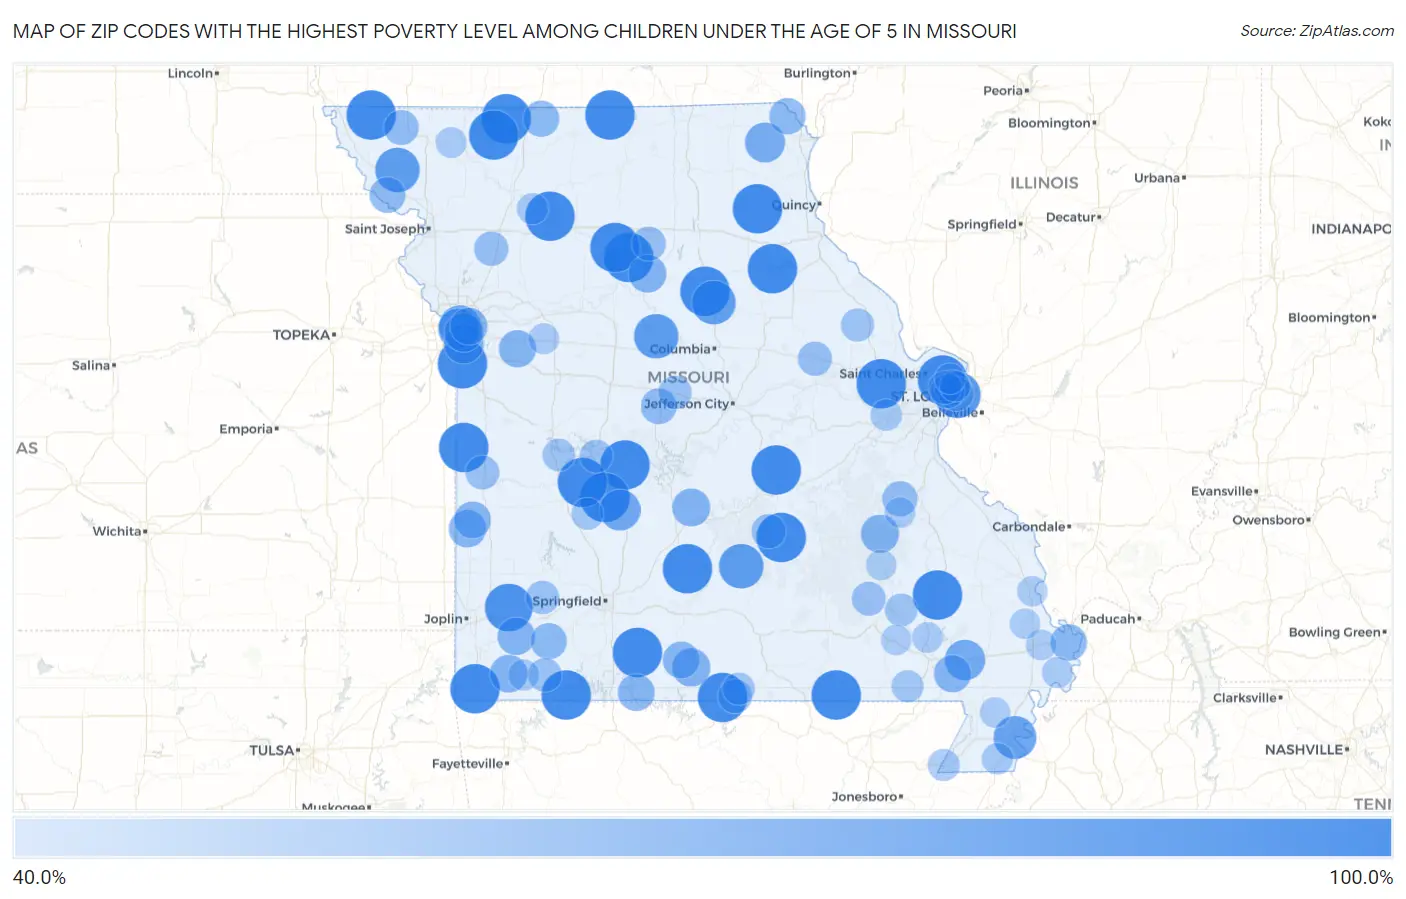
Map of Zip Codes with the Highest Poverty Level Among Children Under the Age of 5 in Missouri
40.0%
100.0%
Zip Codes with the Highest Poverty Level Among Children Under the Age of 5 in Missouri
| Zip Code | Child Poverty | vs State | vs National | |
| 1. | 65326 | 100.0% | 18.4%(+81.6)#1 | 18.1%(+81.9)#35 |
| 2. | 65668 | 100.0% | 18.4%(+81.6)#2 | 18.1%(+81.9)#39 |
| 3. | 65658 | 100.0% | 18.4%(+81.6)#3 | 18.1%(+81.9)#61 |
| 4. | 65662 | 100.0% | 18.4%(+81.6)#4 | 18.1%(+81.9)#82 |
| 5. | 63434 | 100.0% | 18.4%(+81.6)#5 | 18.1%(+81.9)#151 |
| 6. | 65580 | 100.0% | 18.4%(+81.6)#6 | 18.1%(+81.9)#187 |
| 7. | 64147 | 100.0% | 18.4%(+81.6)#7 | 18.1%(+81.9)#205 |
| 8. | 65283 | 100.0% | 18.4%(+81.6)#8 | 18.1%(+81.9)#231 |
| 9. | 63964 | 100.0% | 18.4%(+81.6)#9 | 18.1%(+81.9)#235 |
| 10. | 65778 | 100.0% | 18.4%(+81.6)#10 | 18.1%(+81.9)#237 |
| 11. | 64660 | 100.0% | 18.4%(+81.6)#11 | 18.1%(+81.9)#261 |
| 12. | 64847 | 100.0% | 18.4%(+81.6)#12 | 18.1%(+81.9)#285 |
| 13. | 65657 | 100.0% | 18.4%(+81.6)#13 | 18.1%(+81.9)#291 |
| 14. | 63140 | 100.0% | 18.4%(+81.6)#14 | 18.1%(+81.9)#340 |
| 15. | 64722 | 100.0% | 18.4%(+81.6)#15 | 18.1%(+81.9)#349 |
| 16. | 64458 | 100.0% | 18.4%(+81.6)#16 | 18.1%(+81.9)#365 |
| 17. | 64498 | 100.0% | 18.4%(+81.6)#17 | 18.1%(+81.9)#382 |
| 18. | 65541 | 100.0% | 18.4%(+81.6)#18 | 18.1%(+81.9)#444 |
| 19. | 64681 | 100.0% | 18.4%(+81.6)#19 | 18.1%(+81.9)#468 |
| 20. | 64672 | 100.0% | 18.4%(+81.6)#20 | 18.1%(+81.9)#498 |
| 21. | 64441 | 100.0% | 18.4%(+81.6)#21 | 18.1%(+81.9)#501 |
| 22. | 65278 | 100.0% | 18.4%(+81.6)#22 | 18.1%(+81.9)#526 |
| 23. | 63365 | 100.0% | 18.4%(+81.6)#23 | 18.1%(+81.9)#531 |
| 24. | 65766 | 100.0% | 18.4%(+81.6)#24 | 18.1%(+81.9)#533 |
| 25. | 65735 | 100.0% | 18.4%(+81.6)#25 | 18.1%(+81.9)#543 |
| 26. | 64654 | 100.0% | 18.4%(+81.6)#26 | 18.1%(+81.9)#552 |
| 27. | 64859 | 95.3% | 18.4%(+76.9)#27 | 18.1%(+77.2)#578 |
| 28. | 63101 | 91.4% | 18.4%(+73.0)#28 | 18.1%(+73.3)#622 |
| 29. | 65570 | 87.0% | 18.4%(+68.5)#29 | 18.1%(+68.9)#673 |
| 30. | 65250 | 86.7% | 18.4%(+68.3)#30 | 18.1%(+68.6)#677 |
| 31. | 64466 | 86.7% | 18.4%(+68.3)#31 | 18.1%(+68.6)#678 |
| 32. | 65243 | 85.2% | 18.4%(+66.8)#32 | 18.1%(+67.2)#704 |
| 33. | 63851 | 82.3% | 18.4%(+63.9)#33 | 18.1%(+64.2)#765 |
| 34. | 64106 | 79.8% | 18.4%(+61.4)#34 | 18.1%(+61.8)#827 |
| 35. | 65767 | 77.5% | 18.4%(+59.1)#35 | 18.1%(+59.5)#887 |
| 36. | 64108 | 77.1% | 18.4%(+58.7)#36 | 18.1%(+59.0)#895 |
| 37. | 63936 | 76.2% | 18.4%(+57.8)#37 | 18.1%(+58.1)#924 |
| 38. | 63474 | 75.0% | 18.4%(+56.6)#38 | 18.1%(+56.9)#966 |
| 39. | 64132 | 74.5% | 18.4%(+56.1)#39 | 18.1%(+56.4)#988 |
| 40. | 64128 | 72.0% | 18.4%(+53.6)#40 | 18.1%(+54.0)#1,080 |
| 41. | 63623 | 70.0% | 18.4%(+51.6)#41 | 18.1%(+51.9)#1,145 |
| 42. | 65773 | 70.0% | 18.4%(+51.6)#42 | 18.1%(+51.9)#1,148 |
| 43. | 65567 | 69.5% | 18.4%(+51.1)#43 | 18.1%(+51.4)#1,172 |
| 44. | 65261 | 69.2% | 18.4%(+50.8)#44 | 18.1%(+51.1)#1,191 |
| 45. | 64861 | 68.8% | 18.4%(+50.3)#45 | 18.1%(+50.7)#1,202 |
| 46. | 65723 | 68.6% | 18.4%(+50.2)#46 | 18.1%(+50.6)#1,205 |
| 47. | 64728 | 68.2% | 18.4%(+49.8)#47 | 18.1%(+50.1)#1,223 |
| 48. | 64011 | 67.7% | 18.4%(+49.3)#48 | 18.1%(+49.6)#1,243 |
| 49. | 64125 | 67.7% | 18.4%(+49.3)#49 | 18.1%(+49.6)#1,244 |
| 50. | 63932 | 67.2% | 18.4%(+48.8)#50 | 18.1%(+49.2)#1,263 |
| 51. | 65627 | 66.7% | 18.4%(+48.3)#51 | 18.1%(+48.6)#1,285 |
| 52. | 65755 | 66.7% | 18.4%(+48.3)#52 | 18.1%(+48.6)#1,289 |
| 53. | 64771 | 66.7% | 18.4%(+48.3)#53 | 18.1%(+48.6)#1,296 |
| 54. | 63882 | 65.5% | 18.4%(+47.1)#54 | 18.1%(+47.5)#1,365 |
| 55. | 63465 | 65.2% | 18.4%(+46.8)#55 | 18.1%(+47.2)#1,373 |
| 56. | 65769 | 64.9% | 18.4%(+46.5)#56 | 18.1%(+46.8)#1,390 |
| 57. | 64426 | 64.7% | 18.4%(+46.3)#57 | 18.1%(+46.6)#1,401 |
| 58. | 65034 | 64.1% | 18.4%(+45.6)#58 | 18.1%(+46.0)#1,444 |
| 59. | 64451 | 64.0% | 18.4%(+45.6)#59 | 18.1%(+45.9)#1,451 |
| 60. | 63115 | 63.3% | 18.4%(+44.9)#60 | 18.1%(+45.2)#1,486 |
| 61. | 63660 | 62.4% | 18.4%(+44.0)#61 | 18.1%(+44.4)#1,539 |
| 62. | 64428 | 61.7% | 18.4%(+43.3)#62 | 18.1%(+43.7)#1,578 |
| 63. | 63106 | 61.5% | 18.4%(+43.1)#63 | 18.1%(+43.5)#1,598 |
| 64. | 65462 | 60.0% | 18.4%(+41.6)#64 | 18.1%(+41.9)#1,683 |
| 65. | 64493 | 60.0% | 18.4%(+41.6)#65 | 18.1%(+41.9)#1,686 |
| 66. | 63112 | 59.8% | 18.4%(+41.3)#66 | 18.1%(+41.7)#1,715 |
| 67. | 63363 | 59.7% | 18.4%(+41.3)#67 | 18.1%(+41.7)#1,716 |
| 68. | 64658 | 59.5% | 18.4%(+41.1)#68 | 18.1%(+41.5)#1,723 |
| 69. | 65609 | 59.4% | 18.4%(+41.0)#69 | 18.1%(+41.3)#1,736 |
| 70. | 64779 | 59.1% | 18.4%(+40.7)#70 | 18.1%(+41.1)#1,757 |
| 71. | 63638 | 59.0% | 18.4%(+40.6)#71 | 18.1%(+40.9)#1,768 |
| 72. | 65625 | 58.4% | 18.4%(+40.0)#72 | 18.1%(+40.3)#1,801 |
| 73. | 65707 | 57.7% | 18.4%(+39.3)#73 | 18.1%(+39.7)#1,847 |
| 74. | 65025 | 57.5% | 18.4%(+39.1)#74 | 18.1%(+39.4)#1,864 |
| 75. | 63377 | 57.1% | 18.4%(+38.7)#75 | 18.1%(+39.1)#1,883 |
| 76. | 65355 | 56.9% | 18.4%(+38.5)#76 | 18.1%(+38.9)#1,913 |
| 77. | 63133 | 56.9% | 18.4%(+38.4)#77 | 18.1%(+38.8)#1,921 |
| 78. | 63957 | 56.0% | 18.4%(+37.6)#78 | 18.1%(+37.9)#1,990 |
| 79. | 64740 | 55.6% | 18.4%(+37.1)#79 | 18.1%(+37.5)#2,026 |
| 80. | 65626 | 55.0% | 18.4%(+36.6)#80 | 18.1%(+36.9)#2,073 |
| 81. | 63953 | 54.3% | 18.4%(+35.9)#81 | 18.1%(+36.2)#2,122 |
| 82. | 65650 | 54.0% | 18.4%(+35.6)#82 | 18.1%(+36.0)#2,139 |
| 83. | 63829 | 54.0% | 18.4%(+35.6)#83 | 18.1%(+35.9)#2,147 |
| 84. | 63039 | 53.2% | 18.4%(+34.8)#84 | 18.1%(+35.2)#2,231 |
| 85. | 63877 | 52.5% | 18.4%(+34.1)#85 | 18.1%(+34.4)#2,297 |
| 86. | 64640 | 52.3% | 18.4%(+33.9)#86 | 18.1%(+34.3)#2,318 |
| 87. | 65647 | 51.9% | 18.4%(+33.5)#87 | 18.1%(+33.8)#2,353 |
| 88. | 64071 | 51.4% | 18.4%(+33.0)#88 | 18.1%(+33.4)#2,394 |
| 89. | 63845 | 51.4% | 18.4%(+32.9)#89 | 18.1%(+33.3)#2,399 |
| 90. | 63147 | 51.1% | 18.4%(+32.6)#90 | 18.1%(+33.0)#2,420 |
| 91. | 63136 | 51.0% | 18.4%(+32.6)#91 | 18.1%(+33.0)#2,422 |
| 92. | 64479 | 50.9% | 18.4%(+32.5)#92 | 18.1%(+32.8)#2,439 |
| 93. | 63967 | 50.7% | 18.4%(+32.3)#93 | 18.1%(+32.6)#2,453 |
| 94. | 63648 | 50.6% | 18.4%(+32.1)#94 | 18.1%(+32.5)#2,478 |
| 95. | 63823 | 50.5% | 18.4%(+32.0)#95 | 18.1%(+32.4)#2,485 |
| 96. | 63937 | 50.3% | 18.4%(+31.9)#96 | 18.1%(+32.3)#2,496 |
| 97. | 63703 | 50.0% | 18.4%(+31.6)#97 | 18.1%(+31.9)#2,520 |
| 98. | 63848 | 50.0% | 18.4%(+31.6)#98 | 18.1%(+31.9)#2,544 |
| 99. | 63654 | 50.0% | 18.4%(+31.6)#99 | 18.1%(+31.9)#2,563 |
| 100. | 63767 | 50.0% | 18.4%(+31.6)#100 | 18.1%(+31.9)#2,567 |
Common Questions
What are the Top 10 Zip Codes with the Highest Poverty Level Among Children Under the Age of 5 in Missouri?
Top 10 Zip Codes with the Highest Poverty Level Among Children Under the Age of 5 in Missouri are:
What zip code has the Highest Poverty Level Among Children Under the Age of 5 in Missouri?
65326 has the Highest Poverty Level Among Children Under the Age of 5 in Missouri with 100.0%.
What is the Poverty Level Among Children Under the Age of 5 in the State of Missouri?
Poverty Level Among Children Under the Age of 5 in Missouri is 18.4%.
What is the Poverty Level Among Children Under the Age of 5 in the United States?
Poverty Level Among Children Under the Age of 5 in the United States is 18.1%.