Zip Codes with the Highest Poverty Level Among Children Under the Age of 5 in Iowa
RELATED REPORTS & OPTIONS
Highest Poverty | Child 0-5
Iowa
Compare Zip Codes
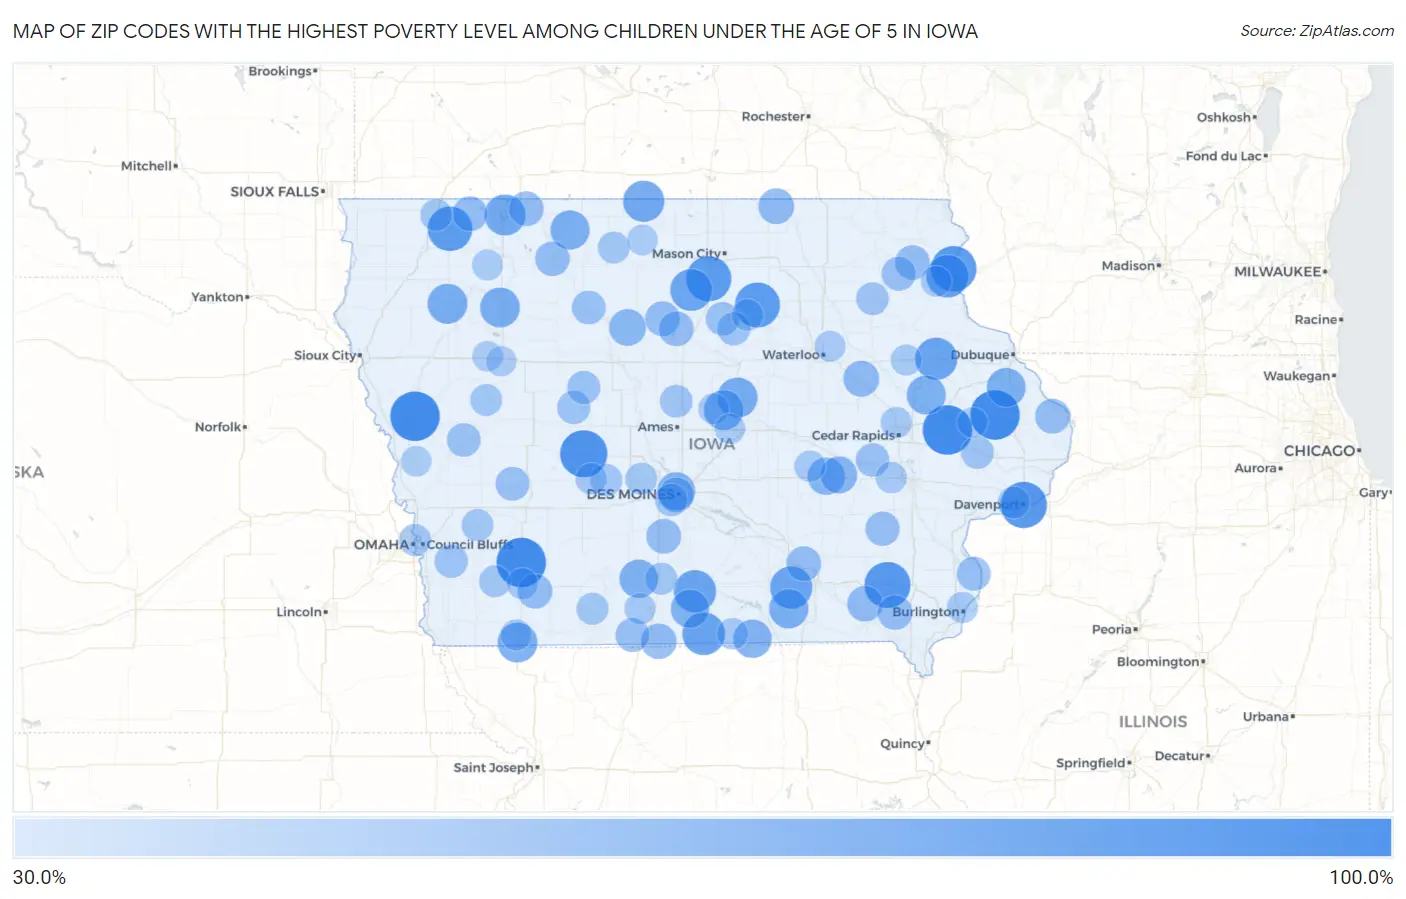
Map of Zip Codes with the Highest Poverty Level Among Children Under the Age of 5 in Iowa
30.0%
100.0%
Zip Codes with the Highest Poverty Level Among Children Under the Age of 5 in Iowa
| Zip Code | Child Poverty | vs State | vs National | |
| 1. | 51010 | 100.0% | 14.3%(+85.7)#1 | 18.1%(+81.9)#273 |
| 2. | 52207 | 100.0% | 14.3%(+85.7)#2 | 18.1%(+81.9)#352 |
| 3. | 50847 | 100.0% | 14.3%(+85.7)#3 | 18.1%(+81.9)#534 |
| 4. | 52312 | 100.0% | 14.3%(+85.7)#4 | 18.1%(+81.9)#544 |
| 5. | 50026 | 92.1% | 14.3%(+77.8)#5 | 18.1%(+74.0)#616 |
| 6. | 52801 | 88.9% | 14.3%(+74.6)#6 | 18.1%(+70.8)#644 |
| 7. | 52635 | 87.7% | 14.3%(+73.4)#7 | 18.1%(+69.6)#658 |
| 8. | 52158 | 85.7% | 14.3%(+71.4)#8 | 18.1%(+67.7)#692 |
| 9. | 50477 | 85.0% | 14.3%(+70.7)#9 | 18.1%(+66.9)#709 |
| 10. | 50611 | 84.6% | 14.3%(+70.3)#10 | 18.1%(+66.6)#716 |
| 11. | 51350 | 83.3% | 14.3%(+69.0)#11 | 18.1%(+65.3)#744 |
| 12. | 52157 | 76.5% | 14.3%(+62.2)#12 | 18.1%(+58.4)#911 |
| 13. | 50008 | 76.2% | 14.3%(+61.9)#13 | 18.1%(+58.1)#923 |
| 14. | 52536 | 75.0% | 14.3%(+60.7)#14 | 18.1%(+56.9)#962 |
| 15. | 50068 | 75.0% | 14.3%(+60.7)#15 | 18.1%(+56.9)#972 |
| 16. | 52036 | 75.0% | 14.3%(+60.7)#16 | 18.1%(+56.9)#975 |
| 17. | 50457 | 74.1% | 14.3%(+59.8)#17 | 18.1%(+56.0)#1,006 |
| 18. | 50465 | 71.4% | 14.3%(+57.1)#18 | 18.1%(+53.4)#1,103 |
| 19. | 51355 | 70.8% | 14.3%(+56.5)#19 | 18.1%(+52.8)#1,121 |
| 20. | 50258 | 67.8% | 14.3%(+53.5)#20 | 18.1%(+49.7)#1,236 |
| 21. | 51631 | 66.7% | 14.3%(+52.4)#21 | 18.1%(+48.6)#1,302 |
| 22. | 51037 | 66.7% | 14.3%(+52.4)#22 | 18.1%(+48.6)#1,305 |
| 23. | 50576 | 66.7% | 14.3%(+52.4)#23 | 18.1%(+48.6)#1,307 |
| 24. | 50239 | 66.7% | 14.3%(+52.4)#24 | 18.1%(+48.6)#1,314 |
| 25. | 52594 | 65.1% | 14.3%(+50.8)#25 | 18.1%(+47.0)#1,376 |
| 26. | 50578 | 64.7% | 14.3%(+50.4)#26 | 18.1%(+46.6)#1,400 |
| 27. | 52219 | 64.3% | 14.3%(+50.0)#27 | 18.1%(+46.2)#1,431 |
| 28. | 52079 | 63.6% | 14.3%(+49.3)#28 | 18.1%(+45.6)#1,470 |
| 29. | 50174 | 62.4% | 14.3%(+48.1)#29 | 18.1%(+44.3)#1,541 |
| 30. | 52549 | 61.7% | 14.3%(+47.4)#30 | 18.1%(+43.7)#1,579 |
| 31. | 50123 | 61.5% | 14.3%(+47.2)#31 | 18.1%(+43.5)#1,591 |
| 32. | 50314 | 60.4% | 14.3%(+46.1)#32 | 18.1%(+42.3)#1,654 |
| 33. | 52347 | 58.7% | 14.3%(+44.4)#33 | 18.1%(+40.6)#1,787 |
| 34. | 52251 | 57.1% | 14.3%(+42.8)#34 | 18.1%(+39.1)#1,892 |
| 35. | 50591 | 56.5% | 14.3%(+42.2)#35 | 18.1%(+38.5)#1,947 |
| 36. | 52210 | 53.6% | 14.3%(+39.3)#36 | 18.1%(+35.5)#2,185 |
| 37. | 50476 | 53.1% | 14.3%(+38.8)#37 | 18.1%(+35.1)#2,240 |
| 38. | 52535 | 52.5% | 14.3%(+38.2)#38 | 18.1%(+34.4)#2,302 |
| 39. | 50065 | 52.2% | 14.3%(+37.9)#39 | 18.1%(+34.1)#2,328 |
| 40. | 50309 | 50.4% | 14.3%(+36.1)#40 | 18.1%(+32.4)#2,487 |
| 41. | 50525 | 50.0% | 14.3%(+35.7)#41 | 18.1%(+31.9)#2,523 |
| 42. | 52064 | 50.0% | 14.3%(+35.7)#42 | 18.1%(+31.9)#2,557 |
| 43. | 51345 | 50.0% | 14.3%(+35.7)#43 | 18.1%(+31.9)#2,572 |
| 44. | 52566 | 50.0% | 14.3%(+35.7)#44 | 18.1%(+31.9)#2,587 |
| 45. | 52630 | 50.0% | 14.3%(+35.7)#45 | 18.1%(+31.9)#2,592 |
| 46. | 50857 | 50.0% | 14.3%(+35.7)#46 | 18.1%(+31.9)#2,603 |
| 47. | 51363 | 50.0% | 14.3%(+35.7)#47 | 18.1%(+31.9)#2,606 |
| 48. | 50241 | 50.0% | 14.3%(+35.7)#48 | 18.1%(+31.9)#2,610 |
| 49. | 50101 | 50.0% | 14.3%(+35.7)#49 | 18.1%(+31.9)#2,617 |
| 50. | 50536 | 49.3% | 14.3%(+35.0)#50 | 18.1%(+31.2)#2,658 |
| 51. | 52162 | 49.2% | 14.3%(+34.9)#51 | 18.1%(+31.2)#2,668 |
| 52. | 52359 | 48.1% | 14.3%(+33.8)#52 | 18.1%(+30.1)#2,793 |
| 53. | 52135 | 47.6% | 14.3%(+33.3)#53 | 18.1%(+29.6)#2,859 |
| 54. | 50140 | 47.1% | 14.3%(+32.8)#54 | 18.1%(+29.0)#2,914 |
| 55. | 52646 | 47.1% | 14.3%(+32.8)#55 | 18.1%(+29.0)#2,920 |
| 56. | 51543 | 46.7% | 14.3%(+32.4)#56 | 18.1%(+28.6)#2,967 |
| 57. | 51528 | 46.2% | 14.3%(+31.9)#57 | 18.1%(+28.1)#3,031 |
| 58. | 50520 | 46.2% | 14.3%(+31.9)#58 | 18.1%(+28.1)#3,037 |
| 59. | 52203 | 45.7% | 14.3%(+31.4)#59 | 18.1%(+27.6)#3,094 |
| 60. | 50441 | 45.4% | 14.3%(+31.1)#60 | 18.1%(+27.4)#3,127 |
| 61. | 50050 | 44.8% | 14.3%(+30.5)#61 | 18.1%(+26.8)#3,203 |
| 62. | 51571 | 44.4% | 14.3%(+30.1)#62 | 18.1%(+26.4)#3,264 |
| 63. | 50538 | 44.4% | 14.3%(+30.1)#63 | 18.1%(+26.4)#3,267 |
| 64. | 50633 | 44.4% | 14.3%(+30.1)#64 | 18.1%(+26.4)#3,272 |
| 65. | 50248 | 43.0% | 14.3%(+28.7)#65 | 18.1%(+24.9)#3,479 |
| 66. | 52255 | 42.9% | 14.3%(+28.6)#66 | 18.1%(+24.8)#3,505 |
| 67. | 52164 | 42.9% | 14.3%(+28.6)#67 | 18.1%(+24.8)#3,517 |
| 68. | 50321 | 42.0% | 14.3%(+27.7)#68 | 18.1%(+23.9)#3,661 |
| 69. | 52804 | 41.0% | 14.3%(+26.7)#69 | 18.1%(+23.0)#3,824 |
| 70. | 50146 | 40.9% | 14.3%(+26.6)#70 | 18.1%(+22.8)#3,855 |
| 71. | 51510 | 40.7% | 14.3%(+26.4)#71 | 18.1%(+22.6)#3,890 |
| 72. | 50845 | 40.6% | 14.3%(+26.3)#72 | 18.1%(+22.6)#3,912 |
| 73. | 50213 | 40.5% | 14.3%(+26.2)#73 | 18.1%(+22.5)#3,928 |
| 74. | 51249 | 40.4% | 14.3%(+26.1)#74 | 18.1%(+22.3)#3,955 |
| 75. | 50063 | 40.0% | 14.3%(+25.7)#75 | 18.1%(+21.9)#4,007 |
| 76. | 50522 | 40.0% | 14.3%(+25.7)#76 | 18.1%(+21.9)#4,017 |
| 77. | 51448 | 40.0% | 14.3%(+25.7)#77 | 18.1%(+21.9)#4,023 |
| 78. | 51536 | 40.0% | 14.3%(+25.7)#78 | 18.1%(+21.9)#4,027 |
| 79. | 51566 | 39.9% | 14.3%(+25.6)#79 | 18.1%(+21.8)#4,050 |
| 80. | 50625 | 39.8% | 14.3%(+25.5)#80 | 18.1%(+21.7)#4,073 |
| 81. | 50216 | 38.8% | 14.3%(+24.5)#81 | 18.1%(+20.8)#4,247 |
| 82. | 52211 | 38.4% | 14.3%(+24.1)#82 | 18.1%(+20.3)#4,333 |
| 83. | 50864 | 38.3% | 14.3%(+24.0)#83 | 18.1%(+20.2)#4,350 |
| 84. | 52590 | 38.2% | 14.3%(+23.9)#84 | 18.1%(+20.1)#4,369 |
| 85. | 52322 | 38.0% | 14.3%(+23.7)#85 | 18.1%(+19.9)#4,416 |
| 86. | 50108 | 37.9% | 14.3%(+23.6)#86 | 18.1%(+19.9)#4,427 |
| 87. | 52601 | 37.8% | 14.3%(+23.5)#87 | 18.1%(+19.7)#4,447 |
| 88. | 52233 | 37.7% | 14.3%(+23.4)#88 | 18.1%(+19.6)#4,460 |
| 89. | 50654 | 37.5% | 14.3%(+23.2)#89 | 18.1%(+19.4)#4,498 |
| 90. | 51651 | 37.5% | 14.3%(+23.2)#90 | 18.1%(+19.4)#4,502 |
| 91. | 50703 | 37.1% | 14.3%(+22.8)#91 | 18.1%(+19.0)#4,573 |
| 92. | 51357 | 37.0% | 14.3%(+22.7)#92 | 18.1%(+18.9)#4,599 |
| 93. | 50278 | 36.7% | 14.3%(+22.4)#93 | 18.1%(+18.7)#4,654 |
| 94. | 52047 | 36.6% | 14.3%(+22.3)#94 | 18.1%(+18.5)#4,683 |
| 95. | 50484 | 36.4% | 14.3%(+22.1)#95 | 18.1%(+18.3)#4,740 |
| 96. | 51564 | 35.7% | 14.3%(+21.4)#96 | 18.1%(+17.7)#4,892 |
| 97. | 52362 | 35.5% | 14.3%(+21.2)#97 | 18.1%(+17.5)#4,942 |
| 98. | 51053 | 35.5% | 14.3%(+21.2)#98 | 18.1%(+17.4)#4,954 |
| 99. | 50535 | 35.4% | 14.3%(+21.1)#99 | 18.1%(+17.4)#4,969 |
| 100. | 50247 | 35.3% | 14.3%(+21.0)#100 | 18.1%(+17.3)#4,994 |
Common Questions
What are the Top 10 Zip Codes with the Highest Poverty Level Among Children Under the Age of 5 in Iowa?
Top 10 Zip Codes with the Highest Poverty Level Among Children Under the Age of 5 in Iowa are:
What zip code has the Highest Poverty Level Among Children Under the Age of 5 in Iowa?
51010 has the Highest Poverty Level Among Children Under the Age of 5 in Iowa with 100.0%.
What is the Poverty Level Among Children Under the Age of 5 in the State of Iowa?
Poverty Level Among Children Under the Age of 5 in Iowa is 14.3%.
What is the Poverty Level Among Children Under the Age of 5 in the United States?
Poverty Level Among Children Under the Age of 5 in the United States is 18.1%.