Zip Codes with the Highest Poverty Level Among Children Under the Age of 5 in Mississippi
RELATED REPORTS & OPTIONS
Highest Poverty | Child 0-5
Mississippi
Compare Zip Codes
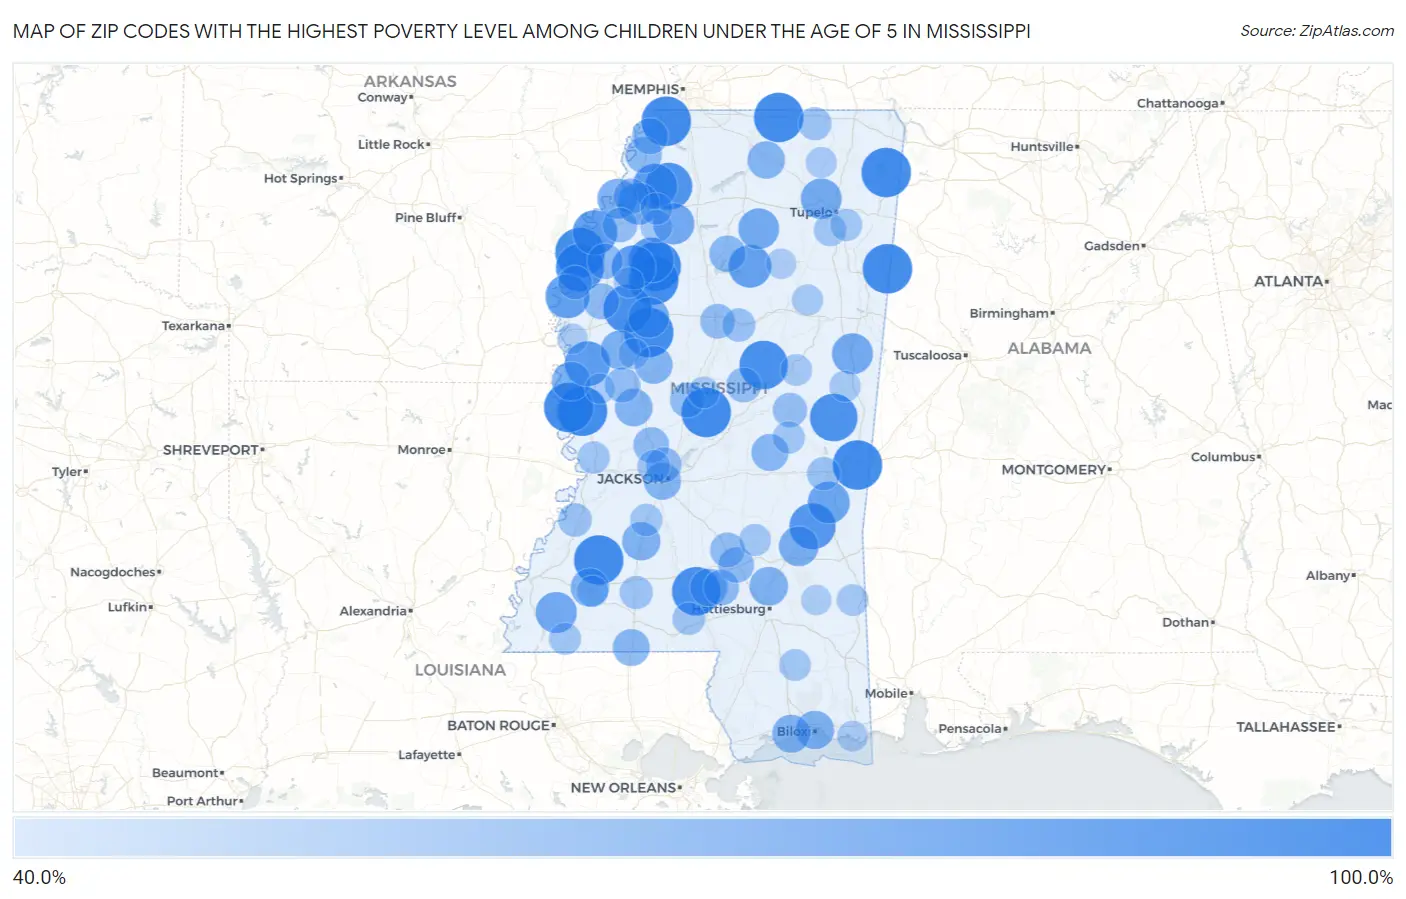
Map of Zip Codes with the Highest Poverty Level Among Children Under the Age of 5 in Mississippi
40.0%
100.0%
Zip Codes with the Highest Poverty Level Among Children Under the Age of 5 in Mississippi
| Zip Code | Child Poverty | vs State | vs National | |
| 1. | 39364 | 100.0% | 29.3%(+70.7)#1 | 18.1%(+81.9)#13 |
| 2. | 38641 | 100.0% | 29.3%(+70.7)#2 | 18.1%(+81.9)#24 |
| 3. | 39668 | 100.0% | 29.3%(+70.7)#3 | 18.1%(+81.9)#48 |
| 4. | 39045 | 100.0% | 29.3%(+70.7)#4 | 18.1%(+81.9)#52 |
| 5. | 38838 | 100.0% | 29.3%(+70.7)#5 | 18.1%(+81.9)#68 |
| 6. | 38647 | 100.0% | 29.3%(+70.7)#6 | 18.1%(+81.9)#138 |
| 7. | 38746 | 100.0% | 29.3%(+70.7)#7 | 18.1%(+81.9)#266 |
| 8. | 39054 | 100.0% | 29.3%(+70.7)#8 | 18.1%(+81.9)#272 |
| 9. | 38928 | 100.0% | 29.3%(+70.7)#9 | 18.1%(+81.9)#343 |
| 10. | 38844 | 100.0% | 29.3%(+70.7)#10 | 18.1%(+81.9)#373 |
| 11. | 39113 | 100.0% | 29.3%(+70.7)#11 | 18.1%(+81.9)#374 |
| 12. | 38944 | 100.0% | 29.3%(+70.7)#12 | 18.1%(+81.9)#375 |
| 13. | 38946 | 100.0% | 29.3%(+70.7)#13 | 18.1%(+81.9)#431 |
| 14. | 39108 | 97.1% | 29.3%(+67.8)#14 | 18.1%(+79.0)#565 |
| 15. | 39656 | 97.1% | 29.3%(+67.8)#15 | 18.1%(+79.0)#566 |
| 16. | 38778 | 96.3% | 29.3%(+67.0)#16 | 18.1%(+78.2)#568 |
| 17. | 38769 | 95.7% | 29.3%(+66.4)#17 | 18.1%(+77.7)#574 |
| 18. | 39328 | 94.6% | 29.3%(+65.3)#18 | 18.1%(+76.5)#587 |
| 19. | 38621 | 92.9% | 29.3%(+63.7)#19 | 18.1%(+74.9)#601 |
| 20. | 39366 | 90.4% | 29.3%(+61.1)#20 | 18.1%(+72.3)#636 |
| 21. | 38748 | 87.5% | 29.3%(+58.2)#21 | 18.1%(+69.4)#661 |
| 22. | 38966 | 87.2% | 29.3%(+57.9)#22 | 18.1%(+69.2)#670 |
| 23. | 38670 | 86.1% | 29.3%(+56.8)#23 | 18.1%(+68.0)#684 |
| 24. | 38720 | 86.1% | 29.3%(+56.8)#24 | 18.1%(+68.0)#686 |
| 25. | 38737 | 84.8% | 29.3%(+55.6)#25 | 18.1%(+66.8)#710 |
| 26. | 38725 | 84.0% | 29.3%(+54.7)#26 | 18.1%(+65.9)#732 |
| 27. | 38914 | 81.2% | 29.3%(+52.0)#27 | 18.1%(+63.2)#786 |
| 28. | 39363 | 78.4% | 29.3%(+49.1)#28 | 18.1%(+60.3)#859 |
| 29. | 38639 | 77.8% | 29.3%(+48.5)#29 | 18.1%(+59.7)#878 |
| 30. | 38622 | 76.3% | 29.3%(+47.0)#30 | 18.1%(+58.3)#920 |
| 31. | 39633 | 76.0% | 29.3%(+46.7)#31 | 18.1%(+57.9)#927 |
| 32. | 39739 | 75.5% | 29.3%(+46.2)#32 | 18.1%(+57.4)#944 |
| 33. | 38913 | 75.0% | 29.3%(+45.7)#33 | 18.1%(+56.9)#965 |
| 34. | 38869 | 75.0% | 29.3%(+45.7)#34 | 18.1%(+56.9)#971 |
| 35. | 38941 | 74.4% | 29.3%(+45.1)#35 | 18.1%(+56.4)#990 |
| 36. | 38631 | 73.1% | 29.3%(+43.8)#36 | 18.1%(+55.1)#1,045 |
| 37. | 39477 | 72.0% | 29.3%(+42.7)#37 | 18.1%(+53.9)#1,085 |
| 38. | 38754 | 70.2% | 29.3%(+40.9)#38 | 18.1%(+52.1)#1,139 |
| 39. | 38744 | 70.1% | 29.3%(+40.8)#39 | 18.1%(+52.0)#1,143 |
| 40. | 39459 | 68.8% | 29.3%(+39.6)#40 | 18.1%(+50.8)#1,198 |
| 41. | 39653 | 68.6% | 29.3%(+39.3)#41 | 18.1%(+50.5)#1,207 |
| 42. | 39530 | 68.4% | 29.3%(+39.1)#42 | 18.1%(+50.3)#1,217 |
| 43. | 39083 | 68.0% | 29.3%(+38.7)#43 | 18.1%(+50.0)#1,224 |
| 44. | 39501 | 67.3% | 29.3%(+38.0)#44 | 18.1%(+49.2)#1,262 |
| 45. | 39169 | 66.8% | 29.3%(+37.5)#45 | 18.1%(+48.7)#1,276 |
| 46. | 39194 | 66.3% | 29.3%(+37.0)#46 | 18.1%(+48.2)#1,330 |
| 47. | 39427 | 65.9% | 29.3%(+36.6)#47 | 18.1%(+47.8)#1,347 |
| 48. | 38659 | 65.7% | 29.3%(+36.5)#48 | 18.1%(+47.7)#1,353 |
| 49. | 39204 | 64.7% | 29.3%(+35.5)#49 | 18.1%(+46.7)#1,397 |
| 50. | 39057 | 64.7% | 29.3%(+35.4)#50 | 18.1%(+46.6)#1,403 |
| 51. | 39657 | 63.9% | 29.3%(+34.6)#51 | 18.1%(+45.8)#1,458 |
| 52. | 38922 | 62.8% | 29.3%(+33.5)#52 | 18.1%(+44.7)#1,507 |
| 53. | 38676 | 62.2% | 29.3%(+32.9)#53 | 18.1%(+44.2)#1,548 |
| 54. | 38664 | 61.9% | 29.3%(+32.6)#54 | 18.1%(+43.8)#1,566 |
| 55. | 38773 | 61.2% | 29.3%(+31.9)#55 | 18.1%(+43.2)#1,612 |
| 56. | 39071 | 60.9% | 29.3%(+31.6)#56 | 18.1%(+42.9)#1,628 |
| 57. | 39421 | 60.6% | 29.3%(+31.3)#57 | 18.1%(+42.5)#1,645 |
| 58. | 39428 | 60.4% | 29.3%(+31.1)#58 | 18.1%(+42.4)#1,652 |
| 59. | 39213 | 60.0% | 29.3%(+30.7)#59 | 18.1%(+42.0)#1,669 |
| 60. | 38762 | 60.0% | 29.3%(+30.7)#60 | 18.1%(+41.9)#1,673 |
| 61. | 38617 | 59.6% | 29.3%(+30.3)#61 | 18.1%(+41.5)#1,722 |
| 62. | 39097 | 59.1% | 29.3%(+29.8)#62 | 18.1%(+41.0)#1,762 |
| 63. | 39119 | 58.7% | 29.3%(+29.4)#63 | 18.1%(+40.6)#1,788 |
| 64. | 39146 | 58.7% | 29.3%(+29.4)#64 | 18.1%(+40.6)#1,789 |
| 65. | 38967 | 58.2% | 29.3%(+28.9)#65 | 18.1%(+40.1)#1,812 |
| 66. | 39090 | 58.1% | 29.3%(+28.8)#66 | 18.1%(+40.1)#1,816 |
| 67. | 38614 | 57.7% | 29.3%(+28.4)#67 | 18.1%(+39.6)#1,851 |
| 68. | 39350 | 57.0% | 29.3%(+27.7)#68 | 18.1%(+38.9)#1,910 |
| 69. | 38726 | 55.6% | 29.3%(+26.3)#69 | 18.1%(+37.5)#2,040 |
| 70. | 39150 | 54.8% | 29.3%(+25.5)#70 | 18.1%(+36.7)#2,084 |
| 71. | 39307 | 54.2% | 29.3%(+24.9)#71 | 18.1%(+36.1)#2,128 |
| 72. | 39747 | 54.0% | 29.3%(+24.7)#72 | 18.1%(+35.9)#2,144 |
| 73. | 39629 | 53.6% | 29.3%(+24.3)#73 | 18.1%(+35.5)#2,179 |
| 74. | 38683 | 53.3% | 29.3%(+24.0)#74 | 18.1%(+35.3)#2,214 |
| 75. | 39209 | 52.5% | 29.3%(+23.3)#75 | 18.1%(+34.5)#2,294 |
| 76. | 39643 | 52.0% | 29.3%(+22.7)#76 | 18.1%(+33.9)#2,343 |
| 77. | 38643 | 51.4% | 29.3%(+22.1)#77 | 18.1%(+33.4)#2,392 |
| 78. | 39059 | 51.3% | 29.3%(+22.0)#78 | 18.1%(+33.3)#2,401 |
| 79. | 38868 | 51.3% | 29.3%(+22.0)#79 | 18.1%(+33.2)#2,406 |
| 80. | 39183 | 51.1% | 29.3%(+21.8)#80 | 18.1%(+33.1)#2,414 |
| 81. | 39365 | 51.1% | 29.3%(+21.8)#81 | 18.1%(+33.0)#2,415 |
| 82. | 38862 | 50.4% | 29.3%(+21.1)#82 | 18.1%(+32.4)#2,488 |
| 83. | 39631 | 50.4% | 29.3%(+21.1)#83 | 18.1%(+32.3)#2,490 |
| 84. | 38646 | 50.2% | 29.3%(+20.9)#84 | 18.1%(+32.2)#2,502 |
| 85. | 39168 | 50.1% | 29.3%(+20.8)#85 | 18.1%(+32.0)#2,510 |
| 86. | 39577 | 49.5% | 29.3%(+20.2)#86 | 18.1%(+31.4)#2,642 |
| 87. | 39362 | 49.5% | 29.3%(+20.2)#87 | 18.1%(+31.4)#2,643 |
| 88. | 39079 | 49.4% | 29.3%(+20.1)#88 | 18.1%(+31.3)#2,653 |
| 89. | 39339 | 49.1% | 29.3%(+19.8)#89 | 18.1%(+31.1)#2,680 |
| 90. | 39630 | 48.8% | 29.3%(+19.5)#90 | 18.1%(+30.7)#2,723 |
| 91. | 39361 | 48.3% | 29.3%(+19.0)#91 | 18.1%(+30.3)#2,777 |
| 92. | 39755 | 48.0% | 29.3%(+18.7)#92 | 18.1%(+29.9)#2,811 |
| 93. | 38625 | 47.2% | 29.3%(+18.0)#93 | 18.1%(+29.2)#2,890 |
| 94. | 39567 | 46.8% | 29.3%(+17.5)#94 | 18.1%(+28.7)#2,950 |
| 95. | 39038 | 46.7% | 29.3%(+17.4)#95 | 18.1%(+28.6)#2,959 |
| 96. | 38701 | 45.9% | 29.3%(+16.6)#96 | 18.1%(+27.9)#3,057 |
| 97. | 39476 | 45.9% | 29.3%(+16.6)#97 | 18.1%(+27.9)#3,059 |
| 98. | 38771 | 45.9% | 29.3%(+16.6)#98 | 18.1%(+27.8)#3,075 |
| 99. | 38721 | 45.8% | 29.3%(+16.5)#99 | 18.1%(+27.8)#3,078 |
| 100. | 38878 | 45.7% | 29.3%(+16.4)#100 | 18.1%(+27.6)#3,091 |
Common Questions
What are the Top 10 Zip Codes with the Highest Poverty Level Among Children Under the Age of 5 in Mississippi?
Top 10 Zip Codes with the Highest Poverty Level Among Children Under the Age of 5 in Mississippi are:
What zip code has the Highest Poverty Level Among Children Under the Age of 5 in Mississippi?
39364 has the Highest Poverty Level Among Children Under the Age of 5 in Mississippi with 100.0%.
What is the Poverty Level Among Children Under the Age of 5 in the State of Mississippi?
Poverty Level Among Children Under the Age of 5 in Mississippi is 29.3%.
What is the Poverty Level Among Children Under the Age of 5 in the United States?
Poverty Level Among Children Under the Age of 5 in the United States is 18.1%.