Zip Codes with the Highest Poverty Level Among Children Under the Age of 5 in Arkansas
RELATED REPORTS & OPTIONS
Highest Poverty | Child 0-5
Arkansas
Compare Zip Codes
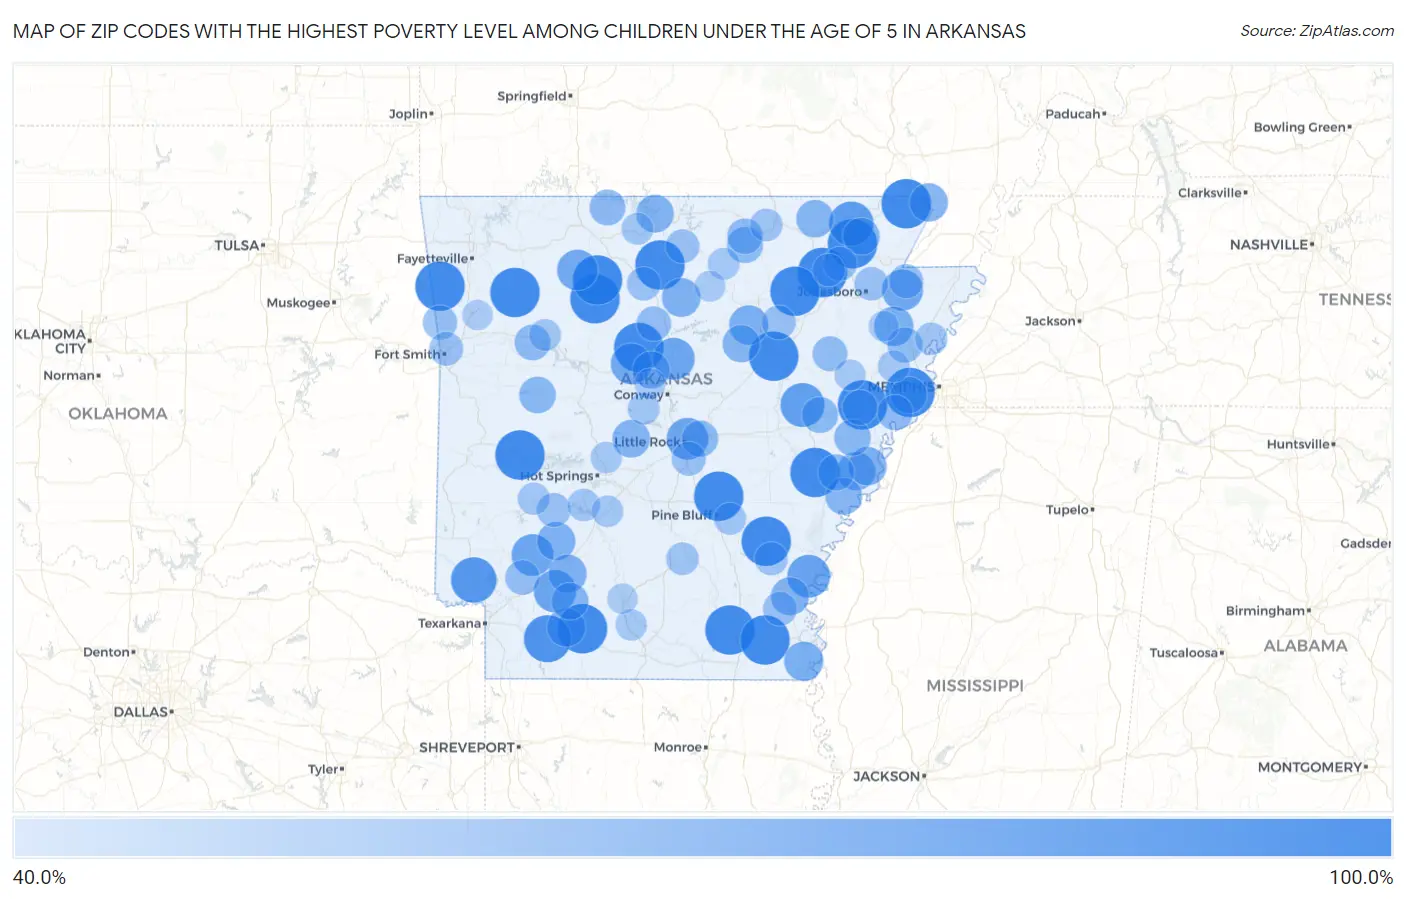
Map of Zip Codes with the Highest Poverty Level Among Children Under the Age of 5 in Arkansas
40.0%
100.0%
Zip Codes with the Highest Poverty Level Among Children Under the Age of 5 in Arkansas
| Zip Code | Child Poverty | vs State | vs National | |
| 1. | 71643 | 100.0% | 26.7%(+73.3)#1 | 18.1%(+81.9)#5 |
| 2. | 71642 | 100.0% | 26.7%(+73.3)#2 | 18.1%(+81.9)#79 |
| 3. | 72069 | 100.0% | 26.7%(+73.3)#3 | 18.1%(+81.9)#80 |
| 4. | 72639 | 100.0% | 26.7%(+73.3)#4 | 18.1%(+81.9)#130 |
| 5. | 72721 | 100.0% | 26.7%(+73.3)#5 | 18.1%(+81.9)#154 |
| 6. | 72030 | 100.0% | 26.7%(+73.3)#6 | 18.1%(+81.9)#168 |
| 7. | 71752 | 100.0% | 26.7%(+73.3)#7 | 18.1%(+81.9)#170 |
| 8. | 72456 | 100.0% | 26.7%(+73.3)#8 | 18.1%(+81.9)#220 |
| 9. | 72856 | 100.0% | 26.7%(+73.3)#9 | 18.1%(+81.9)#233 |
| 10. | 72410 | 100.0% | 26.7%(+73.3)#10 | 18.1%(+81.9)#252 |
| 11. | 71658 | 100.0% | 26.7%(+73.3)#11 | 18.1%(+81.9)#256 |
| 12. | 72655 | 100.0% | 26.7%(+73.3)#12 | 18.1%(+81.9)#276 |
| 13. | 72749 | 100.0% | 26.7%(+73.3)#13 | 18.1%(+81.9)#280 |
| 14. | 72524 | 100.0% | 26.7%(+73.3)#14 | 18.1%(+81.9)#303 |
| 15. | 72152 | 100.0% | 26.7%(+73.3)#15 | 18.1%(+81.9)#307 |
| 16. | 72359 | 100.0% | 26.7%(+73.3)#16 | 18.1%(+81.9)#323 |
| 17. | 72139 | 100.0% | 26.7%(+73.3)#17 | 18.1%(+81.9)#342 |
| 18. | 71965 | 100.0% | 26.7%(+73.3)#18 | 18.1%(+81.9)#386 |
| 19. | 72449 | 100.0% | 26.7%(+73.3)#19 | 18.1%(+81.9)#466 |
| 20. | 72332 | 100.0% | 26.7%(+73.3)#20 | 18.1%(+81.9)#476 |
| 21. | 71860 | 92.9% | 26.7%(+66.2)#21 | 18.1%(+74.8)#602 |
| 22. | 71865 | 88.2% | 26.7%(+61.5)#22 | 18.1%(+70.2)#653 |
| 23. | 72413 | 85.2% | 26.7%(+58.5)#23 | 18.1%(+67.1)#706 |
| 24. | 72036 | 83.3% | 26.7%(+56.6)#24 | 18.1%(+65.3)#743 |
| 25. | 71674 | 80.0% | 26.7%(+53.3)#25 | 18.1%(+61.9)#813 |
| 26. | 71835 | 78.6% | 26.7%(+51.9)#26 | 18.1%(+60.5)#852 |
| 27. | 72039 | 77.1% | 26.7%(+50.4)#27 | 18.1%(+59.0)#894 |
| 28. | 71847 | 77.0% | 26.7%(+50.3)#28 | 18.1%(+59.0)#896 |
| 29. | 72114 | 76.7% | 26.7%(+50.0)#29 | 18.1%(+58.6)#908 |
| 30. | 72414 | 75.0% | 26.7%(+48.3)#30 | 18.1%(+56.9)#970 |
| 31. | 72063 | 74.3% | 26.7%(+47.6)#31 | 18.1%(+56.2)#997 |
| 32. | 72641 | 73.8% | 26.7%(+47.1)#32 | 18.1%(+55.7)#1,015 |
| 33. | 72365 | 69.9% | 26.7%(+43.2)#33 | 18.1%(+51.8)#1,152 |
| 34. | 72534 | 69.6% | 26.7%(+42.9)#34 | 18.1%(+51.5)#1,169 |
| 35. | 71640 | 69.0% | 26.7%(+42.4)#35 | 18.1%(+51.0)#1,194 |
| 36. | 72051 | 67.6% | 26.7%(+41.0)#36 | 18.1%(+49.6)#1,245 |
| 37. | 71770 | 67.1% | 26.7%(+40.4)#37 | 18.1%(+49.0)#1,267 |
| 38. | 72355 | 66.9% | 26.7%(+40.2)#38 | 18.1%(+48.9)#1,273 |
| 39. | 72390 | 66.8% | 26.7%(+40.1)#39 | 18.1%(+48.7)#1,275 |
| 40. | 71922 | 66.7% | 26.7%(+40.0)#40 | 18.1%(+48.6)#1,310 |
| 41. | 72464 | 66.7% | 26.7%(+40.0)#41 | 18.1%(+48.6)#1,318 |
| 42. | 71857 | 66.6% | 26.7%(+39.9)#42 | 18.1%(+48.5)#1,319 |
| 43. | 71654 | 65.5% | 26.7%(+38.8)#43 | 18.1%(+47.4)#1,366 |
| 44. | 72122 | 64.8% | 26.7%(+38.1)#44 | 18.1%(+46.8)#1,394 |
| 45. | 72642 | 64.7% | 26.7%(+38.0)#45 | 18.1%(+46.6)#1,399 |
| 46. | 72460 | 64.3% | 26.7%(+37.6)#46 | 18.1%(+46.2)#1,427 |
| 47. | 72121 | 63.9% | 26.7%(+37.2)#47 | 18.1%(+45.8)#1,457 |
| 48. | 72157 | 63.6% | 26.7%(+36.9)#48 | 18.1%(+45.6)#1,468 |
| 49. | 71858 | 62.7% | 26.7%(+36.0)#49 | 18.1%(+44.6)#1,517 |
| 50. | 72425 | 62.5% | 26.7%(+35.8)#50 | 18.1%(+44.4)#1,533 |
| 51. | 72389 | 62.2% | 26.7%(+35.5)#51 | 18.1%(+44.1)#1,551 |
| 52. | 72842 | 61.5% | 26.7%(+34.8)#52 | 18.1%(+43.5)#1,590 |
| 53. | 72360 | 61.4% | 26.7%(+34.8)#53 | 18.1%(+43.4)#1,602 |
| 54. | 72376 | 61.4% | 26.7%(+34.7)#54 | 18.1%(+43.3)#1,606 |
| 55. | 72117 | 60.5% | 26.7%(+33.9)#55 | 18.1%(+42.5)#1,648 |
| 56. | 72366 | 60.4% | 26.7%(+33.7)#56 | 18.1%(+42.4)#1,653 |
| 57. | 72392 | 60.0% | 26.7%(+33.3)#57 | 18.1%(+41.9)#1,689 |
| 58. | 72536 | 60.0% | 26.7%(+33.3)#58 | 18.1%(+41.9)#1,695 |
| 59. | 72644 | 59.4% | 26.7%(+32.7)#59 | 18.1%(+41.3)#1,734 |
| 60. | 72840 | 59.0% | 26.7%(+32.3)#60 | 18.1%(+41.0)#1,764 |
| 61. | 72512 | 58.5% | 26.7%(+31.8)#61 | 18.1%(+40.4)#1,797 |
| 62. | 72348 | 58.0% | 26.7%(+31.3)#62 | 18.1%(+39.9)#1,831 |
| 63. | 72386 | 57.1% | 26.7%(+30.5)#63 | 18.1%(+39.1)#1,885 |
| 64. | 72335 | 57.1% | 26.7%(+30.4)#64 | 18.1%(+39.0)#1,900 |
| 65. | 72347 | 56.8% | 26.7%(+30.1)#65 | 18.1%(+38.7)#1,927 |
| 66. | 72031 | 55.9% | 26.7%(+29.2)#66 | 18.1%(+37.8)#1,999 |
| 67. | 71862 | 55.6% | 26.7%(+28.9)#67 | 18.1%(+37.5)#2,030 |
| 68. | 72955 | 55.1% | 26.7%(+28.4)#68 | 18.1%(+37.0)#2,064 |
| 69. | 72447 | 54.1% | 26.7%(+27.4)#69 | 18.1%(+36.1)#2,135 |
| 70. | 72476 | 54.0% | 26.7%(+27.3)#70 | 18.1%(+36.0)#2,140 |
| 71. | 72564 | 53.9% | 26.7%(+27.2)#71 | 18.1%(+35.9)#2,150 |
| 72. | 72206 | 53.8% | 26.7%(+27.1)#72 | 18.1%(+35.7)#2,160 |
| 73. | 71638 | 53.7% | 26.7%(+27.0)#73 | 18.1%(+35.7)#2,169 |
| 74. | 71921 | 53.6% | 26.7%(+26.9)#74 | 18.1%(+35.5)#2,181 |
| 75. | 72658 | 53.4% | 26.7%(+26.7)#75 | 18.1%(+35.3)#2,201 |
| 76. | 72904 | 53.4% | 26.7%(+26.7)#76 | 18.1%(+35.3)#2,205 |
| 77. | 72401 | 52.7% | 26.7%(+26.0)#77 | 18.1%(+34.6)#2,283 |
| 78. | 72650 | 52.5% | 26.7%(+25.8)#78 | 18.1%(+34.4)#2,304 |
| 79. | 71639 | 51.5% | 26.7%(+24.8)#79 | 18.1%(+33.4)#2,388 |
| 80. | 71652 | 50.0% | 26.7%(+23.3)#80 | 18.1%(+31.9)#2,551 |
| 81. | 72445 | 50.0% | 26.7%(+23.3)#81 | 18.1%(+31.9)#2,618 |
| 82. | 72529 | 49.8% | 26.7%(+23.1)#82 | 18.1%(+31.8)#2,622 |
| 83. | 71929 | 49.2% | 26.7%(+22.5)#83 | 18.1%(+31.1)#2,673 |
| 84. | 72350 | 49.2% | 26.7%(+22.5)#84 | 18.1%(+31.1)#2,676 |
| 85. | 71601 | 48.5% | 26.7%(+21.8)#85 | 18.1%(+30.4)#2,754 |
| 86. | 71943 | 48.5% | 26.7%(+21.8)#86 | 18.1%(+30.4)#2,762 |
| 87. | 72830 | 47.7% | 26.7%(+21.0)#87 | 18.1%(+29.6)#2,850 |
| 88. | 72016 | 47.5% | 26.7%(+20.8)#88 | 18.1%(+29.5)#2,867 |
| 89. | 72677 | 47.4% | 26.7%(+20.7)#89 | 18.1%(+29.3)#2,882 |
| 90. | 72556 | 47.2% | 26.7%(+20.5)#90 | 18.1%(+29.1)#2,905 |
| 91. | 72331 | 47.0% | 26.7%(+20.3)#91 | 18.1%(+29.0)#2,921 |
| 92. | 71941 | 46.9% | 26.7%(+20.2)#92 | 18.1%(+28.8)#2,933 |
| 93. | 71909 | 46.4% | 26.7%(+19.7)#93 | 18.1%(+28.3)#2,992 |
| 94. | 71751 | 46.2% | 26.7%(+19.5)#94 | 18.1%(+28.1)#3,033 |
| 95. | 72396 | 45.1% | 26.7%(+18.4)#95 | 18.1%(+27.1)#3,164 |
| 96. | 72560 | 44.6% | 26.7%(+17.9)#96 | 18.1%(+26.5)#3,240 |
| 97. | 72127 | 44.4% | 26.7%(+17.8)#97 | 18.1%(+26.4)#3,257 |
| 98. | 71701 | 43.7% | 26.7%(+17.0)#98 | 18.1%(+25.6)#3,388 |
| 99. | 72946 | 43.4% | 26.7%(+16.7)#99 | 18.1%(+25.4)#3,423 |
| 100. | 72472 | 43.3% | 26.7%(+16.6)#100 | 18.1%(+25.3)#3,437 |
Common Questions
What are the Top 10 Zip Codes with the Highest Poverty Level Among Children Under the Age of 5 in Arkansas?
Top 10 Zip Codes with the Highest Poverty Level Among Children Under the Age of 5 in Arkansas are:
What zip code has the Highest Poverty Level Among Children Under the Age of 5 in Arkansas?
71643 has the Highest Poverty Level Among Children Under the Age of 5 in Arkansas with 100.0%.
What is the Poverty Level Among Children Under the Age of 5 in the State of Arkansas?
Poverty Level Among Children Under the Age of 5 in Arkansas is 26.7%.
What is the Poverty Level Among Children Under the Age of 5 in the United States?
Poverty Level Among Children Under the Age of 5 in the United States is 18.1%.