Zip Codes with the Highest Poverty Level Among Children Under the Age of 5 in Virginia
RELATED REPORTS & OPTIONS
Highest Poverty | Child 0-5
Virginia
Compare Zip Codes
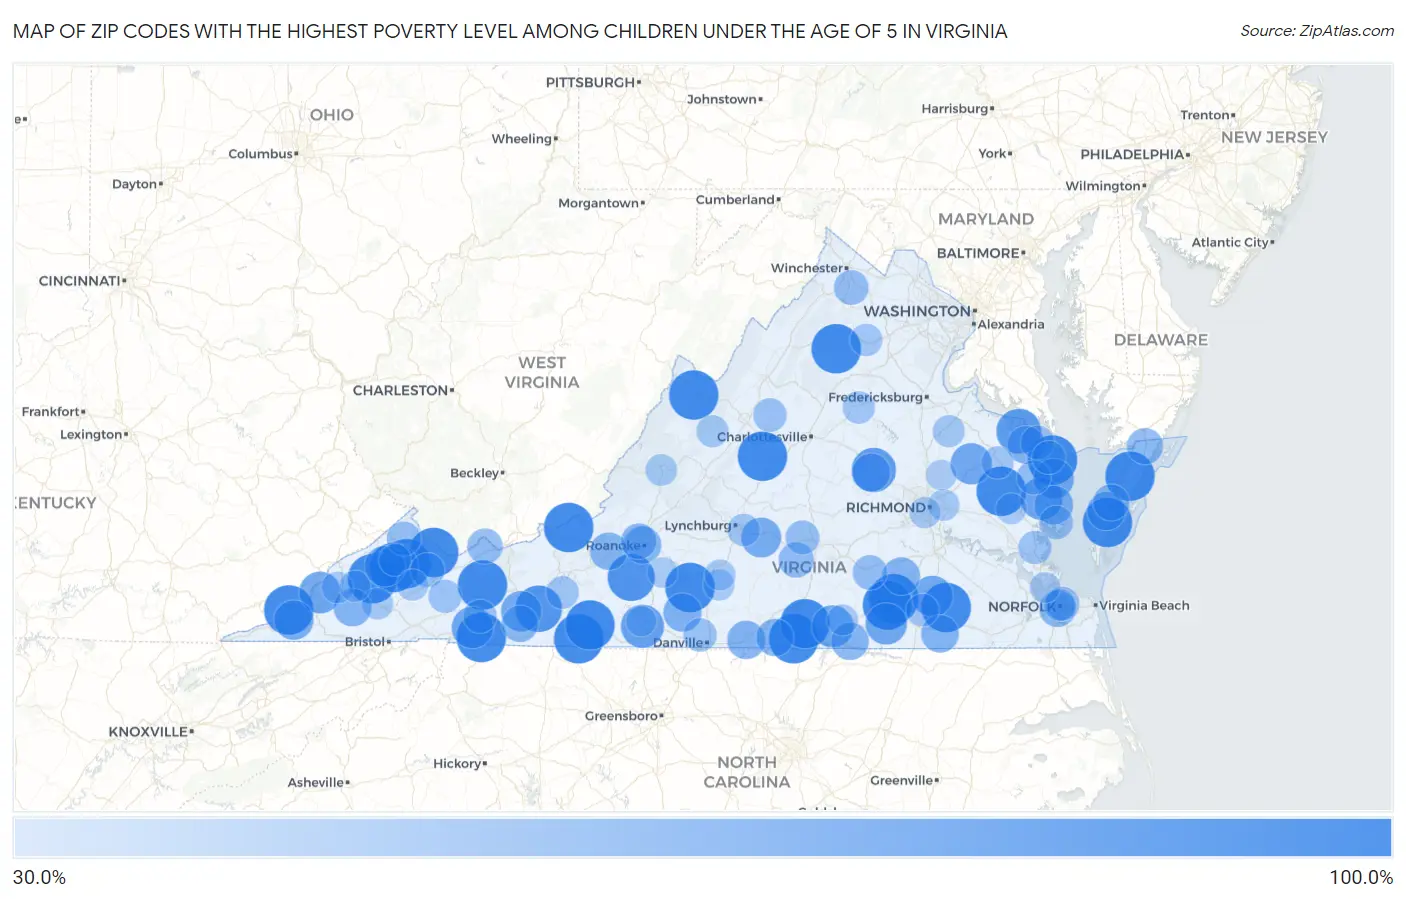
Map of Zip Codes with the Highest Poverty Level Among Children Under the Age of 5 in Virginia
30.0%
100.0%
Zip Codes with the Highest Poverty Level Among Children Under the Age of 5 in Virginia
| Zip Code | Child Poverty | vs State | vs National | |
| 1. | 24053 | 100.0% | 13.9%(+86.1)#1 | 18.1%(+81.9)#21 |
| 2. | 22958 | 100.0% | 13.9%(+86.1)#2 | 18.1%(+81.9)#26 |
| 3. | 24120 | 100.0% | 13.9%(+86.1)#3 | 18.1%(+81.9)#29 |
| 4. | 24529 | 100.0% | 13.9%(+86.1)#4 | 18.1%(+81.9)#58 |
| 5. | 24363 | 100.0% | 13.9%(+86.1)#5 | 18.1%(+81.9)#81 |
| 6. | 22740 | 100.0% | 13.9%(+86.1)#6 | 18.1%(+81.9)#111 |
| 7. | 24646 | 100.0% | 13.9%(+86.1)#7 | 18.1%(+81.9)#117 |
| 8. | 23357 | 100.0% | 13.9%(+86.1)#8 | 18.1%(+81.9)#126 |
| 9. | 23897 | 100.0% | 13.9%(+86.1)#9 | 18.1%(+81.9)#132 |
| 10. | 24282 | 100.0% | 13.9%(+86.1)#10 | 18.1%(+81.9)#152 |
| 11. | 23968 | 100.0% | 13.9%(+86.1)#11 | 18.1%(+81.9)#167 |
| 12. | 24150 | 100.0% | 13.9%(+86.1)#12 | 18.1%(+81.9)#181 |
| 13. | 24318 | 100.0% | 13.9%(+86.1)#13 | 18.1%(+81.9)#192 |
| 14. | 23307 | 100.0% | 13.9%(+86.1)#14 | 18.1%(+81.9)#195 |
| 15. | 23889 | 100.0% | 13.9%(+86.1)#15 | 18.1%(+81.9)#206 |
| 16. | 23091 | 100.0% | 13.9%(+86.1)#16 | 18.1%(+81.9)#215 |
| 17. | 24622 | 100.0% | 13.9%(+86.1)#17 | 18.1%(+81.9)#227 |
| 18. | 23843 | 100.0% | 13.9%(+86.1)#18 | 18.1%(+81.9)#247 |
| 19. | 24272 | 100.0% | 13.9%(+86.1)#19 | 18.1%(+81.9)#277 |
| 20. | 24161 | 100.0% | 13.9%(+86.1)#20 | 18.1%(+81.9)#296 |
| 21. | 24458 | 100.0% | 13.9%(+86.1)#21 | 18.1%(+81.9)#350 |
| 22. | 24239 | 100.0% | 13.9%(+86.1)#22 | 18.1%(+81.9)#441 |
| 23. | 22432 | 100.0% | 13.9%(+86.1)#23 | 18.1%(+81.9)#456 |
| 24. | 24067 | 92.2% | 13.9%(+78.3)#24 | 18.1%(+74.2)#613 |
| 25. | 24312 | 90.8% | 13.9%(+76.9)#25 | 18.1%(+72.7)#629 |
| 26. | 22469 | 84.6% | 13.9%(+70.7)#26 | 18.1%(+66.5)#718 |
| 27. | 23065 | 83.3% | 13.9%(+69.4)#27 | 18.1%(+65.3)#739 |
| 28. | 24089 | 79.5% | 13.9%(+65.6)#28 | 18.1%(+61.4)#833 |
| 29. | 23169 | 76.5% | 13.9%(+62.6)#29 | 18.1%(+58.4)#912 |
| 30. | 23915 | 75.7% | 13.9%(+61.8)#30 | 18.1%(+57.6)#941 |
| 31. | 24216 | 75.0% | 13.9%(+61.1)#31 | 18.1%(+56.9)#953 |
| 32. | 24378 | 74.5% | 13.9%(+60.6)#32 | 18.1%(+56.4)#986 |
| 33. | 23868 | 74.4% | 13.9%(+60.5)#33 | 18.1%(+56.4)#989 |
| 34. | 23148 | 73.5% | 13.9%(+59.6)#34 | 18.1%(+55.5)#1,028 |
| 35. | 23882 | 72.5% | 13.9%(+58.7)#35 | 18.1%(+54.5)#1,065 |
| 36. | 24220 | 72.4% | 13.9%(+58.5)#36 | 18.1%(+54.4)#1,069 |
| 37. | 24350 | 70.8% | 13.9%(+56.9)#37 | 18.1%(+52.7)#1,123 |
| 38. | 22482 | 70.7% | 13.9%(+56.8)#38 | 18.1%(+52.6)#1,128 |
| 39. | 24593 | 69.6% | 13.9%(+55.8)#39 | 18.1%(+51.6)#1,163 |
| 40. | 24277 | 67.9% | 13.9%(+54.1)#40 | 18.1%(+49.9)#1,227 |
| 41. | 23043 | 66.0% | 13.9%(+52.1)#41 | 18.1%(+47.9)#1,342 |
| 42. | 24530 | 64.3% | 13.9%(+50.4)#42 | 18.1%(+46.2)#1,426 |
| 43. | 24520 | 64.0% | 13.9%(+50.1)#43 | 18.1%(+45.9)#1,448 |
| 44. | 23153 | 63.8% | 13.9%(+49.9)#44 | 18.1%(+45.7)#1,462 |
| 45. | 23350 | 63.8% | 13.9%(+49.9)#45 | 18.1%(+45.7)#1,464 |
| 46. | 22435 | 63.2% | 13.9%(+49.3)#46 | 18.1%(+45.1)#1,490 |
| 47. | 23840 | 62.5% | 13.9%(+48.6)#47 | 18.1%(+44.4)#1,524 |
| 48. | 24245 | 62.5% | 13.9%(+48.6)#48 | 18.1%(+44.4)#1,525 |
| 49. | 23844 | 62.5% | 13.9%(+48.6)#49 | 18.1%(+44.4)#1,528 |
| 50. | 24016 | 62.4% | 13.9%(+48.5)#50 | 18.1%(+44.4)#1,540 |
| 51. | 23919 | 61.6% | 13.9%(+47.7)#51 | 18.1%(+43.5)#1,583 |
| 52. | 24087 | 61.1% | 13.9%(+47.3)#52 | 18.1%(+43.1)#1,617 |
| 53. | 24598 | 60.9% | 13.9%(+47.0)#53 | 18.1%(+42.8)#1,630 |
| 54. | 24330 | 58.5% | 13.9%(+44.6)#54 | 18.1%(+40.4)#1,793 |
| 55. | 23704 | 58.5% | 13.9%(+44.6)#55 | 18.1%(+40.4)#1,794 |
| 56. | 23420 | 57.9% | 13.9%(+44.0)#56 | 18.1%(+39.9)#1,835 |
| 57. | 23415 | 57.1% | 13.9%(+43.3)#57 | 18.1%(+39.1)#1,884 |
| 58. | 24017 | 55.6% | 13.9%(+41.7)#58 | 18.1%(+37.5)#2,019 |
| 59. | 24613 | 54.9% | 13.9%(+41.0)#59 | 18.1%(+36.9)#2,075 |
| 60. | 23934 | 54.4% | 13.9%(+40.6)#60 | 18.1%(+36.4)#2,108 |
| 61. | 23824 | 52.6% | 13.9%(+38.7)#61 | 18.1%(+34.5)#2,289 |
| 62. | 22663 | 52.5% | 13.9%(+38.7)#62 | 18.1%(+34.5)#2,295 |
| 63. | 24614 | 51.5% | 13.9%(+37.6)#63 | 18.1%(+33.5)#2,378 |
| 64. | 24612 | 51.5% | 13.9%(+37.6)#64 | 18.1%(+33.5)#2,382 |
| 65. | 22503 | 51.0% | 13.9%(+37.1)#65 | 18.1%(+33.0)#2,423 |
| 66. | 23960 | 50.8% | 13.9%(+36.9)#66 | 18.1%(+32.7)#2,446 |
| 67. | 23504 | 50.1% | 13.9%(+36.2)#67 | 18.1%(+32.0)#2,513 |
| 68. | 22511 | 50.0% | 13.9%(+36.1)#68 | 18.1%(+31.9)#2,550 |
| 69. | 23109 | 49.2% | 13.9%(+35.4)#69 | 18.1%(+31.2)#2,662 |
| 70. | 24431 | 49.1% | 13.9%(+35.3)#70 | 18.1%(+31.1)#2,678 |
| 71. | 24375 | 48.8% | 13.9%(+34.9)#71 | 18.1%(+30.7)#2,722 |
| 72. | 22473 | 48.5% | 13.9%(+34.6)#72 | 18.1%(+30.4)#2,761 |
| 73. | 24540 | 48.4% | 13.9%(+34.5)#73 | 18.1%(+30.4)#2,763 |
| 74. | 23062 | 47.8% | 13.9%(+33.9)#74 | 18.1%(+29.7)#2,837 |
| 75. | 24370 | 47.7% | 13.9%(+33.9)#75 | 18.1%(+29.7)#2,842 |
| 76. | 23867 | 46.4% | 13.9%(+32.5)#76 | 18.1%(+28.3)#2,995 |
| 77. | 24347 | 46.2% | 13.9%(+32.3)#77 | 18.1%(+28.2)#3,016 |
| 78. | 22960 | 45.7% | 13.9%(+31.8)#78 | 18.1%(+27.7)#3,085 |
| 79. | 24504 | 45.6% | 13.9%(+31.7)#79 | 18.1%(+27.5)#3,099 |
| 80. | 22454 | 45.5% | 13.9%(+31.7)#80 | 18.1%(+27.5)#3,102 |
| 81. | 20106 | 45.2% | 13.9%(+31.3)#81 | 18.1%(+27.1)#3,151 |
| 82. | 24656 | 44.4% | 13.9%(+30.6)#82 | 18.1%(+26.4)#3,256 |
| 83. | 22427 | 44.2% | 13.9%(+30.3)#83 | 18.1%(+26.2)#3,308 |
| 84. | 24430 | 44.1% | 13.9%(+30.2)#84 | 18.1%(+26.1)#3,319 |
| 85. | 23510 | 44.0% | 13.9%(+30.1)#85 | 18.1%(+25.9)#3,341 |
| 86. | 24273 | 42.9% | 13.9%(+29.0)#86 | 18.1%(+24.9)#3,490 |
| 87. | 24448 | 42.9% | 13.9%(+29.0)#87 | 18.1%(+24.8)#3,513 |
| 88. | 24224 | 42.6% | 13.9%(+28.7)#88 | 18.1%(+24.5)#3,555 |
| 89. | 24260 | 42.4% | 13.9%(+28.6)#89 | 18.1%(+24.4)#3,583 |
| 90. | 23075 | 42.3% | 13.9%(+28.5)#90 | 18.1%(+24.3)#3,603 |
| 91. | 24230 | 41.9% | 13.9%(+28.0)#91 | 18.1%(+23.9)#3,668 |
| 92. | 23224 | 41.7% | 13.9%(+27.8)#92 | 18.1%(+23.6)#3,699 |
| 93. | 24557 | 41.7% | 13.9%(+27.8)#93 | 18.1%(+23.6)#3,708 |
| 94. | 23970 | 41.2% | 13.9%(+27.3)#94 | 18.1%(+23.1)#3,799 |
| 95. | 24563 | 41.1% | 13.9%(+27.2)#95 | 18.1%(+23.0)#3,814 |
| 96. | 23156 | 40.4% | 13.9%(+26.5)#96 | 18.1%(+22.3)#3,946 |
| 97. | 23607 | 39.8% | 13.9%(+25.9)#97 | 18.1%(+21.8)#4,060 |
| 98. | 23069 | 39.7% | 13.9%(+25.8)#98 | 18.1%(+21.6)#4,084 |
| 99. | 24055 | 39.3% | 13.9%(+25.4)#99 | 18.1%(+21.2)#4,152 |
| 100. | 24184 | 39.2% | 13.9%(+25.3)#100 | 18.1%(+21.1)#4,172 |
Common Questions
What are the Top 10 Zip Codes with the Highest Poverty Level Among Children Under the Age of 5 in Virginia?
Top 10 Zip Codes with the Highest Poverty Level Among Children Under the Age of 5 in Virginia are:
What zip code has the Highest Poverty Level Among Children Under the Age of 5 in Virginia?
24053 has the Highest Poverty Level Among Children Under the Age of 5 in Virginia with 100.0%.
What is the Poverty Level Among Children Under the Age of 5 in the State of Virginia?
Poverty Level Among Children Under the Age of 5 in Virginia is 13.9%.
What is the Poverty Level Among Children Under the Age of 5 in the United States?
Poverty Level Among Children Under the Age of 5 in the United States is 18.1%.