Zip Codes with the Highest Poverty Level Among Children Under the Age of 5 in Nebraska
RELATED REPORTS & OPTIONS
Highest Poverty | Child 0-5
Nebraska
Compare Zip Codes
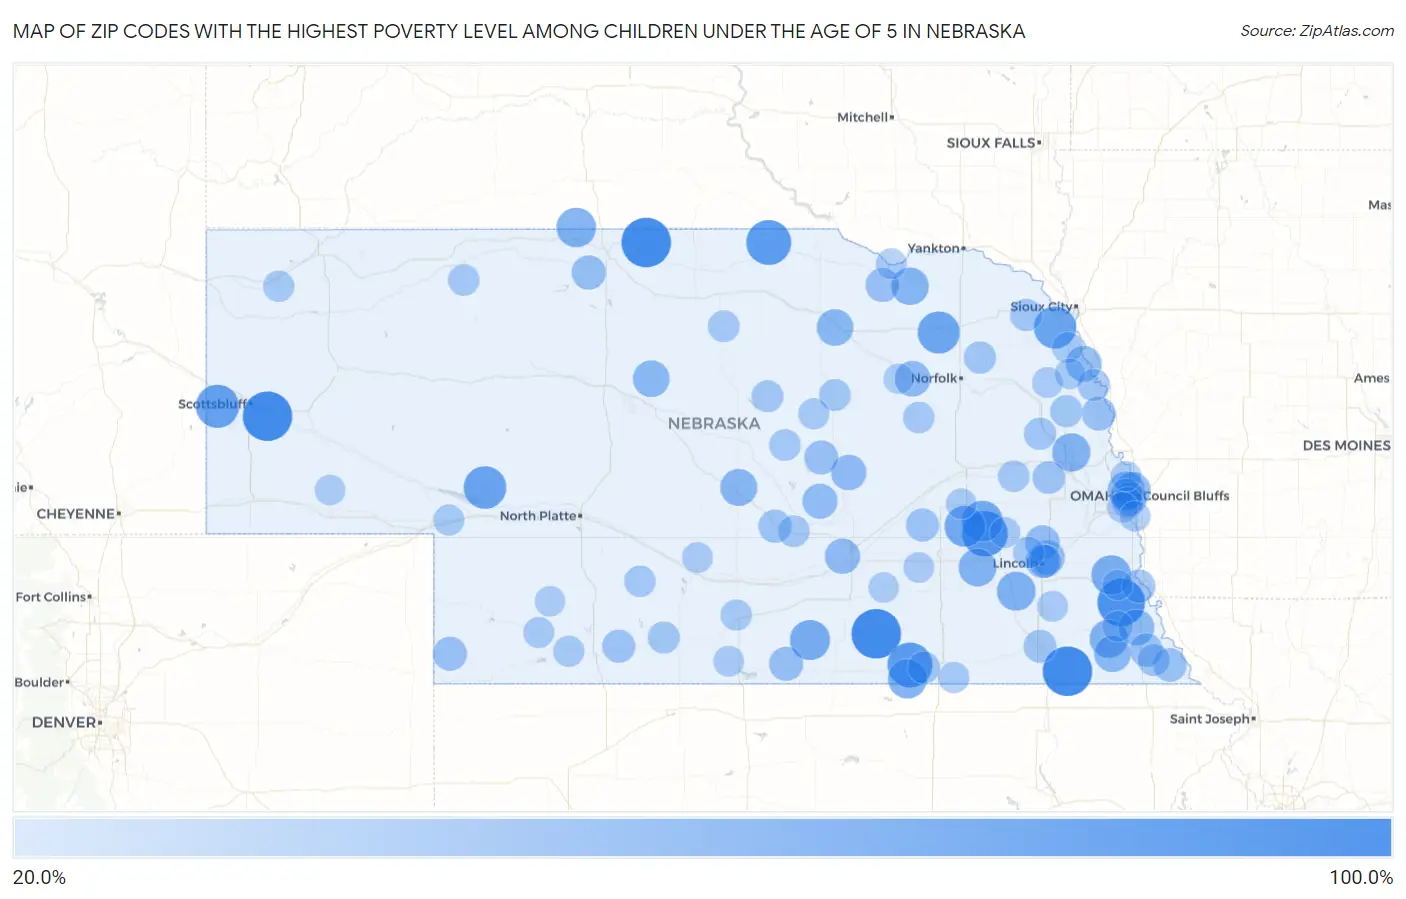
Map of Zip Codes with the Highest Poverty Level Among Children Under the Age of 5 in Nebraska
20.0%
100.0%
Zip Codes with the Highest Poverty Level Among Children Under the Age of 5 in Nebraska
| Zip Code | Child Poverty | vs State | vs National | |
| 1. | 69355 | 100.0% | 13.8%(+86.2)#1 | 18.1%(+81.9)#450 |
| 2. | 68934 | 100.0% | 13.8%(+86.2)#2 | 18.1%(+81.9)#480 |
| 3. | 68381 | 100.0% | 13.8%(+86.2)#3 | 18.1%(+81.9)#486 |
| 4. | 69220 | 100.0% | 13.8%(+86.2)#4 | 18.1%(+81.9)#548 |
| 5. | 68448 | 92.3% | 13.8%(+78.5)#5 | 18.1%(+74.2)#612 |
| 6. | 68439 | 84.6% | 13.8%(+70.8)#6 | 18.1%(+66.6)#715 |
| 7. | 68755 | 81.8% | 13.8%(+68.0)#7 | 18.1%(+63.8)#773 |
| 8. | 68974 | 81.8% | 13.8%(+68.0)#8 | 18.1%(+63.8)#774 |
| 9. | 69352 | 75.0% | 13.8%(+61.2)#9 | 18.1%(+56.9)#961 |
| 10. | 69144 | 72.7% | 13.8%(+59.0)#10 | 18.1%(+54.7)#1,057 |
| 11. | 68741 | 71.4% | 13.8%(+57.7)#11 | 18.1%(+53.4)#1,099 |
| 12. | 68765 | 71.3% | 13.8%(+57.5)#12 | 18.1%(+53.2)#1,107 |
| 13. | 68669 | 66.7% | 13.8%(+52.9)#13 | 18.1%(+48.6)#1,292 |
| 14. | 68367 | 66.7% | 13.8%(+52.9)#14 | 18.1%(+48.6)#1,299 |
| 15. | 68932 | 63.6% | 13.8%(+49.9)#15 | 18.1%(+45.6)#1,473 |
| 16. | 68417 | 61.5% | 13.8%(+47.8)#16 | 18.1%(+43.5)#1,595 |
| 17. | 69212 | 60.9% | 13.8%(+47.1)#17 | 18.1%(+42.8)#1,632 |
| 18. | 68943 | 60.0% | 13.8%(+46.2)#18 | 18.1%(+41.9)#1,700 |
| 19. | 68333 | 57.8% | 13.8%(+44.0)#19 | 18.1%(+39.8)#1,842 |
| 20. | 68044 | 56.0% | 13.8%(+42.2)#20 | 18.1%(+37.9)#1,989 |
| 21. | 68348 | 55.6% | 13.8%(+41.8)#21 | 18.1%(+37.5)#2,043 |
| 22. | 68313 | 54.5% | 13.8%(+40.8)#22 | 18.1%(+36.5)#2,101 |
| 23. | 68724 | 53.3% | 13.8%(+39.6)#23 | 18.1%(+35.3)#2,225 |
| 24. | 68111 | 51.6% | 13.8%(+37.8)#24 | 18.1%(+33.5)#2,376 |
| 25. | 68814 | 51.1% | 13.8%(+37.3)#25 | 18.1%(+33.0)#2,419 |
| 26. | 68447 | 50.0% | 13.8%(+36.2)#26 | 18.1%(+31.9)#2,565 |
| 27. | 68742 | 50.0% | 13.8%(+36.2)#27 | 18.1%(+31.9)#2,589 |
| 28. | 69157 | 50.0% | 13.8%(+36.2)#28 | 18.1%(+31.9)#2,614 |
| 29. | 68305 | 47.7% | 13.8%(+33.9)#29 | 18.1%(+29.6)#2,847 |
| 30. | 68110 | 47.2% | 13.8%(+33.4)#30 | 18.1%(+29.1)#2,903 |
| 31. | 68039 | 46.8% | 13.8%(+33.0)#31 | 18.1%(+28.7)#2,948 |
| 32. | 68781 | 46.2% | 13.8%(+32.4)#32 | 18.1%(+28.2)#3,019 |
| 33. | 68882 | 45.5% | 13.8%(+31.7)#33 | 18.1%(+27.4)#3,120 |
| 34. | 68810 | 45.0% | 13.8%(+31.2)#34 | 18.1%(+26.9)#3,184 |
| 35. | 68838 | 44.4% | 13.8%(+30.7)#35 | 18.1%(+26.4)#3,276 |
| 36. | 68504 | 42.4% | 13.8%(+28.6)#36 | 18.1%(+24.3)#3,592 |
| 37. | 68336 | 42.0% | 13.8%(+28.2)#37 | 18.1%(+23.9)#3,660 |
| 38. | 69201 | 40.9% | 13.8%(+27.1)#38 | 18.1%(+22.8)#3,857 |
| 39. | 68939 | 40.3% | 13.8%(+26.5)#39 | 18.1%(+22.2)#3,964 |
| 40. | 68783 | 40.0% | 13.8%(+26.2)#40 | 18.1%(+21.9)#4,016 |
| 41. | 68875 | 40.0% | 13.8%(+26.2)#41 | 18.1%(+21.9)#4,025 |
| 42. | 69030 | 40.0% | 13.8%(+26.2)#42 | 18.1%(+21.9)#4,034 |
| 43. | 68508 | 39.6% | 13.8%(+25.8)#43 | 18.1%(+21.5)#4,109 |
| 44. | 68061 | 38.9% | 13.8%(+25.1)#44 | 18.1%(+20.8)#4,240 |
| 45. | 68355 | 38.1% | 13.8%(+24.3)#45 | 18.1%(+20.0)#4,386 |
| 46. | 68108 | 37.6% | 13.8%(+23.8)#46 | 18.1%(+19.5)#4,479 |
| 47. | 68442 | 37.5% | 13.8%(+23.7)#47 | 18.1%(+19.4)#4,500 |
| 48. | 68410 | 37.2% | 13.8%(+23.4)#48 | 18.1%(+19.1)#4,554 |
| 49. | 68654 | 37.0% | 13.8%(+23.3)#49 | 18.1%(+19.0)#4,589 |
| 50. | 68844 | 36.7% | 13.8%(+22.9)#50 | 18.1%(+18.6)#4,664 |
| 51. | 69034 | 36.5% | 13.8%(+22.8)#51 | 18.1%(+18.5)#4,694 |
| 52. | 68503 | 36.2% | 13.8%(+22.5)#52 | 18.1%(+18.2)#4,771 |
| 53. | 68310 | 35.5% | 13.8%(+21.7)#53 | 18.1%(+17.4)#4,947 |
| 54. | 68015 | 35.1% | 13.8%(+21.4)#54 | 18.1%(+17.1)#5,035 |
| 55. | 68131 | 34.3% | 13.8%(+20.5)#55 | 18.1%(+16.2)#5,235 |
| 56. | 68057 | 33.3% | 13.8%(+19.6)#56 | 18.1%(+15.3)#5,464 |
| 57. | 68340 | 33.3% | 13.8%(+19.6)#57 | 18.1%(+15.3)#5,472 |
| 58. | 68740 | 33.3% | 13.8%(+19.6)#58 | 18.1%(+15.3)#5,476 |
| 59. | 68710 | 33.3% | 13.8%(+19.6)#59 | 18.1%(+15.3)#5,481 |
| 60. | 68020 | 33.3% | 13.8%(+19.6)#60 | 18.1%(+15.3)#5,492 |
| 61. | 68457 | 33.3% | 13.8%(+19.6)#61 | 18.1%(+15.3)#5,501 |
| 62. | 68045 | 32.6% | 13.8%(+18.8)#62 | 18.1%(+14.5)#5,695 |
| 63. | 68948 | 32.1% | 13.8%(+18.4)#63 | 18.1%(+14.1)#5,812 |
| 64. | 68823 | 31.8% | 13.8%(+18.0)#64 | 18.1%(+13.8)#5,878 |
| 65. | 68622 | 31.6% | 13.8%(+17.8)#65 | 18.1%(+13.5)#5,938 |
| 66. | 68869 | 31.2% | 13.8%(+17.5)#66 | 18.1%(+13.2)#6,016 |
| 67. | 68862 | 31.1% | 13.8%(+17.4)#67 | 18.1%(+13.1)#6,046 |
| 68. | 68714 | 31.1% | 13.8%(+17.3)#68 | 18.1%(+13.0)#6,064 |
| 69. | 68036 | 30.3% | 13.8%(+16.5)#69 | 18.1%(+12.2)#6,266 |
| 70. | 69029 | 30.3% | 13.8%(+16.5)#70 | 18.1%(+12.2)#6,268 |
| 71. | 68758 | 30.3% | 13.8%(+16.5)#71 | 18.1%(+12.2)#6,273 |
| 72. | 68524 | 30.2% | 13.8%(+16.5)#72 | 18.1%(+12.2)#6,282 |
| 73. | 69343 | 30.1% | 13.8%(+16.3)#73 | 18.1%(+12.1)#6,314 |
| 74. | 68949 | 29.6% | 13.8%(+15.8)#74 | 18.1%(+11.5)#6,480 |
| 75. | 69339 | 29.4% | 13.8%(+15.6)#75 | 18.1%(+11.3)#6,528 |
| 76. | 69024 | 29.4% | 13.8%(+15.6)#76 | 18.1%(+11.3)#6,547 |
| 77. | 68071 | 28.6% | 13.8%(+14.8)#77 | 18.1%(+10.5)#6,779 |
| 78. | 69127 | 28.6% | 13.8%(+14.8)#78 | 18.1%(+10.5)#6,789 |
| 79. | 69040 | 28.6% | 13.8%(+14.8)#79 | 18.1%(+10.5)#6,792 |
| 80. | 68637 | 28.6% | 13.8%(+14.8)#80 | 18.1%(+10.5)#6,800 |
| 81. | 68375 | 28.6% | 13.8%(+14.8)#81 | 18.1%(+10.5)#6,804 |
| 82. | 68107 | 28.4% | 13.8%(+14.7)#82 | 18.1%(+10.4)#6,841 |
| 83. | 68760 | 28.4% | 13.8%(+14.6)#83 | 18.1%(+10.3)#6,867 |
| 84. | 68358 | 28.2% | 13.8%(+14.4)#84 | 18.1%(+10.1)#6,910 |
| 85. | 68157 | 27.9% | 13.8%(+14.1)#85 | 18.1%(+9.84)#6,982 |
| 86. | 68004 | 27.8% | 13.8%(+14.0)#86 | 18.1%(+9.71)#7,033 |
| 87. | 68966 | 27.8% | 13.8%(+14.0)#87 | 18.1%(+9.71)#7,039 |
| 88. | 68005 | 27.7% | 13.8%(+13.9)#88 | 18.1%(+9.62)#7,062 |
| 89. | 68850 | 27.6% | 13.8%(+13.8)#89 | 18.1%(+9.52)#7,098 |
| 90. | 68378 | 27.6% | 13.8%(+13.8)#90 | 18.1%(+9.52)#7,108 |
| 91. | 68371 | 27.6% | 13.8%(+13.8)#91 | 18.1%(+9.50)#7,118 |
| 92. | 68662 | 27.4% | 13.8%(+13.6)#92 | 18.1%(+9.32)#7,175 |
| 93. | 68314 | 27.3% | 13.8%(+13.5)#93 | 18.1%(+9.21)#7,227 |
| 94. | 68055 | 26.9% | 13.8%(+13.2)#94 | 18.1%(+8.86)#7,330 |
| 95. | 68944 | 26.8% | 13.8%(+13.0)#95 | 18.1%(+8.70)#7,381 |
| 96. | 69141 | 26.7% | 13.8%(+12.9)#96 | 18.1%(+8.60)#7,425 |
| 97. | 68761 | 26.7% | 13.8%(+12.9)#97 | 18.1%(+8.60)#7,426 |
| 98. | 69032 | 26.3% | 13.8%(+12.5)#98 | 18.1%(+8.25)#7,541 |
| 99. | 68346 | 26.3% | 13.8%(+12.5)#99 | 18.1%(+8.25)#7,542 |
| 100. | 68112 | 26.3% | 13.8%(+12.5)#100 | 18.1%(+8.23)#7,549 |
Common Questions
What are the Top 10 Zip Codes with the Highest Poverty Level Among Children Under the Age of 5 in Nebraska?
Top 10 Zip Codes with the Highest Poverty Level Among Children Under the Age of 5 in Nebraska are:
What zip code has the Highest Poverty Level Among Children Under the Age of 5 in Nebraska?
69355 has the Highest Poverty Level Among Children Under the Age of 5 in Nebraska with 100.0%.
What is the Poverty Level Among Children Under the Age of 5 in the State of Nebraska?
Poverty Level Among Children Under the Age of 5 in Nebraska is 13.8%.
What is the Poverty Level Among Children Under the Age of 5 in the United States?
Poverty Level Among Children Under the Age of 5 in the United States is 18.1%.