Zip Codes with the Highest Poverty Level Among Children Under the Age of 5 in Alabama
RELATED REPORTS & OPTIONS
Highest Poverty | Child 0-5
Alabama
Compare Zip Codes
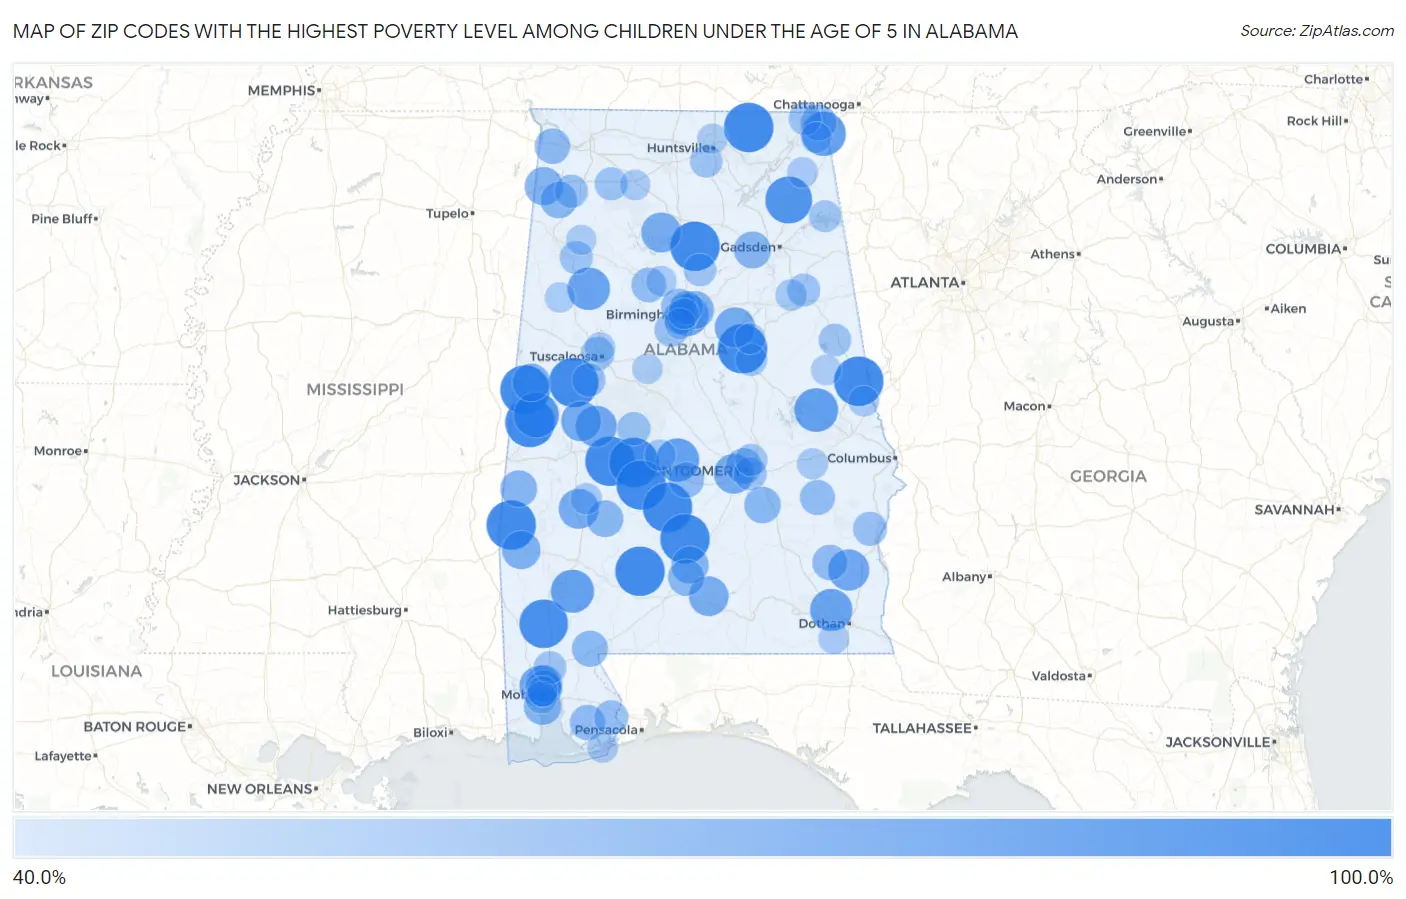
Map of Zip Codes with the Highest Poverty Level Among Children Under the Age of 5 in Alabama
40.0%
100.0%
Zip Codes with the Highest Poverty Level Among Children Under the Age of 5 in Alabama
| Zip Code | Child Poverty | vs State | vs National | |
| 1. | 36786 | 100.0% | 25.1%(+74.9)#1 | 18.1%(+81.9)#22 |
| 2. | 36759 | 100.0% | 25.1%(+74.9)#2 | 18.1%(+81.9)#34 |
| 3. | 36767 | 100.0% | 25.1%(+74.9)#3 | 18.1%(+81.9)#49 |
| 4. | 36855 | 100.0% | 25.1%(+74.9)#4 | 18.1%(+81.9)#59 |
| 5. | 35460 | 100.0% | 25.1%(+74.9)#5 | 18.1%(+81.9)#118 |
| 6. | 36471 | 100.0% | 25.1%(+74.9)#6 | 18.1%(+81.9)#122 |
| 7. | 36761 | 100.0% | 25.1%(+74.9)#7 | 18.1%(+81.9)#144 |
| 8. | 36915 | 100.0% | 25.1%(+74.9)#8 | 18.1%(+81.9)#207 |
| 9. | 36030 | 100.0% | 25.1%(+74.9)#9 | 18.1%(+81.9)#326 |
| 10. | 35469 | 100.0% | 25.1%(+74.9)#10 | 18.1%(+81.9)#357 |
| 11. | 35766 | 100.0% | 25.1%(+74.9)#11 | 18.1%(+81.9)#371 |
| 12. | 35070 | 100.0% | 25.1%(+74.9)#12 | 18.1%(+81.9)#491 |
| 13. | 35477 | 100.0% | 25.1%(+74.9)#13 | 18.1%(+81.9)#497 |
| 14. | 35032 | 100.0% | 25.1%(+74.9)#14 | 18.1%(+81.9)#553 |
| 15. | 36553 | 97.4% | 25.1%(+72.3)#15 | 18.1%(+79.3)#563 |
| 16. | 35963 | 93.3% | 25.1%(+68.2)#16 | 18.1%(+75.3)#599 |
| 17. | 35464 | 88.6% | 25.1%(+63.4)#17 | 18.1%(+70.5)#651 |
| 18. | 35979 | 86.1% | 25.1%(+61.0)#18 | 18.1%(+68.0)#685 |
| 19. | 36850 | 84.4% | 25.1%(+59.3)#19 | 18.1%(+66.4)#723 |
| 20. | 36703 | 83.4% | 25.1%(+58.2)#20 | 18.1%(+65.3)#738 |
| 21. | 36545 | 83.1% | 25.1%(+58.0)#21 | 18.1%(+65.1)#748 |
| 22. | 35542 | 81.4% | 25.1%(+56.3)#22 | 18.1%(+63.4)#781 |
| 23. | 36371 | 81.0% | 25.1%(+55.8)#23 | 18.1%(+62.9)#792 |
| 24. | 35203 | 80.2% | 25.1%(+55.1)#24 | 18.1%(+62.2)#803 |
| 25. | 36612 | 78.0% | 25.1%(+52.8)#25 | 18.1%(+59.9)#872 |
| 26. | 36744 | 77.8% | 25.1%(+52.7)#26 | 18.1%(+59.7)#873 |
| 27. | 36317 | 77.8% | 25.1%(+52.7)#27 | 18.1%(+59.7)#877 |
| 28. | 35178 | 75.8% | 25.1%(+50.7)#28 | 18.1%(+57.7)#935 |
| 29. | 36776 | 75.0% | 25.1%(+49.9)#29 | 18.1%(+56.9)#954 |
| 30. | 36736 | 75.0% | 25.1%(+49.9)#30 | 18.1%(+56.9)#956 |
| 31. | 35098 | 74.6% | 25.1%(+49.5)#31 | 18.1%(+56.6)#981 |
| 32. | 36108 | 74.3% | 25.1%(+49.2)#32 | 18.1%(+56.2)#994 |
| 33. | 36474 | 73.7% | 25.1%(+48.6)#33 | 18.1%(+55.6)#1,020 |
| 34. | 36919 | 70.6% | 25.1%(+45.5)#34 | 18.1%(+52.5)#1,130 |
| 35. | 35582 | 69.9% | 25.1%(+44.8)#35 | 18.1%(+51.9)#1,150 |
| 36. | 35212 | 69.2% | 25.1%(+44.1)#36 | 18.1%(+51.2)#1,188 |
| 37. | 35442 | 69.2% | 25.1%(+44.0)#37 | 18.1%(+51.1)#1,192 |
| 38. | 36033 | 67.8% | 25.1%(+42.7)#38 | 18.1%(+49.8)#1,233 |
| 39. | 36605 | 67.8% | 25.1%(+42.7)#39 | 18.1%(+49.8)#1,234 |
| 40. | 36611 | 67.6% | 25.1%(+42.5)#40 | 18.1%(+49.5)#1,248 |
| 41. | 35972 | 66.7% | 25.1%(+41.5)#41 | 18.1%(+48.6)#1,281 |
| 42. | 36610 | 66.5% | 25.1%(+41.4)#42 | 18.1%(+48.4)#1,321 |
| 43. | 36912 | 66.3% | 25.1%(+41.1)#43 | 18.1%(+48.2)#1,331 |
| 44. | 36769 | 66.1% | 25.1%(+40.9)#44 | 18.1%(+48.0)#1,339 |
| 45. | 35571 | 65.8% | 25.1%(+40.7)#45 | 18.1%(+47.7)#1,351 |
| 46. | 36456 | 65.7% | 25.1%(+40.5)#46 | 18.1%(+47.6)#1,358 |
| 47. | 36069 | 65.6% | 25.1%(+40.4)#47 | 18.1%(+47.5)#1,361 |
| 48. | 36562 | 64.6% | 25.1%(+39.5)#48 | 18.1%(+46.6)#1,405 |
| 49. | 36104 | 64.4% | 25.1%(+39.2)#49 | 18.1%(+46.3)#1,418 |
| 50. | 35958 | 64.0% | 25.1%(+38.9)#50 | 18.1%(+46.0)#1,445 |
| 51. | 36785 | 62.9% | 25.1%(+37.8)#51 | 18.1%(+44.8)#1,504 |
| 52. | 35616 | 62.7% | 25.1%(+37.6)#52 | 18.1%(+44.6)#1,512 |
| 53. | 36580 | 62.5% | 25.1%(+37.4)#53 | 18.1%(+44.4)#1,537 |
| 54. | 36017 | 62.3% | 25.1%(+37.2)#54 | 18.1%(+44.3)#1,545 |
| 55. | 35214 | 62.1% | 25.1%(+37.0)#55 | 18.1%(+44.0)#1,552 |
| 56. | 36089 | 61.8% | 25.1%(+36.6)#56 | 18.1%(+43.7)#1,573 |
| 57. | 35550 | 61.2% | 25.1%(+36.0)#57 | 18.1%(+43.1)#1,614 |
| 58. | 36574 | 60.0% | 25.1%(+34.9)#58 | 18.1%(+41.9)#1,677 |
| 59. | 36027 | 59.0% | 25.1%(+33.8)#59 | 18.1%(+40.9)#1,773 |
| 60. | 35020 | 58.2% | 25.1%(+33.1)#60 | 18.1%(+40.2)#1,811 |
| 61. | 35208 | 58.1% | 25.1%(+32.9)#61 | 18.1%(+40.0)#1,819 |
| 62. | 35207 | 57.8% | 25.1%(+32.7)#62 | 18.1%(+39.7)#1,843 |
| 63. | 36756 | 57.8% | 25.1%(+32.7)#63 | 18.1%(+39.7)#1,844 |
| 64. | 35476 | 57.7% | 25.1%(+32.6)#64 | 18.1%(+39.7)#1,848 |
| 65. | 35463 | 57.6% | 25.1%(+32.4)#65 | 18.1%(+39.5)#1,860 |
| 66. | 35585 | 57.3% | 25.1%(+32.2)#66 | 18.1%(+39.3)#1,875 |
| 67. | 36111 | 56.9% | 25.1%(+31.7)#67 | 18.1%(+38.8)#1,919 |
| 68. | 35594 | 56.8% | 25.1%(+31.7)#68 | 18.1%(+38.8)#1,922 |
| 69. | 35651 | 56.6% | 25.1%(+31.5)#69 | 18.1%(+38.5)#1,940 |
| 70. | 36205 | 56.2% | 25.1%(+31.0)#70 | 18.1%(+38.1)#1,977 |
| 71. | 36525 | 55.6% | 25.1%(+30.5)#71 | 18.1%(+37.5)#2,017 |
| 72. | 36278 | 55.6% | 25.1%(+30.4)#72 | 18.1%(+37.5)#2,020 |
| 73. | 35740 | 55.6% | 25.1%(+30.4)#73 | 18.1%(+37.5)#2,022 |
| 74. | 35172 | 55.6% | 25.1%(+30.4)#74 | 18.1%(+37.5)#2,023 |
| 75. | 35808 | 55.6% | 25.1%(+30.4)#75 | 18.1%(+37.5)#2,027 |
| 76. | 36110 | 54.7% | 25.1%(+29.5)#76 | 18.1%(+36.6)#2,092 |
| 77. | 36606 | 54.1% | 25.1%(+29.0)#77 | 18.1%(+36.1)#2,134 |
| 78. | 35150 | 53.5% | 25.1%(+28.4)#78 | 18.1%(+35.4)#2,191 |
| 79. | 35959 | 53.3% | 25.1%(+28.2)#79 | 18.1%(+35.3)#2,213 |
| 80. | 36201 | 53.1% | 25.1%(+27.9)#80 | 18.1%(+35.0)#2,243 |
| 81. | 36754 | 52.2% | 25.1%(+27.0)#81 | 18.1%(+34.1)#2,331 |
| 82. | 36701 | 52.1% | 25.1%(+26.9)#82 | 18.1%(+34.0)#2,338 |
| 83. | 35211 | 51.7% | 25.1%(+26.6)#83 | 18.1%(+33.7)#2,365 |
| 84. | 36088 | 51.7% | 25.1%(+26.6)#84 | 18.1%(+33.6)#2,367 |
| 85. | 35966 | 51.1% | 25.1%(+25.9)#85 | 18.1%(+33.0)#2,418 |
| 86. | 35204 | 50.9% | 25.1%(+25.8)#86 | 18.1%(+32.8)#2,437 |
| 87. | 36375 | 50.8% | 25.1%(+25.7)#87 | 18.1%(+32.7)#2,444 |
| 88. | 35014 | 50.7% | 25.1%(+25.6)#88 | 18.1%(+32.6)#2,456 |
| 89. | 36561 | 50.6% | 25.1%(+25.5)#89 | 18.1%(+32.6)#2,462 |
| 90. | 35148 | 50.6% | 25.1%(+25.5)#90 | 18.1%(+32.6)#2,464 |
| 91. | 35988 | 50.6% | 25.1%(+25.5)#91 | 18.1%(+32.6)#2,465 |
| 92. | 36863 | 50.6% | 25.1%(+25.5)#92 | 18.1%(+32.5)#2,471 |
| 93. | 35650 | 50.2% | 25.1%(+25.1)#93 | 18.1%(+32.1)#2,507 |
| 94. | 35545 | 50.0% | 25.1%(+24.9)#94 | 18.1%(+31.9)#2,607 |
| 95. | 35473 | 49.9% | 25.1%(+24.8)#95 | 18.1%(+31.8)#2,619 |
| 96. | 35810 | 49.7% | 25.1%(+24.6)#96 | 18.1%(+31.7)#2,625 |
| 97. | 36617 | 49.7% | 25.1%(+24.6)#97 | 18.1%(+31.7)#2,628 |
| 98. | 35184 | 49.7% | 25.1%(+24.5)#98 | 18.1%(+31.6)#2,632 |
| 99. | 36276 | 49.6% | 25.1%(+24.5)#99 | 18.1%(+31.5)#2,637 |
| 100. | 35548 | 49.5% | 25.1%(+24.4)#100 | 18.1%(+31.5)#2,639 |
Common Questions
What are the Top 10 Zip Codes with the Highest Poverty Level Among Children Under the Age of 5 in Alabama?
Top 10 Zip Codes with the Highest Poverty Level Among Children Under the Age of 5 in Alabama are:
What zip code has the Highest Poverty Level Among Children Under the Age of 5 in Alabama?
36786 has the Highest Poverty Level Among Children Under the Age of 5 in Alabama with 100.0%.
What is the Poverty Level Among Children Under the Age of 5 in the State of Alabama?
Poverty Level Among Children Under the Age of 5 in Alabama is 25.1%.
What is the Poverty Level Among Children Under the Age of 5 in the United States?
Poverty Level Among Children Under the Age of 5 in the United States is 18.1%.