Maybeury, WV Map & Demographics
Maybeury Map
Maybeury Overview
$10,118
PER CAPITA INCOME
$31,974
AVG FAMILY INCOME
0.36
INEQUALITY / GINI INDEX
163
TOTAL POPULATION
66
MALE POPULATION
97
FEMALE POPULATION
68.04
MALES / 100 FEMALES
146.97
FEMALES / 100 MALES
35.8
MEDIAN AGE
3.8
AVG FAMILY SIZE
4.2
AVG HOUSEHOLD SIZE
50
LABOR FORCE [ PEOPLE ]
30.7%
PERCENT IN LABOR FORCE
18.0%
UNEMPLOYMENT RATE
Maybeury Zip Codes
Maybeury Area Codes
Income in Maybeury
Income Overview in Maybeury
| Characteristic | Number | Measure |
| Per Capita Income | 163 | $10,118 |
| Median Family Income | 30 | $31,974 |
| Mean Family Income | 30 | $39,200 |
| Median Household Income | 39 | $0 |
| Mean Household Income | 39 | $31,746 |
| Income Deficit | 30 | $0 |
| Wage / Income Gap (%) | 163 | 0.00% |
| Wage / Income Gap ($) | 163 | 100.00¢ per $1 |
| Gini / Inequality Index | 163 | 0.36 |
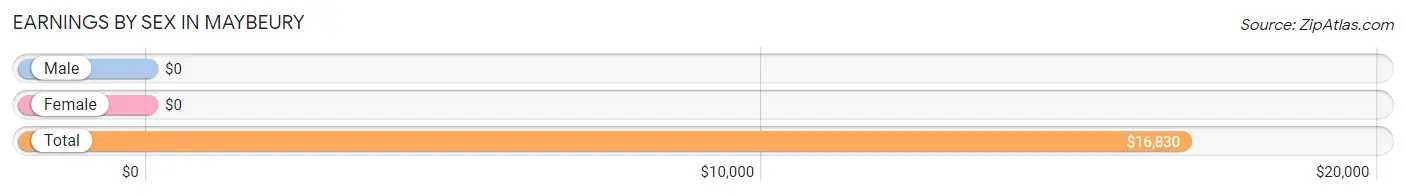
Earnings by Sex in Maybeury
| Sex | Number | Average Earnings |
| Male | 33 (80.5%) | $0 |
| Female | 8 (19.5%) | $0 |
| Total | 41 (100.0%) | $16,830 |
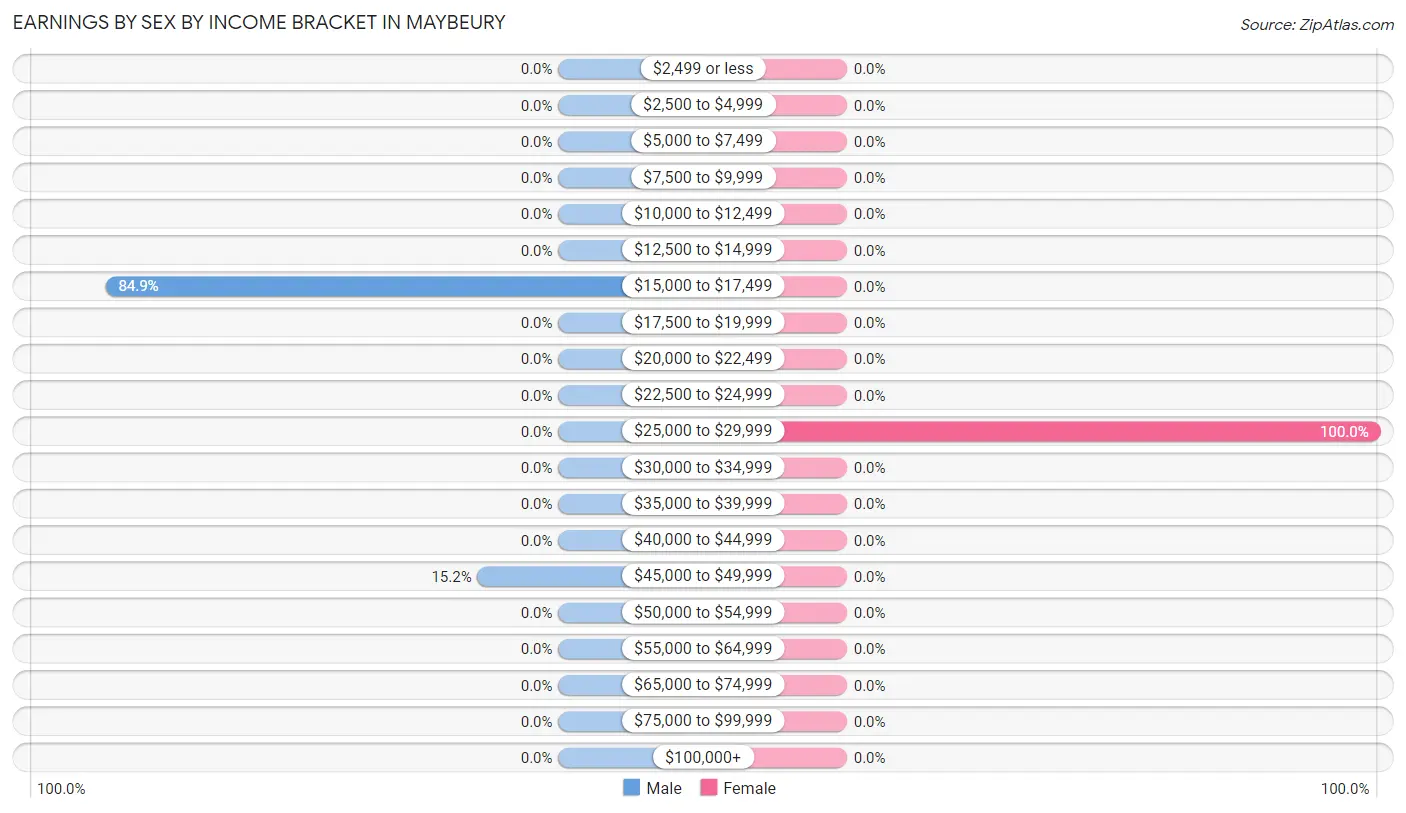
Earnings by Sex by Income Bracket in Maybeury
The most common earnings brackets in Maybeury are $15,000 to $17,499 for men (28 | 84.9%) and $25,000 to $29,999 for women (8 | 100.0%).
| Income | Male | Female |
| $2,499 or less | 0 (0.0%) | 0 (0.0%) |
| $2,500 to $4,999 | 0 (0.0%) | 0 (0.0%) |
| $5,000 to $7,499 | 0 (0.0%) | 0 (0.0%) |
| $7,500 to $9,999 | 0 (0.0%) | 0 (0.0%) |
| $10,000 to $12,499 | 0 (0.0%) | 0 (0.0%) |
| $12,500 to $14,999 | 0 (0.0%) | 0 (0.0%) |
| $15,000 to $17,499 | 28 (84.9%) | 0 (0.0%) |
| $17,500 to $19,999 | 0 (0.0%) | 0 (0.0%) |
| $20,000 to $22,499 | 0 (0.0%) | 0 (0.0%) |
| $22,500 to $24,999 | 0 (0.0%) | 0 (0.0%) |
| $25,000 to $29,999 | 0 (0.0%) | 8 (100.0%) |
| $30,000 to $34,999 | 0 (0.0%) | 0 (0.0%) |
| $35,000 to $39,999 | 0 (0.0%) | 0 (0.0%) |
| $40,000 to $44,999 | 0 (0.0%) | 0 (0.0%) |
| $45,000 to $49,999 | 5 (15.1%) | 0 (0.0%) |
| $50,000 to $54,999 | 0 (0.0%) | 0 (0.0%) |
| $55,000 to $64,999 | 0 (0.0%) | 0 (0.0%) |
| $65,000 to $74,999 | 0 (0.0%) | 0 (0.0%) |
| $75,000 to $99,999 | 0 (0.0%) | 0 (0.0%) |
| $100,000+ | 0 (0.0%) | 0 (0.0%) |
| Total | 33 (100.0%) | 8 (100.0%) |
Earnings by Sex by Educational Attainment in Maybeury
| Educational Attainment | Male Income | Female Income |
| Less than High School | - | - |
| High School Diploma | - | - |
| College or Associate's Degree | - | - |
| Bachelor's Degree | - | - |
| Graduate Degree | - | - |
| Total | - | - |
Family Income in Maybeury
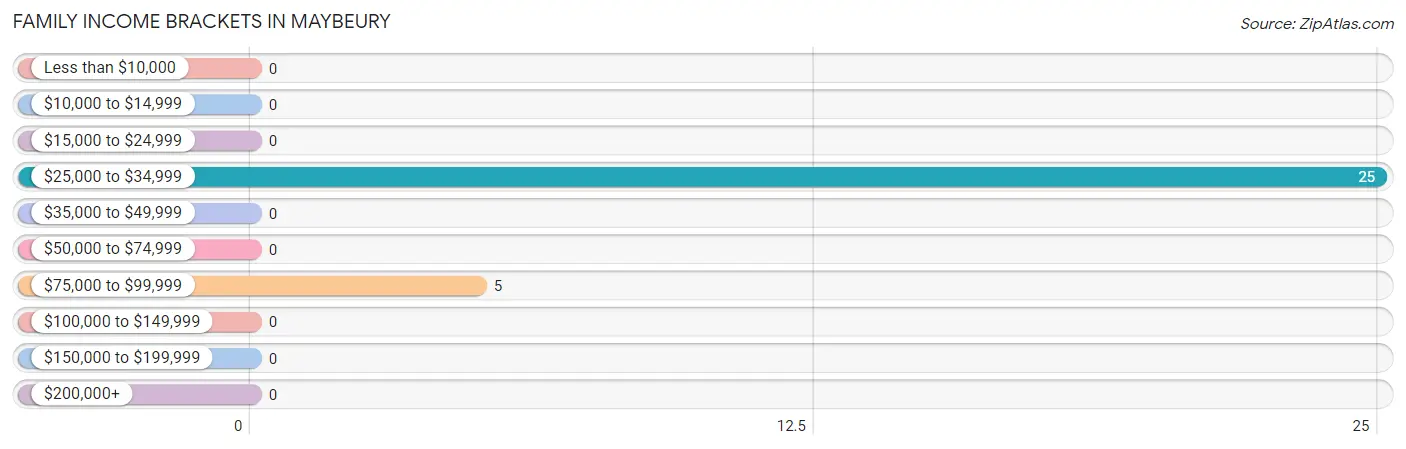
Family Income Brackets in Maybeury
According to the Maybeury family income data, there are 25 families falling into the $25,000 to $34,999 income range, which is the most common income bracket and makes up 83.3% of all families.
| Income Bracket | # Families | % Families |
| Less than $10,000 | 0 | 0.0% |
| $10,000 to $14,999 | 0 | 0.0% |
| $15,000 to $24,999 | 0 | 0.0% |
| $25,000 to $34,999 | 25 | 83.3% |
| $35,000 to $49,999 | 0 | 0.0% |
| $50,000 to $74,999 | 0 | 0.0% |
| $75,000 to $99,999 | 5 | 16.7% |
| $100,000 to $149,999 | 0 | 0.0% |
| $150,000 to $199,999 | 0 | 0.0% |
| $200,000+ | 0 | 0.0% |
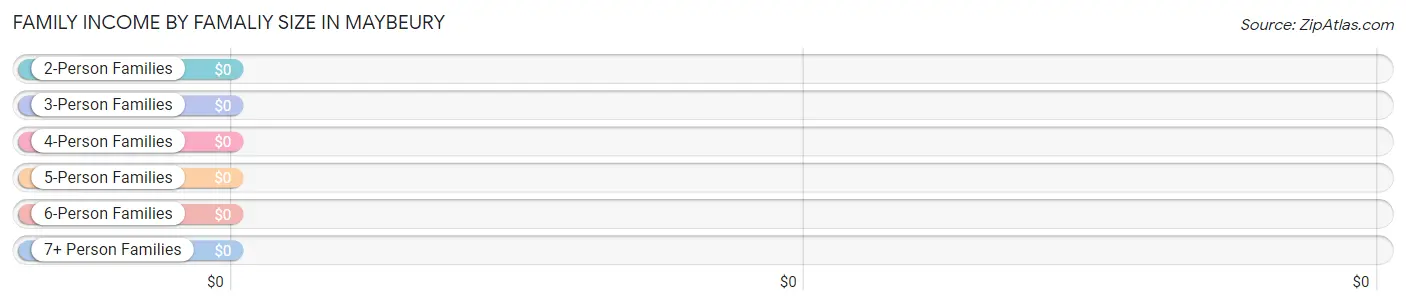
Family Income by Famaliy Size in Maybeury
| Income Bracket | # Families | Median Income |
| 2-Person Families | 19 (63.3%) | $0 |
| 3-Person Families | 11 (36.7%) | $0 |
| 4-Person Families | 0 (0.0%) | $0 |
| 5-Person Families | 0 (0.0%) | $0 |
| 6-Person Families | 0 (0.0%) | $0 |
| 7+ Person Families | 0 (0.0%) | $0 |
| Total | 30 (100.0%) | $31,974 |
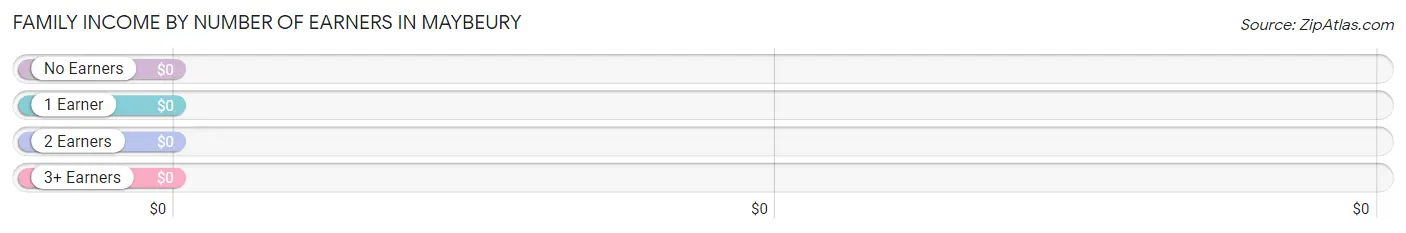
Family Income by Number of Earners in Maybeury
| Number of Earners | # Families | Median Income |
| No Earners | 6 (20.0%) | $0 |
| 1 Earner | 19 (63.3%) | $0 |
| 2 Earners | 5 (16.7%) | $0 |
| 3+ Earners | 0 (0.0%) | $0 |
| Total | 30 (100.0%) | $31,974 |
Household Income in Maybeury
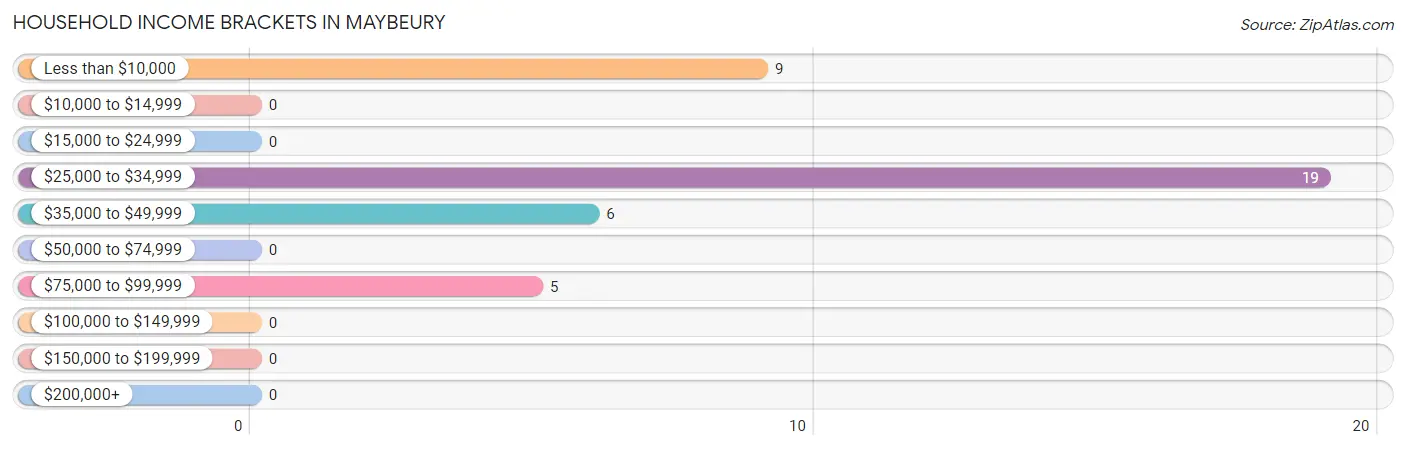
Household Income Brackets in Maybeury
With 19 households falling in the category, the $25,000 to $34,999 income range is the most frequent in Maybeury, accounting for 48.7% of all households.
| Income Bracket | # Households | % Households |
| Less than $10,000 | 9 | 23.1% |
| $10,000 to $14,999 | 0 | 0.0% |
| $15,000 to $24,999 | 0 | 0.0% |
| $25,000 to $34,999 | 19 | 48.7% |
| $35,000 to $49,999 | 6 | 15.4% |
| $50,000 to $74,999 | 0 | 0.0% |
| $75,000 to $99,999 | 5 | 12.8% |
| $100,000 to $149,999 | 0 | 0.0% |
| $150,000 to $199,999 | 0 | 0.0% |
| $200,000+ | 0 | 0.0% |
Household Income by Householder Age in Maybeury
| Income Bracket | # Households | Median Income |
| 15 to 24 Years | 0 (0.0%) | $0 |
| 25 to 44 Years | 14 (35.9%) | $0 |
| 45 to 64 Years | 6 (15.4%) | $0 |
| 65+ Years | 19 (48.7%) | $0 |
| Total | 39 (100.0%) | $0 |
Poverty in Maybeury
Income Below Poverty by Sex and Age in Maybeury
With 13.6% poverty level for males and 40.2% for females among the residents of Maybeury, 35 to 44 year old males and 16 and 17 year old females are the most vulnerable to poverty, with 9 males (64.3%) and 8 females (100.0%) in their respective age groups living below the poverty level.
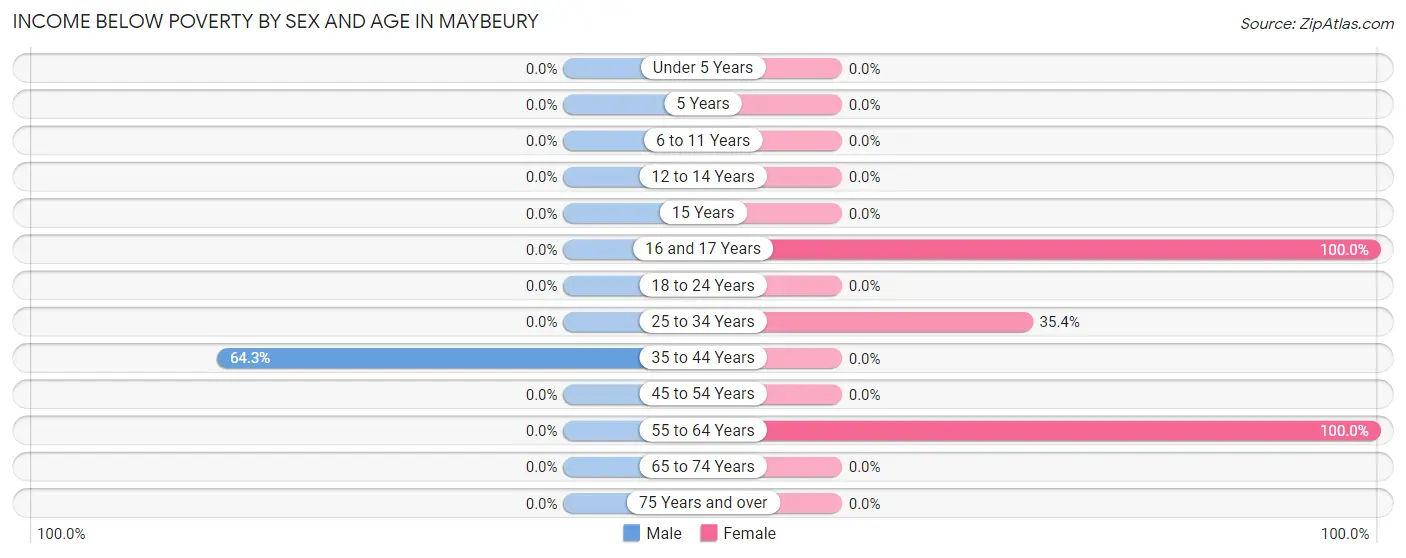
| Age Bracket | Male | Female |
| Under 5 Years | 0 (0.0%) | 0 (0.0%) |
| 5 Years | 0 (0.0%) | 0 (0.0%) |
| 6 to 11 Years | 0 (0.0%) | 0 (0.0%) |
| 12 to 14 Years | 0 (0.0%) | 0 (0.0%) |
| 15 Years | 0 (0.0%) | 0 (0.0%) |
| 16 and 17 Years | 0 (0.0%) | 8 (100.0%) |
| 18 to 24 Years | 0 (0.0%) | 0 (0.0%) |
| 25 to 34 Years | 0 (0.0%) | 17 (35.4%) |
| 35 to 44 Years | 9 (64.3%) | 0 (0.0%) |
| 45 to 54 Years | 0 (0.0%) | 0 (0.0%) |
| 55 to 64 Years | 0 (0.0%) | 14 (100.0%) |
| 65 to 74 Years | 0 (0.0%) | 0 (0.0%) |
| 75 Years and over | 0 (0.0%) | 0 (0.0%) |
| Total | 9 (13.6%) | 39 (40.2%) |
Income Above Poverty by Sex and Age in Maybeury
According to the poverty statistics in Maybeury, males aged 18 to 24 years and females aged 35 to 44 years are the age groups that are most secure financially, with 100.0% of males and 100.0% of females in these age groups living above the poverty line.
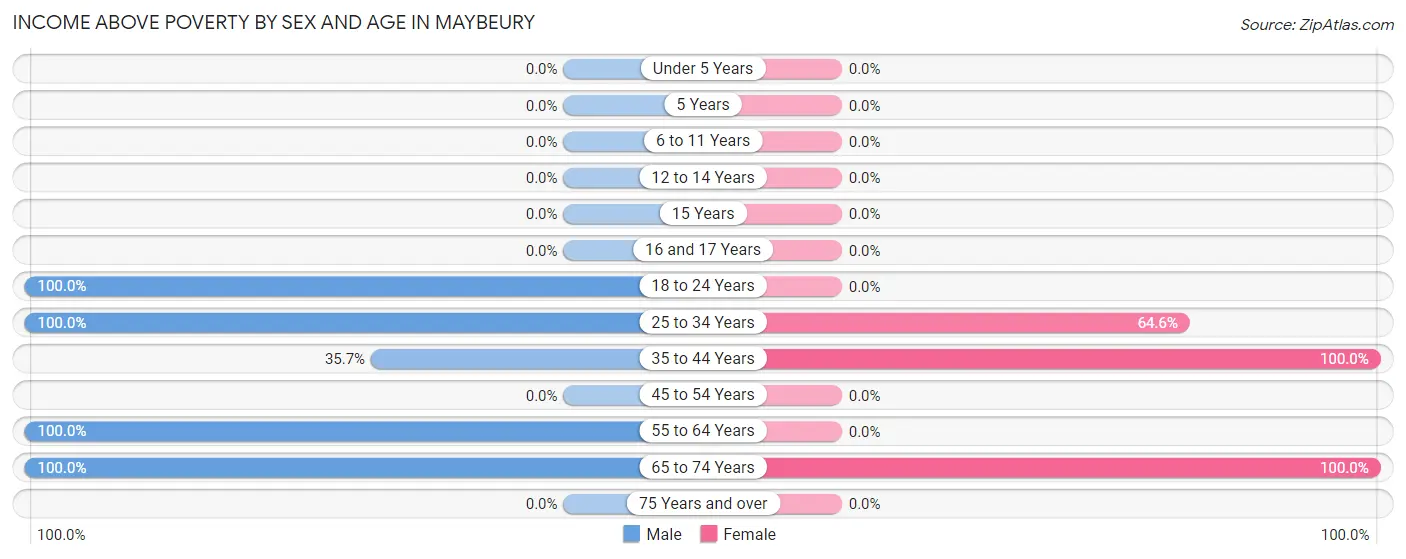
| Age Bracket | Male | Female |
| Under 5 Years | 0 (0.0%) | 0 (0.0%) |
| 5 Years | 0 (0.0%) | 0 (0.0%) |
| 6 to 11 Years | 0 (0.0%) | 0 (0.0%) |
| 12 to 14 Years | 0 (0.0%) | 0 (0.0%) |
| 15 Years | 0 (0.0%) | 0 (0.0%) |
| 16 and 17 Years | 0 (0.0%) | 0 (0.0%) |
| 18 to 24 Years | 5 (100.0%) | 0 (0.0%) |
| 25 to 34 Years | 13 (100.0%) | 31 (64.6%) |
| 35 to 44 Years | 5 (35.7%) | 8 (100.0%) |
| 45 to 54 Years | 0 (0.0%) | 0 (0.0%) |
| 55 to 64 Years | 6 (100.0%) | 0 (0.0%) |
| 65 to 74 Years | 28 (100.0%) | 19 (100.0%) |
| 75 Years and over | 0 (0.0%) | 0 (0.0%) |
| Total | 57 (86.4%) | 58 (59.8%) |
Income Below Poverty Among Married-Couple Families in Maybeury
| Children | Above Poverty | Below Poverty |
| No Children | 24 (100.0%) | 0 (0.0%) |
| 1 or 2 Children | 0 (0.0%) | 0 (0.0%) |
| 3 or 4 Children | 0 (0.0%) | 0 (0.0%) |
| 5 or more Children | 0 (0.0%) | 0 (0.0%) |
| Total | 24 (100.0%) | 0 (0.0%) |
Income Below Poverty Among Single-Parent Households in Maybeury
| Children | Single Father | Single Mother |
| No Children | 0 (0.0%) | 0 (0.0%) |
| 1 or 2 Children | 0 (0.0%) | 0 (0.0%) |
| 3 or 4 Children | 0 (0.0%) | 0 (0.0%) |
| 5 or more Children | 0 (0.0%) | 0 (0.0%) |
| Total | 0 (0.0%) | 0 (0.0%) |
Income Below Poverty Among Married-Couple vs Single-Parent Households in Maybeury
| Children | Married-Couple Families | Single-Parent Households |
| No Children | 0 (0.0%) | 0 (0.0%) |
| 1 or 2 Children | 0 (0.0%) | 0 (0.0%) |
| 3 or 4 Children | 0 (0.0%) | 0 (0.0%) |
| 5 or more Children | 0 (0.0%) | 0 (0.0%) |
| Total | 0 (0.0%) | 0 (0.0%) |
Race in Maybeury
The most populous races in Maybeury are White / Caucasian (154 | 94.5%), and Black / African American (9 | 5.5%).
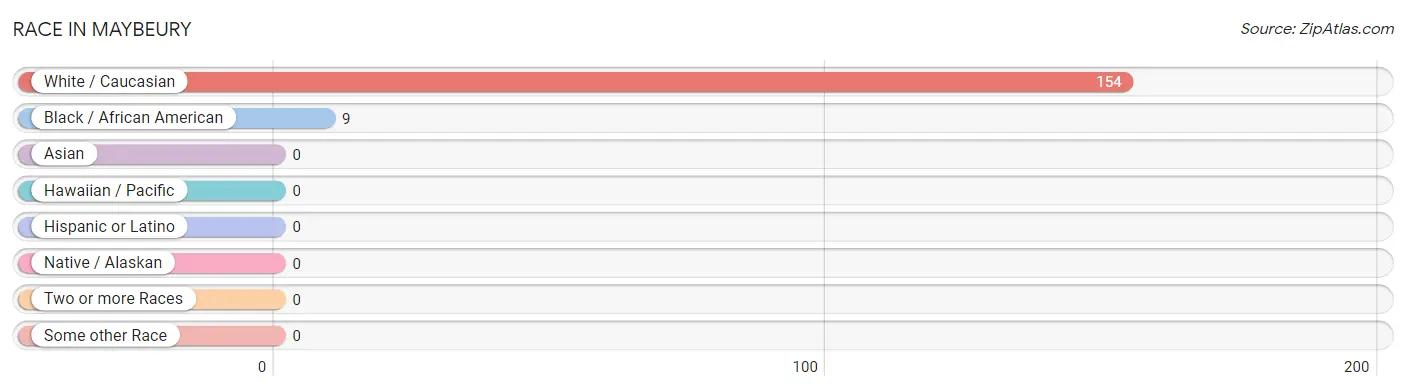
| Race | # Population | % Population |
| Asian | 0 | 0.0% |
| Black / African American | 9 | 5.5% |
| Hawaiian / Pacific | 0 | 0.0% |
| Hispanic or Latino | 0 | 0.0% |
| Native / Alaskan | 0 | 0.0% |
| White / Caucasian | 154 | 94.5% |
| Two or more Races | 0 | 0.0% |
| Some other Race | 0 | 0.0% |
| Total | 163 | 100.0% |
Ancestry in Maybeury
The most populous ancestries reported in Maybeury are German (50 | 30.7%), and Irish (17 | 10.4%), together accounting for 41.1% of all Maybeury residents.
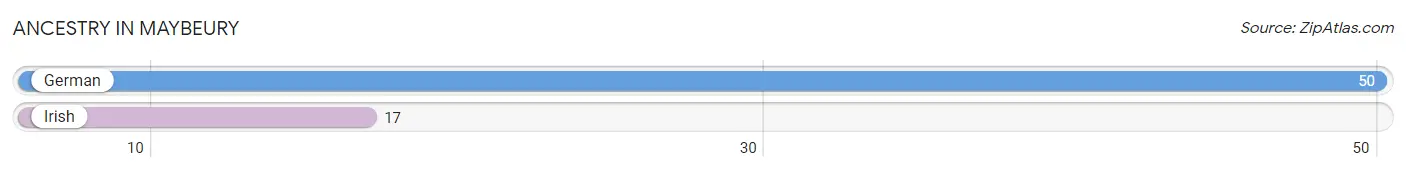
| Ancestry | # Population | % Population |
| German | 50 | 30.7% |
| Irish | 17 | 10.4% | View All 2 Rows |
Immigrants in Maybeury

| Immigration Origin | # Population | % Population | View All 0 Rows |
Sex and Age in Maybeury
Sex and Age in Maybeury
The most populous age groups in Maybeury are 70 to 74 Years (28 | 42.4%) for men and 30 to 34 Years (31 | 32.0%) for women.
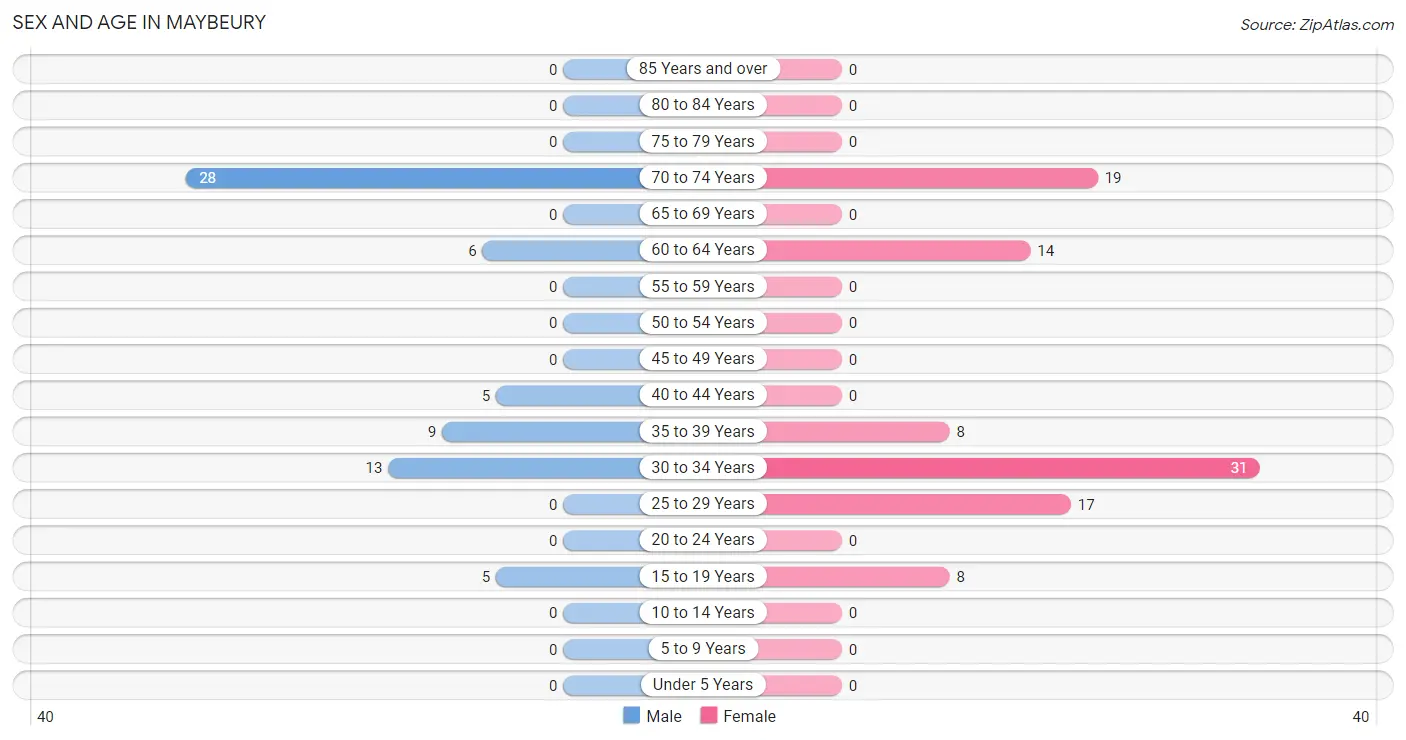
| Age Bracket | Male | Female |
| Under 5 Years | 0 (0.0%) | 0 (0.0%) |
| 5 to 9 Years | 0 (0.0%) | 0 (0.0%) |
| 10 to 14 Years | 0 (0.0%) | 0 (0.0%) |
| 15 to 19 Years | 5 (7.6%) | 8 (8.3%) |
| 20 to 24 Years | 0 (0.0%) | 0 (0.0%) |
| 25 to 29 Years | 0 (0.0%) | 17 (17.5%) |
| 30 to 34 Years | 13 (19.7%) | 31 (32.0%) |
| 35 to 39 Years | 9 (13.6%) | 8 (8.3%) |
| 40 to 44 Years | 5 (7.6%) | 0 (0.0%) |
| 45 to 49 Years | 0 (0.0%) | 0 (0.0%) |
| 50 to 54 Years | 0 (0.0%) | 0 (0.0%) |
| 55 to 59 Years | 0 (0.0%) | 0 (0.0%) |
| 60 to 64 Years | 6 (9.1%) | 14 (14.4%) |
| 65 to 69 Years | 0 (0.0%) | 0 (0.0%) |
| 70 to 74 Years | 28 (42.4%) | 19 (19.6%) |
| 75 to 79 Years | 0 (0.0%) | 0 (0.0%) |
| 80 to 84 Years | 0 (0.0%) | 0 (0.0%) |
| 85 Years and over | 0 (0.0%) | 0 (0.0%) |
| Total | 66 (100.0%) | 97 (100.0%) |
Families and Households in Maybeury
Median Family Size in Maybeury
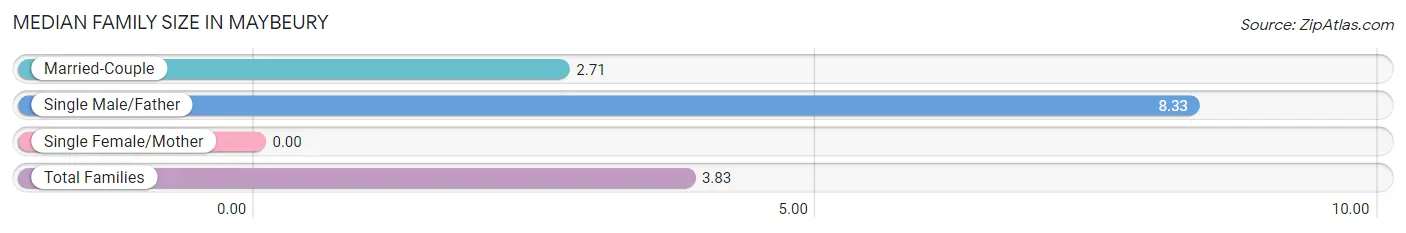
| Family Type | # Families | Family Size |
| Married-Couple | 24 (80.0%) | 2.71 |
| Single Male/Father | 6 (20.0%) | 8.33 |
| Single Female/Mother | 0 (0.0%) | - |
| Total Families | 30 (100.0%) | 3.83 |
Median Household Size in Maybeury
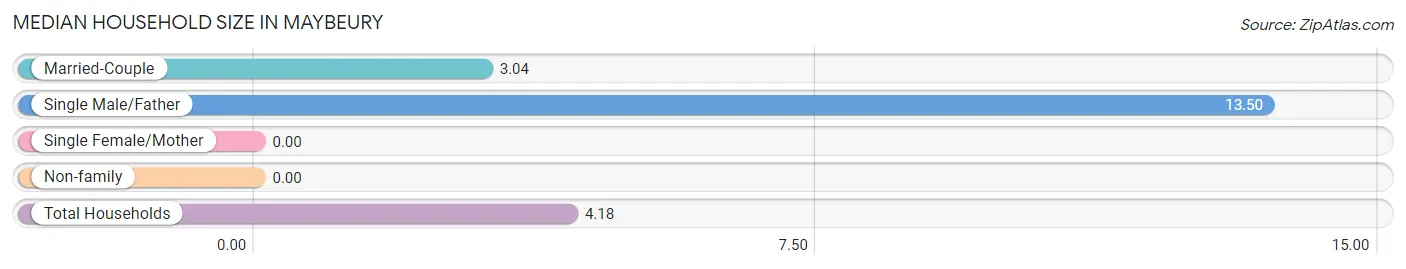
| Household Type | # Households | Household Size |
| Married-Couple | 24 (61.5%) | 3.04 |
| Single Male/Father | 6 (15.4%) | 13.50 |
| Single Female/Mother | 0 (0.0%) | - |
| Non-family | 9 (23.1%) | - |
| Total Households | 39 (100.0%) | 4.18 |
Household Size by Marriage Status in Maybeury
Out of a total of 39 households in Maybeury, 30 (76.9%) are family households, while 9 (23.1%) are nonfamily households. The most numerous type of family households are 2-person households, comprising 19, and the most common type of nonfamily households are 1-person households, comprising 9.
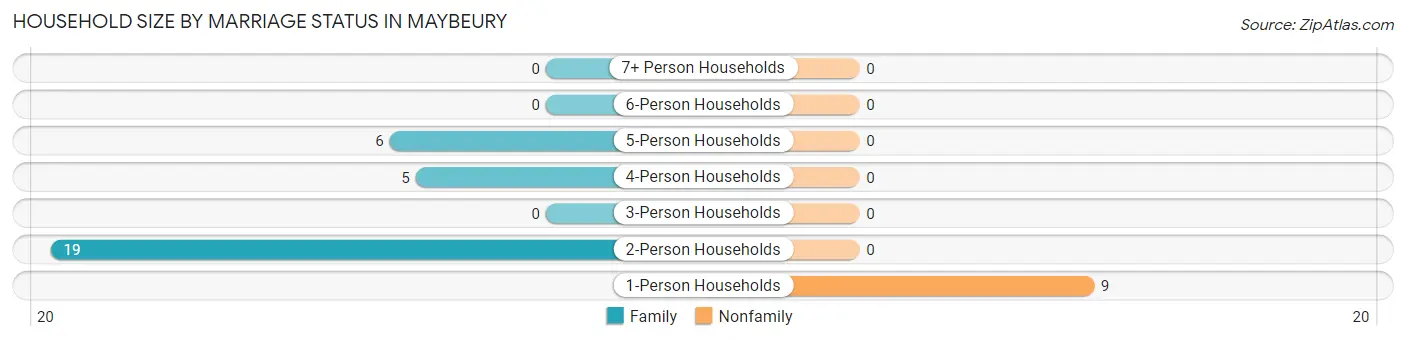
| Household Size | Family Households | Nonfamily Households |
| 1-Person Households | - | 9 (23.1%) |
| 2-Person Households | 19 (48.7%) | 0 (0.0%) |
| 3-Person Households | 0 (0.0%) | 0 (0.0%) |
| 4-Person Households | 5 (12.8%) | 0 (0.0%) |
| 5-Person Households | 6 (15.4%) | 0 (0.0%) |
| 6-Person Households | 0 (0.0%) | 0 (0.0%) |
| 7+ Person Households | 0 (0.0%) | 0 (0.0%) |
| Total | 30 (76.9%) | 9 (23.1%) |
Female Fertility in Maybeury
Fertility by Age in Maybeury
| Age Bracket | Women with Births | Births / 1,000 Women |
| 15 to 19 years | 0 (0.0%) | 0.0 |
| 20 to 34 years | 0 (0.0%) | 0.0 |
| 35 to 50 years | 0 (0.0%) | 0.0 |
| Total | 0 (0.0%) | 0.0 |
Fertility by Age by Marriage Status in Maybeury
| Age Bracket | Married | Unmarried |
| 15 to 19 years | 0 (0.0%) | 0 (0.0%) |
| 20 to 34 years | 0 (0.0%) | 0 (0.0%) |
| 35 to 50 years | 0 (0.0%) | 0 (0.0%) |
| Total | 0 (0.0%) | 0 (0.0%) |
Fertility by Education in Maybeury
| Educational Attainment | Women with Births | Births / 1,000 Women |
| Less than High School | 0 (0.0%) | 0.0 |
| High School Diploma | 0 (0.0%) | 0.0 |
| College or Associate's Degree | 0 (0.0%) | 0.0 |
| Bachelor's Degree | 0 (0.0%) | 0.0 |
| Graduate Degree | 0 (0.0%) | 0.0 |
| Total | 0 (0.0%) | 0.0 |
Fertility by Education by Marriage Status in Maybeury
| Educational Attainment | Married | Unmarried |
| Less than High School | 0 (0.0%) | 0 (0.0%) |
| High School Diploma | 0 (0.0%) | 0 (0.0%) |
| College or Associate's Degree | 0 (0.0%) | 0 (0.0%) |
| Bachelor's Degree | 0 (0.0%) | 0 (0.0%) |
| Graduate Degree | 0 (0.0%) | 0 (0.0%) |
| Total | 0 (0.0%) | 0 (0.0%) |
Employment Characteristics in Maybeury
Employment by Class of Employer in Maybeury
Among the 41 employed individuals in Maybeury, not-for-profit organizations (28 | 68.3%), and private company employees (13 | 31.7%) make up the most common classes of employment.
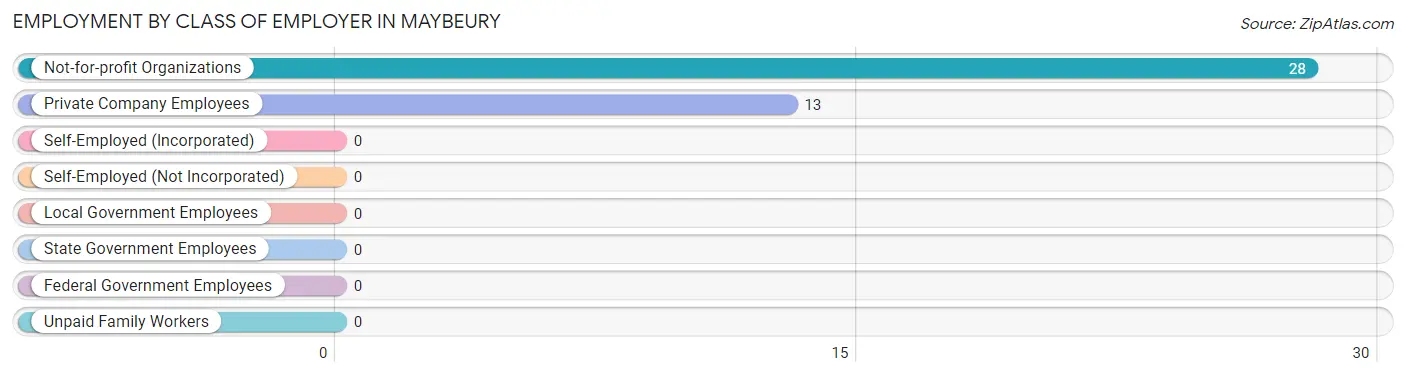
| Employer Class | # Employees | % Employees |
| Private Company Employees | 13 | 31.7% |
| Self-Employed (Incorporated) | 0 | 0.0% |
| Self-Employed (Not Incorporated) | 0 | 0.0% |
| Not-for-profit Organizations | 28 | 68.3% |
| Local Government Employees | 0 | 0.0% |
| State Government Employees | 0 | 0.0% |
| Federal Government Employees | 0 | 0.0% |
| Unpaid Family Workers | 0 | 0.0% |
| Total | 41 | 100.0% |
Employment Status by Age in Maybeury
According to the labor force statistics for Maybeury, out of the total population over 16 years of age (163), 30.7% or 50 individuals are in the labor force, with 18.0% or 9 of them unemployed. The age group with the highest labor force participation rate is 35 to 44 years, with 100.0% or 22 individuals in the labor force. Within the labor force, the 35 to 44 years age range has the highest percentage of unemployed individuals, with 40.9% or 9 of them being unemployed.
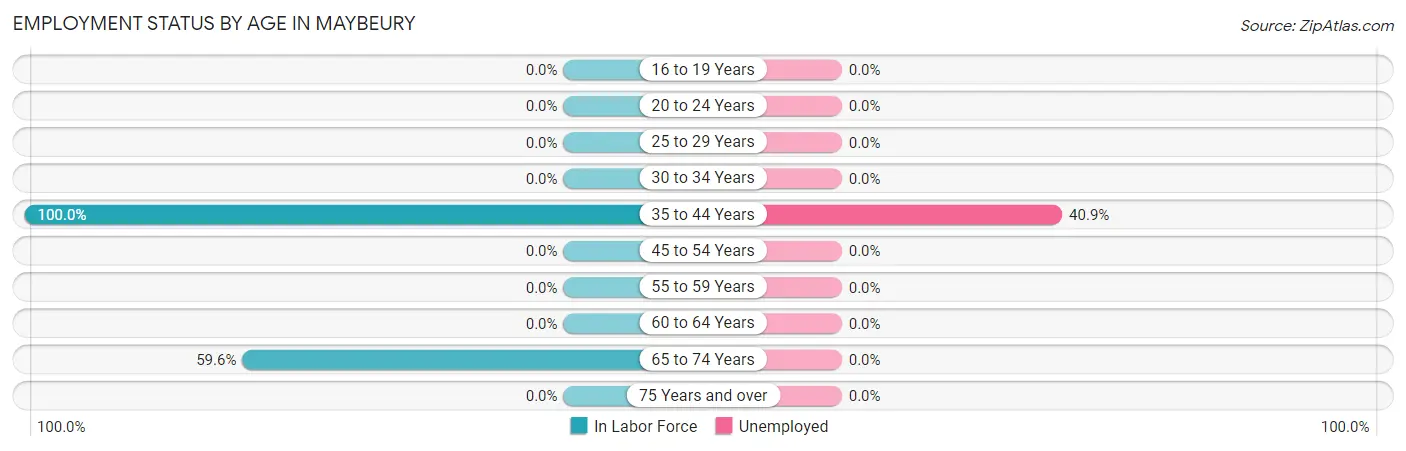
| Age Bracket | In Labor Force | Unemployed |
| 16 to 19 Years | 0 (0.0%) | 0 (0.0%) |
| 20 to 24 Years | 0 (0.0%) | 0 (0.0%) |
| 25 to 29 Years | 0 (0.0%) | 0 (0.0%) |
| 30 to 34 Years | 0 (0.0%) | 0 (0.0%) |
| 35 to 44 Years | 22 (100.0%) | 9 (40.9%) |
| 45 to 54 Years | 0 (0.0%) | 0 (0.0%) |
| 55 to 59 Years | 0 (0.0%) | 0 (0.0%) |
| 60 to 64 Years | 0 (0.0%) | 0 (0.0%) |
| 65 to 74 Years | 28 (59.6%) | 0 (0.0%) |
| 75 Years and over | 0 (0.0%) | 0 (0.0%) |
| Total | 50 (30.7%) | 9 (18.0%) |
Employment Status by Educational Attainment in Maybeury
According to labor force statistics for Maybeury, 21.4% of individuals (22) out of the total population between 25 and 64 years of age (103) are in the labor force, with 40.9% or 9 of them being unemployed. The group with the highest labor force participation rate are those with the educational attainment of high school diploma, with 31.8% or 14 individuals in the labor force. Within the labor force, individuals with high school diploma education have the highest percentage of unemployment, with 64.3% or 9 of them being unemployed.
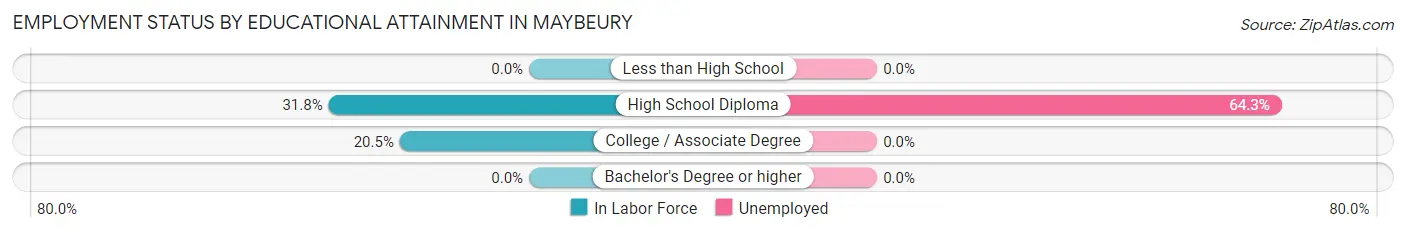
| Educational Attainment | In Labor Force | Unemployed |
| Less than High School | 0 (0.0%) | 0 (0.0%) |
| High School Diploma | 14 (31.8%) | 28 (64.3%) |
| College / Associate Degree | 8 (20.5%) | 0 (0.0%) |
| Bachelor's Degree or higher | 0 (0.0%) | 0 (0.0%) |
| Total | 22 (21.4%) | 42 (40.9%) |
Employment Occupations by Sex in Maybeury
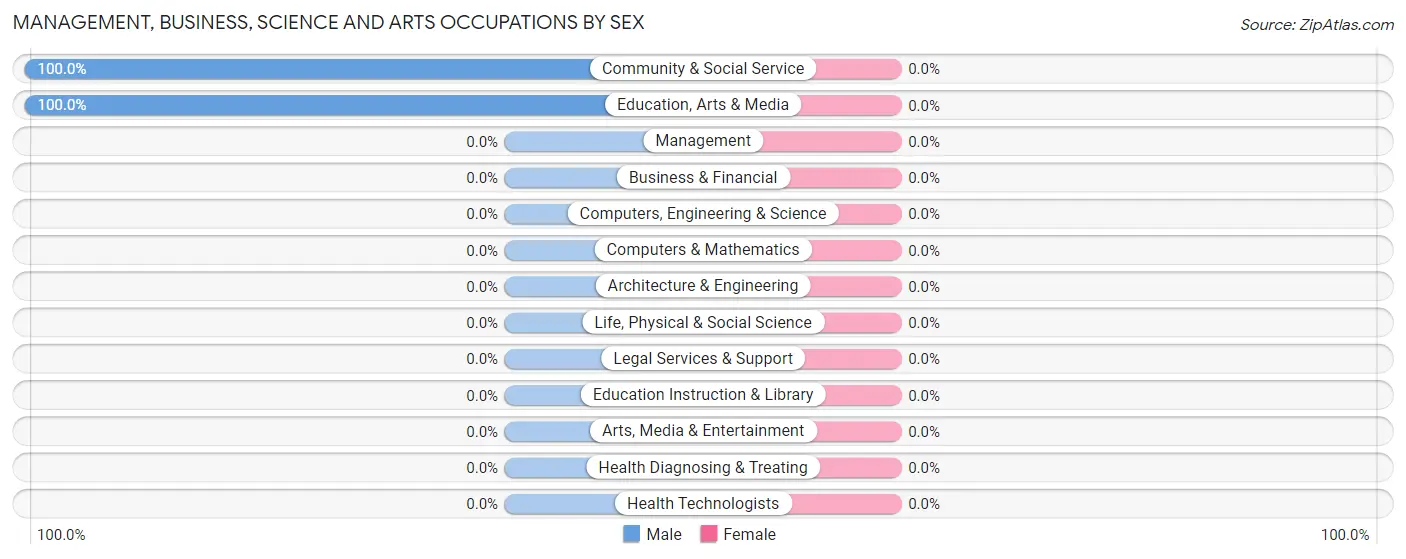
Management, Business, Science and Arts Occupations
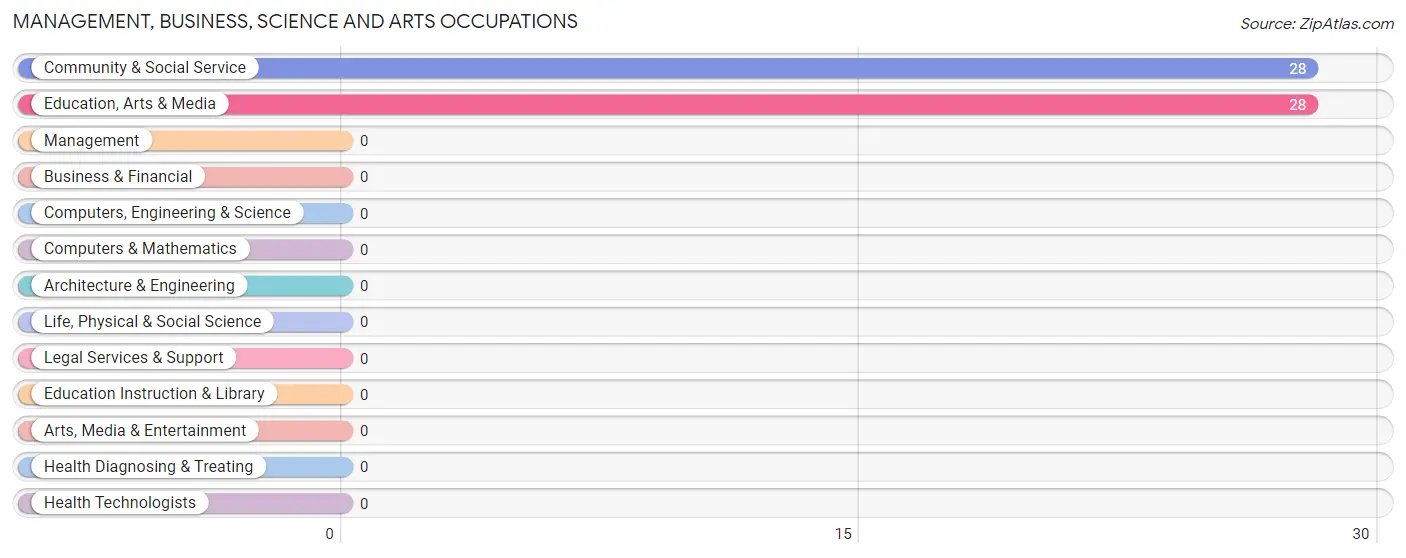
The most common Management, Business, Science and Arts occupations in Maybeury are Community & Social Service (28 | 68.3%), and Education, Arts & Media (28 | 68.3%).
Management, Business, Science and Arts Occupations by Sex
| Occupation | Male | Female |
| Management | 0 (0.0%) | 0 (0.0%) |
| Business & Financial | 0 (0.0%) | 0 (0.0%) |
| Computers, Engineering & Science | 0 (0.0%) | 0 (0.0%) |
| Computers & Mathematics | 0 (0.0%) | 0 (0.0%) |
| Architecture & Engineering | 0 (0.0%) | 0 (0.0%) |
| Life, Physical & Social Science | 0 (0.0%) | 0 (0.0%) |
| Community & Social Service | 28 (100.0%) | 0 (0.0%) |
| Education, Arts & Media | 28 (100.0%) | 0 (0.0%) |
| Legal Services & Support | 0 (0.0%) | 0 (0.0%) |
| Education Instruction & Library | 0 (0.0%) | 0 (0.0%) |
| Arts, Media & Entertainment | 0 (0.0%) | 0 (0.0%) |
| Health Diagnosing & Treating | 0 (0.0%) | 0 (0.0%) |
| Health Technologists | 0 (0.0%) | 0 (0.0%) |
| Total (Category) | 28 (100.0%) | 0 (0.0%) |
| Total (Overall) | 33 (80.5%) | 8 (19.5%) |
Services Occupations
Services Occupations by Sex
| Occupation | Male | Female |
| Healthcare Support | 0 (0.0%) | 0 (0.0%) |
| Security & Protection | 0 (0.0%) | 0 (0.0%) |
| Firefighting & Prevention | 0 (0.0%) | 0 (0.0%) |
| Law Enforcement | 0 (0.0%) | 0 (0.0%) |
| Food Preparation & Serving | 0 (0.0%) | 0 (0.0%) |
| Cleaning & Maintenance | 0 (0.0%) | 0 (0.0%) |
| Personal Care & Service | 0 (0.0%) | 0 (0.0%) |
| Total (Category) | 0 (0.0%) | 0 (0.0%) |
| Total (Overall) | 33 (80.5%) | 8 (19.5%) |
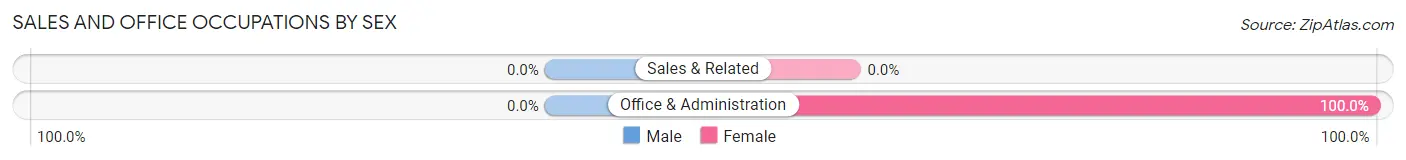
Sales and Office Occupations
The most common Sales and Office occupations in Maybeury are , and Office & Administration (8 | 19.5%).
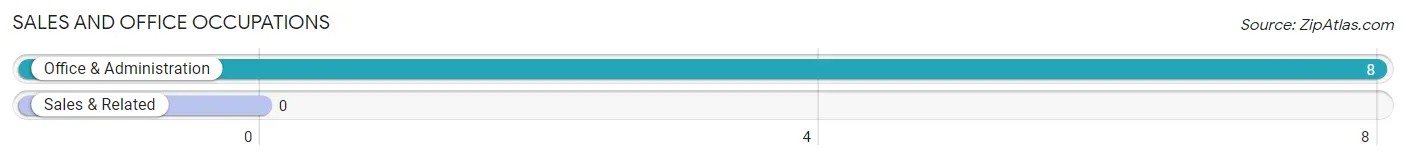
Sales and Office Occupations by Sex
| Occupation | Male | Female |
| Sales & Related | 0 (0.0%) | 0 (0.0%) |
| Office & Administration | 0 (0.0%) | 8 (100.0%) |
| Total (Category) | 0 (0.0%) | 8 (100.0%) |
| Total (Overall) | 33 (80.5%) | 8 (19.5%) |
Natural Resources, Construction and Maintenance Occupations
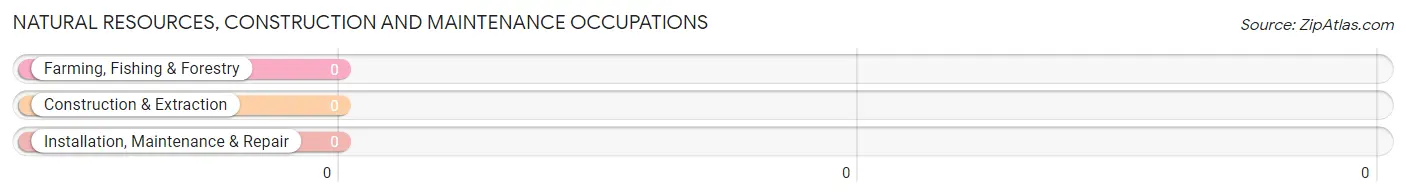
Natural Resources, Construction and Maintenance Occupations by Sex
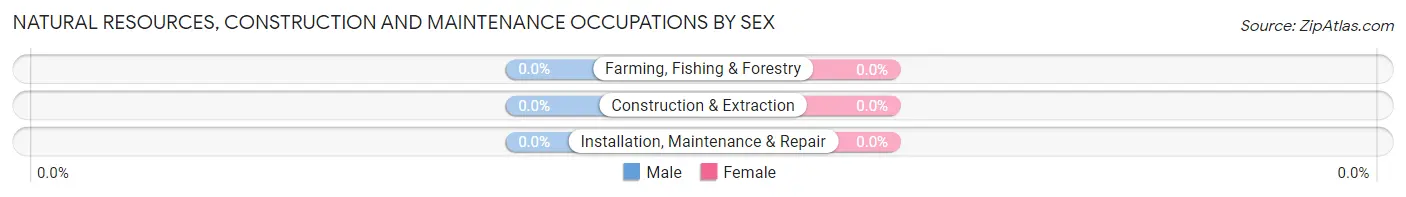
| Occupation | Male | Female |
| Farming, Fishing & Forestry | 0 (0.0%) | 0 (0.0%) |
| Construction & Extraction | 0 (0.0%) | 0 (0.0%) |
| Installation, Maintenance & Repair | 0 (0.0%) | 0 (0.0%) |
| Total (Category) | 0 (0.0%) | 0 (0.0%) |
| Total (Overall) | 33 (80.5%) | 8 (19.5%) |
Production, Transportation and Moving Occupations
The most common Production, Transportation and Moving occupations in Maybeury are , and Production (5 | 12.2%).
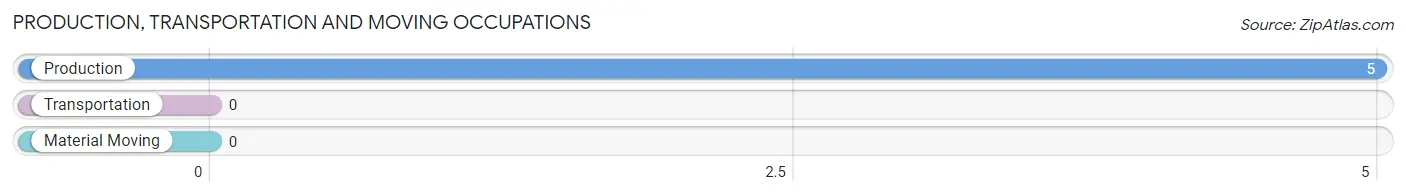
Production, Transportation and Moving Occupations by Sex
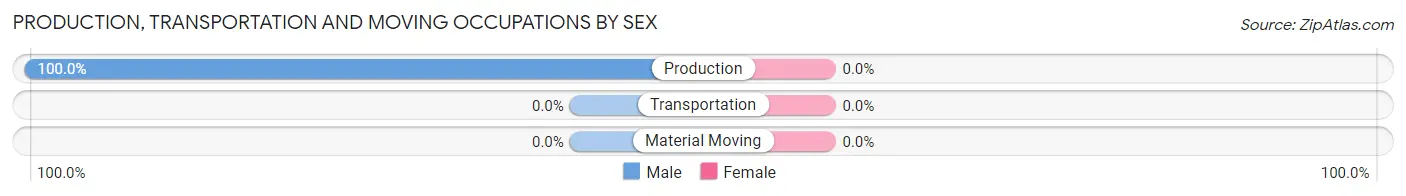
| Occupation | Male | Female |
| Production | 5 (100.0%) | 0 (0.0%) |
| Transportation | 0 (0.0%) | 0 (0.0%) |
| Material Moving | 0 (0.0%) | 0 (0.0%) |
| Total (Category) | 5 (100.0%) | 0 (0.0%) |
| Total (Overall) | 33 (80.5%) | 8 (19.5%) |
Employment Industries by Sex in Maybeury
Employment Industries in Maybeury
The major employment industries in Maybeury include , and Manufacturing (13 | 31.7%).
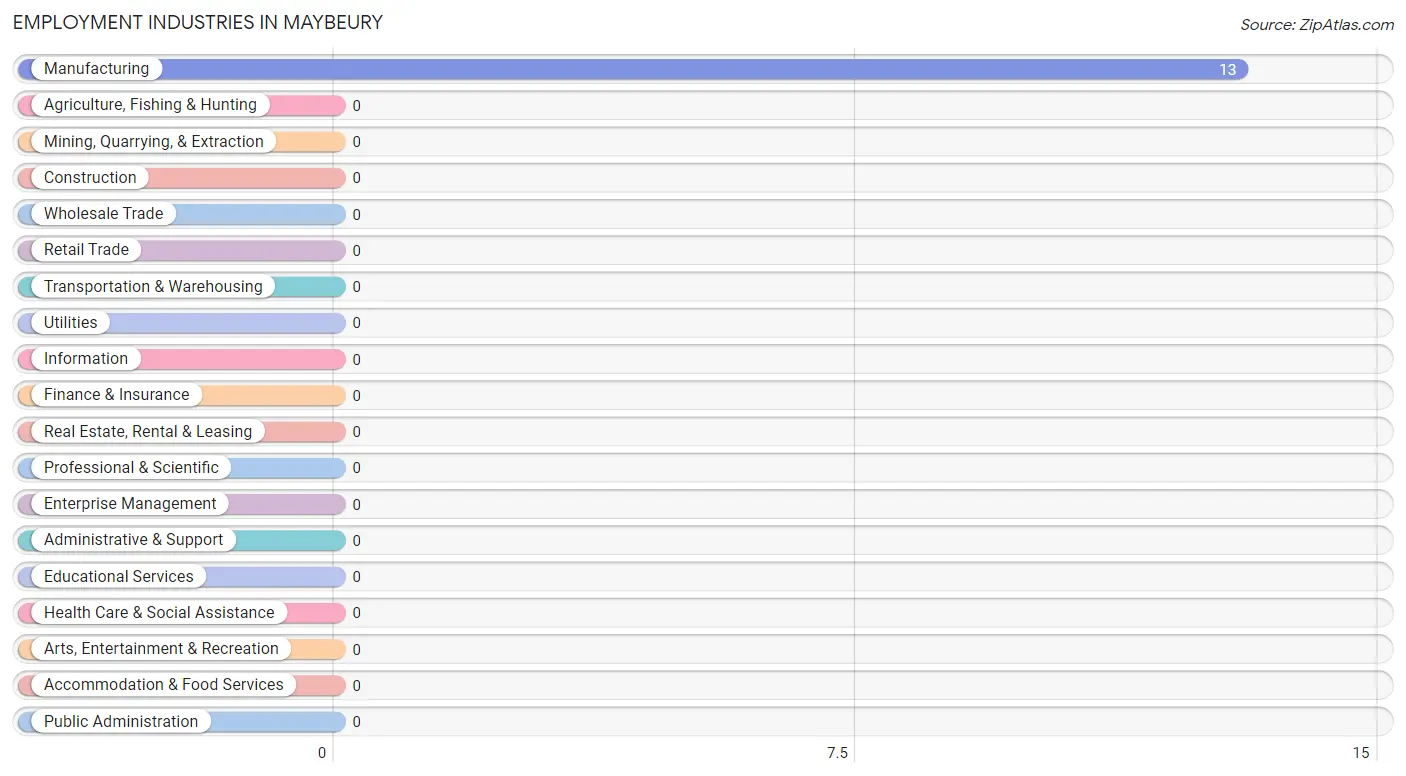
Employment Industries by Sex in Maybeury
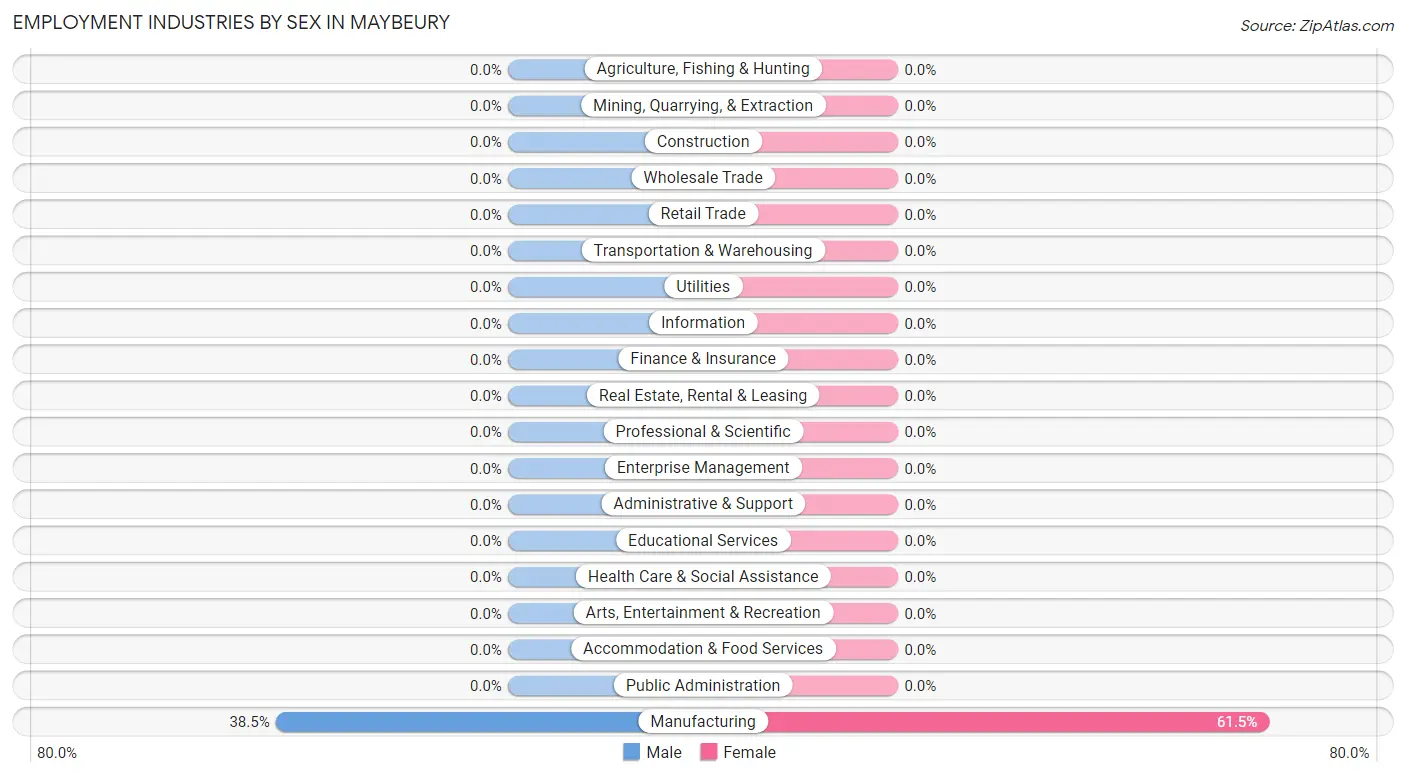
| Industry | Male | Female |
| Agriculture, Fishing & Hunting | 0 (0.0%) | 0 (0.0%) |
| Mining, Quarrying, & Extraction | 0 (0.0%) | 0 (0.0%) |
| Construction | 0 (0.0%) | 0 (0.0%) |
| Manufacturing | 5 (38.5%) | 8 (61.5%) |
| Wholesale Trade | 0 (0.0%) | 0 (0.0%) |
| Retail Trade | 0 (0.0%) | 0 (0.0%) |
| Transportation & Warehousing | 0 (0.0%) | 0 (0.0%) |
| Utilities | 0 (0.0%) | 0 (0.0%) |
| Information | 0 (0.0%) | 0 (0.0%) |
| Finance & Insurance | 0 (0.0%) | 0 (0.0%) |
| Real Estate, Rental & Leasing | 0 (0.0%) | 0 (0.0%) |
| Professional & Scientific | 0 (0.0%) | 0 (0.0%) |
| Enterprise Management | 0 (0.0%) | 0 (0.0%) |
| Administrative & Support | 0 (0.0%) | 0 (0.0%) |
| Educational Services | 0 (0.0%) | 0 (0.0%) |
| Health Care & Social Assistance | 0 (0.0%) | 0 (0.0%) |
| Arts, Entertainment & Recreation | 0 (0.0%) | 0 (0.0%) |
| Accommodation & Food Services | 0 (0.0%) | 0 (0.0%) |
| Public Administration | 0 (0.0%) | 0 (0.0%) |
| Total | 33 (80.5%) | 8 (19.5%) |
Education in Maybeury
School Enrollment in Maybeury
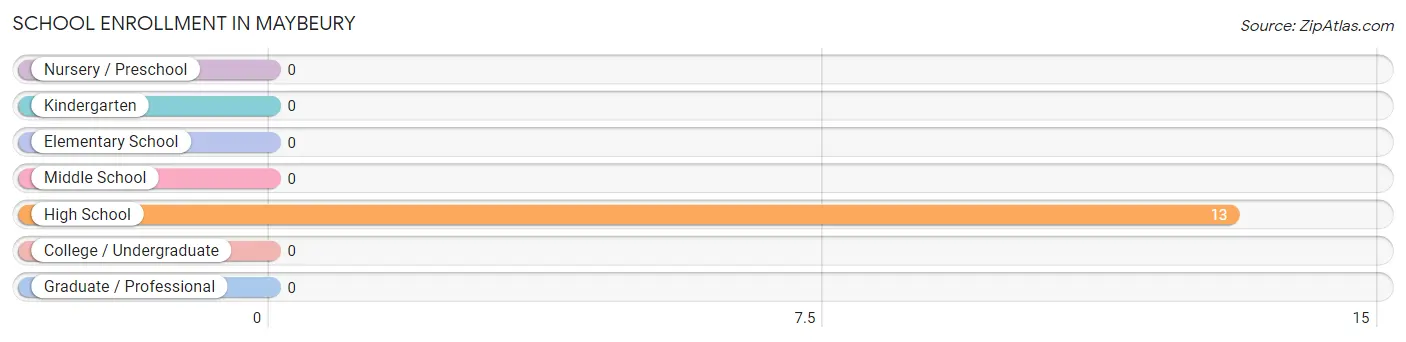
| School Level | # Students | % Students |
| Nursery / Preschool | 0 | 0.0% |
| Kindergarten | 0 | 0.0% |
| Elementary School | 0 | 0.0% |
| Middle School | 0 | 0.0% |
| High School | 13 | 100.0% |
| College / Undergraduate | 0 | 0.0% |
| Graduate / Professional | 0 | 0.0% |
| Total | 13 | 100.0% |
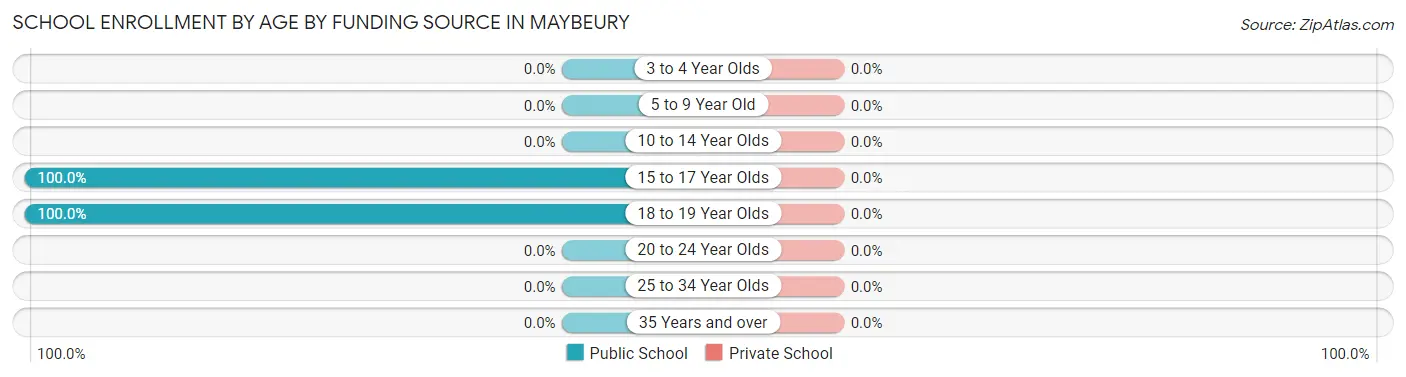
School Enrollment by Age by Funding Source in Maybeury
| Age Bracket | Public School | Private School |
| 3 to 4 Year Olds | 0 (0.0%) | 0 (0.0%) |
| 5 to 9 Year Old | 0 (0.0%) | 0 (0.0%) |
| 10 to 14 Year Olds | 0 (0.0%) | 0 (0.0%) |
| 15 to 17 Year Olds | 8 (100.0%) | 0 (0.0%) |
| 18 to 19 Year Olds | 5 (100.0%) | 0 (0.0%) |
| 20 to 24 Year Olds | 0 (0.0%) | 0 (0.0%) |
| 25 to 34 Year Olds | 0 (0.0%) | 0 (0.0%) |
| 35 Years and over | 0 (0.0%) | 0 (0.0%) |
| Total | 13 (100.0%) | 0 (0.0%) |
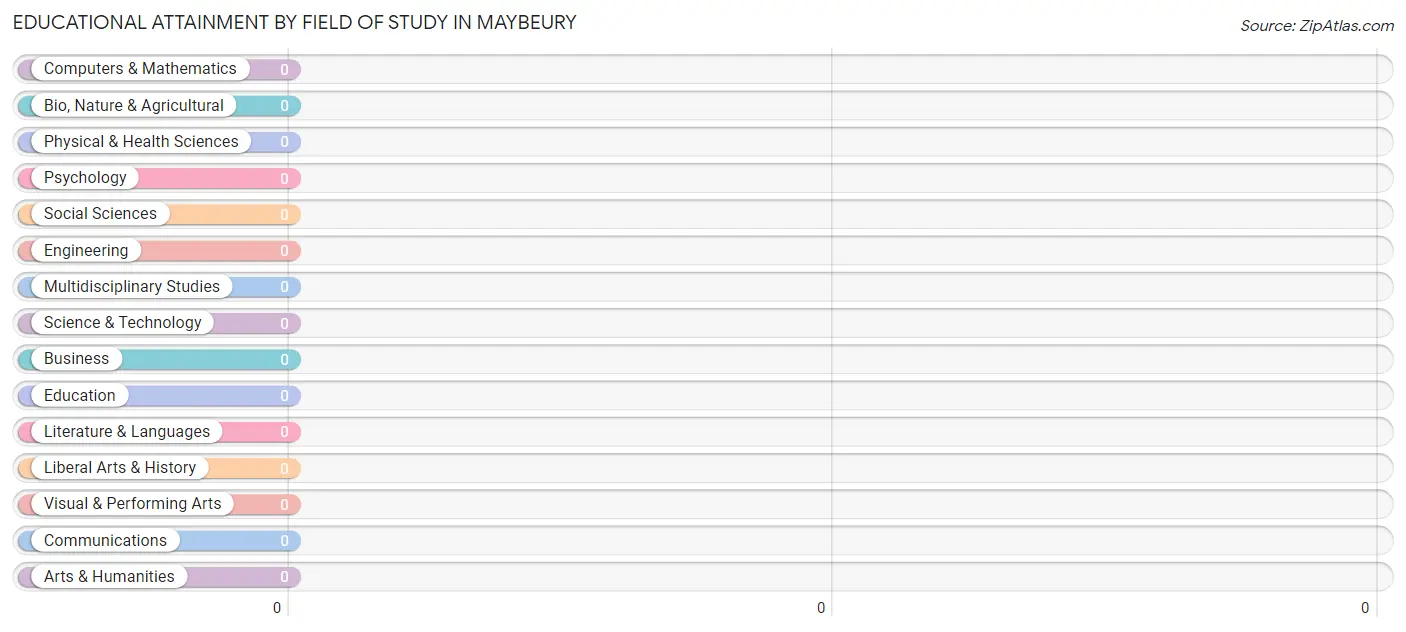
Educational Attainment by Field of Study in Maybeury
| Field of Study | # Graduates | % Graduates |
| Computers & Mathematics | 0 | 0.0% |
| Bio, Nature & Agricultural | 0 | 0.0% |
| Physical & Health Sciences | 0 | 0.0% |
| Psychology | 0 | 0.0% |
| Social Sciences | 0 | 0.0% |
| Engineering | 0 | 0.0% |
| Multidisciplinary Studies | 0 | 0.0% |
| Science & Technology | 0 | 0.0% |
| Business | 0 | 0.0% |
| Education | 0 | 0.0% |
| Literature & Languages | 0 | 0.0% |
| Liberal Arts & History | 0 | 0.0% |
| Visual & Performing Arts | 0 | 0.0% |
| Communications | 0 | 0.0% |
| Arts & Humanities | 0 | 0.0% |
| Total | 0 | 0.0% |
Transportation & Commute in Maybeury
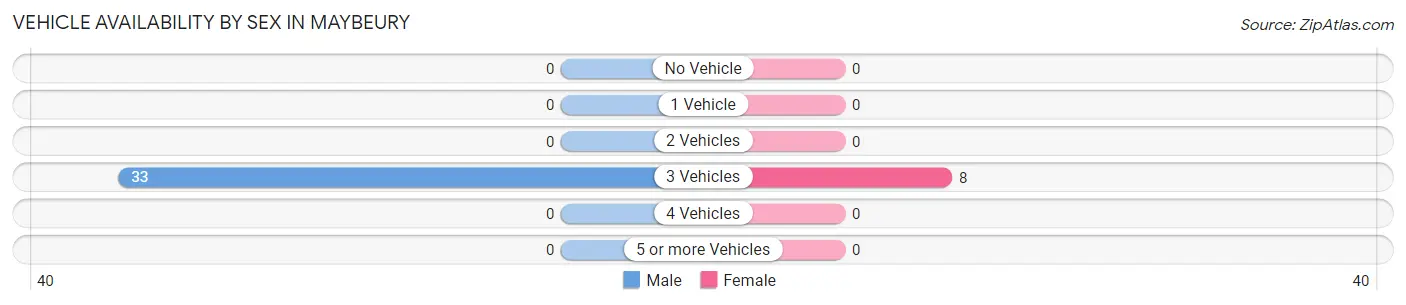
Vehicle Availability by Sex in Maybeury
The most prevalent vehicle ownership categories in Maybeury are males with 3 vehicles (33, accounting for 100.0%) and females with 3 vehicles (8, making up 412.5%).
| Vehicles Available | Male | Female |
| No Vehicle | 0 (0.0%) | 0 (0.0%) |
| 1 Vehicle | 0 (0.0%) | 0 (0.0%) |
| 2 Vehicles | 0 (0.0%) | 0 (0.0%) |
| 3 Vehicles | 33 (100.0%) | 8 (100.0%) |
| 4 Vehicles | 0 (0.0%) | 0 (0.0%) |
| 5 or more Vehicles | 0 (0.0%) | 0 (0.0%) |
| Total | 33 (100.0%) | 8 (100.0%) |
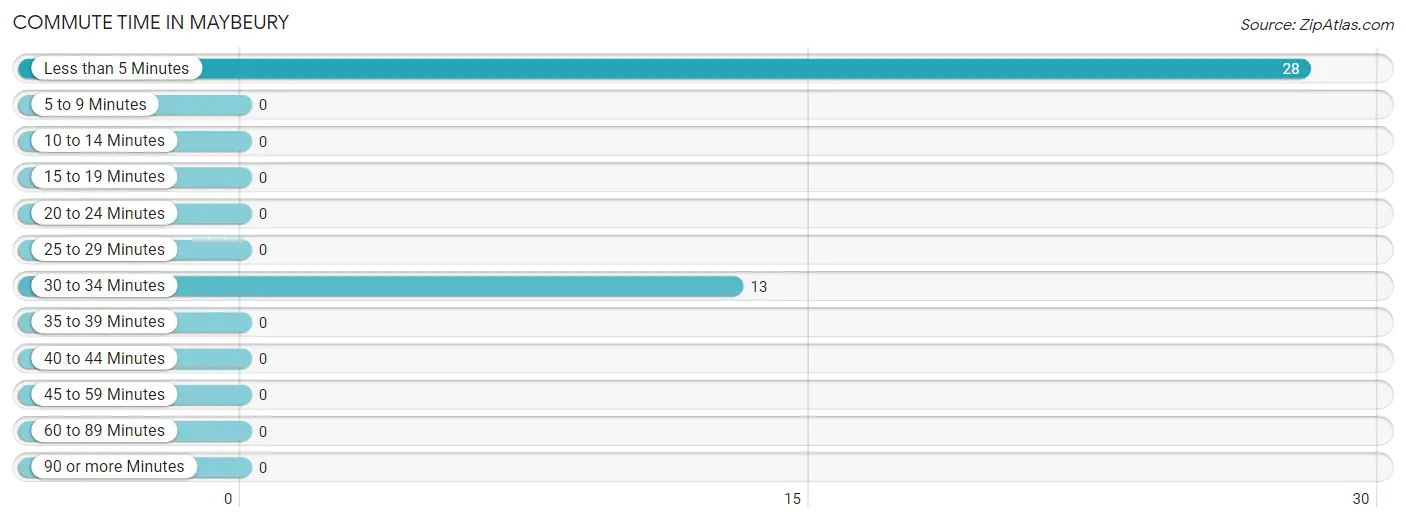
Commute Time in Maybeury
The most frequently occuring commute durations in Maybeury are less than 5 minutes (28 commuters, 68.3%), 30 to 34 minutes (13 commuters, 31.7%), and 5 to 9 minutes (0 commuters, 0.0%).
| Commute Time | # Commuters | % Commuters |
| Less than 5 Minutes | 28 | 68.3% |
| 5 to 9 Minutes | 0 | 0.0% |
| 10 to 14 Minutes | 0 | 0.0% |
| 15 to 19 Minutes | 0 | 0.0% |
| 20 to 24 Minutes | 0 | 0.0% |
| 25 to 29 Minutes | 0 | 0.0% |
| 30 to 34 Minutes | 13 | 31.7% |
| 35 to 39 Minutes | 0 | 0.0% |
| 40 to 44 Minutes | 0 | 0.0% |
| 45 to 59 Minutes | 0 | 0.0% |
| 60 to 89 Minutes | 0 | 0.0% |
| 90 or more Minutes | 0 | 0.0% |
Commute Time by Sex in Maybeury
The most common commute times in Maybeury are less than 5 minutes (28 commuters, 84.9%) for males and 30 to 34 minutes (8 commuters, 100.0%) for females.
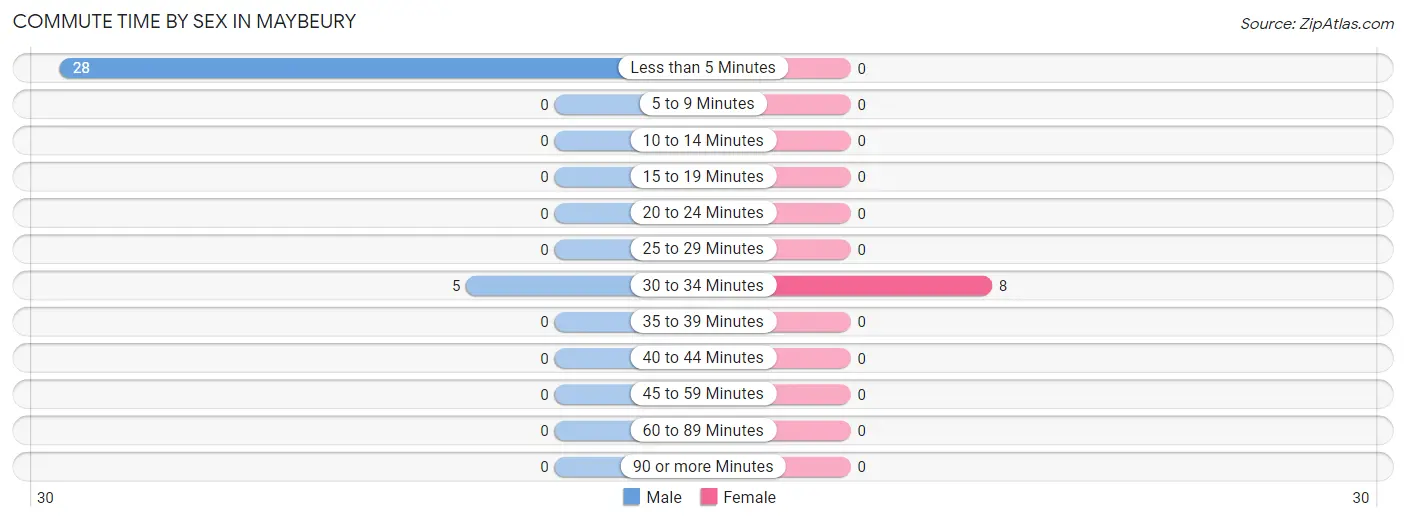
| Commute Time | Male | Female |
| Less than 5 Minutes | 28 (84.9%) | 0 (0.0%) |
| 5 to 9 Minutes | 0 (0.0%) | 0 (0.0%) |
| 10 to 14 Minutes | 0 (0.0%) | 0 (0.0%) |
| 15 to 19 Minutes | 0 (0.0%) | 0 (0.0%) |
| 20 to 24 Minutes | 0 (0.0%) | 0 (0.0%) |
| 25 to 29 Minutes | 0 (0.0%) | 0 (0.0%) |
| 30 to 34 Minutes | 5 (15.1%) | 8 (100.0%) |
| 35 to 39 Minutes | 0 (0.0%) | 0 (0.0%) |
| 40 to 44 Minutes | 0 (0.0%) | 0 (0.0%) |
| 45 to 59 Minutes | 0 (0.0%) | 0 (0.0%) |
| 60 to 89 Minutes | 0 (0.0%) | 0 (0.0%) |
| 90 or more Minutes | 0 (0.0%) | 0 (0.0%) |
Time of Departure to Work by Sex in Maybeury
The most frequent times of departure to work in Maybeury are 10:00 AM to 10:59 AM (28, 84.9%) for males and 8:00 AM to 8:29 AM (8, 100.0%) for females.
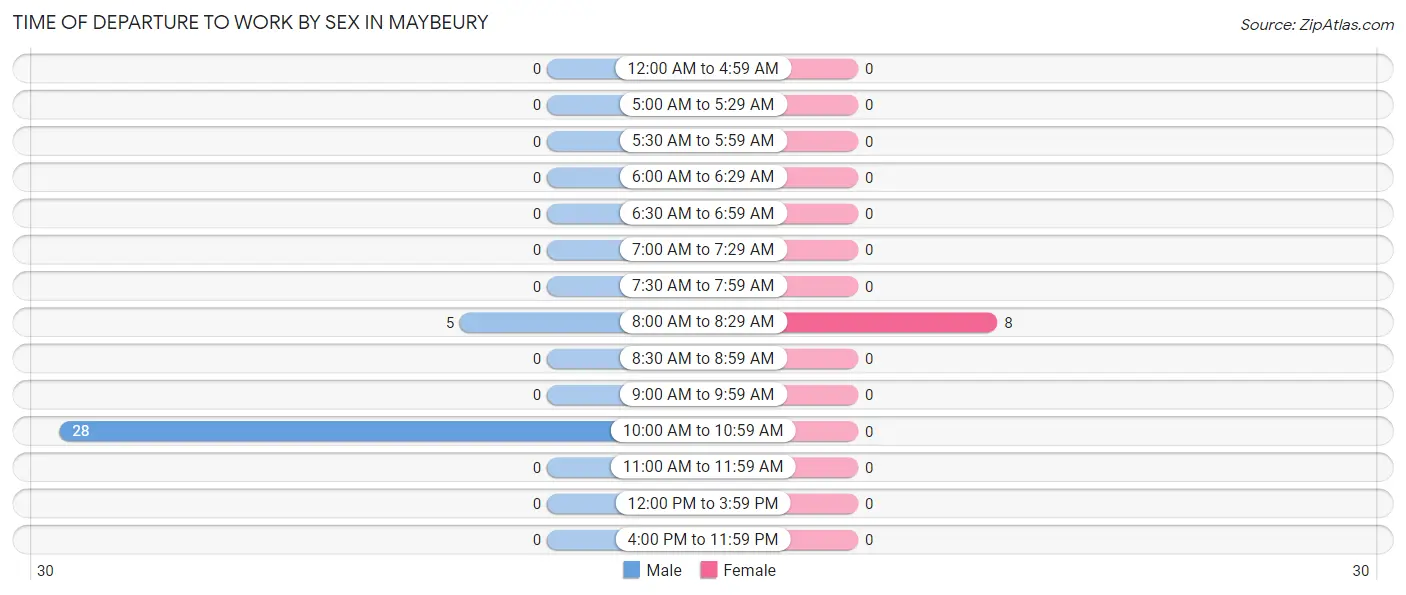
| Time of Departure | Male | Female |
| 12:00 AM to 4:59 AM | 0 (0.0%) | 0 (0.0%) |
| 5:00 AM to 5:29 AM | 0 (0.0%) | 0 (0.0%) |
| 5:30 AM to 5:59 AM | 0 (0.0%) | 0 (0.0%) |
| 6:00 AM to 6:29 AM | 0 (0.0%) | 0 (0.0%) |
| 6:30 AM to 6:59 AM | 0 (0.0%) | 0 (0.0%) |
| 7:00 AM to 7:29 AM | 0 (0.0%) | 0 (0.0%) |
| 7:30 AM to 7:59 AM | 0 (0.0%) | 0 (0.0%) |
| 8:00 AM to 8:29 AM | 5 (15.1%) | 8 (100.0%) |
| 8:30 AM to 8:59 AM | 0 (0.0%) | 0 (0.0%) |
| 9:00 AM to 9:59 AM | 0 (0.0%) | 0 (0.0%) |
| 10:00 AM to 10:59 AM | 28 (84.9%) | 0 (0.0%) |
| 11:00 AM to 11:59 AM | 0 (0.0%) | 0 (0.0%) |
| 12:00 PM to 3:59 PM | 0 (0.0%) | 0 (0.0%) |
| 4:00 PM to 11:59 PM | 0 (0.0%) | 0 (0.0%) |
| Total | 33 (100.0%) | 8 (100.0%) |
Housing Occupancy in Maybeury
Occupancy by Ownership in Maybeury
Of the total 39 dwellings in Maybeury, owner-occupied units account for 6 (15.4%), while renter-occupied units make up 33 (84.6%).
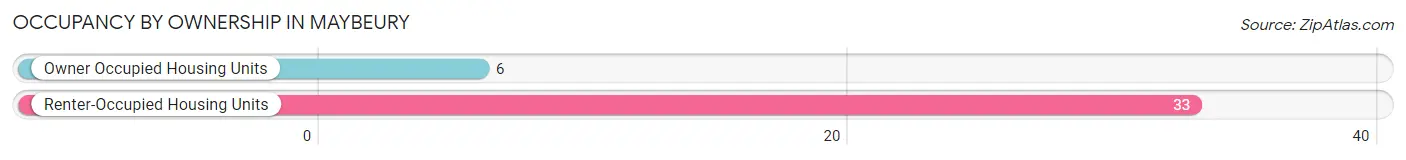
| Occupancy | # Housing Units | % Housing Units |
| Owner Occupied Housing Units | 6 | 15.4% |
| Renter-Occupied Housing Units | 33 | 84.6% |
| Total Occupied Housing Units | 39 | 100.0% |
Occupancy by Household Size in Maybeury
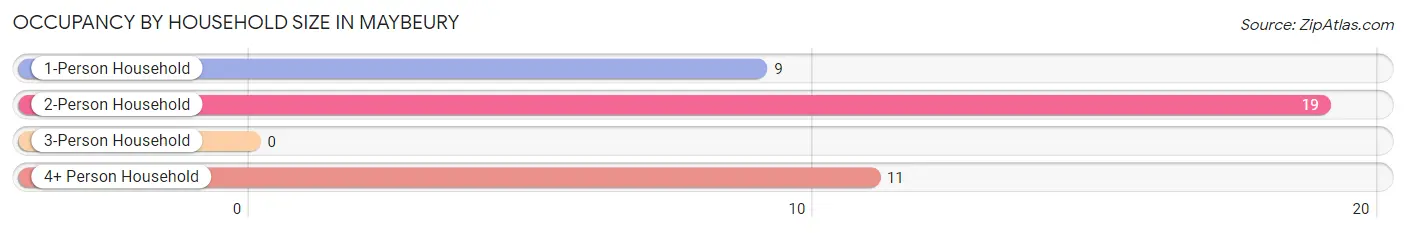
| Household Size | # Housing Units | % Housing Units |
| 1-Person Household | 9 | 23.1% |
| 2-Person Household | 19 | 48.7% |
| 3-Person Household | 0 | 0.0% |
| 4+ Person Household | 11 | 28.2% |
| Total Housing Units | 39 | 100.0% |
Occupancy by Ownership by Household Size in Maybeury
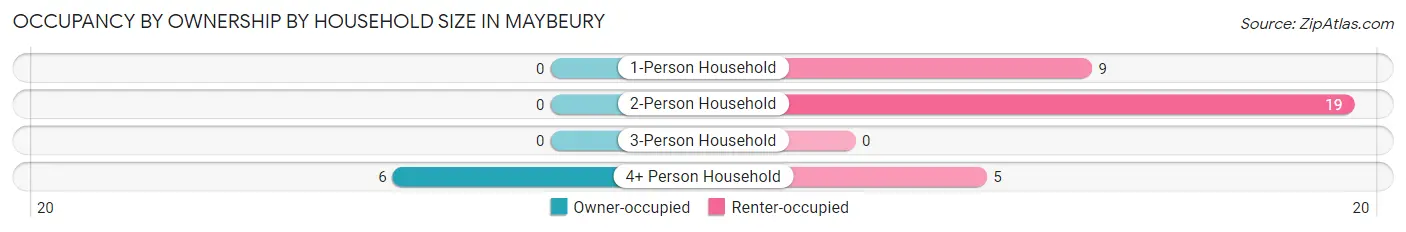
| Household Size | Owner-occupied | Renter-occupied |
| 1-Person Household | 0 (0.0%) | 9 (100.0%) |
| 2-Person Household | 0 (0.0%) | 19 (100.0%) |
| 3-Person Household | 0 (0.0%) | 0 (0.0%) |
| 4+ Person Household | 6 (54.5%) | 5 (45.5%) |
| Total Housing Units | 6 (15.4%) | 33 (84.6%) |
Occupancy by Educational Attainment in Maybeury
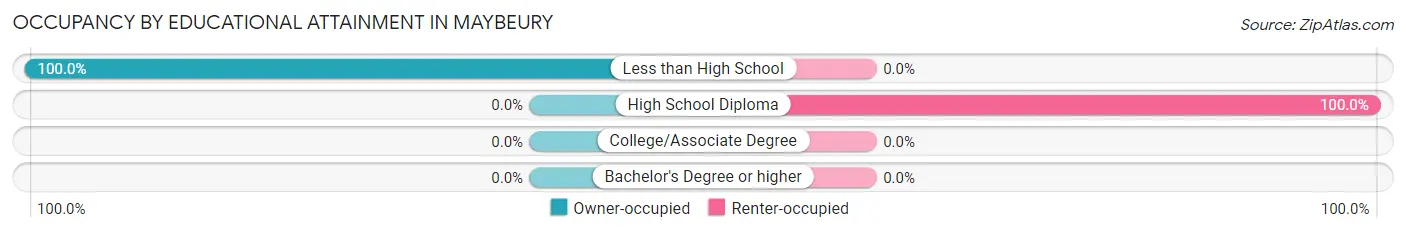
| Household Size | Owner-occupied | Renter-occupied |
| Less than High School | 6 (100.0%) | 0 (0.0%) |
| High School Diploma | 0 (0.0%) | 33 (100.0%) |
| College/Associate Degree | 0 (0.0%) | 0 (0.0%) |
| Bachelor's Degree or higher | 0 (0.0%) | 0 (0.0%) |
Occupancy by Age of Householder in Maybeury
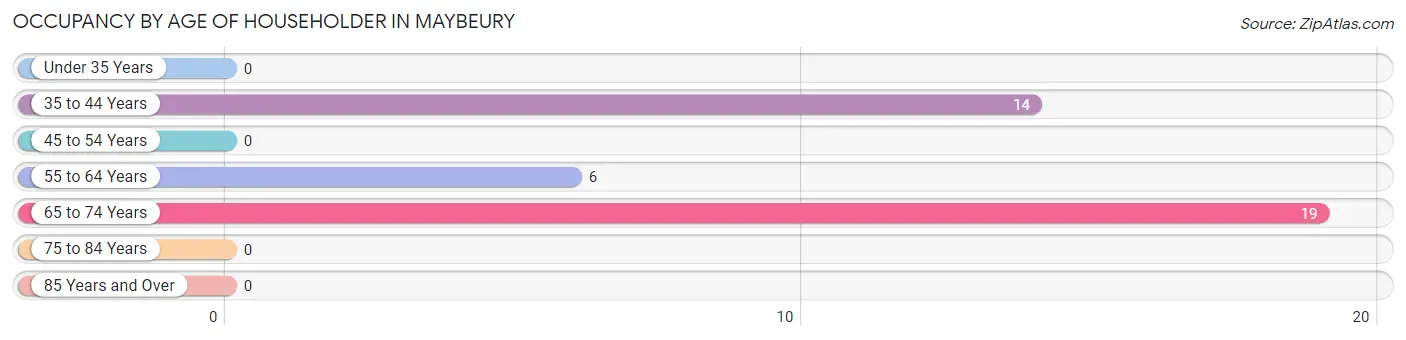
| Age Bracket | # Households | % Households |
| Under 35 Years | 0 | 0.0% |
| 35 to 44 Years | 14 | 35.9% |
| 45 to 54 Years | 0 | 0.0% |
| 55 to 64 Years | 6 | 15.4% |
| 65 to 74 Years | 19 | 48.7% |
| 75 to 84 Years | 0 | 0.0% |
| 85 Years and Over | 0 | 0.0% |
| Total | 39 | 100.0% |
Housing Finances in Maybeury
Median Income by Occupancy in Maybeury
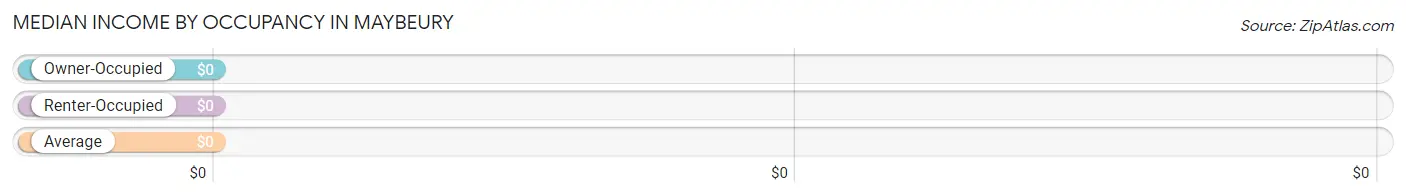
| Occupancy Type | # Households | Median Income |
| Owner-Occupied | 6 (15.4%) | $0 |
| Renter-Occupied | 33 (84.6%) | $0 |
| Average | 39 (100.0%) | $0 |
Occupancy by Householder Income Bracket in Maybeury
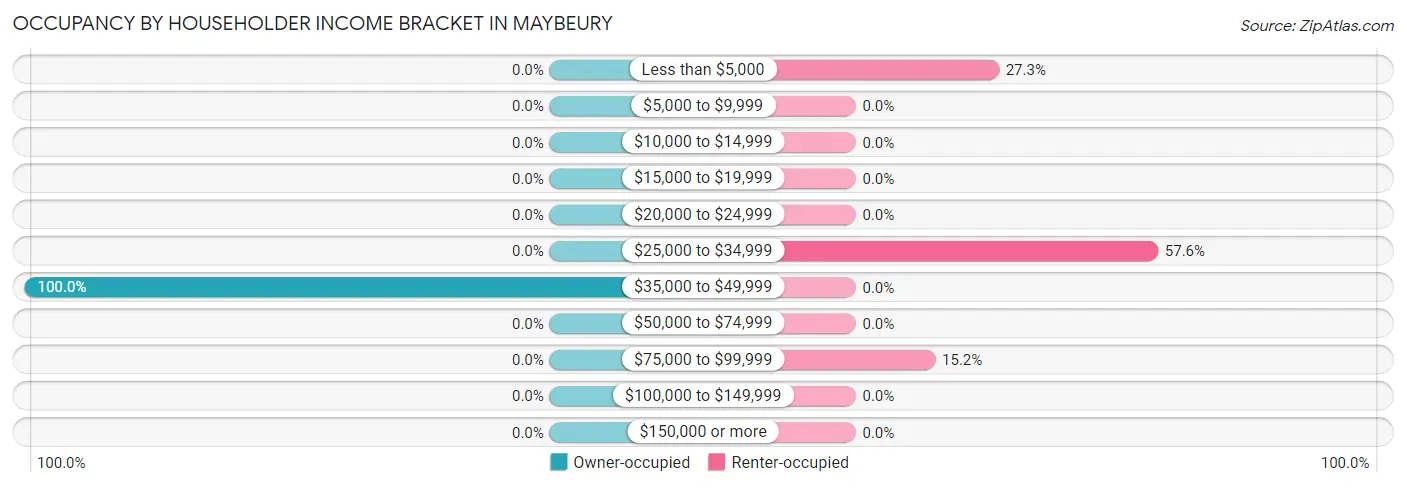
| Income Bracket | Owner-occupied | Renter-occupied |
| Less than $5,000 | 0 (0.0%) | 9 (27.3%) |
| $5,000 to $9,999 | 0 (0.0%) | 0 (0.0%) |
| $10,000 to $14,999 | 0 (0.0%) | 0 (0.0%) |
| $15,000 to $19,999 | 0 (0.0%) | 0 (0.0%) |
| $20,000 to $24,999 | 0 (0.0%) | 0 (0.0%) |
| $25,000 to $34,999 | 0 (0.0%) | 19 (57.6%) |
| $35,000 to $49,999 | 6 (100.0%) | 0 (0.0%) |
| $50,000 to $74,999 | 0 (0.0%) | 0 (0.0%) |
| $75,000 to $99,999 | 0 (0.0%) | 5 (15.1%) |
| $100,000 to $149,999 | 0 (0.0%) | 0 (0.0%) |
| $150,000 or more | 0 (0.0%) | 0 (0.0%) |
| Total | 6 (100.0%) | 33 (100.0%) |
Monthly Housing Cost Tiers in Maybeury
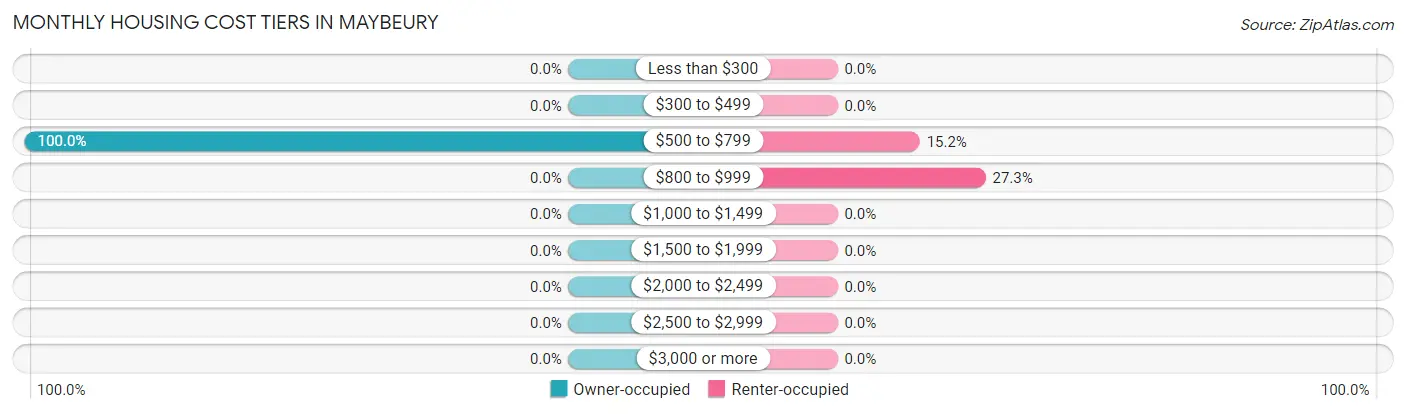
| Monthly Cost | Owner-occupied | Renter-occupied |
| Less than $300 | 0 (0.0%) | 0 (0.0%) |
| $300 to $499 | 0 (0.0%) | 0 (0.0%) |
| $500 to $799 | 6 (100.0%) | 5 (15.1%) |
| $800 to $999 | 0 (0.0%) | 9 (27.3%) |
| $1,000 to $1,499 | 0 (0.0%) | 0 (0.0%) |
| $1,500 to $1,999 | 0 (0.0%) | 0 (0.0%) |
| $2,000 to $2,499 | 0 (0.0%) | 0 (0.0%) |
| $2,500 to $2,999 | 0 (0.0%) | 0 (0.0%) |
| $3,000 or more | 0 (0.0%) | 0 (0.0%) |
| Total | 6 (100.0%) | 33 (100.0%) |
Physical Housing Characteristics in Maybeury
Housing Structures in Maybeury
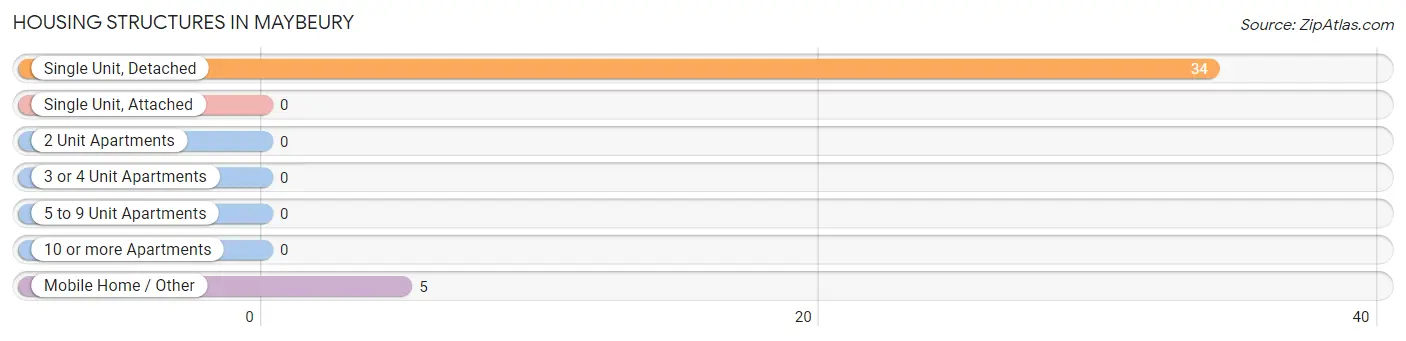
| Structure Type | # Housing Units | % Housing Units |
| Single Unit, Detached | 34 | 87.2% |
| Single Unit, Attached | 0 | 0.0% |
| 2 Unit Apartments | 0 | 0.0% |
| 3 or 4 Unit Apartments | 0 | 0.0% |
| 5 to 9 Unit Apartments | 0 | 0.0% |
| 10 or more Apartments | 0 | 0.0% |
| Mobile Home / Other | 5 | 12.8% |
| Total | 39 | 100.0% |
Housing Structures by Occupancy in Maybeury
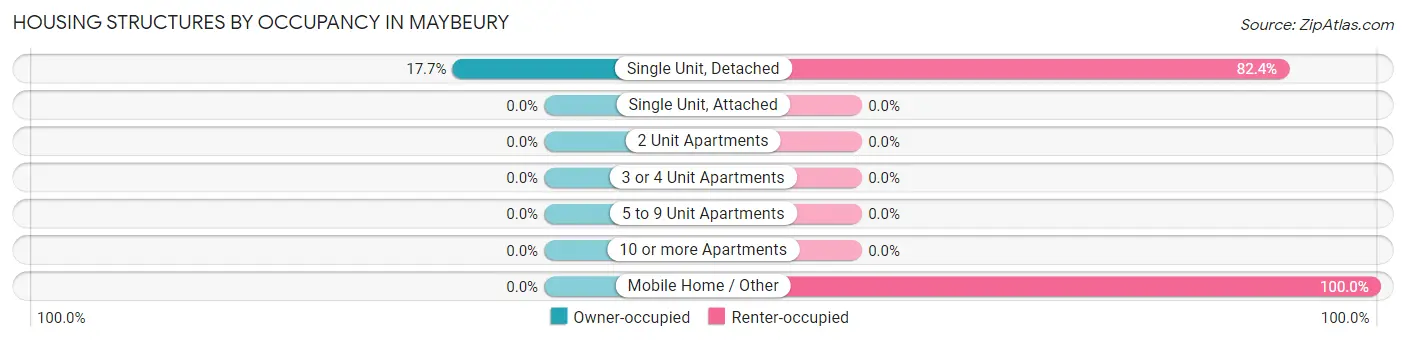
| Structure Type | Owner-occupied | Renter-occupied |
| Single Unit, Detached | 6 (17.6%) | 28 (82.4%) |
| Single Unit, Attached | 0 (0.0%) | 0 (0.0%) |
| 2 Unit Apartments | 0 (0.0%) | 0 (0.0%) |
| 3 or 4 Unit Apartments | 0 (0.0%) | 0 (0.0%) |
| 5 to 9 Unit Apartments | 0 (0.0%) | 0 (0.0%) |
| 10 or more Apartments | 0 (0.0%) | 0 (0.0%) |
| Mobile Home / Other | 0 (0.0%) | 5 (100.0%) |
| Total | 6 (15.4%) | 33 (84.6%) |
Housing Structures by Number of Rooms in Maybeury
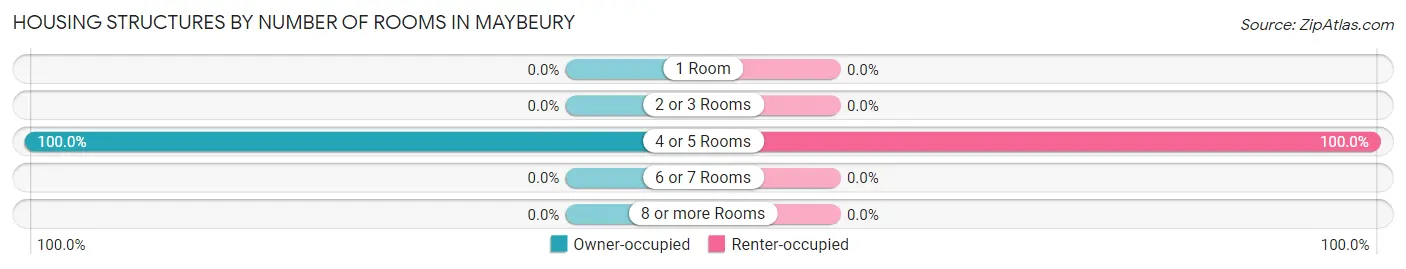
| Number of Rooms | Owner-occupied | Renter-occupied |
| 1 Room | 0 (0.0%) | 0 (0.0%) |
| 2 or 3 Rooms | 0 (0.0%) | 0 (0.0%) |
| 4 or 5 Rooms | 6 (100.0%) | 33 (100.0%) |
| 6 or 7 Rooms | 0 (0.0%) | 0 (0.0%) |
| 8 or more Rooms | 0 (0.0%) | 0 (0.0%) |
| Total | 6 (100.0%) | 33 (100.0%) |
Housing Structure by Heating Type in Maybeury
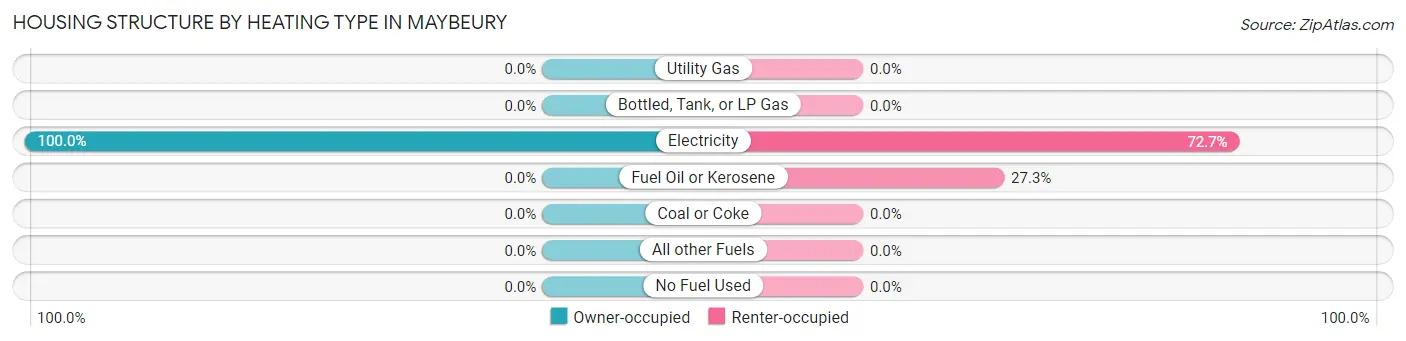
| Heating Type | Owner-occupied | Renter-occupied |
| Utility Gas | 0 (0.0%) | 0 (0.0%) |
| Bottled, Tank, or LP Gas | 0 (0.0%) | 0 (0.0%) |
| Electricity | 6 (100.0%) | 24 (72.7%) |
| Fuel Oil or Kerosene | 0 (0.0%) | 9 (27.3%) |
| Coal or Coke | 0 (0.0%) | 0 (0.0%) |
| All other Fuels | 0 (0.0%) | 0 (0.0%) |
| No Fuel Used | 0 (0.0%) | 0 (0.0%) |
| Total | 6 (100.0%) | 33 (100.0%) |
Household Vehicle Usage in Maybeury
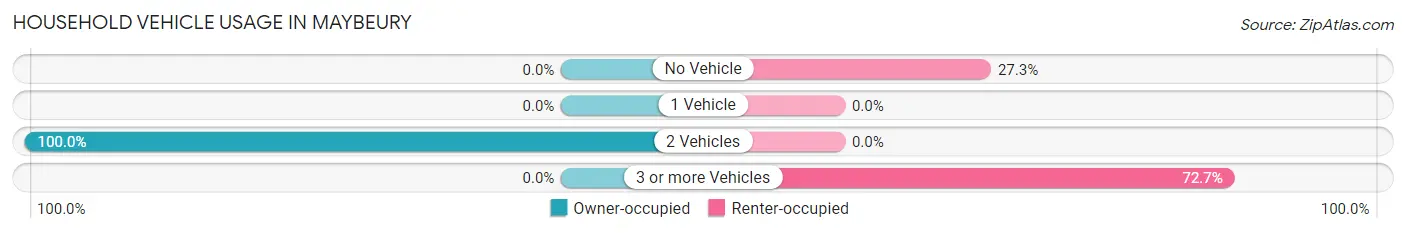
| Vehicles per Household | Owner-occupied | Renter-occupied |
| No Vehicle | 0 (0.0%) | 9 (27.3%) |
| 1 Vehicle | 0 (0.0%) | 0 (0.0%) |
| 2 Vehicles | 6 (100.0%) | 0 (0.0%) |
| 3 or more Vehicles | 0 (0.0%) | 24 (72.7%) |
| Total | 6 (100.0%) | 33 (100.0%) |
Real Estate & Mortgages in Maybeury
Real Estate and Mortgage Overview in Maybeury
| Characteristic | Without Mortgage | With Mortgage |
| Housing Units | 6 | 0 |
| Median Property Value | - | - |
| Median Household Income | - | - |
| Monthly Housing Costs | - | - |
| Real Estate Taxes | - | - |
Property Value by Mortgage Status in Maybeury
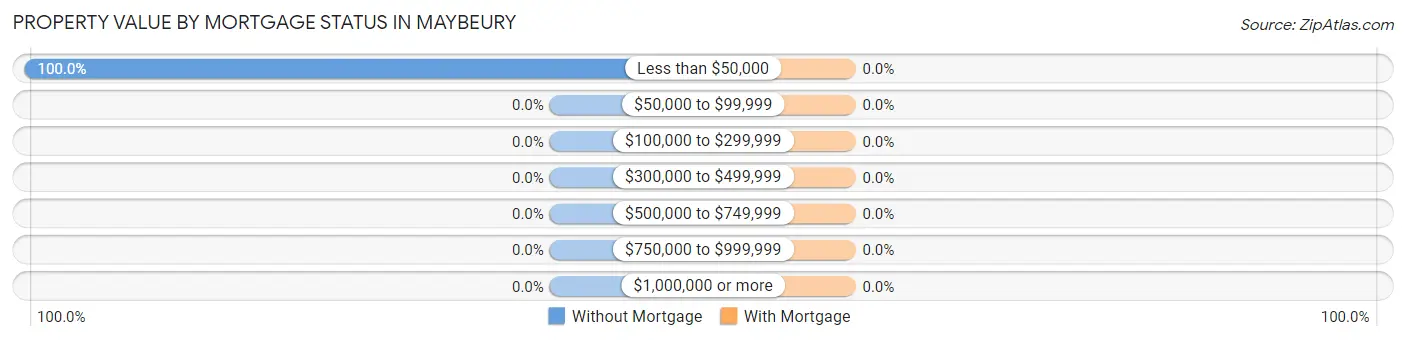
| Property Value | Without Mortgage | With Mortgage |
| Less than $50,000 | 6 (100.0%) | 0 (0.0%) |
| $50,000 to $99,999 | 0 (0.0%) | 0 (0.0%) |
| $100,000 to $299,999 | 0 (0.0%) | 0 (0.0%) |
| $300,000 to $499,999 | 0 (0.0%) | 0 (0.0%) |
| $500,000 to $749,999 | 0 (0.0%) | 0 (0.0%) |
| $750,000 to $999,999 | 0 (0.0%) | 0 (0.0%) |
| $1,000,000 or more | 0 (0.0%) | 0 (0.0%) |
| Total | 6 (100.0%) | 0 (0.0%) |
Household Income by Mortgage Status in Maybeury
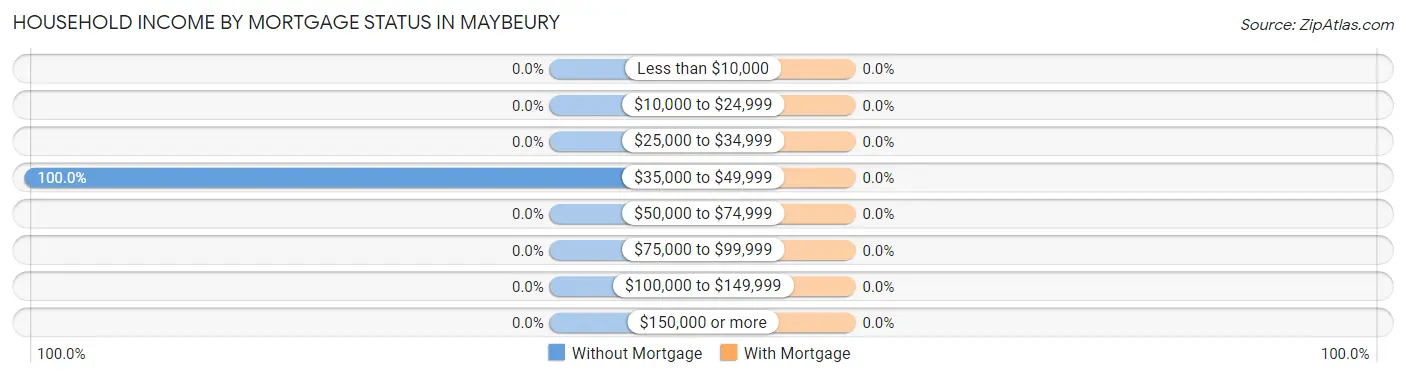
| Household Income | Without Mortgage | With Mortgage |
| Less than $10,000 | 0 (0.0%) | 0 (0.0%) |
| $10,000 to $24,999 | 0 (0.0%) | 0 (0.0%) |
| $25,000 to $34,999 | 0 (0.0%) | 0 (0.0%) |
| $35,000 to $49,999 | 6 (100.0%) | 0 (0.0%) |
| $50,000 to $74,999 | 0 (0.0%) | 0 (0.0%) |
| $75,000 to $99,999 | 0 (0.0%) | 0 (0.0%) |
| $100,000 to $149,999 | 0 (0.0%) | 0 (0.0%) |
| $150,000 or more | 0 (0.0%) | 0 (0.0%) |
| Total | 6 (100.0%) | 0 (0.0%) |
Property Value to Household Income Ratio in Maybeury
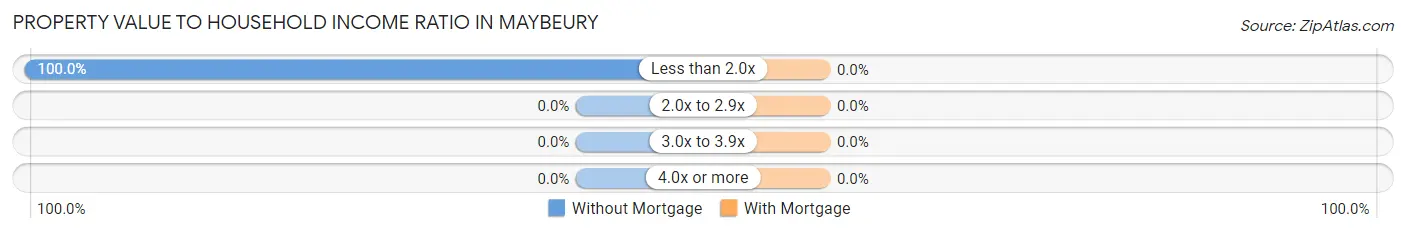
| Value-to-Income Ratio | Without Mortgage | With Mortgage |
| Less than 2.0x | 6 (100.0%) | 0 (0.0%) |
| 2.0x to 2.9x | 0 (0.0%) | 0 (0.0%) |
| 3.0x to 3.9x | 0 (0.0%) | 0 (0.0%) |
| 4.0x or more | 0 (0.0%) | 0 (0.0%) |
| Total | 6 (100.0%) | 0 (0.0%) |
Real Estate Taxes by Mortgage Status in Maybeury
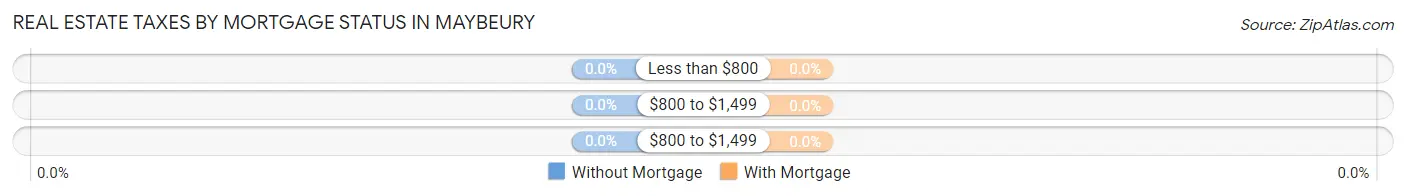
| Property Taxes | Without Mortgage | With Mortgage |
| Less than $800 | 0 (0.0%) | 0 (0.0%) |
| $800 to $1,499 | 0 (0.0%) | 0 (0.0%) |
| $800 to $1,499 | 0 (0.0%) | 0 (0.0%) |
| Total | 6 (100.0%) | 0 (0.0%) |
Health & Disability in Maybeury
Health Insurance Coverage by Age in Maybeury
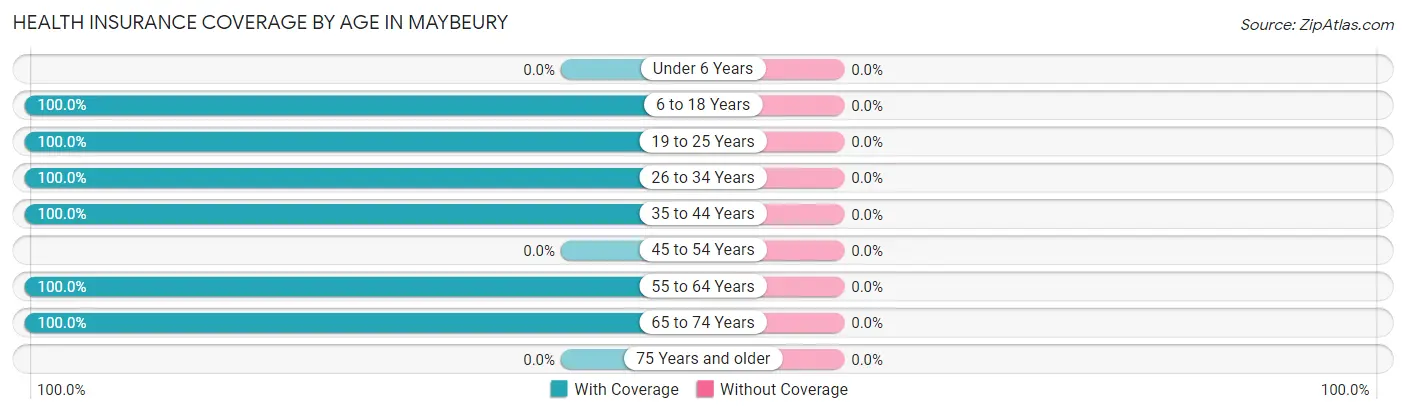
| Age Bracket | With Coverage | Without Coverage |
| Under 6 Years | 0 (0.0%) | 0 (0.0%) |
| 6 to 18 Years | 13 (100.0%) | 0 (0.0%) |
| 19 to 25 Years | 17 (100.0%) | 0 (0.0%) |
| 26 to 34 Years | 44 (100.0%) | 0 (0.0%) |
| 35 to 44 Years | 22 (100.0%) | 0 (0.0%) |
| 45 to 54 Years | 0 (0.0%) | 0 (0.0%) |
| 55 to 64 Years | 20 (100.0%) | 0 (0.0%) |
| 65 to 74 Years | 47 (100.0%) | 0 (0.0%) |
| 75 Years and older | 0 (0.0%) | 0 (0.0%) |
| Total | 163 (100.0%) | 0 (0.0%) |
Health Insurance Coverage by Citizenship Status in Maybeury
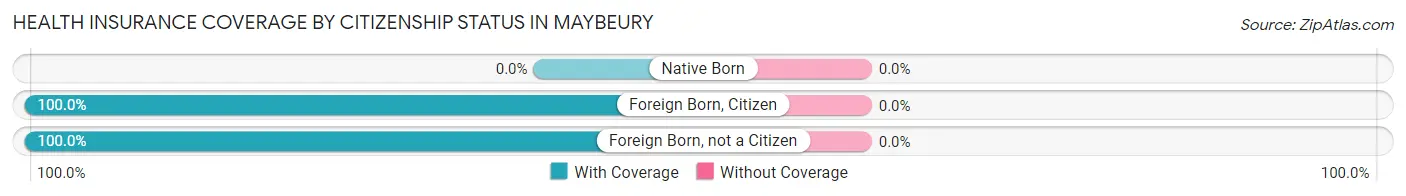
| Citizenship Status | With Coverage | Without Coverage |
| Native Born | 0 (0.0%) | 0 (0.0%) |
| Foreign Born, Citizen | 13 (100.0%) | 0 (0.0%) |
| Foreign Born, not a Citizen | 17 (100.0%) | 0 (0.0%) |
Health Insurance Coverage by Household Income in Maybeury
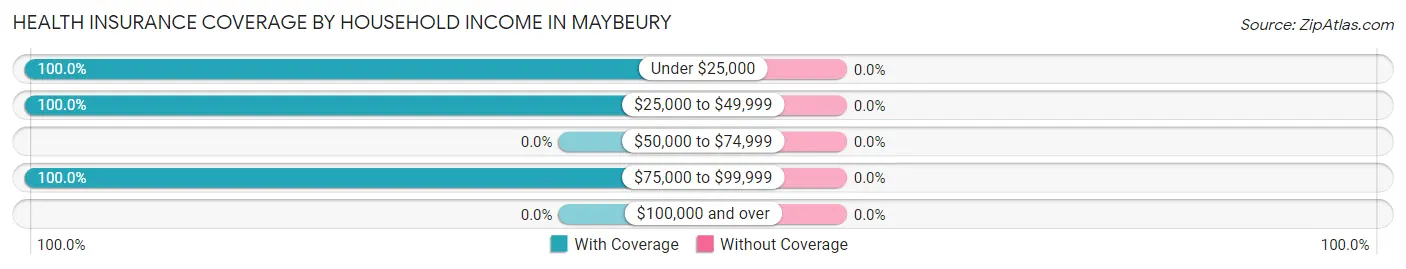
| Household Income | With Coverage | Without Coverage |
| Under $25,000 | 9 (100.0%) | 0 (0.0%) |
| $25,000 to $49,999 | 128 (100.0%) | 0 (0.0%) |
| $50,000 to $74,999 | 0 (0.0%) | 0 (0.0%) |
| $75,000 to $99,999 | 26 (100.0%) | 0 (0.0%) |
| $100,000 and over | 0 (0.0%) | 0 (0.0%) |
Public vs Private Health Insurance Coverage by Age in Maybeury
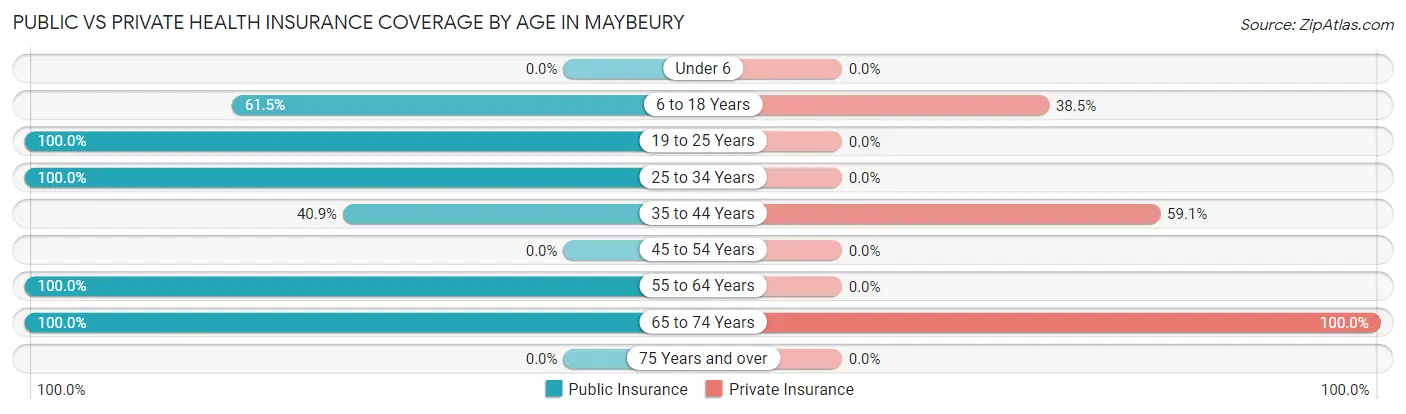
| Age Bracket | Public Insurance | Private Insurance |
| Under 6 | 0 (0.0%) | 0 (0.0%) |
| 6 to 18 Years | 8 (61.5%) | 5 (38.5%) |
| 19 to 25 Years | 17 (100.0%) | 0 (0.0%) |
| 25 to 34 Years | 44 (100.0%) | 0 (0.0%) |
| 35 to 44 Years | 9 (40.9%) | 13 (59.1%) |
| 45 to 54 Years | 0 (0.0%) | 0 (0.0%) |
| 55 to 64 Years | 20 (100.0%) | 0 (0.0%) |
| 65 to 74 Years | 47 (100.0%) | 47 (100.0%) |
| 75 Years and over | 0 (0.0%) | 0 (0.0%) |
| Total | 145 (89.0%) | 65 (39.9%) |
Disability Status by Sex by Age in Maybeury
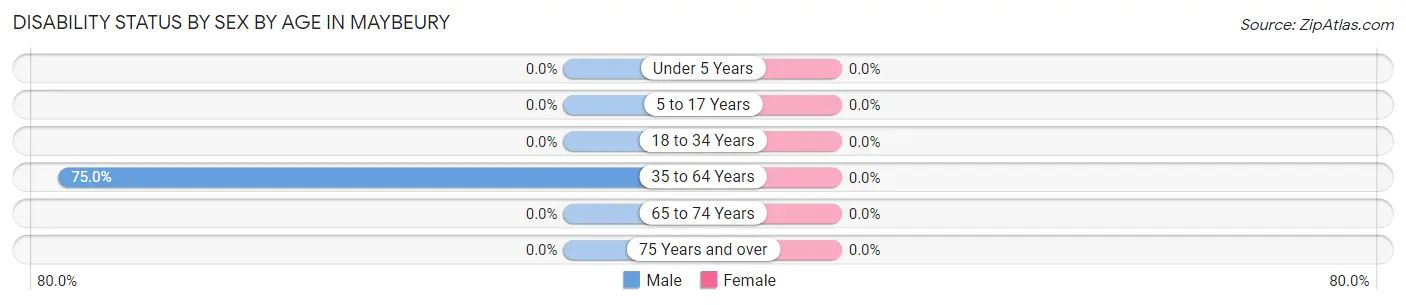
| Age Bracket | Male | Female |
| Under 5 Years | 0 (0.0%) | 0 (0.0%) |
| 5 to 17 Years | 0 (0.0%) | 0 (0.0%) |
| 18 to 34 Years | 0 (0.0%) | 0 (0.0%) |
| 35 to 64 Years | 15 (75.0%) | 0 (0.0%) |
| 65 to 74 Years | 0 (0.0%) | 0 (0.0%) |
| 75 Years and over | 0 (0.0%) | 0 (0.0%) |
Disability Class by Sex by Age in Maybeury
Disability Class: Hearing Difficulty
| Age Bracket | Male | Female |
| Under 5 Years | 0 (0.0%) | 0 (0.0%) |
| 5 to 17 Years | 0 (0.0%) | 0 (0.0%) |
| 18 to 34 Years | 0 (0.0%) | 0 (0.0%) |
| 35 to 64 Years | 0 (0.0%) | 0 (0.0%) |
| 65 to 74 Years | 0 (0.0%) | 0 (0.0%) |
| 75 Years and over | 0 (0.0%) | 0 (0.0%) |
Disability Class: Vision Difficulty
| Age Bracket | Male | Female |
| Under 5 Years | 0 (0.0%) | 0 (0.0%) |
| 5 to 17 Years | 0 (0.0%) | 0 (0.0%) |
| 18 to 34 Years | 0 (0.0%) | 0 (0.0%) |
| 35 to 64 Years | 0 (0.0%) | 0 (0.0%) |
| 65 to 74 Years | 0 (0.0%) | 0 (0.0%) |
| 75 Years and over | 0 (0.0%) | 0 (0.0%) |
Disability Class: Cognitive Difficulty
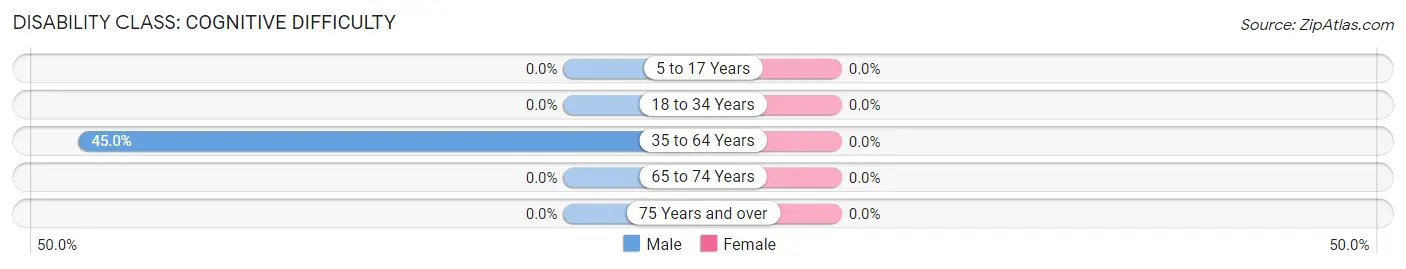
| Age Bracket | Male | Female |
| 5 to 17 Years | 0 (0.0%) | 0 (0.0%) |
| 18 to 34 Years | 0 (0.0%) | 0 (0.0%) |
| 35 to 64 Years | 9 (45.0%) | 0 (0.0%) |
| 65 to 74 Years | 0 (0.0%) | 0 (0.0%) |
| 75 Years and over | 0 (0.0%) | 0 (0.0%) |
Disability Class: Ambulatory Difficulty
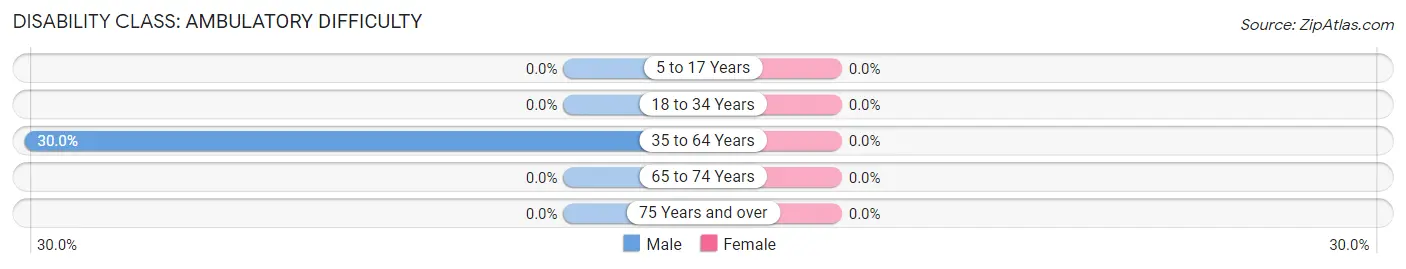
| Age Bracket | Male | Female |
| 5 to 17 Years | 0 (0.0%) | 0 (0.0%) |
| 18 to 34 Years | 0 (0.0%) | 0 (0.0%) |
| 35 to 64 Years | 6 (30.0%) | 0 (0.0%) |
| 65 to 74 Years | 0 (0.0%) | 0 (0.0%) |
| 75 Years and over | 0 (0.0%) | 0 (0.0%) |
Disability Class: Self-Care Difficulty
| Age Bracket | Male | Female |
| 5 to 17 Years | 0 (0.0%) | 0 (0.0%) |
| 18 to 34 Years | 0 (0.0%) | 0 (0.0%) |
| 35 to 64 Years | 0 (0.0%) | 0 (0.0%) |
| 65 to 74 Years | 0 (0.0%) | 0 (0.0%) |
| 75 Years and over | 0 (0.0%) | 0 (0.0%) |
Technology Access in Maybeury
Computing Device Access in Maybeury
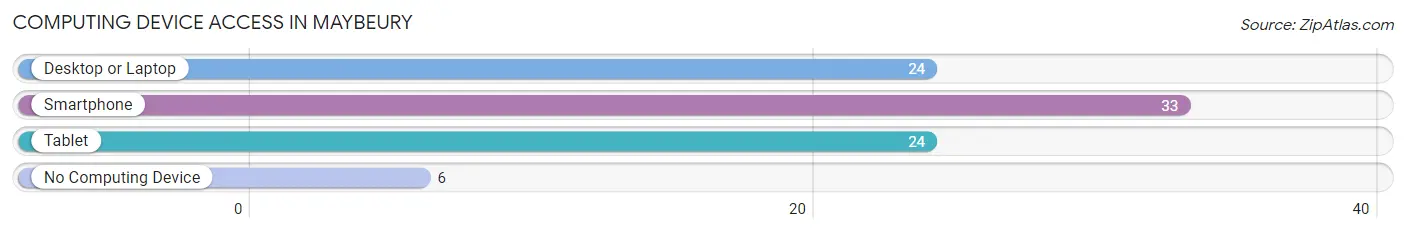
| Device Type | # Households | % Households |
| Desktop or Laptop | 24 | 61.5% |
| Smartphone | 33 | 84.6% |
| Tablet | 24 | 61.5% |
| No Computing Device | 6 | 15.4% |
| Total | 39 | 100.0% |
Internet Access in Maybeury
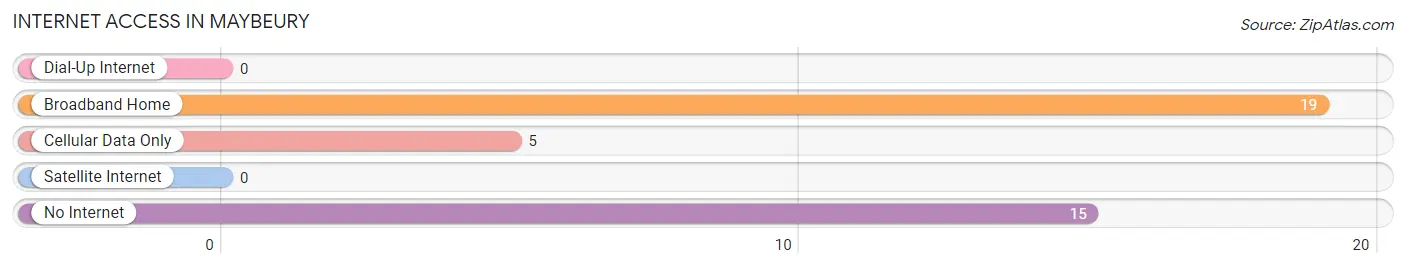
| Internet Type | # Households | % Households |
| Dial-Up Internet | 0 | 0.0% |
| Broadband Home | 19 | 48.7% |
| Cellular Data Only | 5 | 12.8% |
| Satellite Internet | 0 | 0.0% |
| No Internet | 15 | 38.5% |
| Total | 39 | 100.0% |
Maybeury Summary
Maybeury is an unincorporated community located in McDowell County, West Virginia. It is situated in the Appalachian Mountains, and is part of the Appalachian Regional Commission. The population of Maybeury was estimated to be around 200 people in 2000.
Geography
Maybeury is located in the Appalachian Mountains of West Virginia, in the southwestern part of McDowell County. It is situated at an elevation of 2,845 feet above sea level. The community is located near the headwaters of the Tug Fork River, and is surrounded by the mountains of the Appalachian Plateau. The nearest major city is Bluefield, which is located about 25 miles to the east.
The climate in Maybeury is characterized by mild winters and hot, humid summers. The average annual temperature is around 50 degrees Fahrenheit, with average lows in the winter months reaching around 25 degrees Fahrenheit. The average annual precipitation is around 40 inches.
Economy
The economy of Maybeury is largely based on coal mining and timber harvesting. The area is home to several coal mines, including the Maybeury Mine, which is owned by the West Virginia Coal Company. The mine produces coal for both domestic and international markets.
In addition to coal mining, Maybeury is also home to several timber harvesting operations. The area is home to several sawmills, which produce lumber for both domestic and international markets.
Demographics
The population of Maybeury was estimated to be around 200 people in 2000. The racial makeup of the community was 97.5% White, 0.5% African American, 0.5% Native American, and 1.5% from other races. The median household income was $25,000, and the median family income was $30,000.
Conclusion
Maybeury is an unincorporated community located in McDowell County, West Virginia. It is situated in the Appalachian Mountains, and is part of the Appalachian Regional Commission. The economy of Maybeury is largely based on coal mining and timber harvesting. The population of Maybeury was estimated to be around 200 people in 2000. The racial makeup of the community was 97.5% White, 0.5% African American, 0.5% Native American, and 1.5% from other races. The median household income was $25,000, and the median family income was $30,000.
Common Questions
What is Per Capita Income in Maybeury?
Per Capita income in Maybeury is $10,118.
What is the Median Family Income in Maybeury?
Median Family Income in Maybeury is $31,974.
What is Inequality or Gini Index in Maybeury?
Inequality or Gini Index in Maybeury is 0.36.
What is the Total Population of Maybeury?
Total Population of Maybeury is 163.
What is the Total Male Population of Maybeury?
Total Male Population of Maybeury is 66.
What is the Total Female Population of Maybeury?
Total Female Population of Maybeury is 97.
What is the Ratio of Males per 100 Females in Maybeury?
There are 68.04 Males per 100 Females in Maybeury.
What is the Ratio of Females per 100 Males in Maybeury?
There are 146.97 Females per 100 Males in Maybeury.
What is the Median Population Age in Maybeury?
Median Population Age in Maybeury is 35.8 Years.
What is the Average Family Size in Maybeury
Average Family Size in Maybeury is 3.8 People.
What is the Average Household Size in Maybeury
Average Household Size in Maybeury is 4.2 People.
How Large is the Labor Force in Maybeury?
There are 50 People in the Labor Forcein in Maybeury.
What is the Percentage of People in the Labor Force in Maybeury?
30.7% of People are in the Labor Force in Maybeury.
What is the Unemployment Rate in Maybeury?
Unemployment Rate in Maybeury is 18.0%.