Brillion, WI Map & Demographics
Brillion Map
Brillion Overview
$30,929
PER CAPITA INCOME
$95,500
AVG FAMILY INCOME
$62,654
AVG HOUSEHOLD INCOME
41.5%
WAGE / INCOME GAP [ % ]
58.5¢/ $1
WAGE / INCOME GAP [ $ ]
0.39
INEQUALITY / GINI INDEX
3,294
TOTAL POPULATION
1,556
MALE POPULATION
1,738
FEMALE POPULATION
89.53
MALES / 100 FEMALES
111.70
FEMALES / 100 MALES
40.7
MEDIAN AGE
3.0
AVG FAMILY SIZE
2.5
AVG HOUSEHOLD SIZE
1,615
LABOR FORCE [ PEOPLE ]
60.2%
PERCENT IN LABOR FORCE
1.5%
UNEMPLOYMENT RATE
Brillion Zip Codes
Brillion Area Codes
Income in Brillion
Income Overview in Brillion
Per Capita Income in Brillion is $30,929, while median incomes of families and households are $95,500 and $62,654 respectively.
| Characteristic | Number | Measure |
| Per Capita Income | 3,294 | $30,929 |
| Median Family Income | 982 | $95,500 |
| Mean Family Income | 982 | $93,293 |
| Median Household Income | 1,333 | $62,654 |
| Mean Household Income | 1,333 | $77,810 |
| Income Deficit | 982 | $0 |
| Wage / Income Gap (%) | 3,294 | 41.45% |
| Wage / Income Gap ($) | 3,294 | 58.55¢ per $1 |
| Gini / Inequality Index | 3,294 | 0.39 |
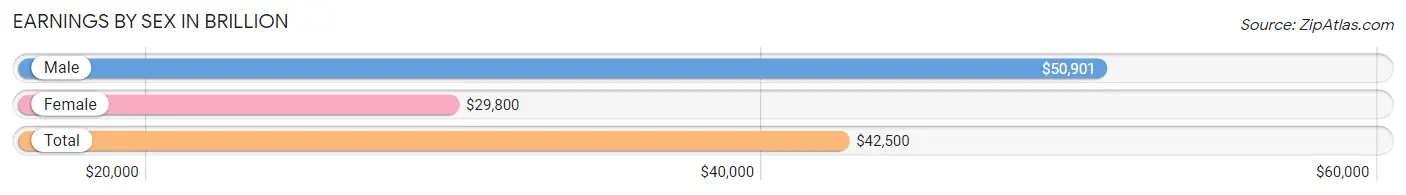
Earnings by Sex in Brillion
Average Earnings in Brillion are $42,500, $50,901 for men and $29,800 for women, a difference of 41.4%.
| Sex | Number | Average Earnings |
| Male | 822 (50.4%) | $50,901 |
| Female | 810 (49.6%) | $29,800 |
| Total | 1,632 (100.0%) | $42,500 |
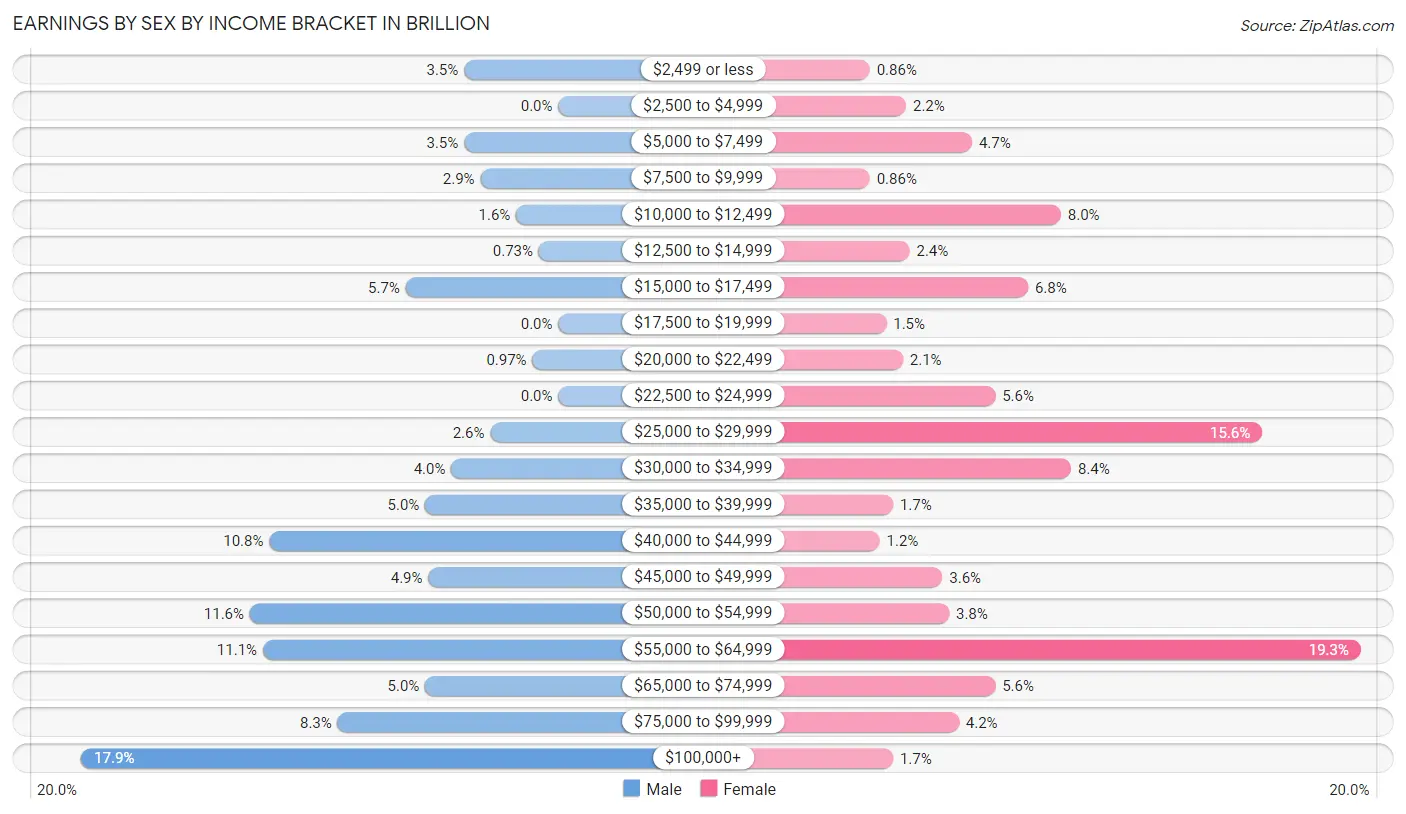
Earnings by Sex by Income Bracket in Brillion
The most common earnings brackets in Brillion are $100,000+ for men (147 | 17.9%) and $55,000 to $64,999 for women (156 | 19.3%).
| Income | Male | Female |
| $2,499 or less | 29 (3.5%) | 7 (0.9%) |
| $2,500 to $4,999 | 0 (0.0%) | 18 (2.2%) |
| $5,000 to $7,499 | 29 (3.5%) | 38 (4.7%) |
| $7,500 to $9,999 | 24 (2.9%) | 7 (0.9%) |
| $10,000 to $12,499 | 13 (1.6%) | 65 (8.0%) |
| $12,500 to $14,999 | 6 (0.7%) | 19 (2.4%) |
| $15,000 to $17,499 | 47 (5.7%) | 55 (6.8%) |
| $17,500 to $19,999 | 0 (0.0%) | 12 (1.5%) |
| $20,000 to $22,499 | 8 (1.0%) | 17 (2.1%) |
| $22,500 to $24,999 | 0 (0.0%) | 45 (5.6%) |
| $25,000 to $29,999 | 21 (2.5%) | 126 (15.6%) |
| $30,000 to $34,999 | 33 (4.0%) | 68 (8.4%) |
| $35,000 to $39,999 | 41 (5.0%) | 14 (1.7%) |
| $40,000 to $44,999 | 89 (10.8%) | 10 (1.2%) |
| $45,000 to $49,999 | 40 (4.9%) | 29 (3.6%) |
| $50,000 to $54,999 | 95 (11.6%) | 31 (3.8%) |
| $55,000 to $64,999 | 91 (11.1%) | 156 (19.3%) |
| $65,000 to $74,999 | 41 (5.0%) | 45 (5.6%) |
| $75,000 to $99,999 | 68 (8.3%) | 34 (4.2%) |
| $100,000+ | 147 (17.9%) | 14 (1.7%) |
| Total | 822 (100.0%) | 810 (100.0%) |
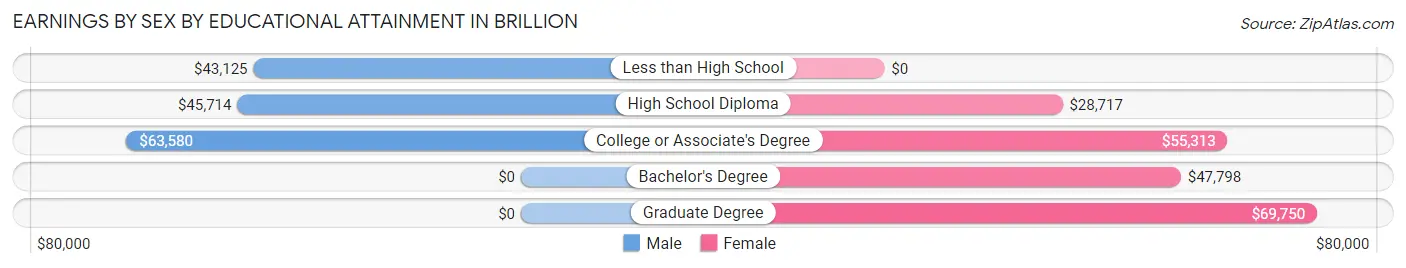
Earnings by Sex by Educational Attainment in Brillion
Average earnings in Brillion are $54,306 for men and $48,750 for women, a difference of 10.2%. Men with an educational attainment of college or associate's degree enjoy the highest average annual earnings of $63,580, while those with less than high school education earn the least with $43,125. Women with an educational attainment of graduate degree earn the most with the average annual earnings of $69,750, while those with high school diploma education have the smallest earnings of $28,717.
| Educational Attainment | Male Income | Female Income |
| Less than High School | $43,125 | $0 |
| High School Diploma | $45,714 | $28,717 |
| College or Associate's Degree | $63,580 | $55,313 |
| Bachelor's Degree | - | - |
| Graduate Degree | - | - |
| Total | $54,306 | $48,750 |
Family Income in Brillion
Family Income Brackets in Brillion
According to the Brillion family income data, there are 317 families falling into the $100,000 to $149,999 income range, which is the most common income bracket and makes up 32.3% of all families.
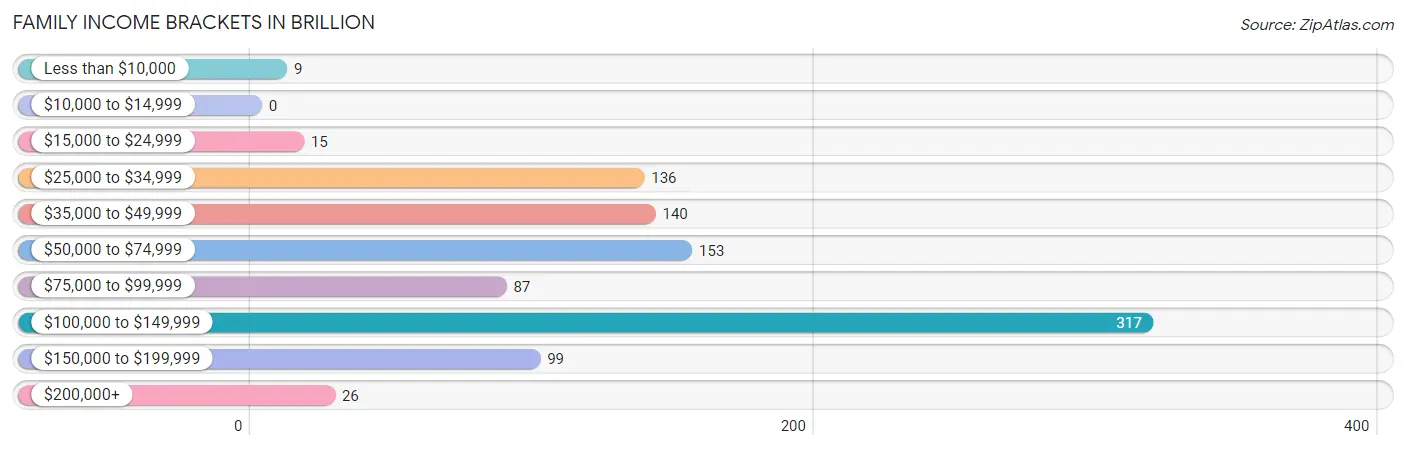
| Income Bracket | # Families | % Families |
| Less than $10,000 | 9 | 0.9% |
| $10,000 to $14,999 | 0 | 0.0% |
| $15,000 to $24,999 | 15 | 1.5% |
| $25,000 to $34,999 | 136 | 13.8% |
| $35,000 to $49,999 | 140 | 14.3% |
| $50,000 to $74,999 | 153 | 15.6% |
| $75,000 to $99,999 | 87 | 8.9% |
| $100,000 to $149,999 | 317 | 32.3% |
| $150,000 to $199,999 | 99 | 10.1% |
| $200,000+ | 26 | 2.6% |
Family Income by Famaliy Size in Brillion
5-person families (68 | 6.9%) account for the highest median family income in Brillion with $180,208 per family, while 2-person families (391 | 39.8%) have the highest median income of $37,210 per family member.
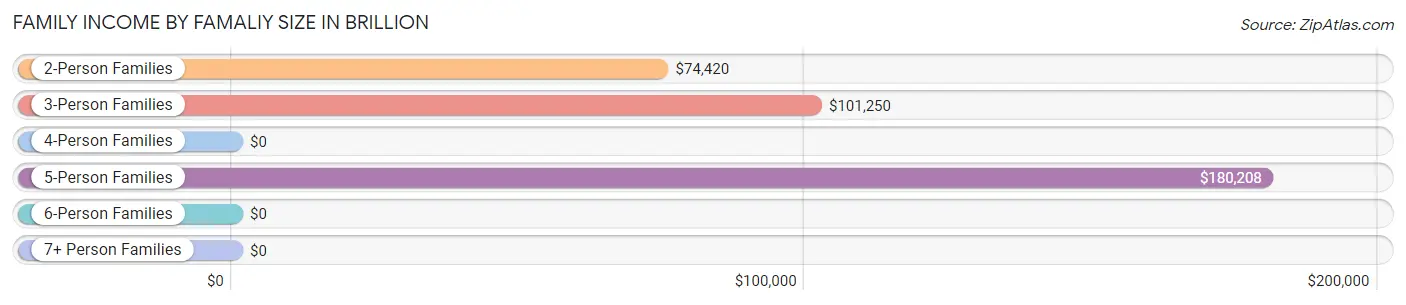
| Income Bracket | # Families | Median Income |
| 2-Person Families | 391 (39.8%) | $74,420 |
| 3-Person Families | 134 (13.7%) | $101,250 |
| 4-Person Families | 374 (38.1%) | $0 |
| 5-Person Families | 68 (6.9%) | $180,208 |
| 6-Person Families | 15 (1.5%) | $0 |
| 7+ Person Families | 0 (0.0%) | $0 |
| Total | 982 (100.0%) | $95,500 |
Family Income by Number of Earners in Brillion
The median family income in Brillion is $95,500, with families comprising 3+ earners (104) having the highest median family income of $143,750, while families with 1 earner (301) have the lowest median family income of $35,492, accounting for 10.6% and 30.6% of families, respectively.
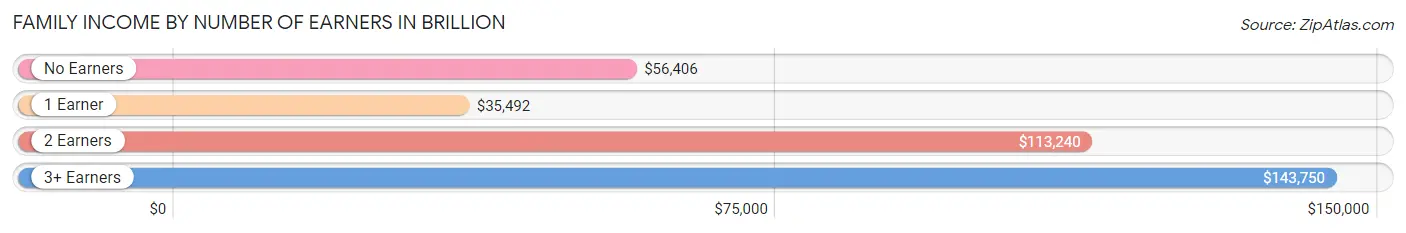
| Number of Earners | # Families | Median Income |
| No Earners | 147 (15.0%) | $56,406 |
| 1 Earner | 301 (30.6%) | $35,492 |
| 2 Earners | 430 (43.8%) | $113,240 |
| 3+ Earners | 104 (10.6%) | $143,750 |
| Total | 982 (100.0%) | $95,500 |
Household Income in Brillion
Household Income Brackets in Brillion
With 317 households falling in the category, the $100,000 to $149,999 income range is the most frequent in Brillion, accounting for 23.8% of all households. In contrast, only 19 households (1.4%) fall into the $10,000 to $14,999 income bracket, making it the least populous group.
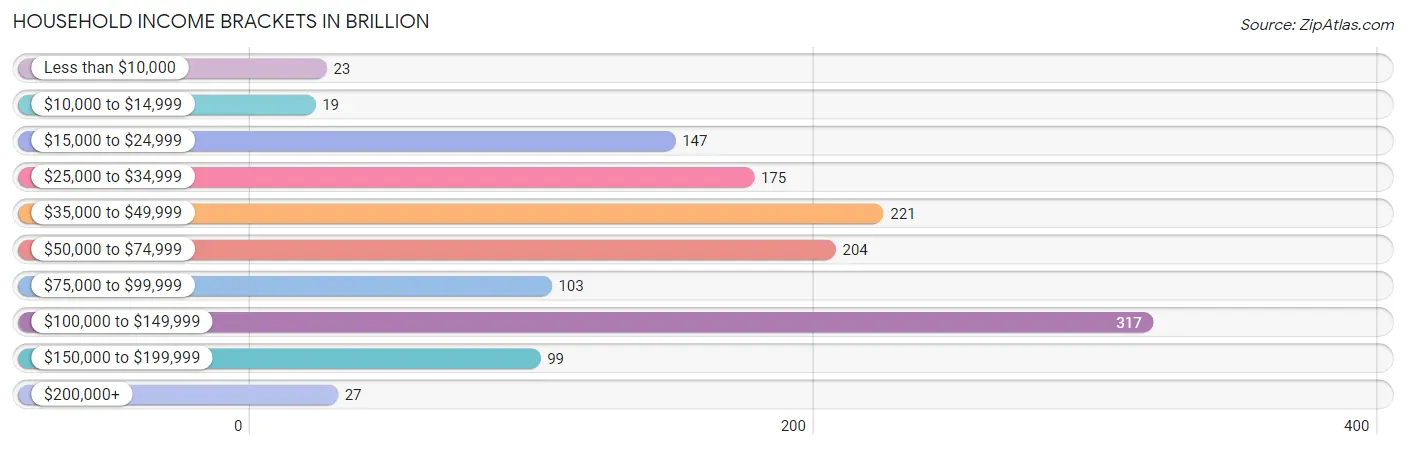
| Income Bracket | # Households | % Households |
| Less than $10,000 | 23 | 1.7% |
| $10,000 to $14,999 | 19 | 1.4% |
| $15,000 to $24,999 | 147 | 11.0% |
| $25,000 to $34,999 | 175 | 13.1% |
| $35,000 to $49,999 | 221 | 16.6% |
| $50,000 to $74,999 | 204 | 15.3% |
| $75,000 to $99,999 | 103 | 7.7% |
| $100,000 to $149,999 | 317 | 23.8% |
| $150,000 to $199,999 | 99 | 7.4% |
| $200,000+ | 27 | 2.0% |
Household Income by Householder Age in Brillion
The median household income in Brillion is $62,654, with the highest median household income of $112,569 found in the 15 to 24 years age bracket for the primary householder. A total of 35 households (2.6%) fall into this category. Meanwhile, the 65+ years age bracket for the primary householder has the lowest median household income of $31,240, with 496 households (37.2%) in this group.
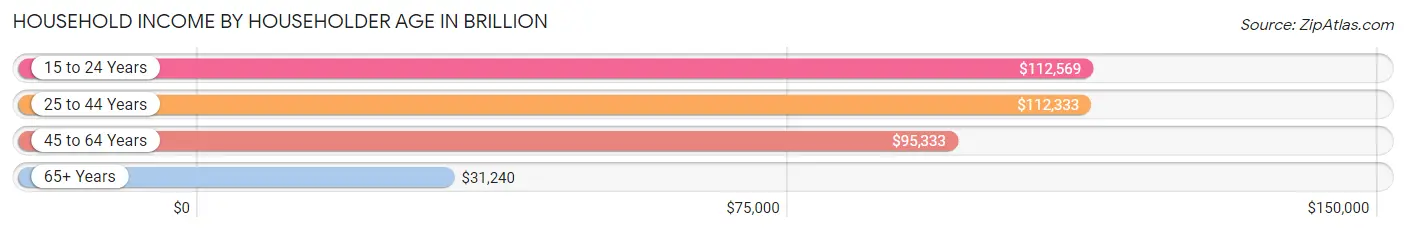
| Income Bracket | # Households | Median Income |
| 15 to 24 Years | 35 (2.6%) | $112,569 |
| 25 to 44 Years | 390 (29.3%) | $112,333 |
| 45 to 64 Years | 412 (30.9%) | $95,333 |
| 65+ Years | 496 (37.2%) | $31,240 |
| Total | 1,333 (100.0%) | $62,654 |
Poverty in Brillion
Income Below Poverty by Sex and Age in Brillion
With 16.3% poverty level for males and 11.3% for females among the residents of Brillion, 65 to 74 year old males and 16 and 17 year old females are the most vulnerable to poverty, with 127 males (63.5%) and 65 females (73.0%) in their respective age groups living below the poverty level.
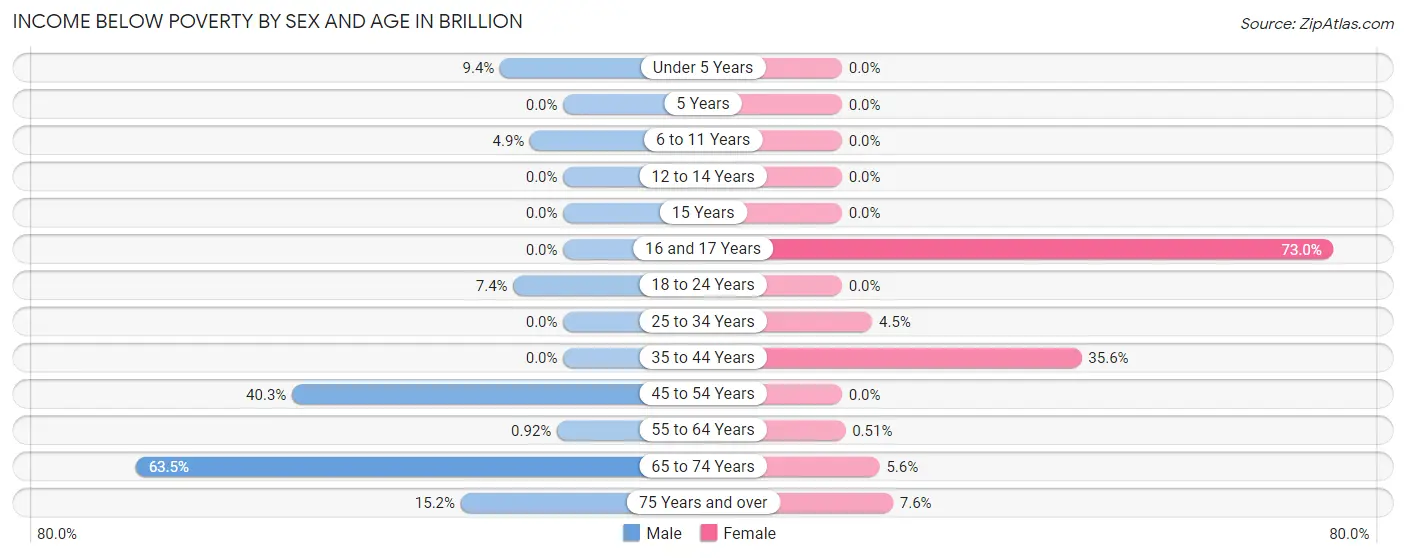
| Age Bracket | Male | Female |
| Under 5 Years | 6 (9.4%) | 0 (0.0%) |
| 5 Years | 0 (0.0%) | 0 (0.0%) |
| 6 to 11 Years | 7 (4.9%) | 0 (0.0%) |
| 12 to 14 Years | 0 (0.0%) | 0 (0.0%) |
| 15 Years | 0 (0.0%) | 0 (0.0%) |
| 16 and 17 Years | 0 (0.0%) | 65 (73.0%) |
| 18 to 24 Years | 6 (7.4%) | 0 (0.0%) |
| 25 to 34 Years | 0 (0.0%) | 9 (4.5%) |
| 35 to 44 Years | 0 (0.0%) | 95 (35.6%) |
| 45 to 54 Years | 91 (40.3%) | 0 (0.0%) |
| 55 to 64 Years | 2 (0.9%) | 1 (0.5%) |
| 65 to 74 Years | 127 (63.5%) | 10 (5.6%) |
| 75 Years and over | 14 (15.2%) | 15 (7.6%) |
| Total | 253 (16.3%) | 195 (11.3%) |
Income Above Poverty by Sex and Age in Brillion
According to the poverty statistics in Brillion, males aged 5 years and females aged under 5 years are the age groups that are most secure financially, with 100.0% of males and 100.0% of females in these age groups living above the poverty line.
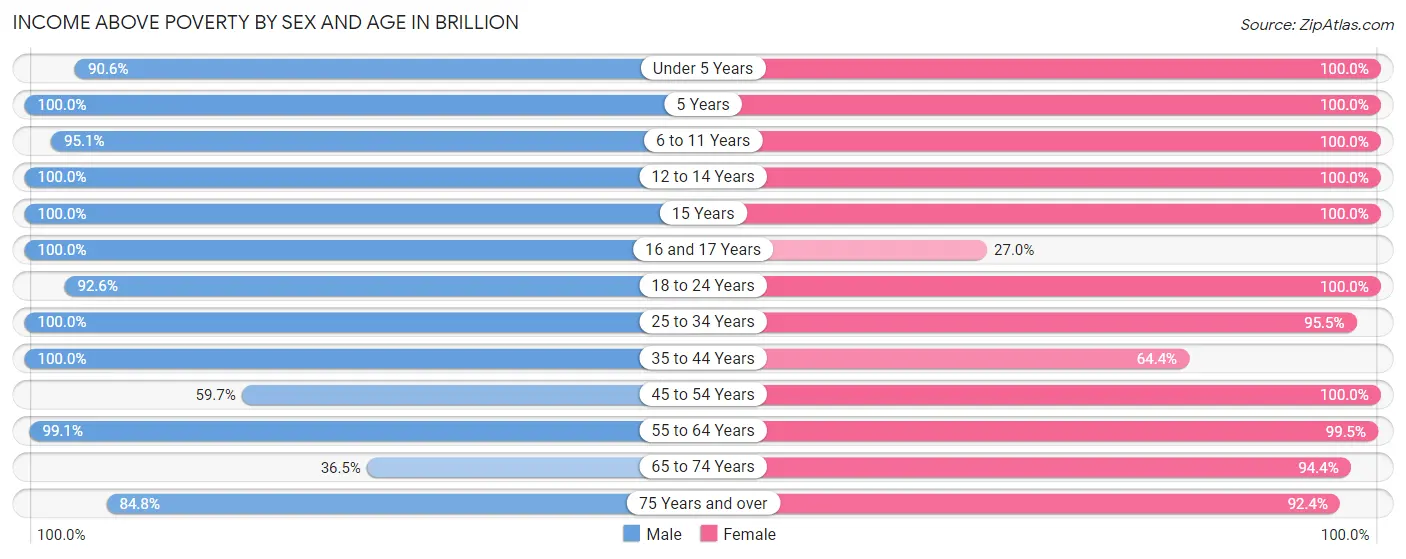
| Age Bracket | Male | Female |
| Under 5 Years | 58 (90.6%) | 76 (100.0%) |
| 5 Years | 6 (100.0%) | 29 (100.0%) |
| 6 to 11 Years | 135 (95.1%) | 146 (100.0%) |
| 12 to 14 Years | 28 (100.0%) | 67 (100.0%) |
| 15 Years | 34 (100.0%) | 20 (100.0%) |
| 16 and 17 Years | 66 (100.0%) | 24 (27.0%) |
| 18 to 24 Years | 75 (92.6%) | 140 (100.0%) |
| 25 to 34 Years | 253 (100.0%) | 191 (95.5%) |
| 35 to 44 Years | 147 (100.0%) | 172 (64.4%) |
| 45 to 54 Years | 135 (59.7%) | 118 (100.0%) |
| 55 to 64 Years | 215 (99.1%) | 196 (99.5%) |
| 65 to 74 Years | 73 (36.5%) | 169 (94.4%) |
| 75 Years and over | 78 (84.8%) | 183 (92.4%) |
| Total | 1,303 (83.7%) | 1,531 (88.7%) |
Income Below Poverty Among Married-Couple Families in Brillion
The poverty statistics for married-couple families in Brillion show that 2.2% or 16 of the total 719 families live below the poverty line. Families with no children have the highest poverty rate of 4.2%, comprising of 16 families. On the other hand, families with 1 or 2 children have the lowest poverty rate of 0.0%, which includes 0 families.
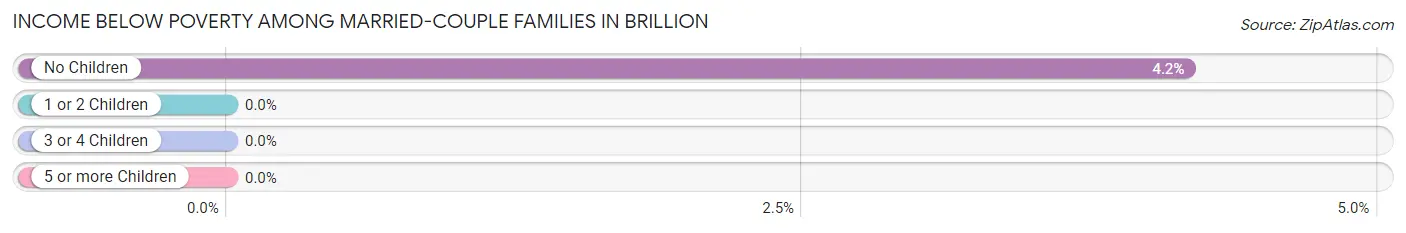
| Children | Above Poverty | Below Poverty |
| No Children | 368 (95.8%) | 16 (4.2%) |
| 1 or 2 Children | 313 (100.0%) | 0 (0.0%) |
| 3 or 4 Children | 22 (100.0%) | 0 (0.0%) |
| 5 or more Children | 0 (0.0%) | 0 (0.0%) |
| Total | 703 (97.8%) | 16 (2.2%) |
Income Below Poverty Among Single-Parent Households in Brillion
According to the poverty data in Brillion, 64.7% or 108 single-father households and 8.3% or 8 single-mother households are living below the poverty line. Among single-father households, those with 1 or 2 children have the highest poverty rate, with 108 households (75.5%) experiencing poverty. Likewise, among single-mother households, those with 1 or 2 children have the highest poverty rate, with 8 households (42.1%) falling below the poverty line.
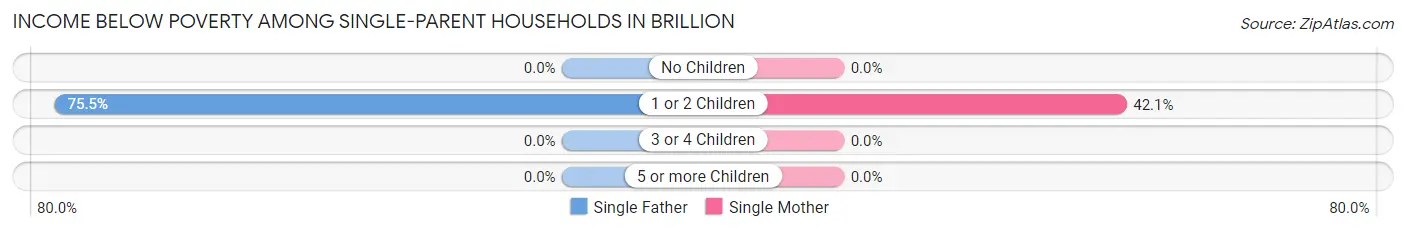
| Children | Single Father | Single Mother |
| No Children | 0 (0.0%) | 0 (0.0%) |
| 1 or 2 Children | 108 (75.5%) | 8 (42.1%) |
| 3 or 4 Children | 0 (0.0%) | 0 (0.0%) |
| 5 or more Children | 0 (0.0%) | 0 (0.0%) |
| Total | 108 (64.7%) | 8 (8.3%) |
Income Below Poverty Among Married-Couple vs Single-Parent Households in Brillion
The poverty data for Brillion shows that 16 of the married-couple family households (2.2%) and 116 of the single-parent households (44.1%) are living below the poverty level. Within the married-couple family households, those with no children have the highest poverty rate, with 16 households (4.2%) falling below the poverty line. Among the single-parent households, those with 1 or 2 children have the highest poverty rate, with 116 household (71.6%) living below poverty.
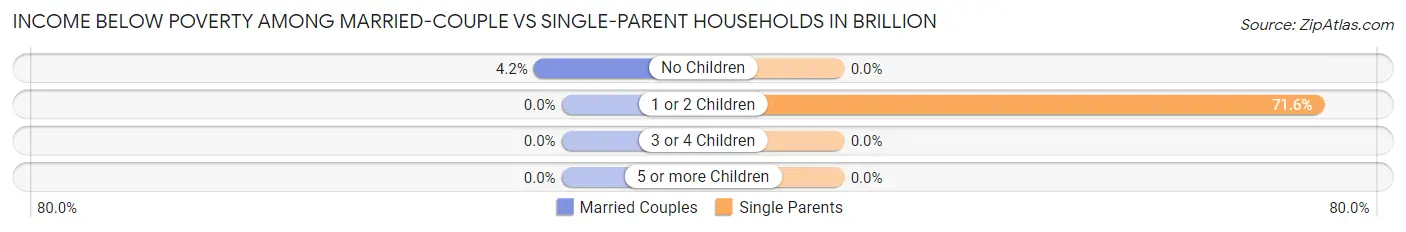
| Children | Married-Couple Families | Single-Parent Households |
| No Children | 16 (4.2%) | 0 (0.0%) |
| 1 or 2 Children | 0 (0.0%) | 116 (71.6%) |
| 3 or 4 Children | 0 (0.0%) | 0 (0.0%) |
| 5 or more Children | 0 (0.0%) | 0 (0.0%) |
| Total | 16 (2.2%) | 116 (44.1%) |
Race in Brillion
The most populous races in Brillion are White / Caucasian (3,241 | 98.4%), Hispanic or Latino (36 | 1.1%), and Two or more Races (36 | 1.1%).
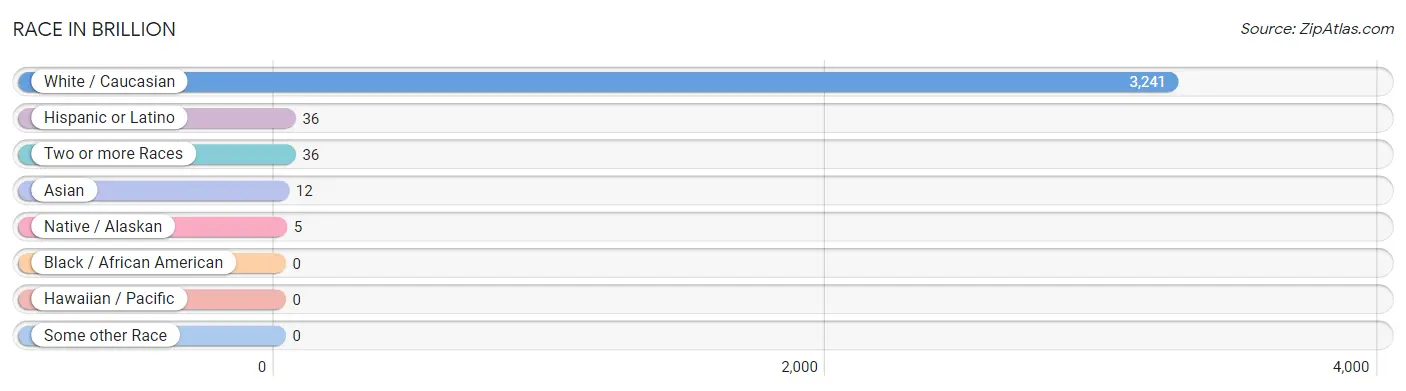
| Race | # Population | % Population |
| Asian | 12 | 0.4% |
| Black / African American | 0 | 0.0% |
| Hawaiian / Pacific | 0 | 0.0% |
| Hispanic or Latino | 36 | 1.1% |
| Native / Alaskan | 5 | 0.2% |
| White / Caucasian | 3,241 | 98.4% |
| Two or more Races | 36 | 1.1% |
| Some other Race | 0 | 0.0% |
| Total | 3,294 | 100.0% |
Ancestry in Brillion
The most populous ancestries reported in Brillion are German (2,106 | 63.9%), French (235 | 7.1%), Irish (227 | 6.9%), Russian (199 | 6.0%), and English (177 | 5.4%), together accounting for 89.4% of all Brillion residents.
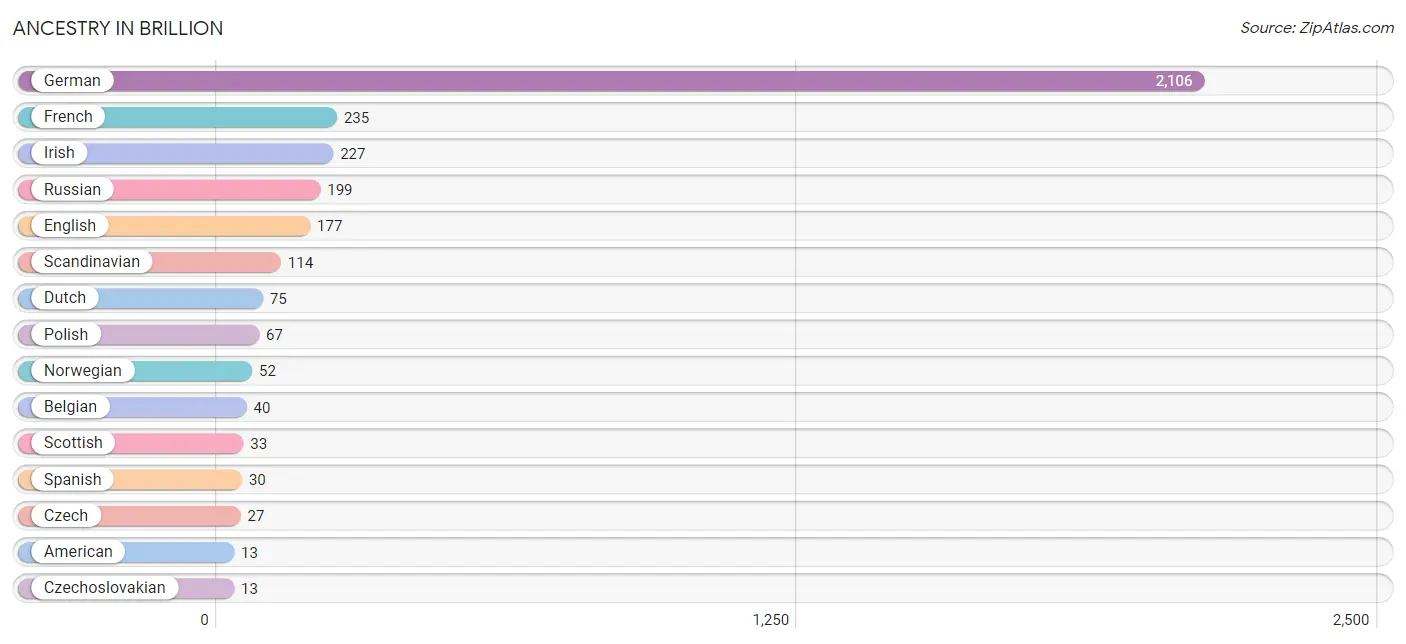
| Ancestry | # Population | % Population |
| American | 13 | 0.4% |
| Belgian | 40 | 1.2% |
| Cherokee | 5 | 0.2% |
| Czech | 27 | 0.8% |
| Czechoslovakian | 13 | 0.4% |
| Danish | 7 | 0.2% |
| Dutch | 75 | 2.3% |
| English | 177 | 5.4% |
| French | 235 | 7.1% |
| French Canadian | 13 | 0.4% |
| German | 2,106 | 63.9% |
| Irish | 227 | 6.9% |
| Italian | 12 | 0.4% |
| Norwegian | 52 | 1.6% |
| Polish | 67 | 2.0% |
| Portuguese | 6 | 0.2% |
| Puerto Rican | 6 | 0.2% |
| Russian | 199 | 6.0% |
| Scandinavian | 114 | 3.5% |
| Scottish | 33 | 1.0% |
| Spanish | 30 | 0.9% |
| Swedish | 11 | 0.3% |
| Thai | 12 | 0.4% |
| Welsh | 13 | 0.4% | View All 24 Rows |
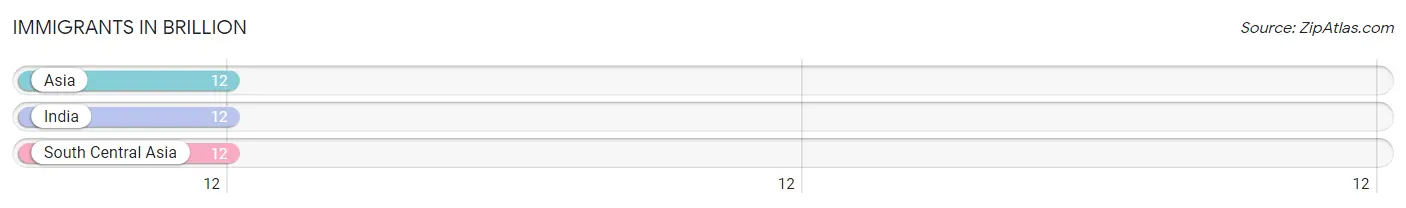
Immigrants in Brillion
The most numerous immigrant groups reported in Brillion came from Asia (12 | 0.4%), India (12 | 0.4%), and South Central Asia (12 | 0.4%), together accounting for 1.1% of all Brillion residents.
| Immigration Origin | # Population | % Population |
| Asia | 12 | 0.4% |
| India | 12 | 0.4% |
| South Central Asia | 12 | 0.4% | View All 3 Rows |
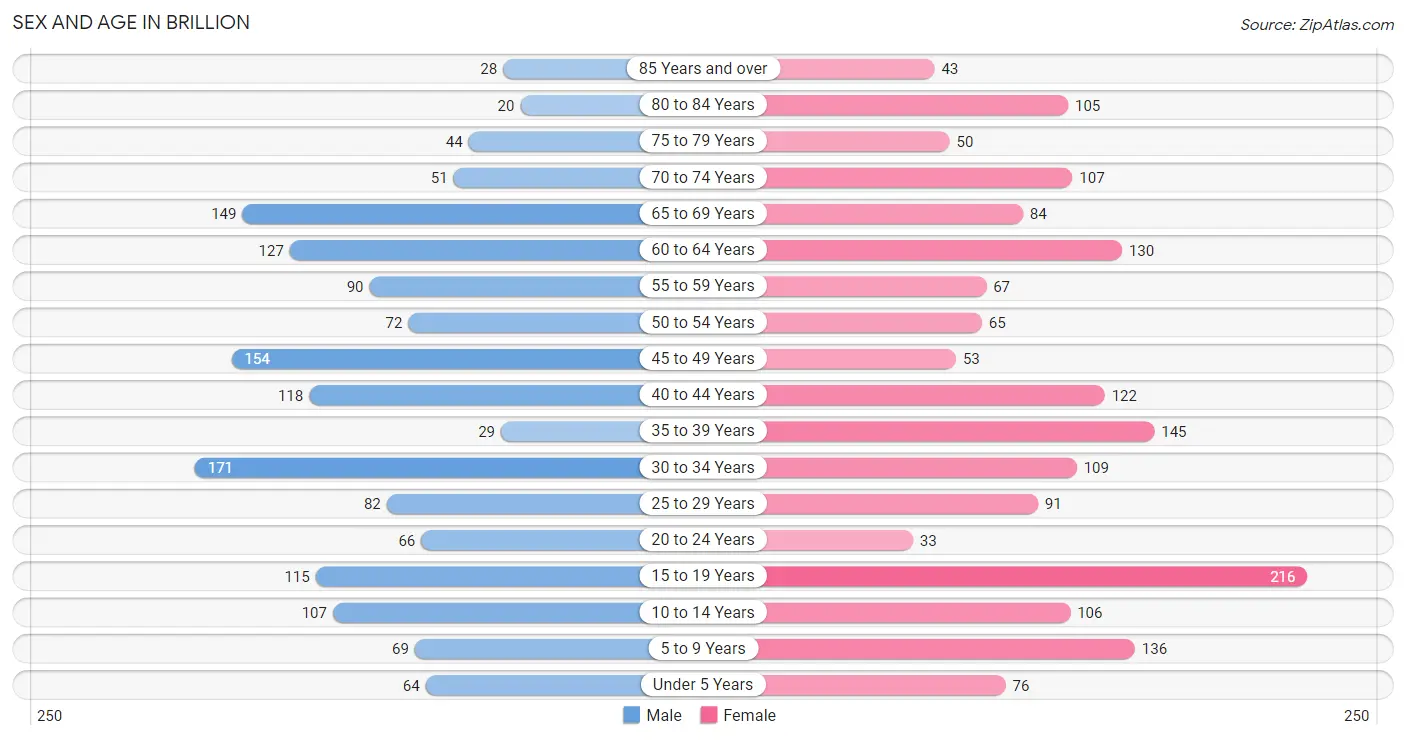
Sex and Age in Brillion
Sex and Age in Brillion
The most populous age groups in Brillion are 30 to 34 Years (171 | 11.0%) for men and 15 to 19 Years (216 | 12.4%) for women.
| Age Bracket | Male | Female |
| Under 5 Years | 64 (4.1%) | 76 (4.4%) |
| 5 to 9 Years | 69 (4.4%) | 136 (7.8%) |
| 10 to 14 Years | 107 (6.9%) | 106 (6.1%) |
| 15 to 19 Years | 115 (7.4%) | 216 (12.4%) |
| 20 to 24 Years | 66 (4.2%) | 33 (1.9%) |
| 25 to 29 Years | 82 (5.3%) | 91 (5.2%) |
| 30 to 34 Years | 171 (11.0%) | 109 (6.3%) |
| 35 to 39 Years | 29 (1.9%) | 145 (8.3%) |
| 40 to 44 Years | 118 (7.6%) | 122 (7.0%) |
| 45 to 49 Years | 154 (9.9%) | 53 (3.0%) |
| 50 to 54 Years | 72 (4.6%) | 65 (3.7%) |
| 55 to 59 Years | 90 (5.8%) | 67 (3.9%) |
| 60 to 64 Years | 127 (8.2%) | 130 (7.5%) |
| 65 to 69 Years | 149 (9.6%) | 84 (4.8%) |
| 70 to 74 Years | 51 (3.3%) | 107 (6.2%) |
| 75 to 79 Years | 44 (2.8%) | 50 (2.9%) |
| 80 to 84 Years | 20 (1.3%) | 105 (6.0%) |
| 85 Years and over | 28 (1.8%) | 43 (2.5%) |
| Total | 1,556 (100.0%) | 1,738 (100.0%) |
Families and Households in Brillion
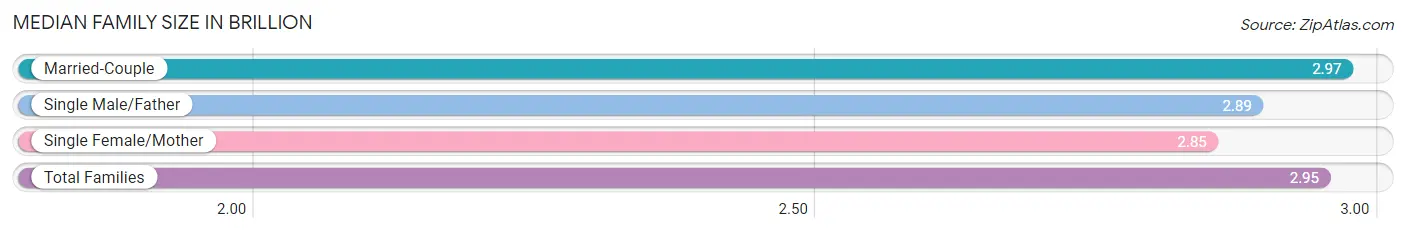
Median Family Size in Brillion
The median family size in Brillion is 2.95 persons per family, with married-couple families (719 | 73.2%) accounting for the largest median family size of 2.97 persons per family. On the other hand, single female/mother families (96 | 9.8%) represent the smallest median family size with 2.85 persons per family.
| Family Type | # Families | Family Size |
| Married-Couple | 719 (73.2%) | 2.97 |
| Single Male/Father | 167 (17.0%) | 2.89 |
| Single Female/Mother | 96 (9.8%) | 2.85 |
| Total Families | 982 (100.0%) | 2.95 |
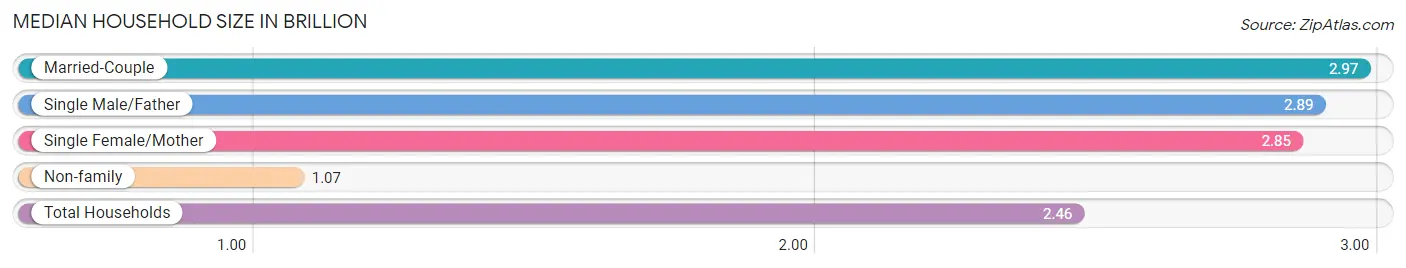
Median Household Size in Brillion
The median household size in Brillion is 2.46 persons per household, with married-couple households (719 | 53.9%) accounting for the largest median household size of 2.97 persons per household. non-family households (351 | 26.3%) represent the smallest median household size with 1.07 persons per household.
| Household Type | # Households | Household Size |
| Married-Couple | 719 (53.9%) | 2.97 |
| Single Male/Father | 167 (12.5%) | 2.89 |
| Single Female/Mother | 96 (7.2%) | 2.85 |
| Non-family | 351 (26.3%) | 1.07 |
| Total Households | 1,333 (100.0%) | 2.46 |
Household Size by Marriage Status in Brillion
Out of a total of 1,333 households in Brillion, 982 (73.7%) are family households, while 351 (26.3%) are nonfamily households. The most numerous type of family households are 2-person households, comprising 391, and the most common type of nonfamily households are 1-person households, comprising 334.
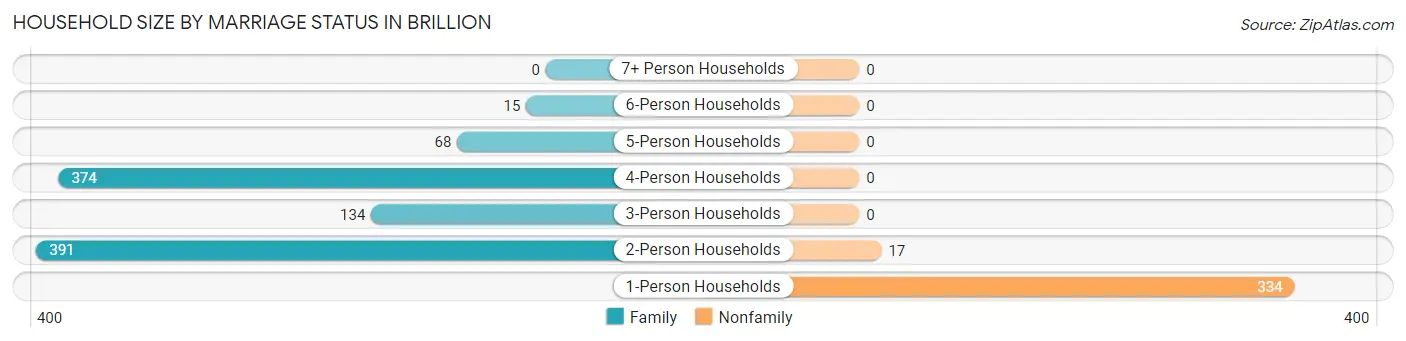
| Household Size | Family Households | Nonfamily Households |
| 1-Person Households | - | 334 (25.1%) |
| 2-Person Households | 391 (29.3%) | 17 (1.3%) |
| 3-Person Households | 134 (10.1%) | 0 (0.0%) |
| 4-Person Households | 374 (28.1%) | 0 (0.0%) |
| 5-Person Households | 68 (5.1%) | 0 (0.0%) |
| 6-Person Households | 15 (1.1%) | 0 (0.0%) |
| 7+ Person Households | 0 (0.0%) | 0 (0.0%) |
| Total | 982 (73.7%) | 351 (26.3%) |
Female Fertility in Brillion
Fertility by Age in Brillion
Average fertility rate in Brillion is 48.0 births per 1,000 women. Women in the age bracket of 20 to 34 years have the highest fertility rate with 159.0 births per 1,000 women. Women in the age bracket of 20 to 34 years acount for 100.0% of all women with births.
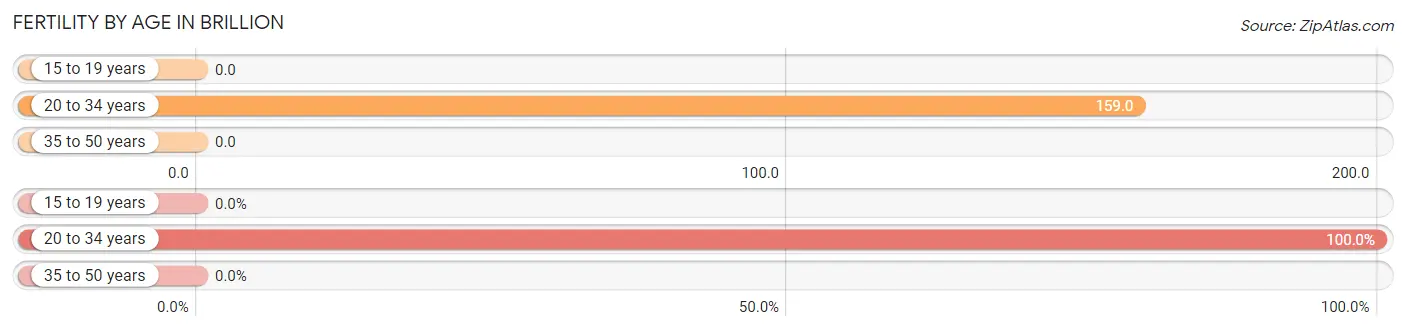
| Age Bracket | Women with Births | Births / 1,000 Women |
| 15 to 19 years | 0 (0.0%) | 0.0 |
| 20 to 34 years | 37 (100.0%) | 159.0 |
| 35 to 50 years | 0 (0.0%) | 0.0 |
| Total | 37 (100.0%) | 48.0 |
Fertility by Age by Marriage Status in Brillion
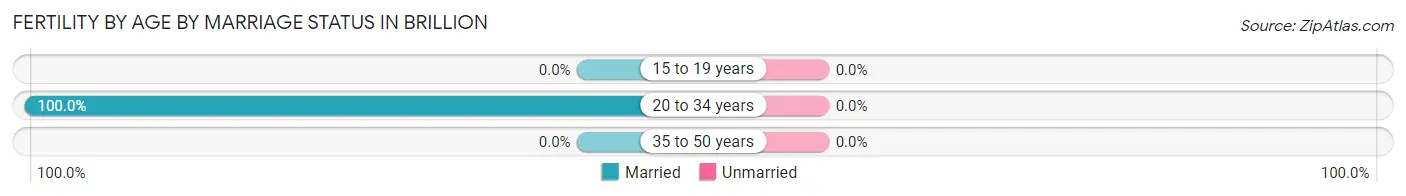
| Age Bracket | Married | Unmarried |
| 15 to 19 years | 0 (0.0%) | 0 (0.0%) |
| 20 to 34 years | 37 (100.0%) | 0 (0.0%) |
| 35 to 50 years | 0 (0.0%) | 0 (0.0%) |
| Total | 37 (100.0%) | 0 (0.0%) |
Fertility by Education in Brillion
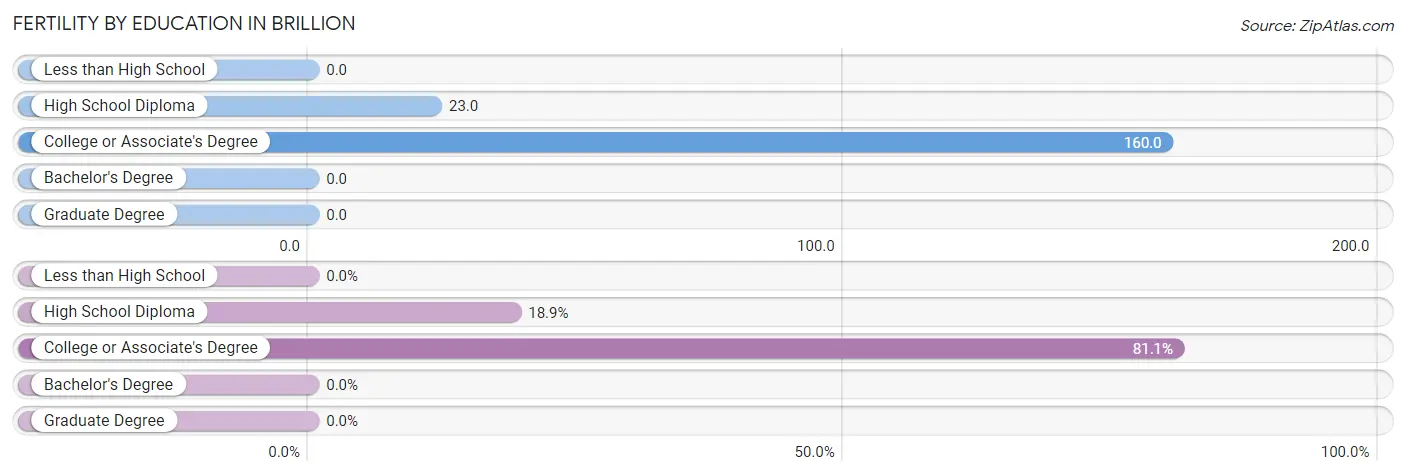
| Educational Attainment | Women with Births | Births / 1,000 Women |
| Less than High School | 0 (0.0%) | 0.0 |
| High School Diploma | 7 (18.9%) | 23.0 |
| College or Associate's Degree | 30 (81.1%) | 160.0 |
| Bachelor's Degree | 0 (0.0%) | 0.0 |
| Graduate Degree | 0 (0.0%) | 0.0 |
| Total | 37 (100.0%) | 48.0 |
Fertility by Education by Marriage Status in Brillion
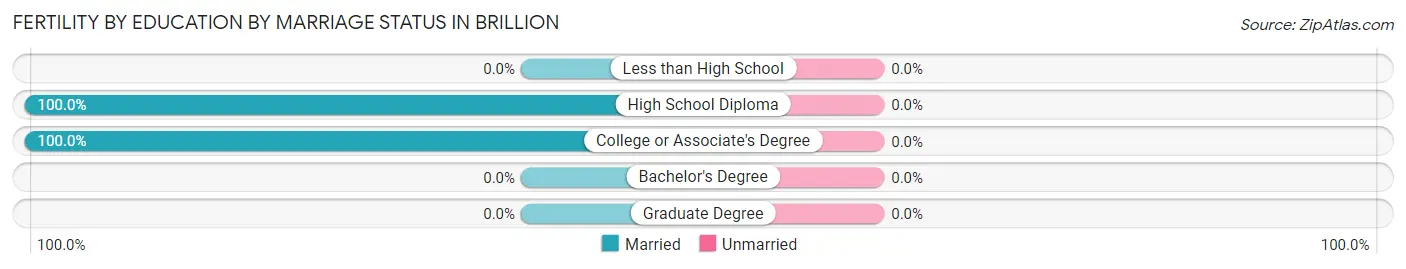
| Educational Attainment | Married | Unmarried |
| Less than High School | 0 (0.0%) | 0 (0.0%) |
| High School Diploma | 7 (100.0%) | 0 (0.0%) |
| College or Associate's Degree | 30 (100.0%) | 0 (0.0%) |
| Bachelor's Degree | 0 (0.0%) | 0 (0.0%) |
| Graduate Degree | 0 (0.0%) | 0 (0.0%) |
| Total | 37 (100.0%) | 0 (0.0%) |
Employment Characteristics in Brillion
Employment by Class of Employer in Brillion
Among the 1,591 employed individuals in Brillion, private company employees (1,319 | 82.9%), local government employees (106 | 6.7%), and not-for-profit organizations (68 | 4.3%) make up the most common classes of employment.
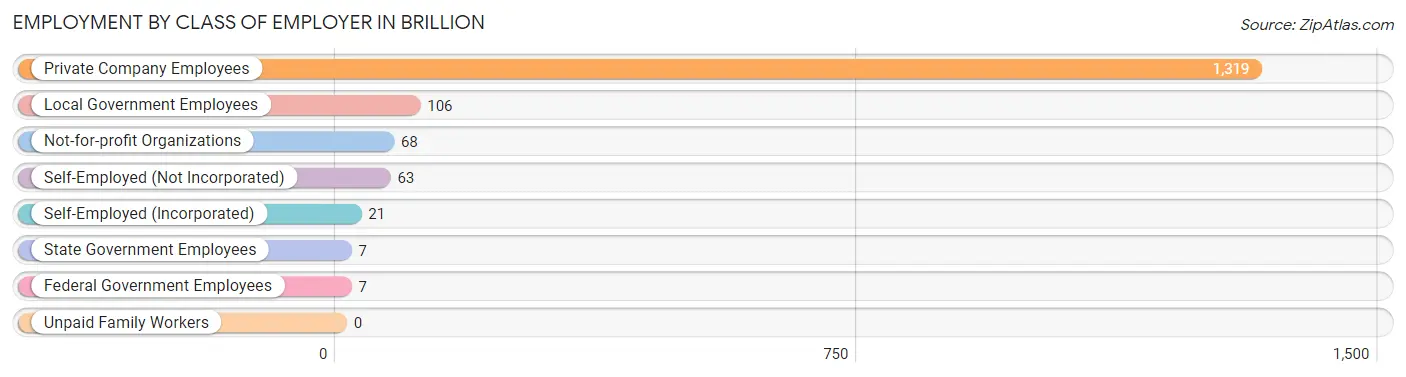
| Employer Class | # Employees | % Employees |
| Private Company Employees | 1,319 | 82.9% |
| Self-Employed (Incorporated) | 21 | 1.3% |
| Self-Employed (Not Incorporated) | 63 | 4.0% |
| Not-for-profit Organizations | 68 | 4.3% |
| Local Government Employees | 106 | 6.7% |
| State Government Employees | 7 | 0.4% |
| Federal Government Employees | 7 | 0.4% |
| Unpaid Family Workers | 0 | 0.0% |
| Total | 1,591 | 100.0% |
Employment Status by Age in Brillion
According to the labor force statistics for Brillion, out of the total population over 16 years of age (2,682), 60.2% or 1,615 individuals are in the labor force, with 1.5% or 24 of them unemployed. The age group with the highest labor force participation rate is 20 to 24 years, with 100.0% or 99 individuals in the labor force. Within the labor force, the 16 to 19 years age range has the highest percentage of unemployed individuals, with 8.8% or 24 of them being unemployed.
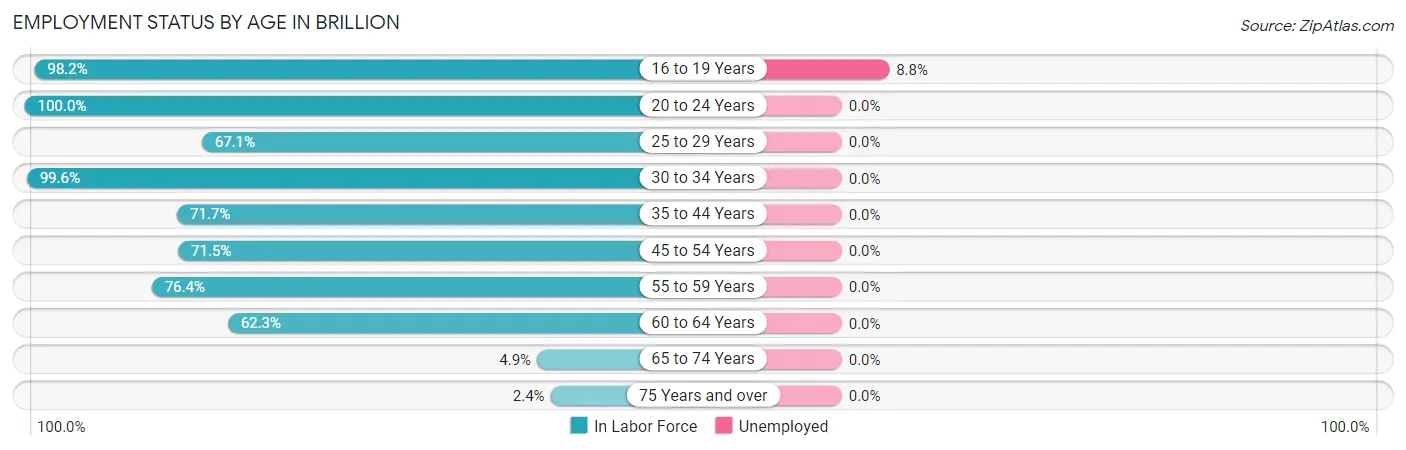
| Age Bracket | In Labor Force | Unemployed |
| 16 to 19 Years | 272 (98.2%) | 24 (8.8%) |
| 20 to 24 Years | 99 (100.0%) | 0 (0.0%) |
| 25 to 29 Years | 116 (67.1%) | 0 (0.0%) |
| 30 to 34 Years | 279 (99.6%) | 0 (0.0%) |
| 35 to 44 Years | 297 (71.7%) | 0 (0.0%) |
| 45 to 54 Years | 246 (71.5%) | 0 (0.0%) |
| 55 to 59 Years | 120 (76.4%) | 0 (0.0%) |
| 60 to 64 Years | 160 (62.3%) | 0 (0.0%) |
| 65 to 74 Years | 19 (4.9%) | 0 (0.0%) |
| 75 Years and over | 7 (2.4%) | 0 (0.0%) |
| Total | 1,615 (60.2%) | 24 (1.5%) |
Employment Status by Educational Attainment in Brillion
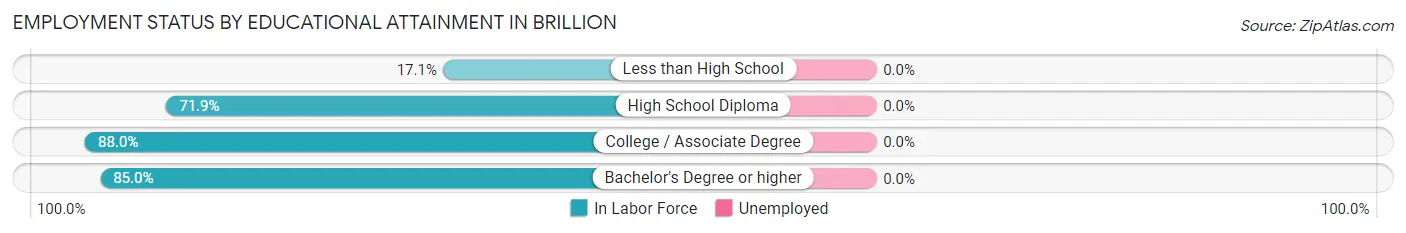
| Educational Attainment | In Labor Force | Unemployed |
| Less than High School | 25 (17.1%) | 0 (0.0%) |
| High School Diploma | 430 (71.9%) | 0 (0.0%) |
| College / Associate Degree | 412 (88.0%) | 0 (0.0%) |
| Bachelor's Degree or higher | 351 (85.0%) | 0 (0.0%) |
| Total | 1,219 (75.0%) | 0 (0.0%) |
Employment Occupations by Sex in Brillion
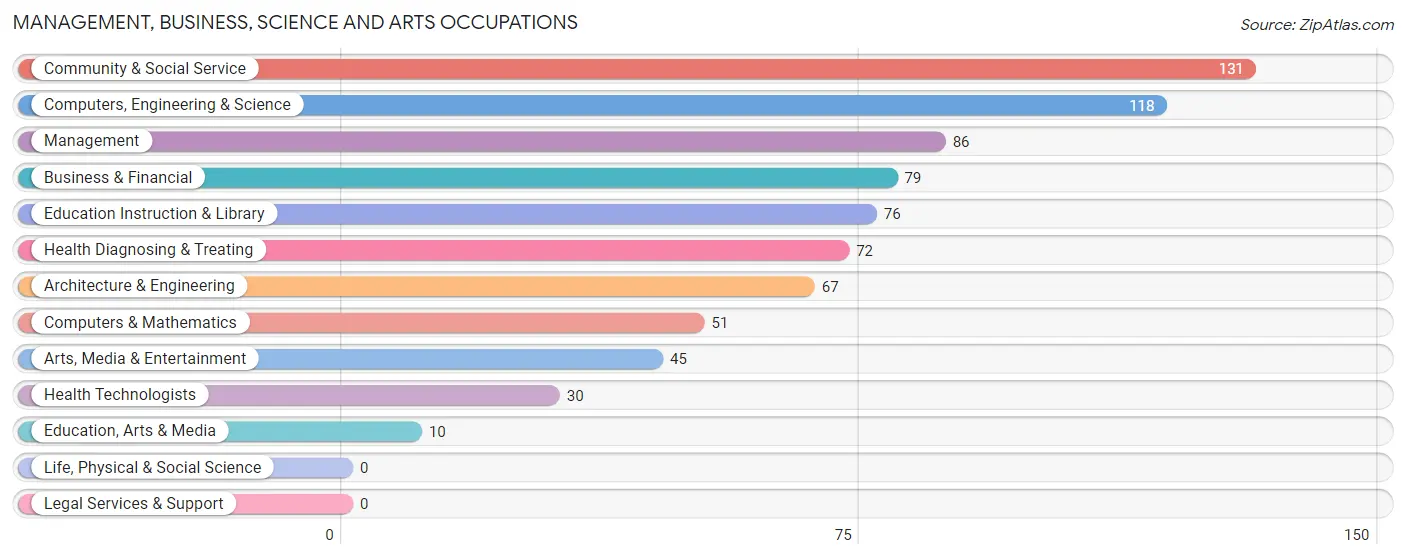
Management, Business, Science and Arts Occupations
The most common Management, Business, Science and Arts occupations in Brillion are Community & Social Service (131 | 8.2%), Computers, Engineering & Science (118 | 7.4%), Management (86 | 5.4%), Business & Financial (79 | 5.0%), and Education Instruction & Library (76 | 4.8%).
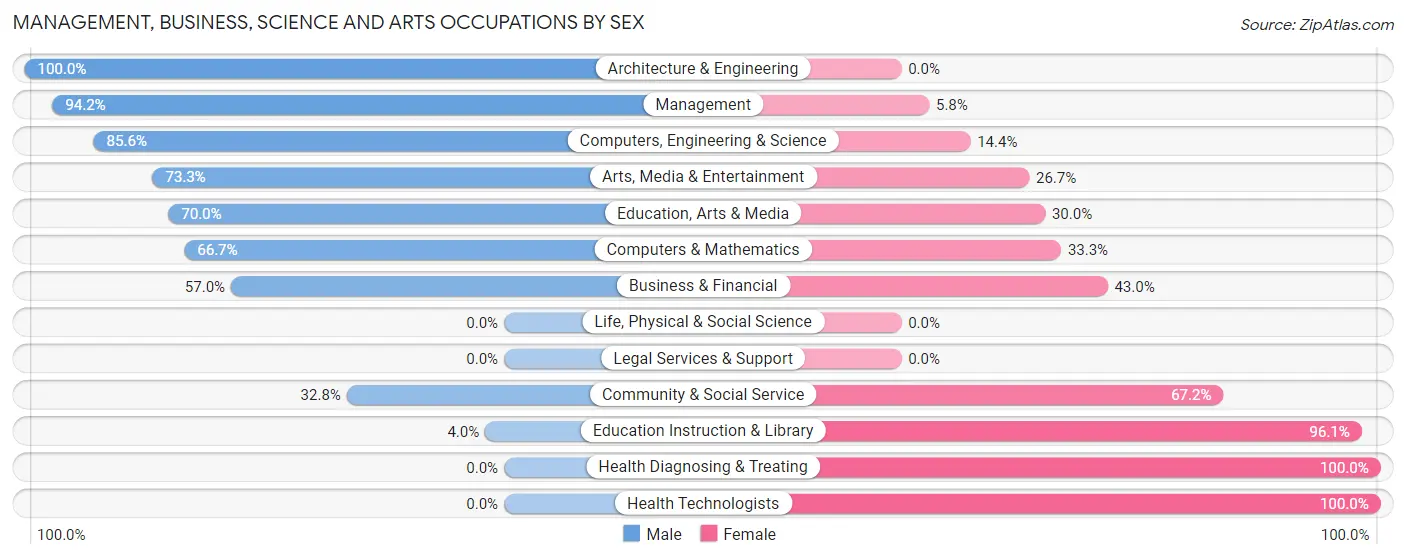
Management, Business, Science and Arts Occupations by Sex
Within the Management, Business, Science and Arts occupations in Brillion, the most male-oriented occupations are Architecture & Engineering (100.0%), Management (94.2%), and Computers, Engineering & Science (85.6%), while the most female-oriented occupations are Health Diagnosing & Treating (100.0%), Health Technologists (100.0%), and Education Instruction & Library (96.1%).
| Occupation | Male | Female |
| Management | 81 (94.2%) | 5 (5.8%) |
| Business & Financial | 45 (57.0%) | 34 (43.0%) |
| Computers, Engineering & Science | 101 (85.6%) | 17 (14.4%) |
| Computers & Mathematics | 34 (66.7%) | 17 (33.3%) |
| Architecture & Engineering | 67 (100.0%) | 0 (0.0%) |
| Life, Physical & Social Science | 0 (0.0%) | 0 (0.0%) |
| Community & Social Service | 43 (32.8%) | 88 (67.2%) |
| Education, Arts & Media | 7 (70.0%) | 3 (30.0%) |
| Legal Services & Support | 0 (0.0%) | 0 (0.0%) |
| Education Instruction & Library | 3 (4.0%) | 73 (96.1%) |
| Arts, Media & Entertainment | 33 (73.3%) | 12 (26.7%) |
| Health Diagnosing & Treating | 0 (0.0%) | 72 (100.0%) |
| Health Technologists | 0 (0.0%) | 30 (100.0%) |
| Total (Category) | 270 (55.6%) | 216 (44.4%) |
| Total (Overall) | 793 (49.8%) | 798 (50.2%) |
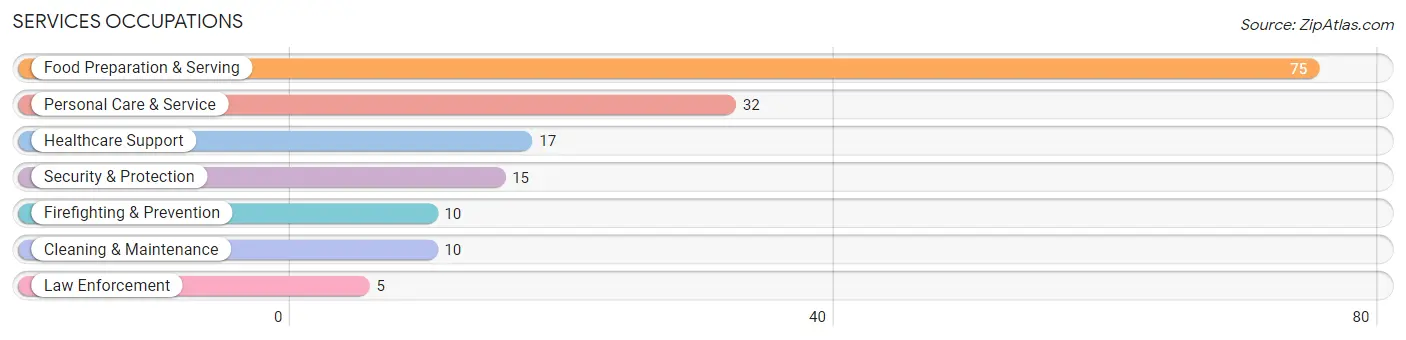
Services Occupations
The most common Services occupations in Brillion are Food Preparation & Serving (75 | 4.7%), Personal Care & Service (32 | 2.0%), Healthcare Support (17 | 1.1%), Security & Protection (15 | 0.9%), and Firefighting & Prevention (10 | 0.6%).
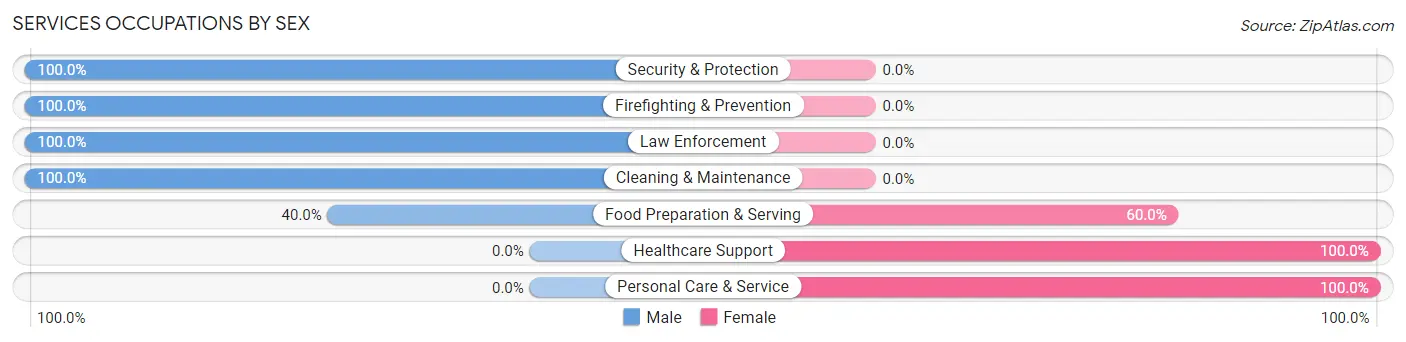
Services Occupations by Sex
Within the Services occupations in Brillion, the most male-oriented occupations are Security & Protection (100.0%), Firefighting & Prevention (100.0%), and Law Enforcement (100.0%), while the most female-oriented occupations are Healthcare Support (100.0%), Personal Care & Service (100.0%), and Food Preparation & Serving (60.0%).
| Occupation | Male | Female |
| Healthcare Support | 0 (0.0%) | 17 (100.0%) |
| Security & Protection | 15 (100.0%) | 0 (0.0%) |
| Firefighting & Prevention | 10 (100.0%) | 0 (0.0%) |
| Law Enforcement | 5 (100.0%) | 0 (0.0%) |
| Food Preparation & Serving | 30 (40.0%) | 45 (60.0%) |
| Cleaning & Maintenance | 10 (100.0%) | 0 (0.0%) |
| Personal Care & Service | 0 (0.0%) | 32 (100.0%) |
| Total (Category) | 55 (36.9%) | 94 (63.1%) |
| Total (Overall) | 793 (49.8%) | 798 (50.2%) |
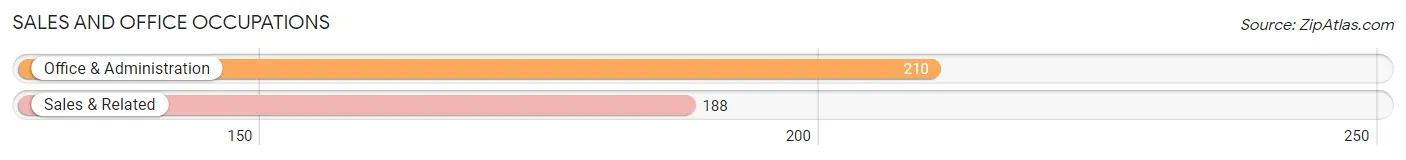
Sales and Office Occupations
The most common Sales and Office occupations in Brillion are Office & Administration (210 | 13.2%), and Sales & Related (188 | 11.8%).
Sales and Office Occupations by Sex
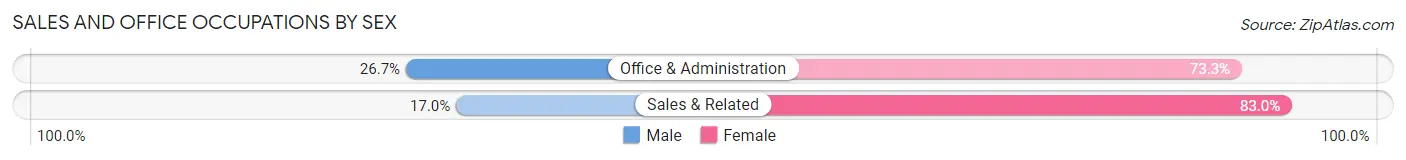
| Occupation | Male | Female |
| Sales & Related | 32 (17.0%) | 156 (83.0%) |
| Office & Administration | 56 (26.7%) | 154 (73.3%) |
| Total (Category) | 88 (22.1%) | 310 (77.9%) |
| Total (Overall) | 793 (49.8%) | 798 (50.2%) |
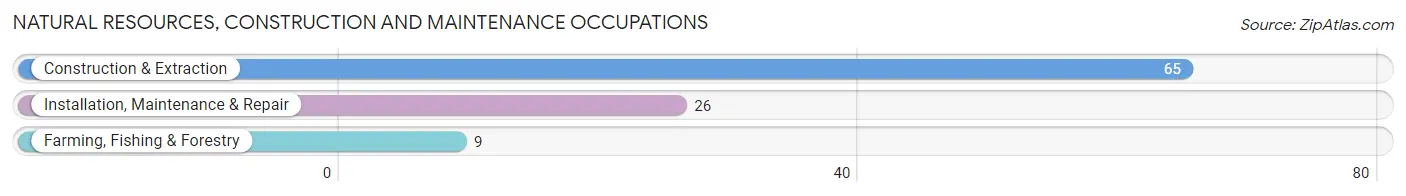
Natural Resources, Construction and Maintenance Occupations
The most common Natural Resources, Construction and Maintenance occupations in Brillion are Construction & Extraction (65 | 4.1%), Installation, Maintenance & Repair (26 | 1.6%), and Farming, Fishing & Forestry (9 | 0.6%).
Natural Resources, Construction and Maintenance Occupations by Sex
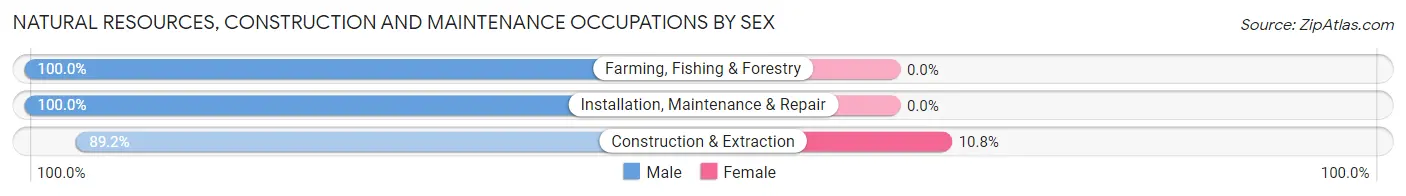
| Occupation | Male | Female |
| Farming, Fishing & Forestry | 9 (100.0%) | 0 (0.0%) |
| Construction & Extraction | 58 (89.2%) | 7 (10.8%) |
| Installation, Maintenance & Repair | 26 (100.0%) | 0 (0.0%) |
| Total (Category) | 93 (93.0%) | 7 (7.0%) |
| Total (Overall) | 793 (49.8%) | 798 (50.2%) |
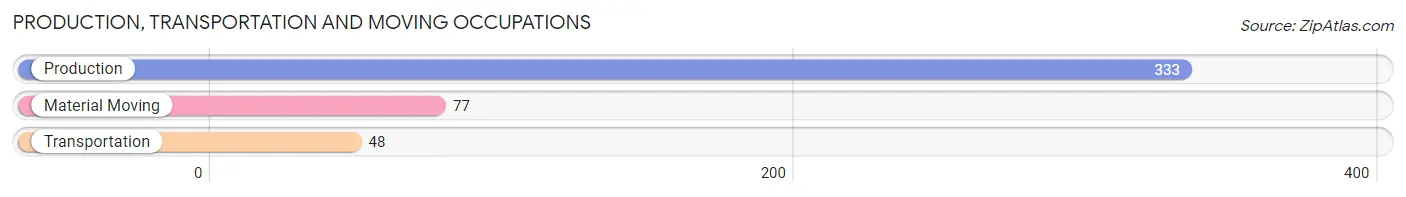
Production, Transportation and Moving Occupations
The most common Production, Transportation and Moving occupations in Brillion are Production (333 | 20.9%), Material Moving (77 | 4.8%), and Transportation (48 | 3.0%).
Production, Transportation and Moving Occupations by Sex
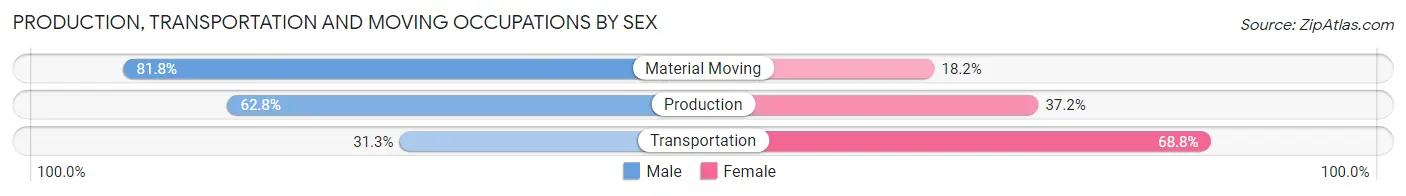
| Occupation | Male | Female |
| Production | 209 (62.8%) | 124 (37.2%) |
| Transportation | 15 (31.2%) | 33 (68.8%) |
| Material Moving | 63 (81.8%) | 14 (18.2%) |
| Total (Category) | 287 (62.7%) | 171 (37.3%) |
| Total (Overall) | 793 (49.8%) | 798 (50.2%) |
Employment Industries by Sex in Brillion
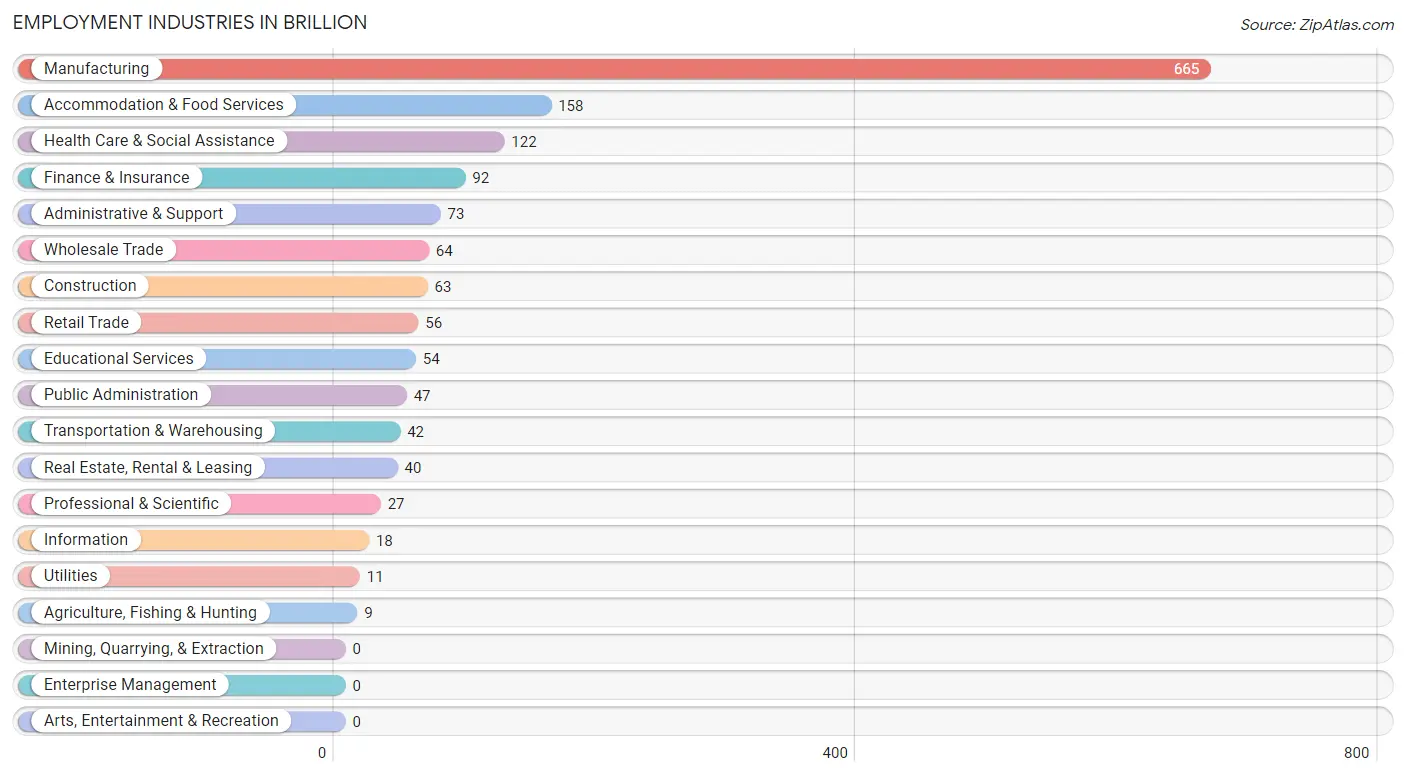
Employment Industries in Brillion
The major employment industries in Brillion include Manufacturing (665 | 41.8%), Accommodation & Food Services (158 | 9.9%), Health Care & Social Assistance (122 | 7.7%), Finance & Insurance (92 | 5.8%), and Administrative & Support (73 | 4.6%).
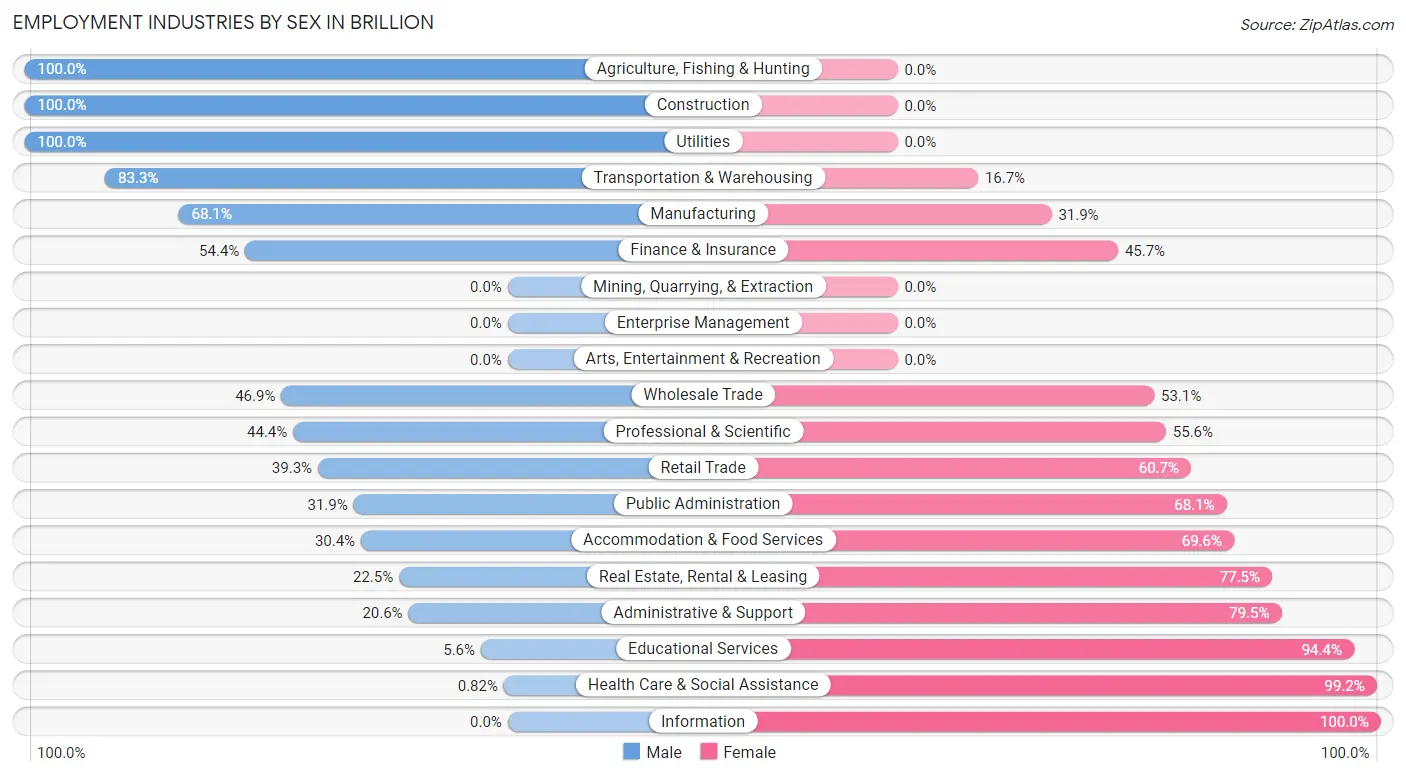
Employment Industries by Sex in Brillion
The Brillion industries that see more men than women are Agriculture, Fishing & Hunting (100.0%), Construction (100.0%), and Utilities (100.0%), whereas the industries that tend to have a higher number of women are Information (100.0%), Health Care & Social Assistance (99.2%), and Educational Services (94.4%).
| Industry | Male | Female |
| Agriculture, Fishing & Hunting | 9 (100.0%) | 0 (0.0%) |
| Mining, Quarrying, & Extraction | 0 (0.0%) | 0 (0.0%) |
| Construction | 63 (100.0%) | 0 (0.0%) |
| Manufacturing | 453 (68.1%) | 212 (31.9%) |
| Wholesale Trade | 30 (46.9%) | 34 (53.1%) |
| Retail Trade | 22 (39.3%) | 34 (60.7%) |
| Transportation & Warehousing | 35 (83.3%) | 7 (16.7%) |
| Utilities | 11 (100.0%) | 0 (0.0%) |
| Information | 0 (0.0%) | 18 (100.0%) |
| Finance & Insurance | 50 (54.3%) | 42 (45.7%) |
| Real Estate, Rental & Leasing | 9 (22.5%) | 31 (77.5%) |
| Professional & Scientific | 12 (44.4%) | 15 (55.6%) |
| Enterprise Management | 0 (0.0%) | 0 (0.0%) |
| Administrative & Support | 15 (20.5%) | 58 (79.4%) |
| Educational Services | 3 (5.6%) | 51 (94.4%) |
| Health Care & Social Assistance | 1 (0.8%) | 121 (99.2%) |
| Arts, Entertainment & Recreation | 0 (0.0%) | 0 (0.0%) |
| Accommodation & Food Services | 48 (30.4%) | 110 (69.6%) |
| Public Administration | 15 (31.9%) | 32 (68.1%) |
| Total | 793 (49.8%) | 798 (50.2%) |
Education in Brillion
School Enrollment in Brillion
The most common levels of schooling among the 766 students in Brillion are high school (250 | 32.6%), elementary school (207 | 27.0%), and college / undergraduate (131 | 17.1%).
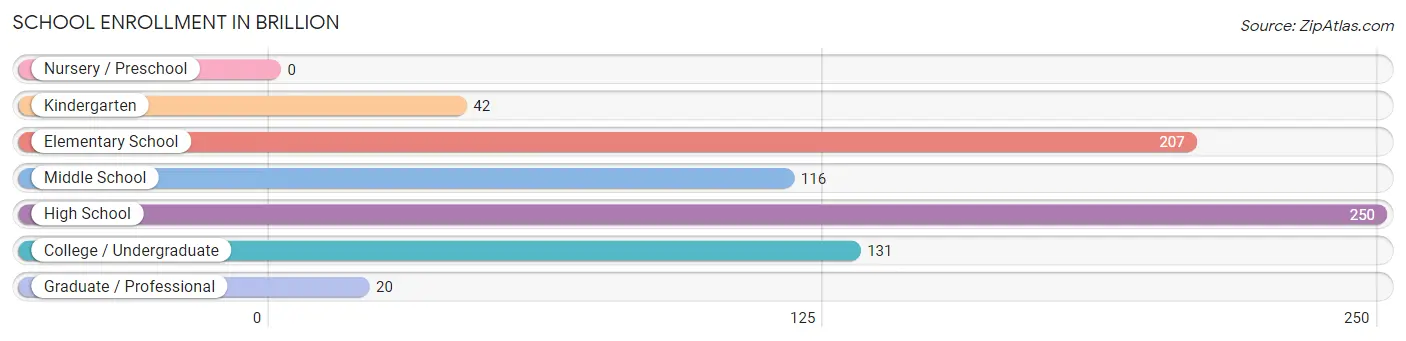
| School Level | # Students | % Students |
| Nursery / Preschool | 0 | 0.0% |
| Kindergarten | 42 | 5.5% |
| Elementary School | 207 | 27.0% |
| Middle School | 116 | 15.1% |
| High School | 250 | 32.6% |
| College / Undergraduate | 131 | 17.1% |
| Graduate / Professional | 20 | 2.6% |
| Total | 766 | 100.0% |
School Enrollment by Age by Funding Source in Brillion
Out of a total of 766 students who are enrolled in schools in Brillion, 89 (11.6%) attend a private institution, while the remaining 677 (88.4%) are enrolled in public schools. The age group of 20 to 24 year olds has the highest likelihood of being enrolled in private schools, with 15 (33.3% in the age bracket) enrolled. Conversely, the age group of 25 to 34 year olds has the lowest likelihood of being enrolled in a private school, with 28 (100.0% in the age bracket) attending a public institution.
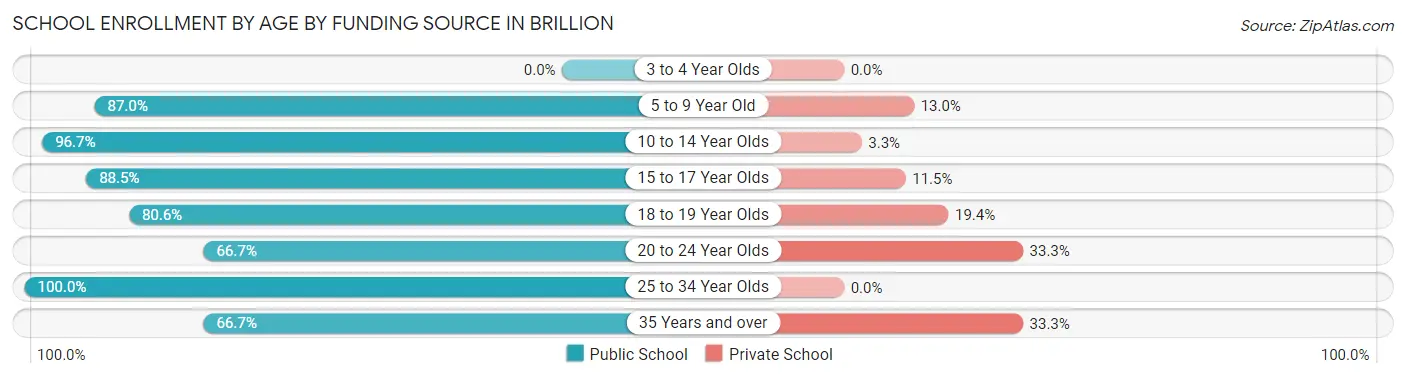
| Age Bracket | Public School | Private School |
| 3 to 4 Year Olds | 0 (0.0%) | 0 (0.0%) |
| 5 to 9 Year Old | 160 (87.0%) | 24 (13.0%) |
| 10 to 14 Year Olds | 206 (96.7%) | 7 (3.3%) |
| 15 to 17 Year Olds | 185 (88.5%) | 24 (11.5%) |
| 18 to 19 Year Olds | 58 (80.6%) | 14 (19.4%) |
| 20 to 24 Year Olds | 30 (66.7%) | 15 (33.3%) |
| 25 to 34 Year Olds | 28 (100.0%) | 0 (0.0%) |
| 35 Years and over | 10 (66.7%) | 5 (33.3%) |
| Total | 677 (88.4%) | 89 (11.6%) |
Educational Attainment by Field of Study in Brillion
Social sciences (98 | 19.9%), business (80 | 16.2%), arts & humanities (74 | 15.0%), education (55 | 11.2%), and liberal arts & history (45 | 9.1%) are the most common fields of study among 493 individuals in Brillion who have obtained a bachelor's degree or higher.
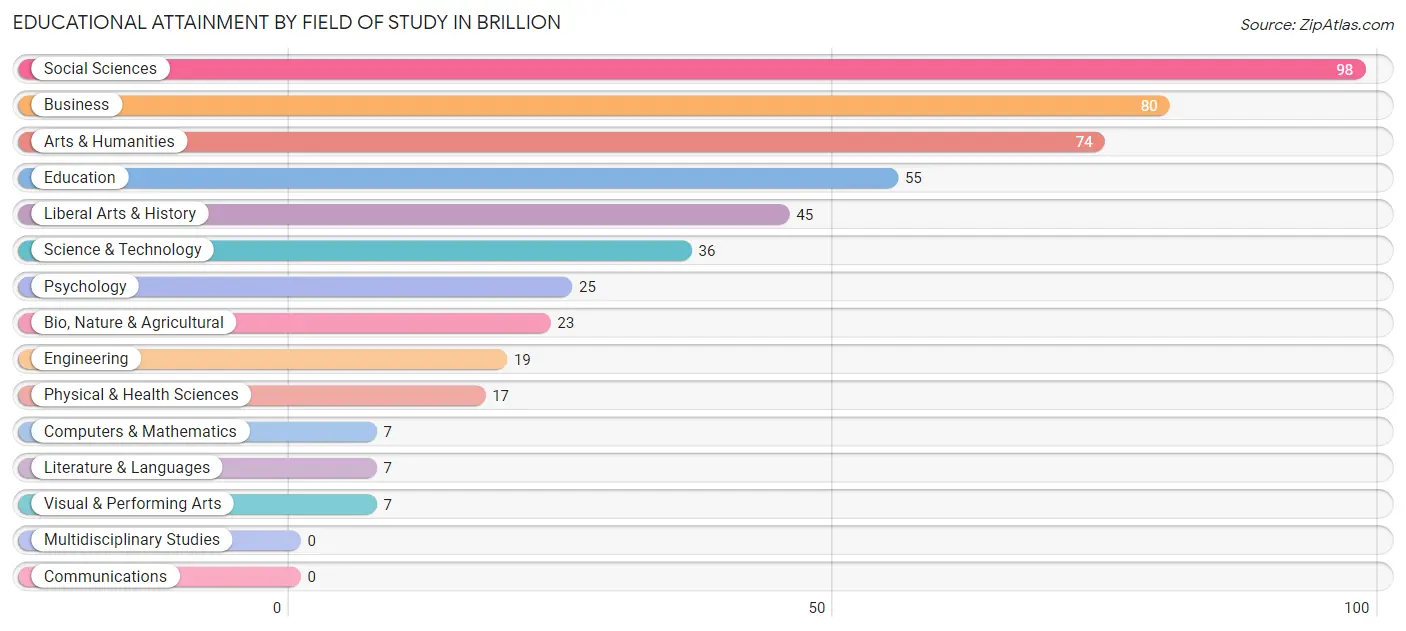
| Field of Study | # Graduates | % Graduates |
| Computers & Mathematics | 7 | 1.4% |
| Bio, Nature & Agricultural | 23 | 4.7% |
| Physical & Health Sciences | 17 | 3.5% |
| Psychology | 25 | 5.1% |
| Social Sciences | 98 | 19.9% |
| Engineering | 19 | 3.8% |
| Multidisciplinary Studies | 0 | 0.0% |
| Science & Technology | 36 | 7.3% |
| Business | 80 | 16.2% |
| Education | 55 | 11.2% |
| Literature & Languages | 7 | 1.4% |
| Liberal Arts & History | 45 | 9.1% |
| Visual & Performing Arts | 7 | 1.4% |
| Communications | 0 | 0.0% |
| Arts & Humanities | 74 | 15.0% |
| Total | 493 | 100.0% |
Transportation & Commute in Brillion
Vehicle Availability by Sex in Brillion
The most prevalent vehicle ownership categories in Brillion are males with 2 vehicles (422, accounting for 53.3%) and females with 2 vehicles (367, making up 52.9%).
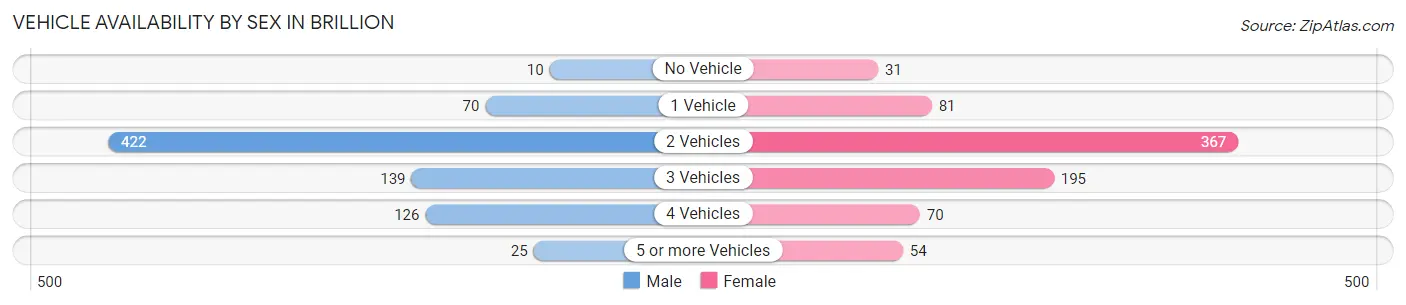
| Vehicles Available | Male | Female |
| No Vehicle | 10 (1.3%) | 31 (3.9%) |
| 1 Vehicle | 70 (8.8%) | 81 (10.2%) |
| 2 Vehicles | 422 (53.3%) | 367 (46.0%) |
| 3 Vehicles | 139 (17.5%) | 195 (24.4%) |
| 4 Vehicles | 126 (15.9%) | 70 (8.8%) |
| 5 or more Vehicles | 25 (3.2%) | 54 (6.8%) |
| Total | 792 (100.0%) | 798 (100.0%) |
Commute Time in Brillion
The most frequently occuring commute durations in Brillion are 5 to 9 minutes (247 commuters, 16.9%), 20 to 24 minutes (227 commuters, 15.5%), and 10 to 14 minutes (201 commuters, 13.8%).
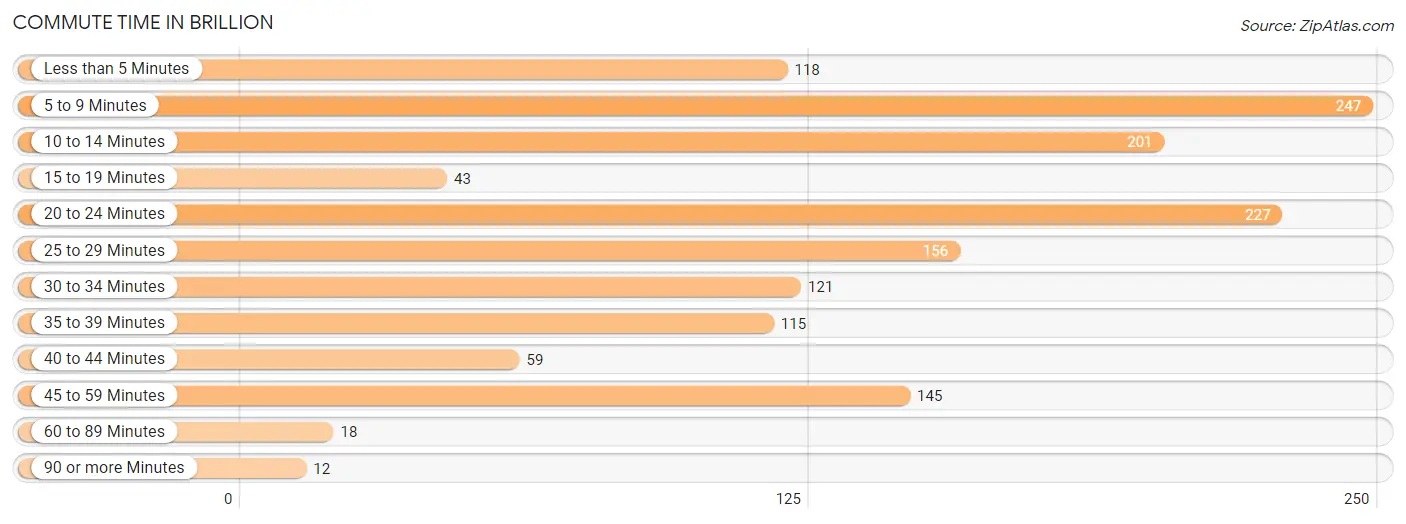
| Commute Time | # Commuters | % Commuters |
| Less than 5 Minutes | 118 | 8.1% |
| 5 to 9 Minutes | 247 | 16.9% |
| 10 to 14 Minutes | 201 | 13.8% |
| 15 to 19 Minutes | 43 | 2.9% |
| 20 to 24 Minutes | 227 | 15.5% |
| 25 to 29 Minutes | 156 | 10.7% |
| 30 to 34 Minutes | 121 | 8.3% |
| 35 to 39 Minutes | 115 | 7.9% |
| 40 to 44 Minutes | 59 | 4.0% |
| 45 to 59 Minutes | 145 | 9.9% |
| 60 to 89 Minutes | 18 | 1.2% |
| 90 or more Minutes | 12 | 0.8% |
Commute Time by Sex in Brillion
The most common commute times in Brillion are 20 to 24 minutes (157 commuters, 20.2%) for males and 5 to 9 minutes (153 commuters, 22.3%) for females.
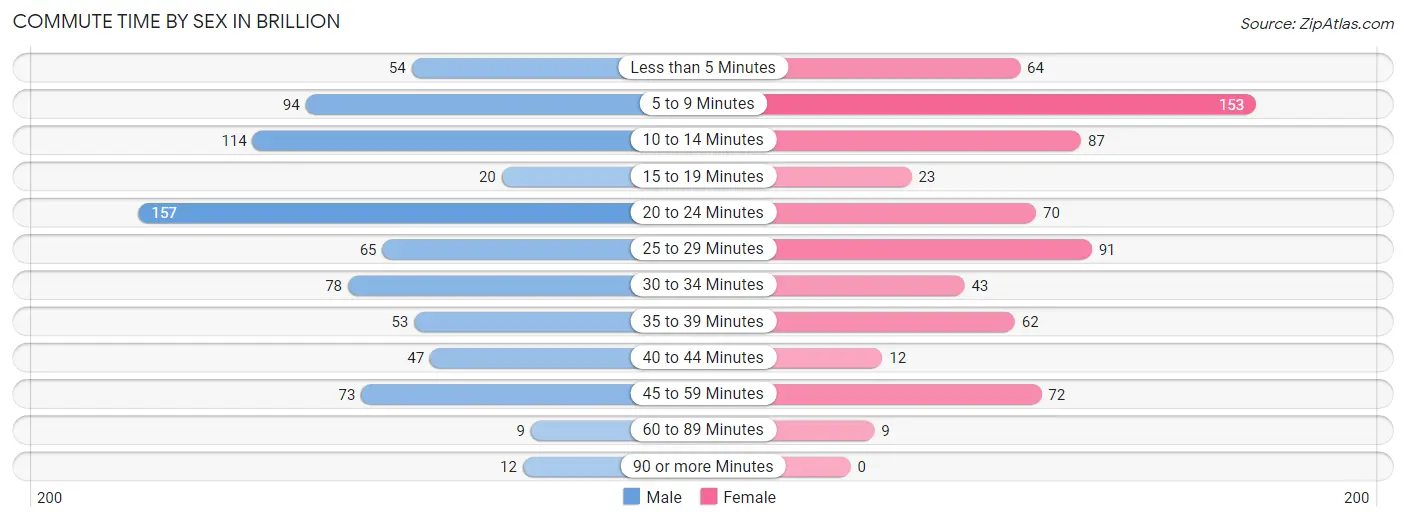
| Commute Time | Male | Female |
| Less than 5 Minutes | 54 (7.0%) | 64 (9.3%) |
| 5 to 9 Minutes | 94 (12.1%) | 153 (22.3%) |
| 10 to 14 Minutes | 114 (14.7%) | 87 (12.7%) |
| 15 to 19 Minutes | 20 (2.6%) | 23 (3.4%) |
| 20 to 24 Minutes | 157 (20.2%) | 70 (10.2%) |
| 25 to 29 Minutes | 65 (8.4%) | 91 (13.3%) |
| 30 to 34 Minutes | 78 (10.1%) | 43 (6.3%) |
| 35 to 39 Minutes | 53 (6.8%) | 62 (9.0%) |
| 40 to 44 Minutes | 47 (6.1%) | 12 (1.8%) |
| 45 to 59 Minutes | 73 (9.4%) | 72 (10.5%) |
| 60 to 89 Minutes | 9 (1.2%) | 9 (1.3%) |
| 90 or more Minutes | 12 (1.5%) | 0 (0.0%) |
Time of Departure to Work by Sex in Brillion
The most frequent times of departure to work in Brillion are 4:00 PM to 11:59 PM (142, 18.3%) for males and 7:00 AM to 7:29 AM (115, 16.8%) for females.
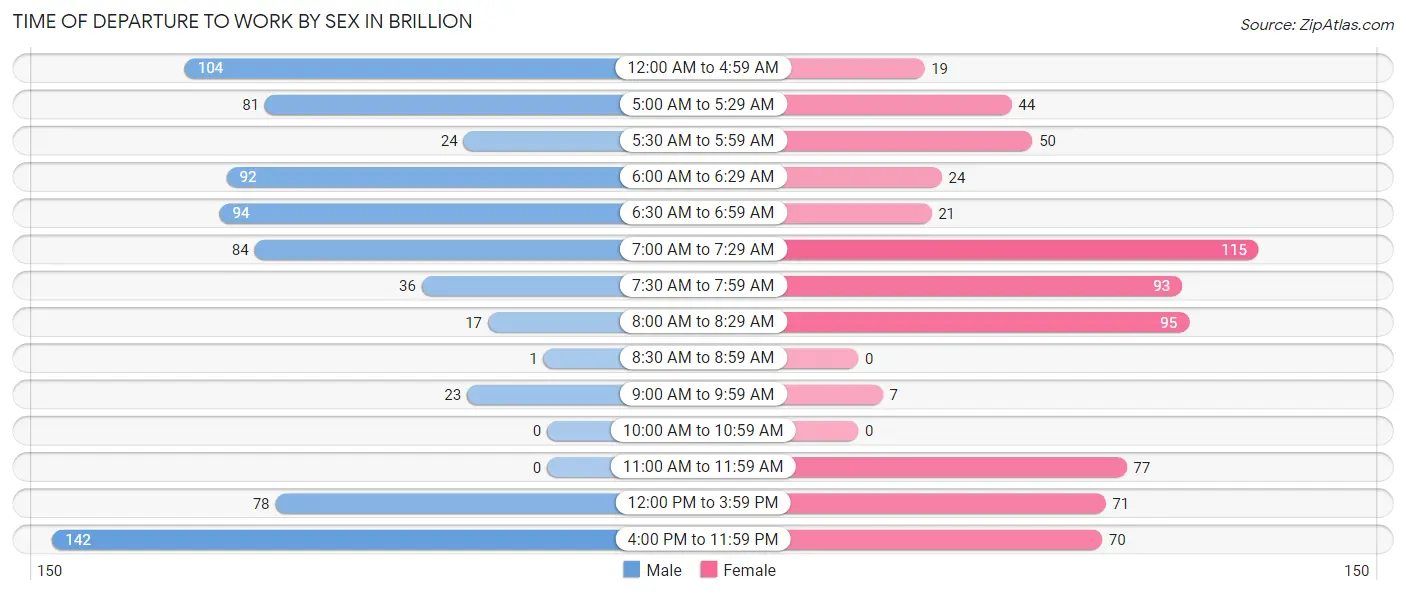
| Time of Departure | Male | Female |
| 12:00 AM to 4:59 AM | 104 (13.4%) | 19 (2.8%) |
| 5:00 AM to 5:29 AM | 81 (10.4%) | 44 (6.4%) |
| 5:30 AM to 5:59 AM | 24 (3.1%) | 50 (7.3%) |
| 6:00 AM to 6:29 AM | 92 (11.9%) | 24 (3.5%) |
| 6:30 AM to 6:59 AM | 94 (12.1%) | 21 (3.1%) |
| 7:00 AM to 7:29 AM | 84 (10.8%) | 115 (16.8%) |
| 7:30 AM to 7:59 AM | 36 (4.6%) | 93 (13.6%) |
| 8:00 AM to 8:29 AM | 17 (2.2%) | 95 (13.9%) |
| 8:30 AM to 8:59 AM | 1 (0.1%) | 0 (0.0%) |
| 9:00 AM to 9:59 AM | 23 (3.0%) | 7 (1.0%) |
| 10:00 AM to 10:59 AM | 0 (0.0%) | 0 (0.0%) |
| 11:00 AM to 11:59 AM | 0 (0.0%) | 77 (11.2%) |
| 12:00 PM to 3:59 PM | 78 (10.1%) | 71 (10.3%) |
| 4:00 PM to 11:59 PM | 142 (18.3%) | 70 (10.2%) |
| Total | 776 (100.0%) | 686 (100.0%) |
Housing Occupancy in Brillion
Occupancy by Ownership in Brillion
Of the total 1,333 dwellings in Brillion, owner-occupied units account for 1,034 (77.6%), while renter-occupied units make up 299 (22.4%).
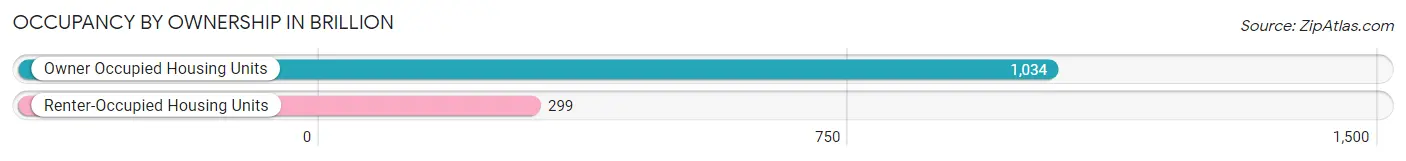
| Occupancy | # Housing Units | % Housing Units |
| Owner Occupied Housing Units | 1,034 | 77.6% |
| Renter-Occupied Housing Units | 299 | 22.4% |
| Total Occupied Housing Units | 1,333 | 100.0% |
Occupancy by Household Size in Brillion
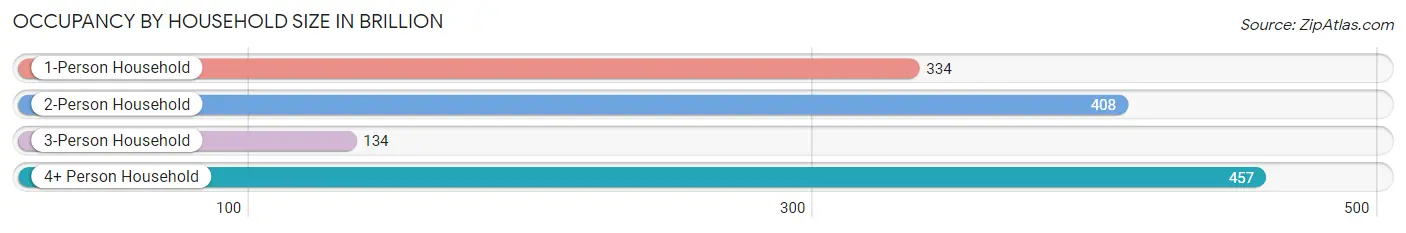
| Household Size | # Housing Units | % Housing Units |
| 1-Person Household | 334 | 25.1% |
| 2-Person Household | 408 | 30.6% |
| 3-Person Household | 134 | 10.1% |
| 4+ Person Household | 457 | 34.3% |
| Total Housing Units | 1,333 | 100.0% |
Occupancy by Ownership by Household Size in Brillion
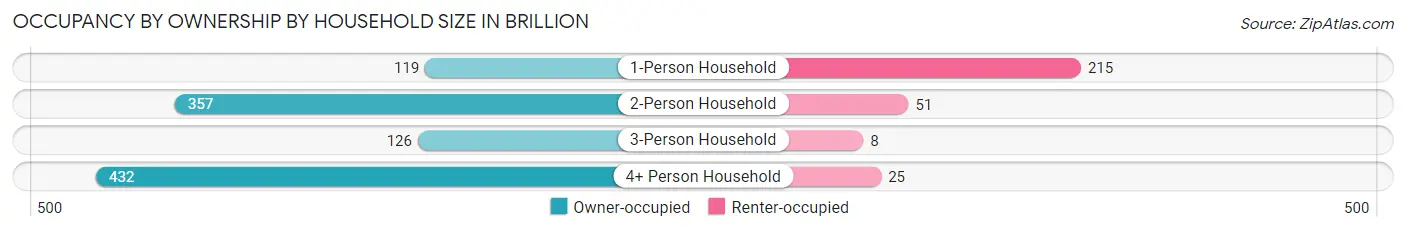
| Household Size | Owner-occupied | Renter-occupied |
| 1-Person Household | 119 (35.6%) | 215 (64.4%) |
| 2-Person Household | 357 (87.5%) | 51 (12.5%) |
| 3-Person Household | 126 (94.0%) | 8 (6.0%) |
| 4+ Person Household | 432 (94.5%) | 25 (5.5%) |
| Total Housing Units | 1,034 (77.6%) | 299 (22.4%) |
Occupancy by Educational Attainment in Brillion
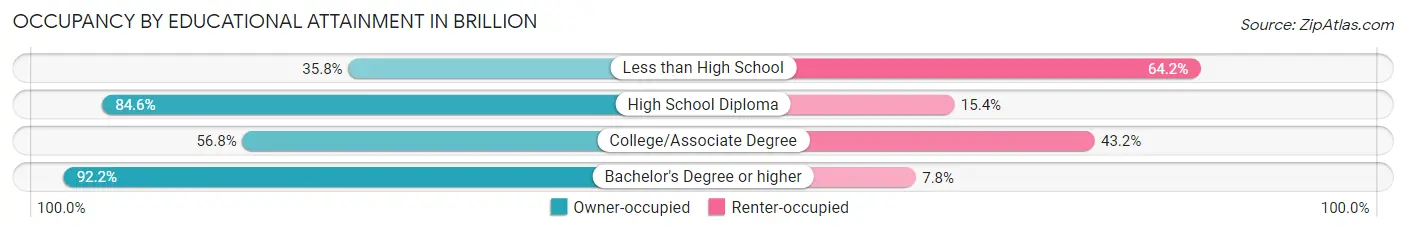
| Household Size | Owner-occupied | Renter-occupied |
| Less than High School | 29 (35.8%) | 52 (64.2%) |
| High School Diploma | 505 (84.6%) | 92 (15.4%) |
| College/Associate Degree | 167 (56.8%) | 127 (43.2%) |
| Bachelor's Degree or higher | 333 (92.2%) | 28 (7.8%) |
Occupancy by Age of Householder in Brillion
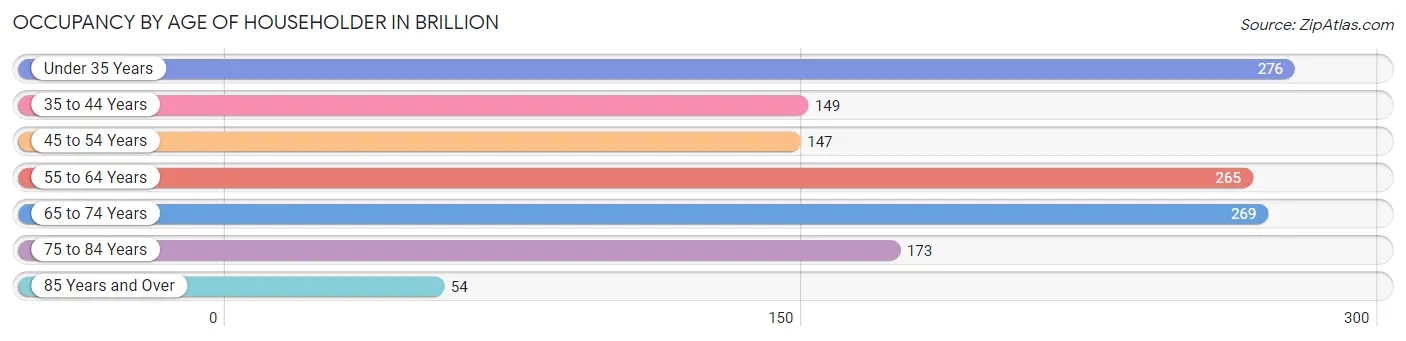
| Age Bracket | # Households | % Households |
| Under 35 Years | 276 | 20.7% |
| 35 to 44 Years | 149 | 11.2% |
| 45 to 54 Years | 147 | 11.0% |
| 55 to 64 Years | 265 | 19.9% |
| 65 to 74 Years | 269 | 20.2% |
| 75 to 84 Years | 173 | 13.0% |
| 85 Years and Over | 54 | 4.1% |
| Total | 1,333 | 100.0% |
Housing Finances in Brillion
Median Income by Occupancy in Brillion
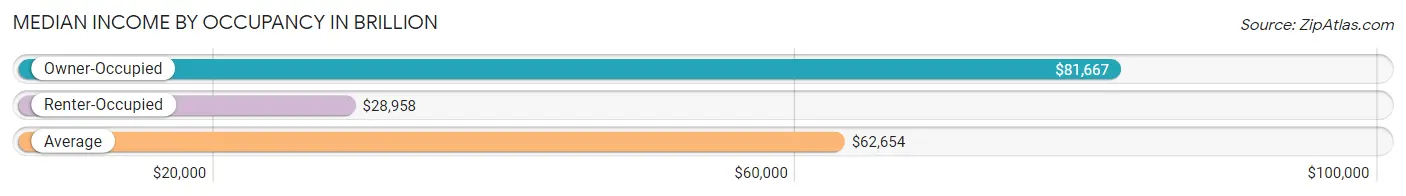
| Occupancy Type | # Households | Median Income |
| Owner-Occupied | 1,034 (77.6%) | $81,667 |
| Renter-Occupied | 299 (22.4%) | $28,958 |
| Average | 1,333 (100.0%) | $62,654 |
Occupancy by Householder Income Bracket in Brillion
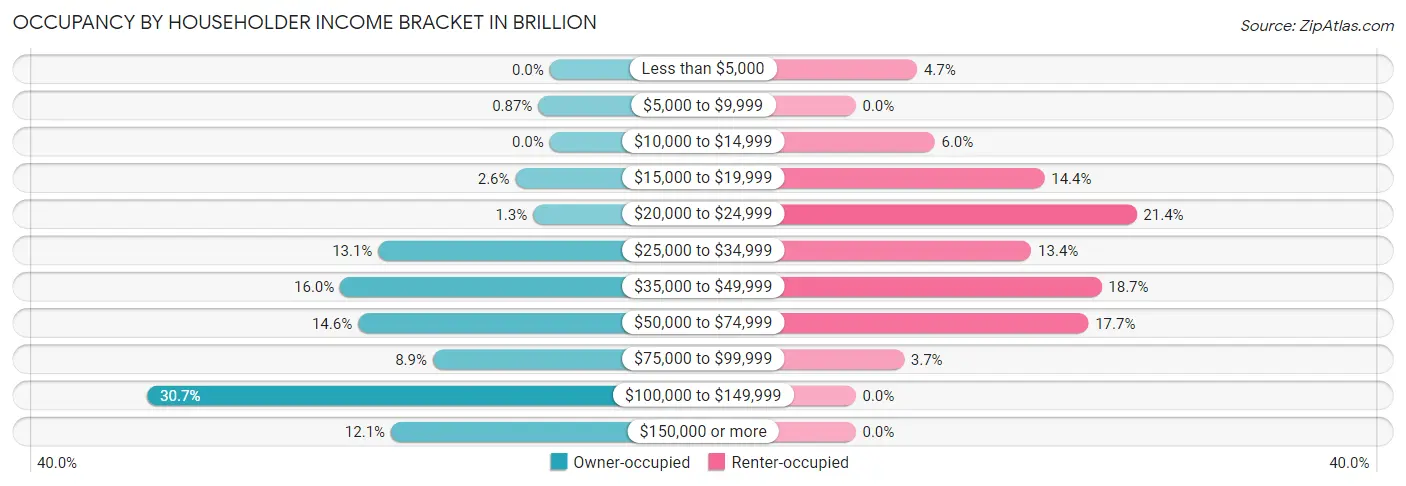
| Income Bracket | Owner-occupied | Renter-occupied |
| Less than $5,000 | 0 (0.0%) | 14 (4.7%) |
| $5,000 to $9,999 | 9 (0.9%) | 0 (0.0%) |
| $10,000 to $14,999 | 0 (0.0%) | 18 (6.0%) |
| $15,000 to $19,999 | 27 (2.6%) | 43 (14.4%) |
| $20,000 to $24,999 | 13 (1.3%) | 64 (21.4%) |
| $25,000 to $34,999 | 135 (13.1%) | 40 (13.4%) |
| $35,000 to $49,999 | 165 (16.0%) | 56 (18.7%) |
| $50,000 to $74,999 | 151 (14.6%) | 53 (17.7%) |
| $75,000 to $99,999 | 92 (8.9%) | 11 (3.7%) |
| $100,000 to $149,999 | 317 (30.7%) | 0 (0.0%) |
| $150,000 or more | 125 (12.1%) | 0 (0.0%) |
| Total | 1,034 (100.0%) | 299 (100.0%) |
Monthly Housing Cost Tiers in Brillion
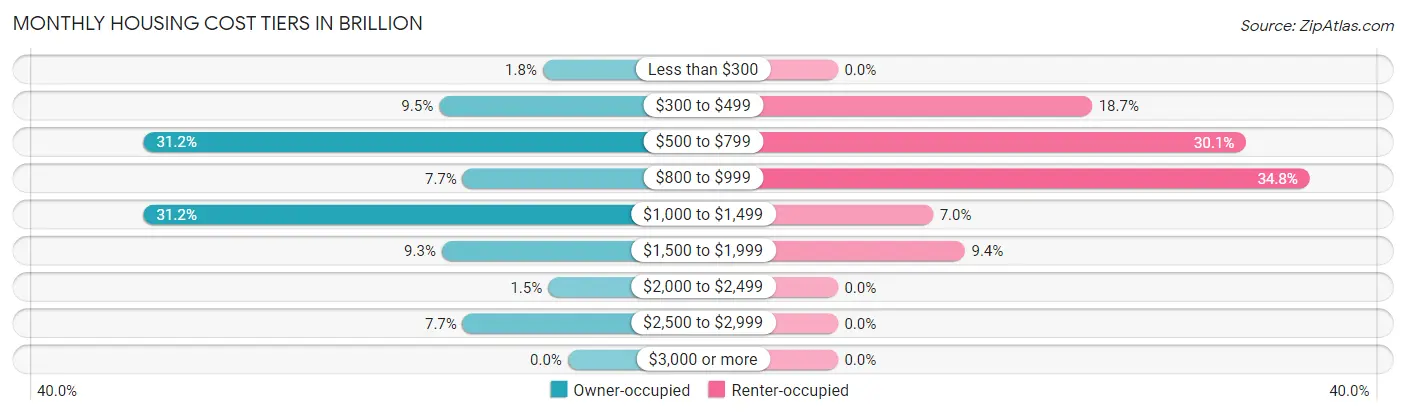
| Monthly Cost | Owner-occupied | Renter-occupied |
| Less than $300 | 19 (1.8%) | 0 (0.0%) |
| $300 to $499 | 98 (9.5%) | 56 (18.7%) |
| $500 to $799 | 323 (31.2%) | 90 (30.1%) |
| $800 to $999 | 80 (7.7%) | 104 (34.8%) |
| $1,000 to $1,499 | 323 (31.2%) | 21 (7.0%) |
| $1,500 to $1,999 | 96 (9.3%) | 28 (9.4%) |
| $2,000 to $2,499 | 15 (1.5%) | 0 (0.0%) |
| $2,500 to $2,999 | 80 (7.7%) | 0 (0.0%) |
| $3,000 or more | 0 (0.0%) | 0 (0.0%) |
| Total | 1,034 (100.0%) | 299 (100.0%) |
Physical Housing Characteristics in Brillion
Housing Structures in Brillion
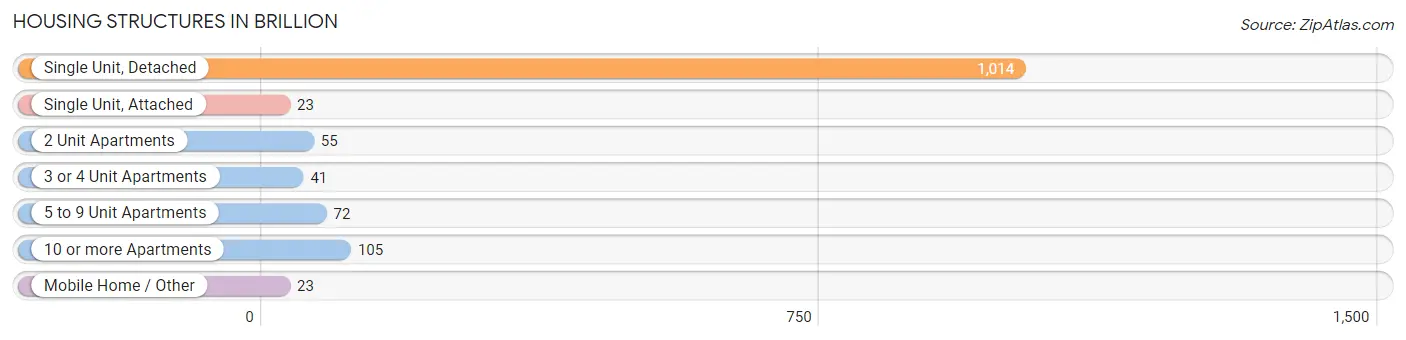
| Structure Type | # Housing Units | % Housing Units |
| Single Unit, Detached | 1,014 | 76.1% |
| Single Unit, Attached | 23 | 1.7% |
| 2 Unit Apartments | 55 | 4.1% |
| 3 or 4 Unit Apartments | 41 | 3.1% |
| 5 to 9 Unit Apartments | 72 | 5.4% |
| 10 or more Apartments | 105 | 7.9% |
| Mobile Home / Other | 23 | 1.7% |
| Total | 1,333 | 100.0% |
Housing Structures by Occupancy in Brillion
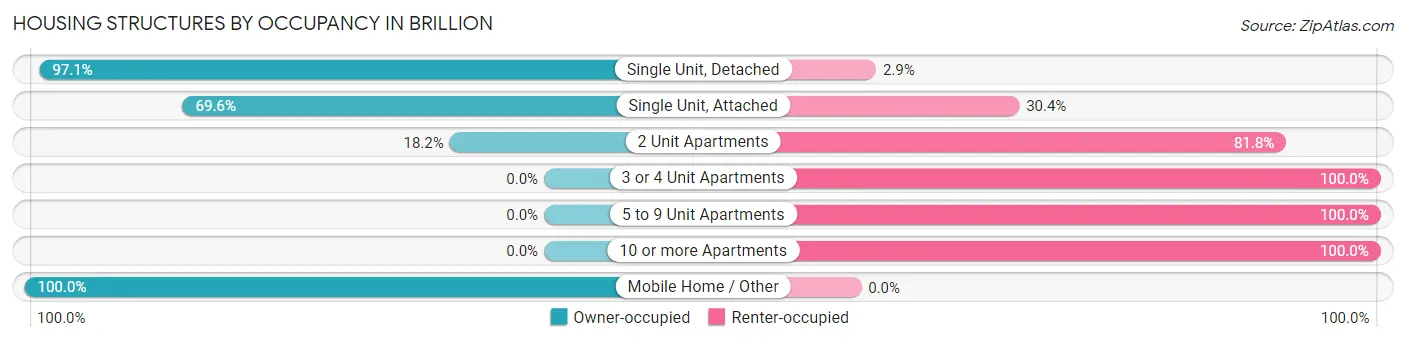
| Structure Type | Owner-occupied | Renter-occupied |
| Single Unit, Detached | 985 (97.1%) | 29 (2.9%) |
| Single Unit, Attached | 16 (69.6%) | 7 (30.4%) |
| 2 Unit Apartments | 10 (18.2%) | 45 (81.8%) |
| 3 or 4 Unit Apartments | 0 (0.0%) | 41 (100.0%) |
| 5 to 9 Unit Apartments | 0 (0.0%) | 72 (100.0%) |
| 10 or more Apartments | 0 (0.0%) | 105 (100.0%) |
| Mobile Home / Other | 23 (100.0%) | 0 (0.0%) |
| Total | 1,034 (77.6%) | 299 (22.4%) |
Housing Structures by Number of Rooms in Brillion
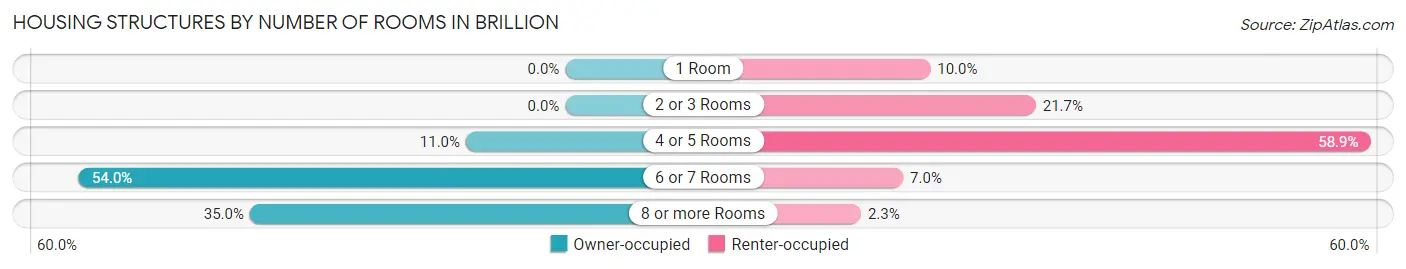
| Number of Rooms | Owner-occupied | Renter-occupied |
| 1 Room | 0 (0.0%) | 30 (10.0%) |
| 2 or 3 Rooms | 0 (0.0%) | 65 (21.7%) |
| 4 or 5 Rooms | 114 (11.0%) | 176 (58.9%) |
| 6 or 7 Rooms | 558 (54.0%) | 21 (7.0%) |
| 8 or more Rooms | 362 (35.0%) | 7 (2.3%) |
| Total | 1,034 (100.0%) | 299 (100.0%) |
Housing Structure by Heating Type in Brillion
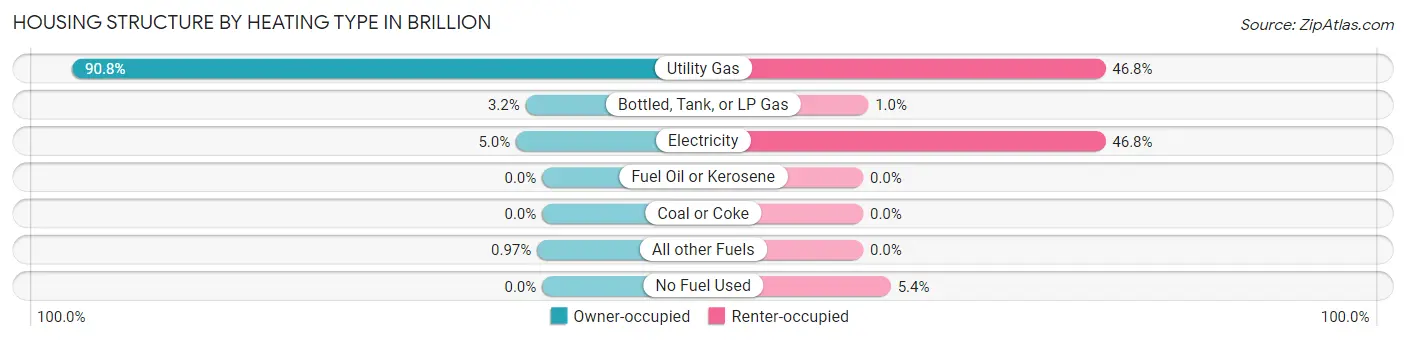
| Heating Type | Owner-occupied | Renter-occupied |
| Utility Gas | 939 (90.8%) | 140 (46.8%) |
| Bottled, Tank, or LP Gas | 33 (3.2%) | 3 (1.0%) |
| Electricity | 52 (5.0%) | 140 (46.8%) |
| Fuel Oil or Kerosene | 0 (0.0%) | 0 (0.0%) |
| Coal or Coke | 0 (0.0%) | 0 (0.0%) |
| All other Fuels | 10 (1.0%) | 0 (0.0%) |
| No Fuel Used | 0 (0.0%) | 16 (5.3%) |
| Total | 1,034 (100.0%) | 299 (100.0%) |
Household Vehicle Usage in Brillion
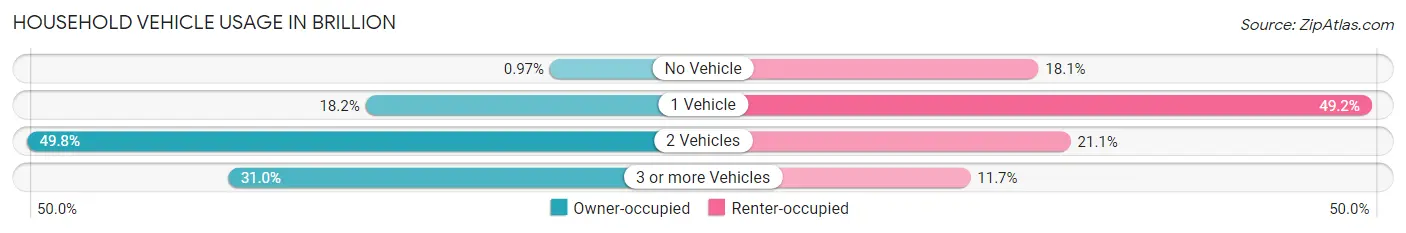
| Vehicles per Household | Owner-occupied | Renter-occupied |
| No Vehicle | 10 (1.0%) | 54 (18.1%) |
| 1 Vehicle | 188 (18.2%) | 147 (49.2%) |
| 2 Vehicles | 515 (49.8%) | 63 (21.1%) |
| 3 or more Vehicles | 321 (31.0%) | 35 (11.7%) |
| Total | 1,034 (100.0%) | 299 (100.0%) |
Real Estate & Mortgages in Brillion
Real Estate and Mortgage Overview in Brillion
| Characteristic | Without Mortgage | With Mortgage |
| Housing Units | 361 | 673 |
| Median Property Value | $182,900 | $160,200 |
| Median Household Income | $60,977 | $91 |
| Monthly Housing Costs | $575 | $0 |
| Real Estate Taxes | $3,296 | $0 |
Property Value by Mortgage Status in Brillion
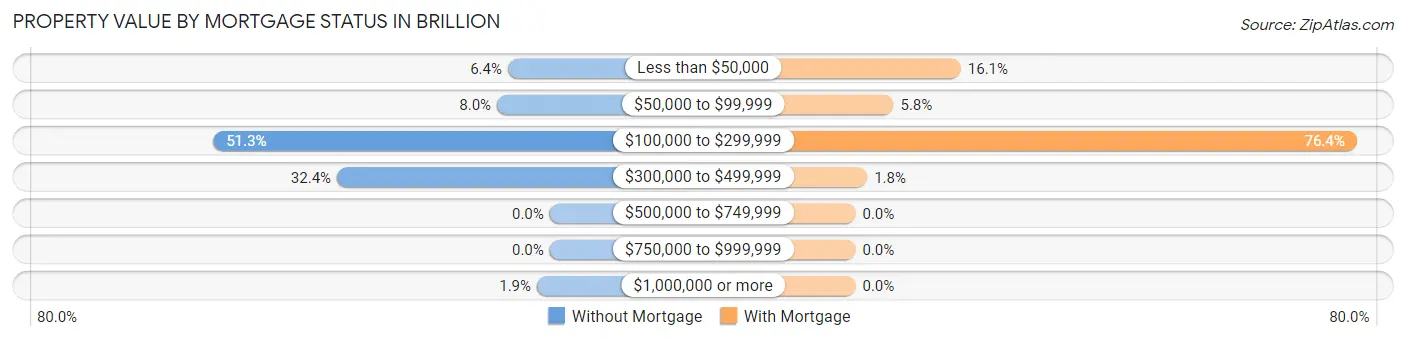
| Property Value | Without Mortgage | With Mortgage |
| Less than $50,000 | 23 (6.4%) | 108 (16.1%) |
| $50,000 to $99,999 | 29 (8.0%) | 39 (5.8%) |
| $100,000 to $299,999 | 185 (51.2%) | 514 (76.4%) |
| $300,000 to $499,999 | 117 (32.4%) | 12 (1.8%) |
| $500,000 to $749,999 | 0 (0.0%) | 0 (0.0%) |
| $750,000 to $999,999 | 0 (0.0%) | 0 (0.0%) |
| $1,000,000 or more | 7 (1.9%) | 0 (0.0%) |
| Total | 361 (100.0%) | 673 (100.0%) |
Household Income by Mortgage Status in Brillion
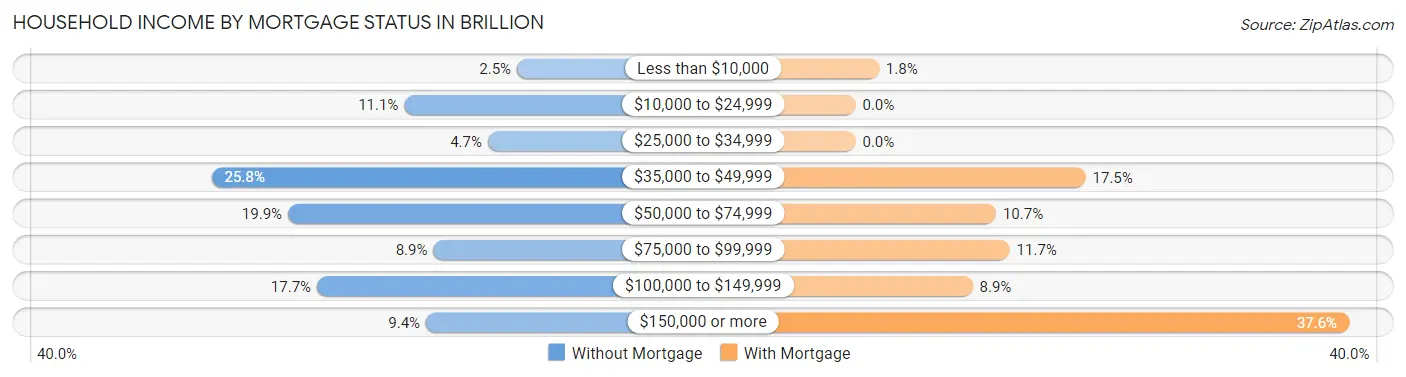
| Household Income | Without Mortgage | With Mortgage |
| Less than $10,000 | 9 (2.5%) | 12 (1.8%) |
| $10,000 to $24,999 | 40 (11.1%) | 0 (0.0%) |
| $25,000 to $34,999 | 17 (4.7%) | 0 (0.0%) |
| $35,000 to $49,999 | 93 (25.8%) | 118 (17.5%) |
| $50,000 to $74,999 | 72 (19.9%) | 72 (10.7%) |
| $75,000 to $99,999 | 32 (8.9%) | 79 (11.7%) |
| $100,000 to $149,999 | 64 (17.7%) | 60 (8.9%) |
| $150,000 or more | 34 (9.4%) | 253 (37.6%) |
| Total | 361 (100.0%) | 673 (100.0%) |
Property Value to Household Income Ratio in Brillion
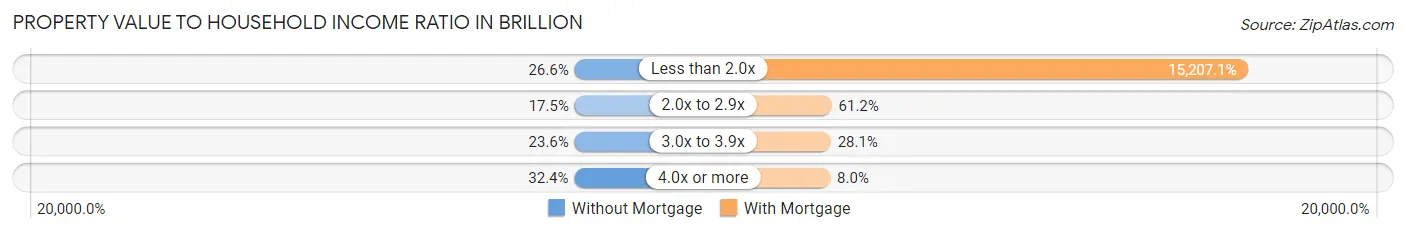
| Value-to-Income Ratio | Without Mortgage | With Mortgage |
| Less than 2.0x | 96 (26.6%) | 102,344 (15,207.1%) |
| 2.0x to 2.9x | 63 (17.4%) | 412 (61.2%) |
| 3.0x to 3.9x | 85 (23.5%) | 189 (28.1%) |
| 4.0x or more | 117 (32.4%) | 54 (8.0%) |
| Total | 361 (100.0%) | 673 (100.0%) |
Real Estate Taxes by Mortgage Status in Brillion
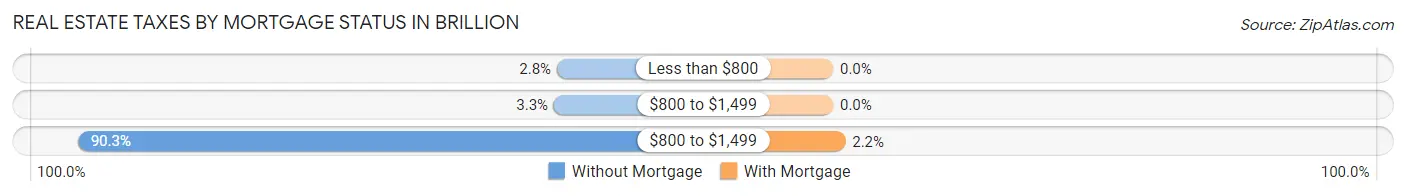
| Property Taxes | Without Mortgage | With Mortgage |
| Less than $800 | 10 (2.8%) | 0 (0.0%) |
| $800 to $1,499 | 12 (3.3%) | 0 (0.0%) |
| $800 to $1,499 | 326 (90.3%) | 15 (2.2%) |
| Total | 361 (100.0%) | 673 (100.0%) |
Health & Disability in Brillion
Health Insurance Coverage by Age in Brillion
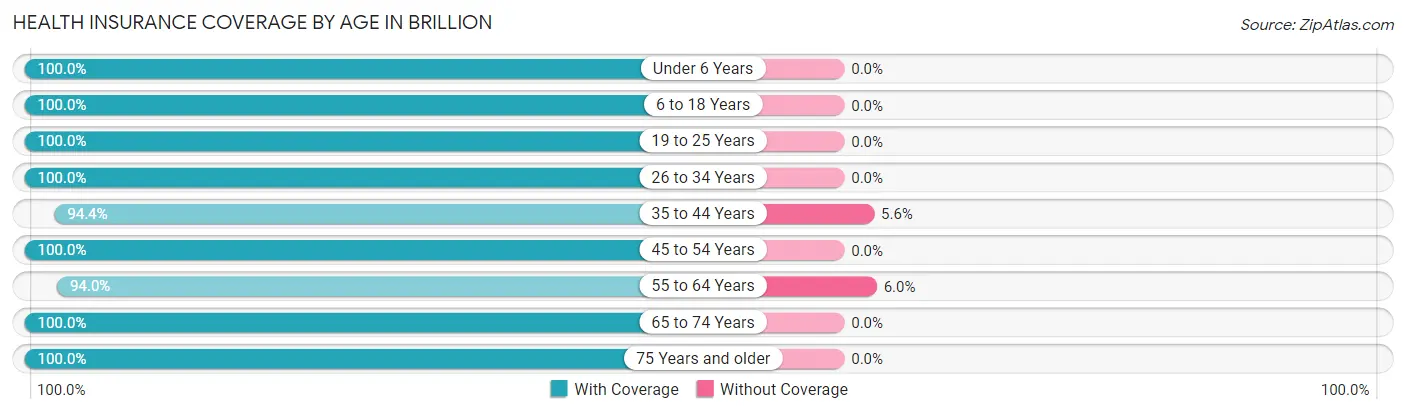
| Age Bracket | With Coverage | Without Coverage |
| Under 6 Years | 175 (100.0%) | 0 (0.0%) |
| 6 to 18 Years | 645 (100.0%) | 0 (0.0%) |
| 19 to 25 Years | 199 (100.0%) | 0 (0.0%) |
| 26 to 34 Years | 422 (100.0%) | 0 (0.0%) |
| 35 to 44 Years | 391 (94.4%) | 23 (5.6%) |
| 45 to 54 Years | 344 (100.0%) | 0 (0.0%) |
| 55 to 64 Years | 389 (94.0%) | 25 (6.0%) |
| 65 to 74 Years | 379 (100.0%) | 0 (0.0%) |
| 75 Years and older | 290 (100.0%) | 0 (0.0%) |
| Total | 3,234 (98.5%) | 48 (1.5%) |
Health Insurance Coverage by Citizenship Status in Brillion
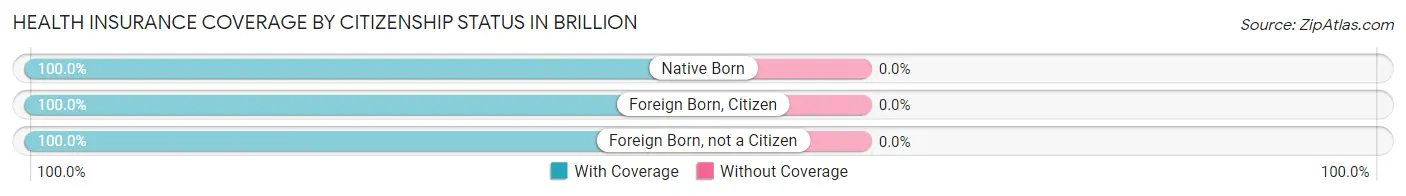
| Citizenship Status | With Coverage | Without Coverage |
| Native Born | 175 (100.0%) | 0 (0.0%) |
| Foreign Born, Citizen | 645 (100.0%) | 0 (0.0%) |
| Foreign Born, not a Citizen | 199 (100.0%) | 0 (0.0%) |
Health Insurance Coverage by Household Income in Brillion
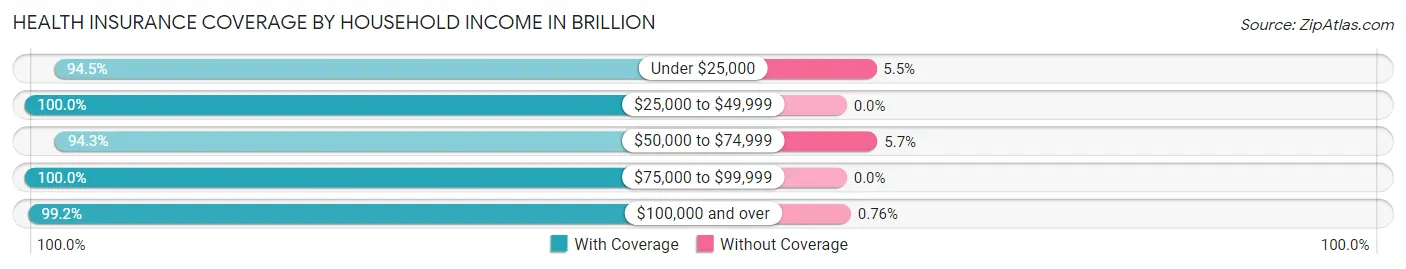
| Household Income | With Coverage | Without Coverage |
| Under $25,000 | 205 (94.5%) | 12 (5.5%) |
| $25,000 to $49,999 | 945 (100.0%) | 0 (0.0%) |
| $50,000 to $74,999 | 412 (94.3%) | 25 (5.7%) |
| $75,000 to $99,999 | 225 (100.0%) | 0 (0.0%) |
| $100,000 and over | 1,438 (99.2%) | 11 (0.8%) |
Public vs Private Health Insurance Coverage by Age in Brillion
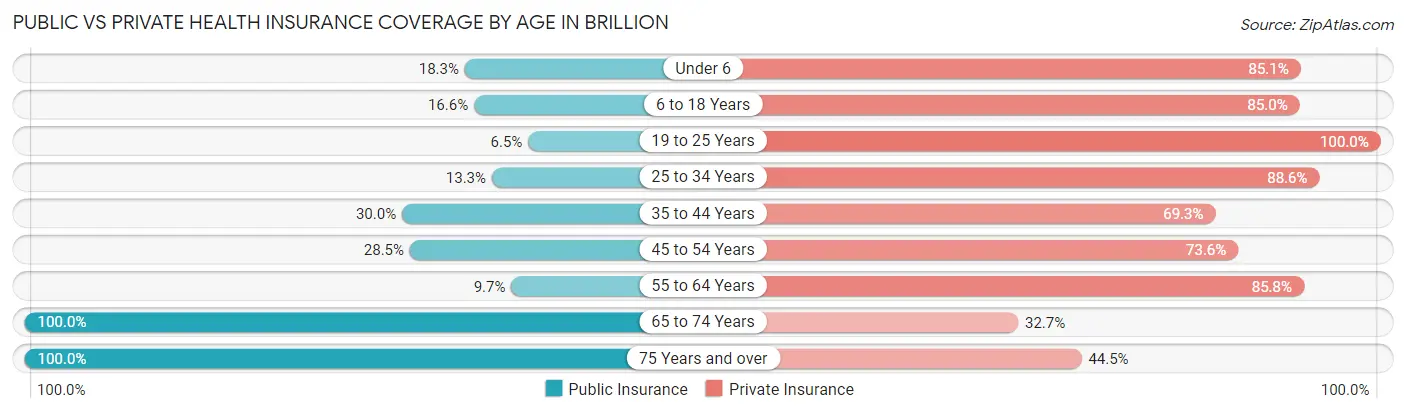
| Age Bracket | Public Insurance | Private Insurance |
| Under 6 | 32 (18.3%) | 149 (85.1%) |
| 6 to 18 Years | 107 (16.6%) | 548 (85.0%) |
| 19 to 25 Years | 13 (6.5%) | 199 (100.0%) |
| 25 to 34 Years | 56 (13.3%) | 374 (88.6%) |
| 35 to 44 Years | 124 (29.9%) | 287 (69.3%) |
| 45 to 54 Years | 98 (28.5%) | 253 (73.6%) |
| 55 to 64 Years | 40 (9.7%) | 355 (85.8%) |
| 65 to 74 Years | 379 (100.0%) | 124 (32.7%) |
| 75 Years and over | 290 (100.0%) | 129 (44.5%) |
| Total | 1,139 (34.7%) | 2,418 (73.7%) |
Disability Status by Sex by Age in Brillion
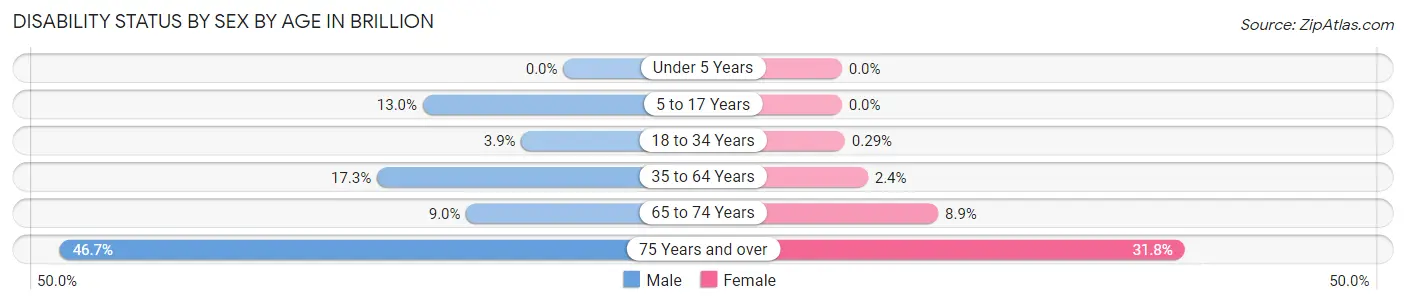
| Age Bracket | Male | Female |
| Under 5 Years | 0 (0.0%) | 0 (0.0%) |
| 5 to 17 Years | 36 (13.0%) | 0 (0.0%) |
| 18 to 34 Years | 13 (3.9%) | 1 (0.3%) |
| 35 to 64 Years | 102 (17.3%) | 14 (2.4%) |
| 65 to 74 Years | 18 (9.0%) | 16 (8.9%) |
| 75 Years and over | 43 (46.7%) | 63 (31.8%) |
Disability Class by Sex by Age in Brillion
Disability Class: Hearing Difficulty
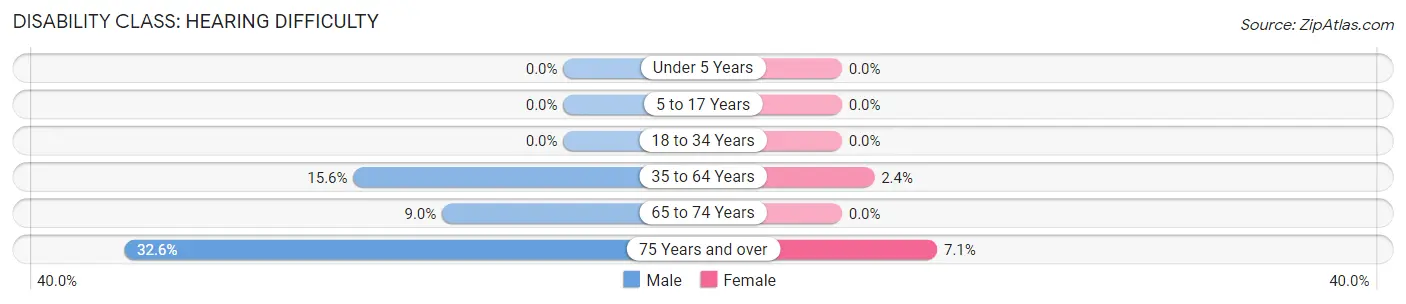
| Age Bracket | Male | Female |
| Under 5 Years | 0 (0.0%) | 0 (0.0%) |
| 5 to 17 Years | 0 (0.0%) | 0 (0.0%) |
| 18 to 34 Years | 0 (0.0%) | 0 (0.0%) |
| 35 to 64 Years | 92 (15.6%) | 14 (2.4%) |
| 65 to 74 Years | 18 (9.0%) | 0 (0.0%) |
| 75 Years and over | 30 (32.6%) | 14 (7.1%) |
Disability Class: Vision Difficulty
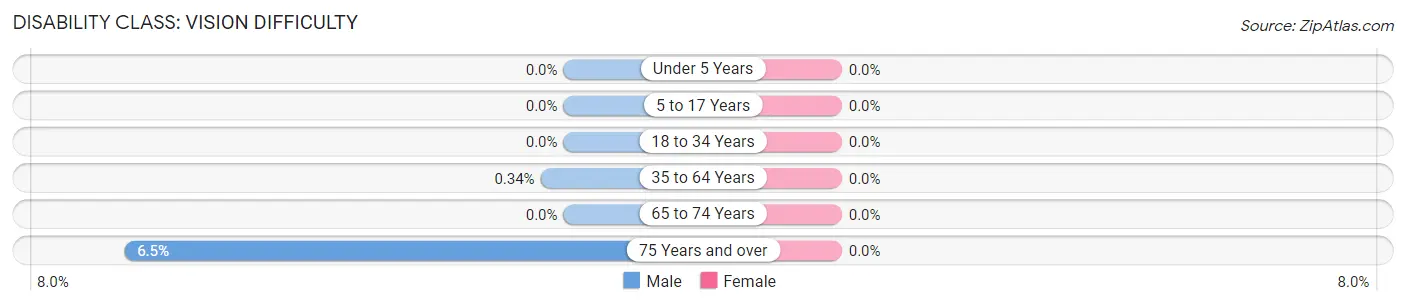
| Age Bracket | Male | Female |
| Under 5 Years | 0 (0.0%) | 0 (0.0%) |
| 5 to 17 Years | 0 (0.0%) | 0 (0.0%) |
| 18 to 34 Years | 0 (0.0%) | 0 (0.0%) |
| 35 to 64 Years | 2 (0.3%) | 0 (0.0%) |
| 65 to 74 Years | 0 (0.0%) | 0 (0.0%) |
| 75 Years and over | 6 (6.5%) | 0 (0.0%) |
Disability Class: Cognitive Difficulty
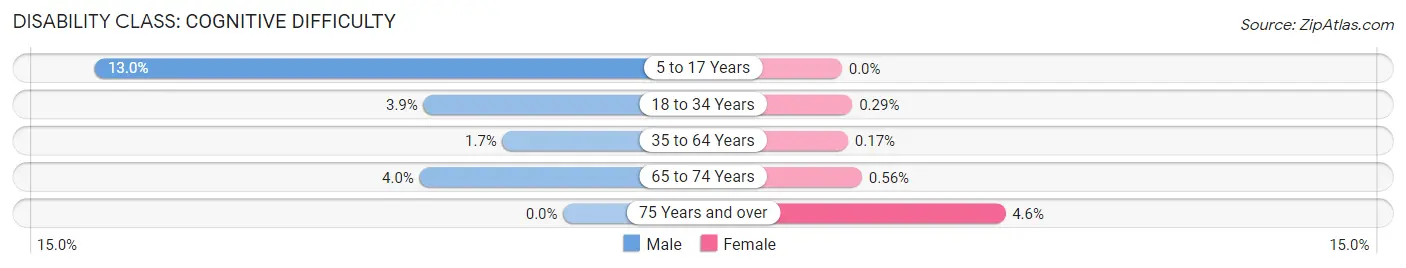
| Age Bracket | Male | Female |
| 5 to 17 Years | 36 (13.0%) | 0 (0.0%) |
| 18 to 34 Years | 13 (3.9%) | 1 (0.3%) |
| 35 to 64 Years | 10 (1.7%) | 1 (0.2%) |
| 65 to 74 Years | 8 (4.0%) | 1 (0.6%) |
| 75 Years and over | 0 (0.0%) | 9 (4.5%) |
Disability Class: Ambulatory Difficulty
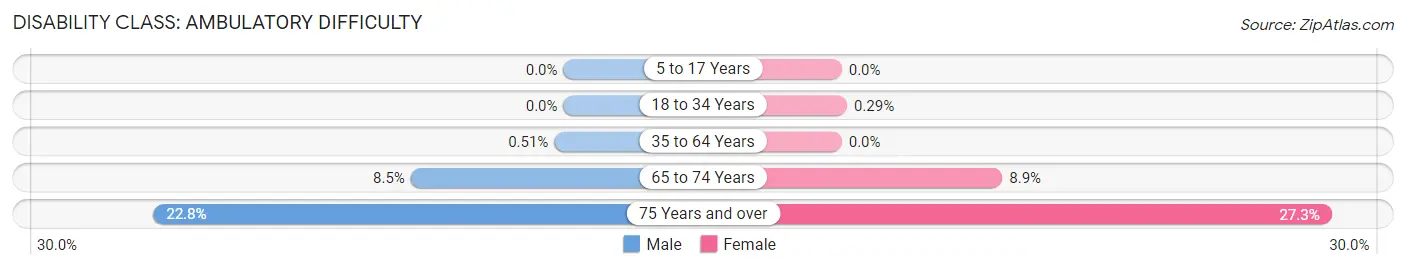
| Age Bracket | Male | Female |
| 5 to 17 Years | 0 (0.0%) | 0 (0.0%) |
| 18 to 34 Years | 0 (0.0%) | 1 (0.3%) |
| 35 to 64 Years | 3 (0.5%) | 0 (0.0%) |
| 65 to 74 Years | 17 (8.5%) | 16 (8.9%) |
| 75 Years and over | 21 (22.8%) | 54 (27.3%) |
Disability Class: Self-Care Difficulty
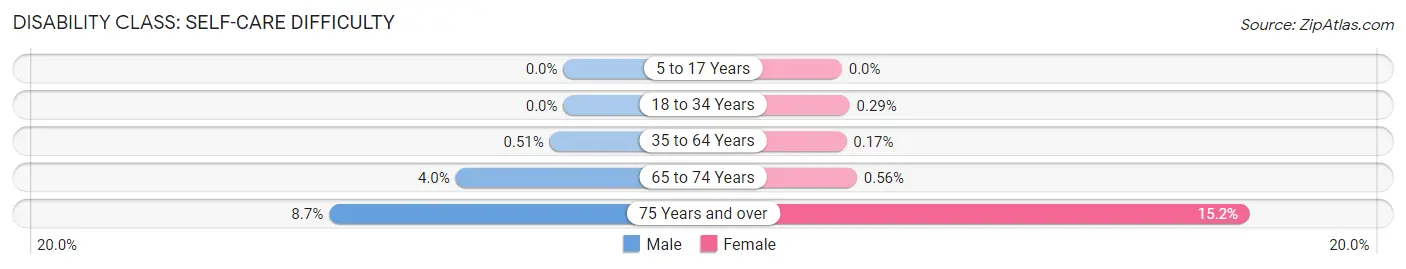
| Age Bracket | Male | Female |
| 5 to 17 Years | 0 (0.0%) | 0 (0.0%) |
| 18 to 34 Years | 0 (0.0%) | 1 (0.3%) |
| 35 to 64 Years | 3 (0.5%) | 1 (0.2%) |
| 65 to 74 Years | 8 (4.0%) | 1 (0.6%) |
| 75 Years and over | 8 (8.7%) | 30 (15.1%) |
Technology Access in Brillion
Computing Device Access in Brillion
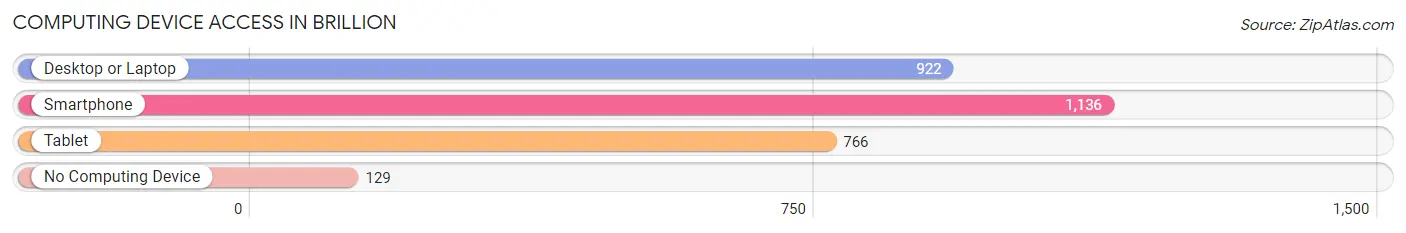
| Device Type | # Households | % Households |
| Desktop or Laptop | 922 | 69.2% |
| Smartphone | 1,136 | 85.2% |
| Tablet | 766 | 57.5% |
| No Computing Device | 129 | 9.7% |
| Total | 1,333 | 100.0% |
Internet Access in Brillion
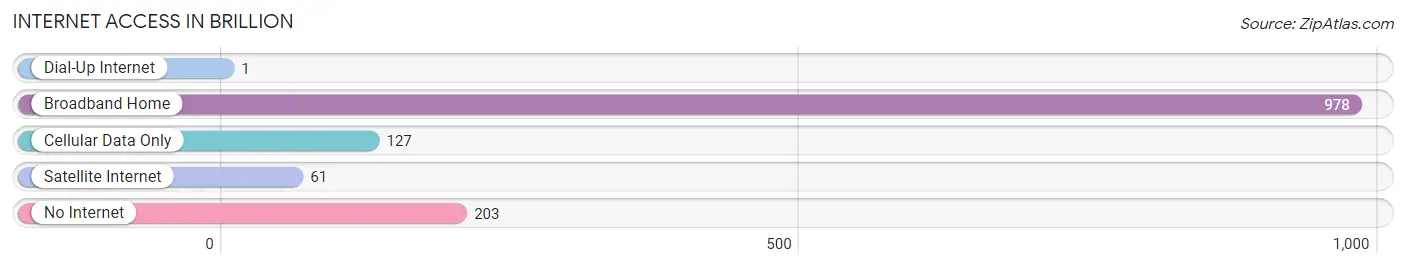
| Internet Type | # Households | % Households |
| Dial-Up Internet | 1 | 0.1% |
| Broadband Home | 978 | 73.4% |
| Cellular Data Only | 127 | 9.5% |
| Satellite Internet | 61 | 4.6% |
| No Internet | 203 | 15.2% |
| Total | 1,333 | 100.0% |
Brillion Summary
Brillion, Wisconsin is a small city located in Calumet County, Wisconsin. It is situated on the western edge of the state, about 30 miles south of Green Bay and about 40 miles north of Milwaukee. The city has a population of 3,541 as of the 2020 census, making it the second-largest city in Calumet County.
History
The area that is now Brillion was first settled in the early 1840s by German immigrants. The city was officially founded in 1848 and was named after the German city of Brielle. The city was incorporated in 1872 and was originally a farming community. In the late 19th century, the city began to industrialize, with the first factory being built in 1883. The city continued to grow throughout the 20th century, with the population reaching its peak in 1960 at 4,845.
Geography
Brillion is located in the western part of Wisconsin, about 30 miles south of Green Bay and 40 miles north of Milwaukee. The city is situated on the banks of the Fox River and is surrounded by rolling hills and farmland. The city has a total area of 4.2 square miles, all of which is land.
Economy
Brillion’s economy is largely based on manufacturing and agriculture. The city is home to several factories, including a John Deere plant, a Kohler engine plant, and a Briggs & Stratton plant. The city is also home to several farms, which produce a variety of crops, including corn, soybeans, and wheat.
Demographics
As of the 2020 census, Brillion had a population of 3,541. The racial makeup of the city was 95.2% White, 0.7% African American, 0.3% Native American, 0.7% Asian, 0.1% Pacific Islander, 1.3% from other races, and 1.7% from two or more races. Hispanic or Latino of any race were 3.2% of the population.
The median household income in Brillion was $50,945 in 2019, and the median family income was $60,917. The per capita income was $25,945. About 8.2% of the population was below the poverty line.
Brillion is a small city with a rich history and a strong economy. The city is home to several factories and farms, and the population is largely white. The city has a median household income that is slightly higher than the national average, and the poverty rate is lower than the national average.
Common Questions
What is Per Capita Income in Brillion?
Per Capita income in Brillion is $30,929.
What is the Median Family Income in Brillion?
Median Family Income in Brillion is $95,500.
What is the Median Household income in Brillion?
Median Household Income in Brillion is $62,654.
What is Income or Wage Gap in Brillion?
Income or Wage Gap in Brillion is 41.5%.
Women in Brillion earn 58.5 cents for every dollar earned by a man.
What is Inequality or Gini Index in Brillion?
Inequality or Gini Index in Brillion is 0.39.
What is the Total Population of Brillion?
Total Population of Brillion is 3,294.
What is the Total Male Population of Brillion?
Total Male Population of Brillion is 1,556.
What is the Total Female Population of Brillion?
Total Female Population of Brillion is 1,738.
What is the Ratio of Males per 100 Females in Brillion?
There are 89.53 Males per 100 Females in Brillion.
What is the Ratio of Females per 100 Males in Brillion?
There are 111.70 Females per 100 Males in Brillion.
What is the Median Population Age in Brillion?
Median Population Age in Brillion is 40.7 Years.
What is the Average Family Size in Brillion
Average Family Size in Brillion is 3.0 People.
What is the Average Household Size in Brillion
Average Household Size in Brillion is 2.5 People.
How Large is the Labor Force in Brillion?
There are 1,615 People in the Labor Forcein in Brillion.
What is the Percentage of People in the Labor Force in Brillion?
60.2% of People are in the Labor Force in Brillion.
What is the Unemployment Rate in Brillion?
Unemployment Rate in Brillion is 1.5%.