Browns Lake, WI Map & Demographics
Browns Lake Map
Browns Lake Overview
$80,531
PER CAPITA INCOME
$126,935
AVG FAMILY INCOME
$120,719
AVG HOUSEHOLD INCOME
19.3%
WAGE / INCOME GAP [ % ]
80.7¢/ $1
WAGE / INCOME GAP [ $ ]
0.52
INEQUALITY / GINI INDEX
1,831
TOTAL POPULATION
885
MALE POPULATION
946
FEMALE POPULATION
93.55
MALES / 100 FEMALES
106.89
FEMALES / 100 MALES
57.8
MEDIAN AGE
2.5
AVG FAMILY SIZE
2.2
AVG HOUSEHOLD SIZE
896
LABOR FORCE [ PEOPLE ]
52.2%
PERCENT IN LABOR FORCE
Income in Browns Lake
Income Overview in Browns Lake
Per Capita Income in Browns Lake is $80,531, while median incomes of families and households are $126,935 and $120,719 respectively.
| Characteristic | Number | Measure |
| Per Capita Income | 1,831 | $80,531 |
| Median Family Income | 535 | $126,935 |
| Mean Family Income | 535 | $241,520 |
| Median Household Income | 817 | $120,719 |
| Mean Household Income | 817 | $181,680 |
| Income Deficit | 535 | $0 |
| Wage / Income Gap (%) | 1,831 | 19.30% |
| Wage / Income Gap ($) | 1,831 | 80.70¢ per $1 |
| Gini / Inequality Index | 1,831 | 0.52 |
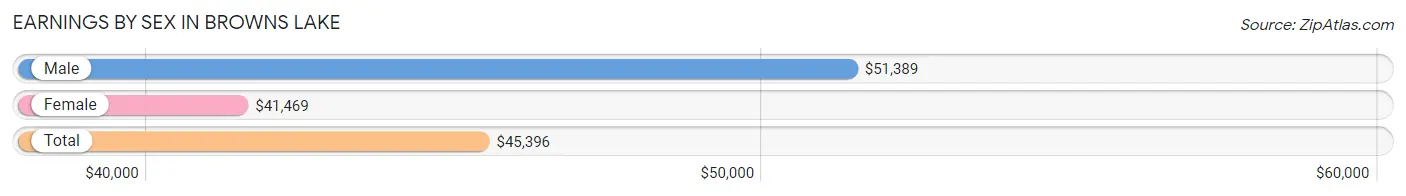
Earnings by Sex in Browns Lake
Average Earnings in Browns Lake are $45,396, $51,389 for men and $41,469 for women, a difference of 19.3%.
| Sex | Number | Average Earnings |
| Male | 544 (55.2%) | $51,389 |
| Female | 441 (44.8%) | $41,469 |
| Total | 985 (100.0%) | $45,396 |
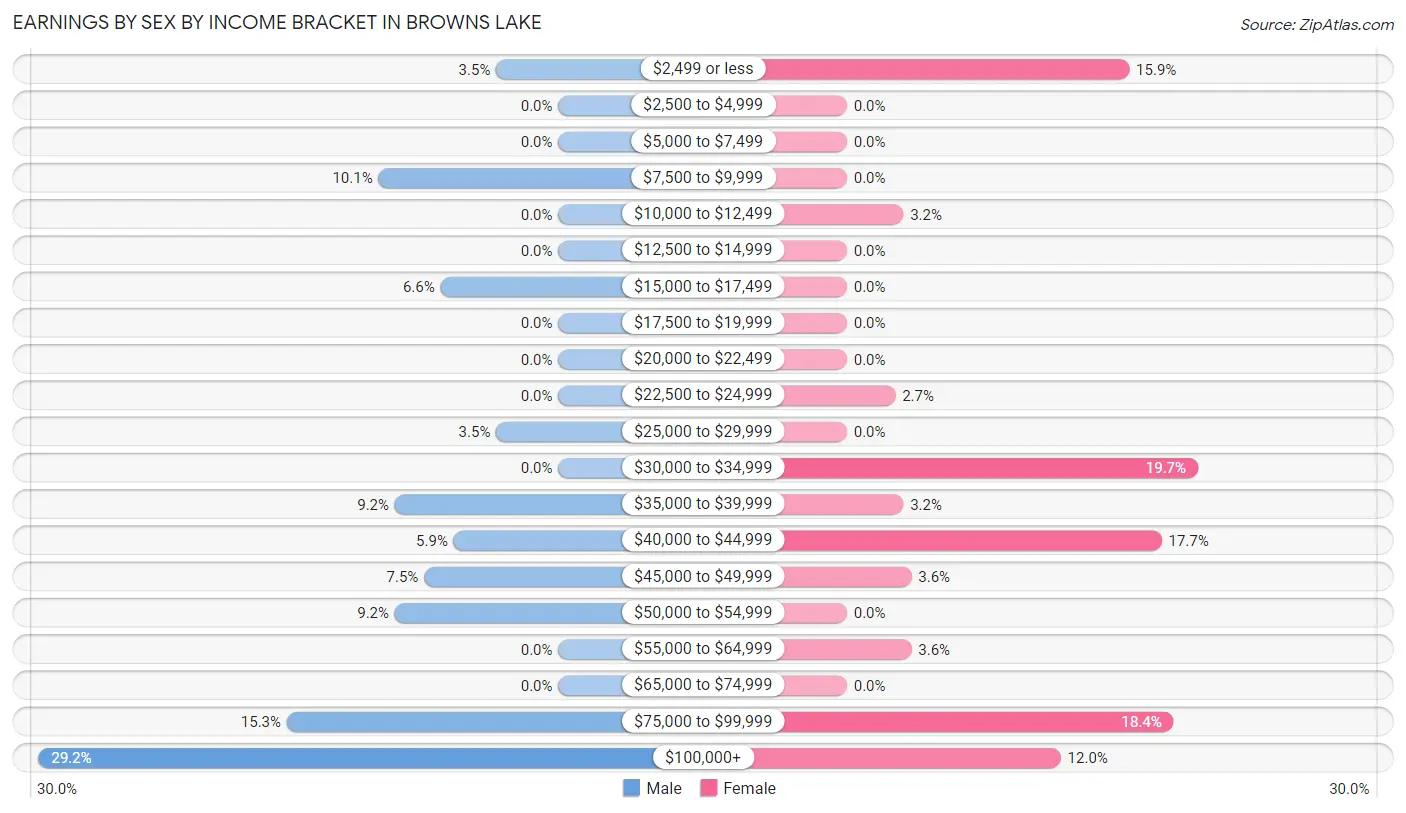
Earnings by Sex by Income Bracket in Browns Lake
The most common earnings brackets in Browns Lake are $100,000+ for men (159 | 29.2%) and $30,000 to $34,999 for women (87 | 19.7%).
| Income | Male | Female |
| $2,499 or less | 19 (3.5%) | 70 (15.9%) |
| $2,500 to $4,999 | 0 (0.0%) | 0 (0.0%) |
| $5,000 to $7,499 | 0 (0.0%) | 0 (0.0%) |
| $7,500 to $9,999 | 55 (10.1%) | 0 (0.0%) |
| $10,000 to $12,499 | 0 (0.0%) | 14 (3.2%) |
| $12,500 to $14,999 | 0 (0.0%) | 0 (0.0%) |
| $15,000 to $17,499 | 36 (6.6%) | 0 (0.0%) |
| $17,500 to $19,999 | 0 (0.0%) | 0 (0.0%) |
| $20,000 to $22,499 | 0 (0.0%) | 0 (0.0%) |
| $22,500 to $24,999 | 0 (0.0%) | 12 (2.7%) |
| $25,000 to $29,999 | 19 (3.5%) | 0 (0.0%) |
| $30,000 to $34,999 | 0 (0.0%) | 87 (19.7%) |
| $35,000 to $39,999 | 50 (9.2%) | 14 (3.2%) |
| $40,000 to $44,999 | 32 (5.9%) | 78 (17.7%) |
| $45,000 to $49,999 | 41 (7.5%) | 16 (3.6%) |
| $50,000 to $54,999 | 50 (9.2%) | 0 (0.0%) |
| $55,000 to $64,999 | 0 (0.0%) | 16 (3.6%) |
| $65,000 to $74,999 | 0 (0.0%) | 0 (0.0%) |
| $75,000 to $99,999 | 83 (15.3%) | 81 (18.4%) |
| $100,000+ | 159 (29.2%) | 53 (12.0%) |
| Total | 544 (100.0%) | 441 (100.0%) |
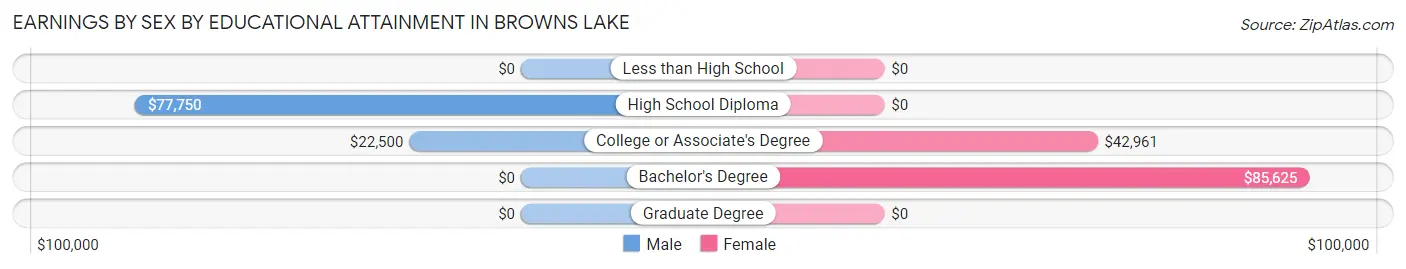
Earnings by Sex by Educational Attainment in Browns Lake
Average earnings in Browns Lake are $75,461 for men and $43,717 for women, a difference of 42.1%. Men with an educational attainment of high school diploma enjoy the highest average annual earnings of $77,750, while those with college or associate's degree education earn the least with $22,500. Women with an educational attainment of bachelor's degree earn the most with the average annual earnings of $85,625, while those with college or associate's degree education have the smallest earnings of $42,961.
| Educational Attainment | Male Income | Female Income |
| Less than High School | - | - |
| High School Diploma | $77,750 | $0 |
| College or Associate's Degree | $22,500 | $42,961 |
| Bachelor's Degree | - | - |
| Graduate Degree | - | - |
| Total | $75,461 | $43,717 |
Family Income in Browns Lake
Family Income Brackets in Browns Lake
According to the Browns Lake family income data, there are 212 families falling into the $100,000 to $149,999 income range, which is the most common income bracket and makes up 39.6% of all families.
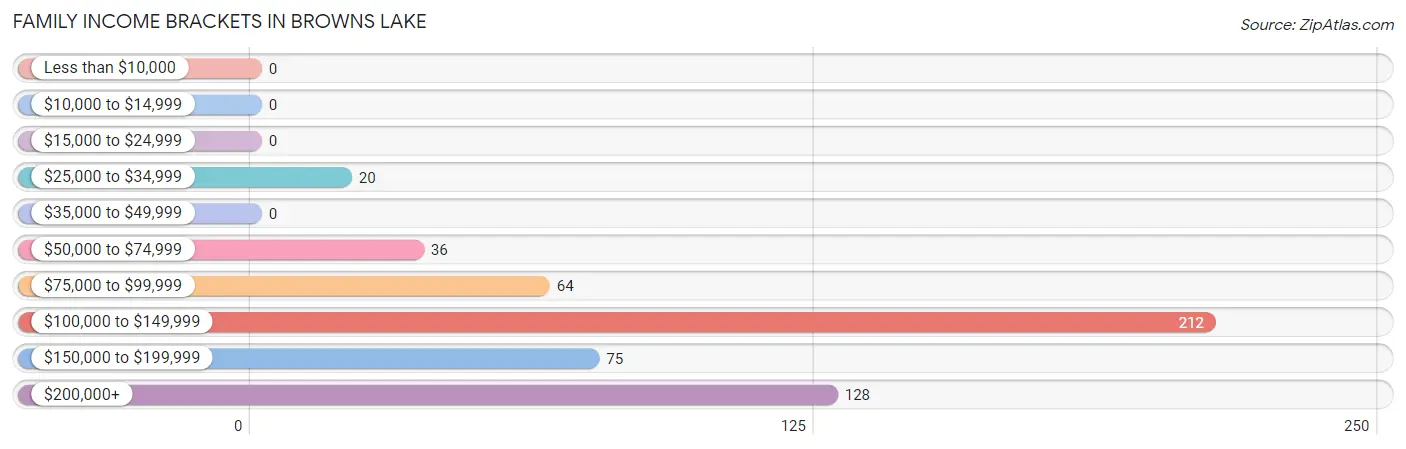
| Income Bracket | # Families | % Families |
| Less than $10,000 | 0 | 0.0% |
| $10,000 to $14,999 | 0 | 0.0% |
| $15,000 to $24,999 | 0 | 0.0% |
| $25,000 to $34,999 | 20 | 3.7% |
| $35,000 to $49,999 | 0 | 0.0% |
| $50,000 to $74,999 | 36 | 6.7% |
| $75,000 to $99,999 | 64 | 12.0% |
| $100,000 to $149,999 | 212 | 39.6% |
| $150,000 to $199,999 | 75 | 14.0% |
| $200,000+ | 128 | 23.9% |
Family Income by Famaliy Size in Browns Lake
4-person families (84 | 15.7%) account for the highest median family income in Browns Lake with $250,001 per family, while 4-person families (84 | 15.7%) have the highest median income of $62,500 per family member.
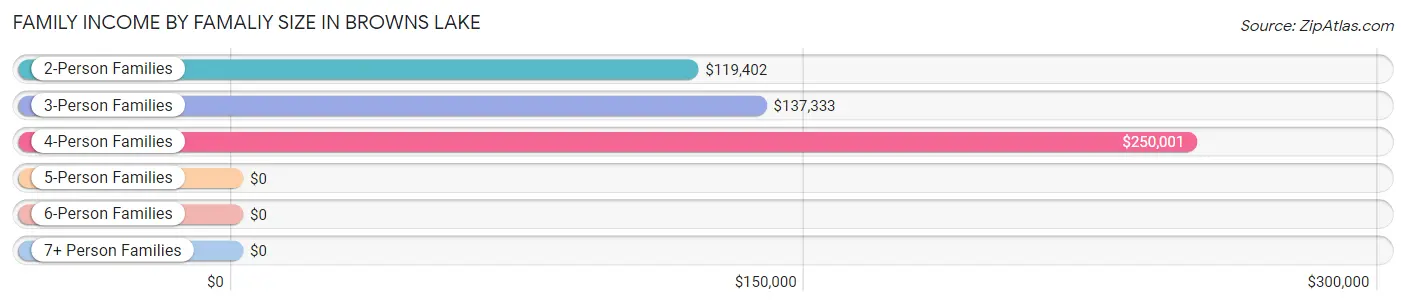
| Income Bracket | # Families | Median Income |
| 2-Person Families | 349 (65.2%) | $119,402 |
| 3-Person Families | 102 (19.1%) | $137,333 |
| 4-Person Families | 84 (15.7%) | $250,001 |
| 5-Person Families | 0 (0.0%) | $0 |
| 6-Person Families | 0 (0.0%) | $0 |
| 7+ Person Families | 0 (0.0%) | $0 |
| Total | 535 (100.0%) | $126,935 |
Family Income by Number of Earners in Browns Lake
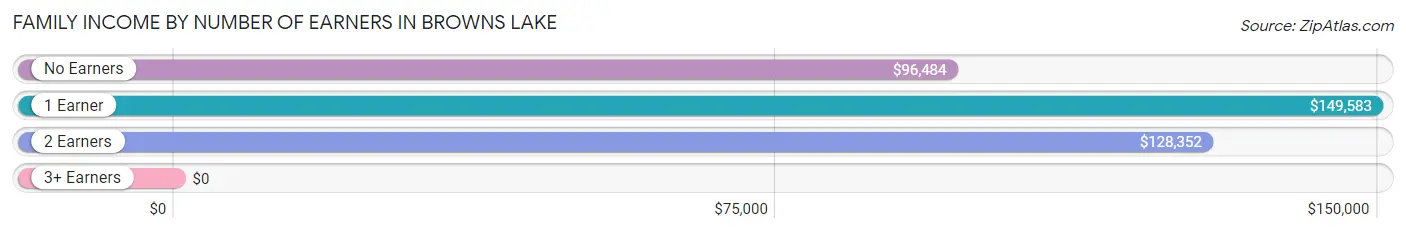
| Number of Earners | # Families | Median Income |
| No Earners | 131 (24.5%) | $96,484 |
| 1 Earner | 142 (26.5%) | $149,583 |
| 2 Earners | 195 (36.4%) | $128,352 |
| 3+ Earners | 67 (12.5%) | $0 |
| Total | 535 (100.0%) | $126,935 |
Household Income in Browns Lake
Household Income Brackets in Browns Lake
With 292 households falling in the category, the $100,000 to $149,999 income range is the most frequent in Browns Lake, accounting for 35.7% of all households.
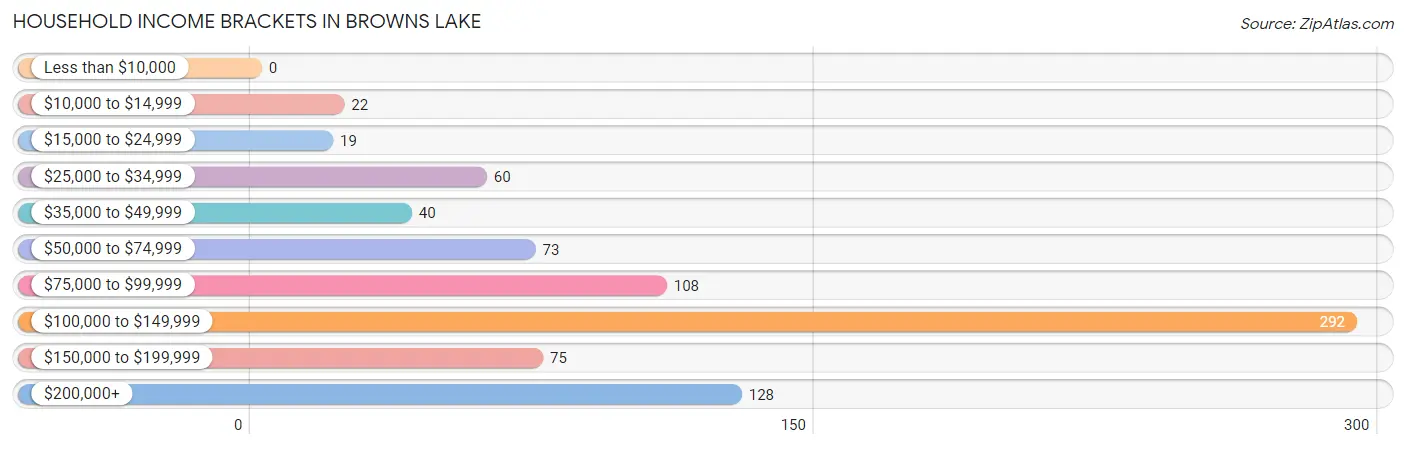
| Income Bracket | # Households | % Households |
| Less than $10,000 | 0 | 0.0% |
| $10,000 to $14,999 | 22 | 2.7% |
| $15,000 to $24,999 | 19 | 2.3% |
| $25,000 to $34,999 | 60 | 7.3% |
| $35,000 to $49,999 | 40 | 4.9% |
| $50,000 to $74,999 | 73 | 8.9% |
| $75,000 to $99,999 | 108 | 13.2% |
| $100,000 to $149,999 | 292 | 35.7% |
| $150,000 to $199,999 | 75 | 9.2% |
| $200,000+ | 128 | 15.7% |
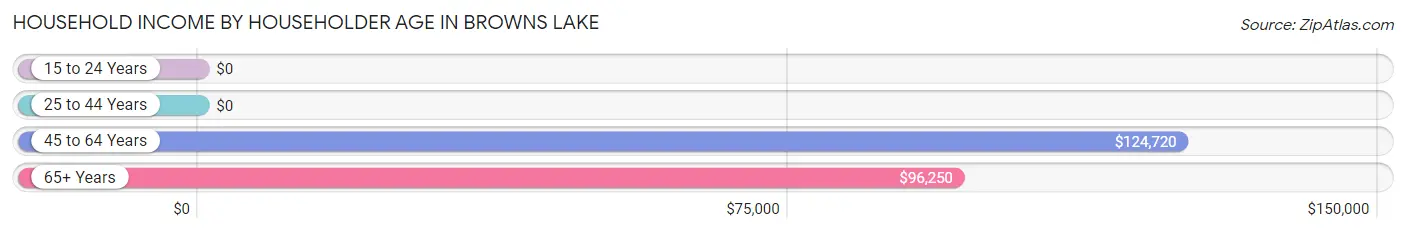
Household Income by Householder Age in Browns Lake
The median household income in Browns Lake is $120,719, with the highest median household income of $124,720 found in the 45 to 64 years age bracket for the primary householder. A total of 375 households (45.9%) fall into this category.
| Income Bracket | # Households | Median Income |
| 15 to 24 Years | 0 (0.0%) | $0 |
| 25 to 44 Years | 34 (4.2%) | $0 |
| 45 to 64 Years | 375 (45.9%) | $124,720 |
| 65+ Years | 408 (49.9%) | $96,250 |
| Total | 817 (100.0%) | $120,719 |
Poverty in Browns Lake
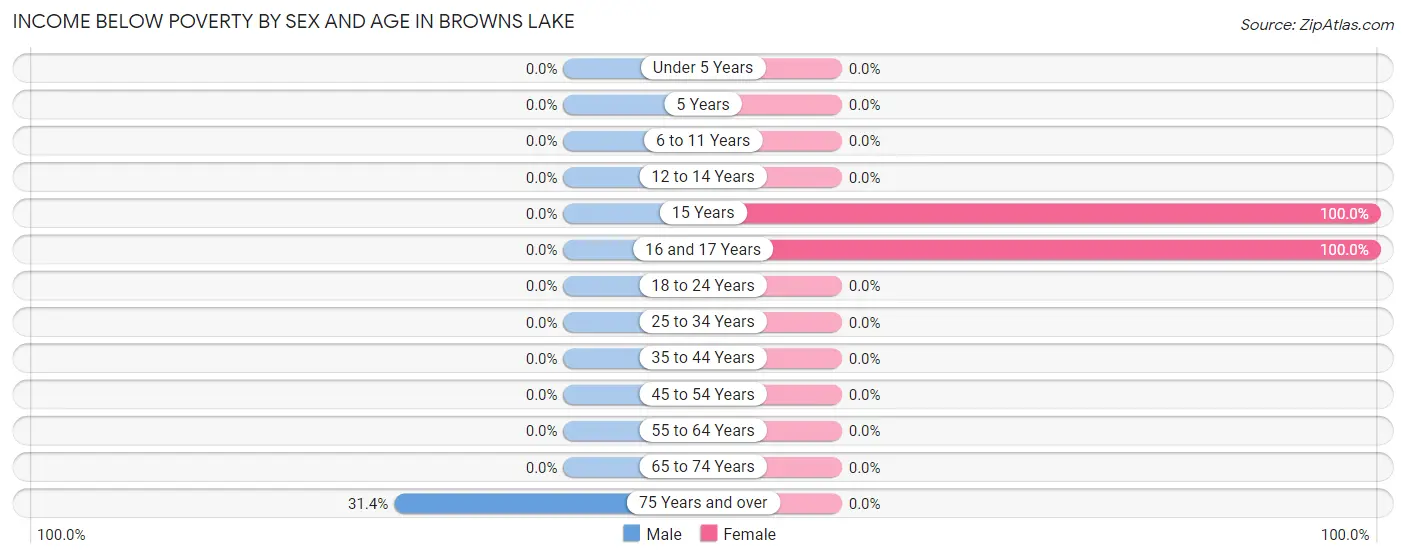
Income Below Poverty by Sex and Age in Browns Lake
With 2.5% poverty level for males and 15.0% for females among the residents of Browns Lake, 75 year old and over males and 15 year old females are the most vulnerable to poverty, with 22 males (31.4%) and 72 females (100.0%) in their respective age groups living below the poverty level.
| Age Bracket | Male | Female |
| Under 5 Years | 0 (0.0%) | 0 (0.0%) |
| 5 Years | 0 (0.0%) | 0 (0.0%) |
| 6 to 11 Years | 0 (0.0%) | 0 (0.0%) |
| 12 to 14 Years | 0 (0.0%) | 0 (0.0%) |
| 15 Years | 0 (0.0%) | 72 (100.0%) |
| 16 and 17 Years | 0 (0.0%) | 70 (100.0%) |
| 18 to 24 Years | 0 (0.0%) | 0 (0.0%) |
| 25 to 34 Years | 0 (0.0%) | 0 (0.0%) |
| 35 to 44 Years | 0 (0.0%) | 0 (0.0%) |
| 45 to 54 Years | 0 (0.0%) | 0 (0.0%) |
| 55 to 64 Years | 0 (0.0%) | 0 (0.0%) |
| 65 to 74 Years | 0 (0.0%) | 0 (0.0%) |
| 75 Years and over | 22 (31.4%) | 0 (0.0%) |
| Total | 22 (2.5%) | 142 (15.0%) |
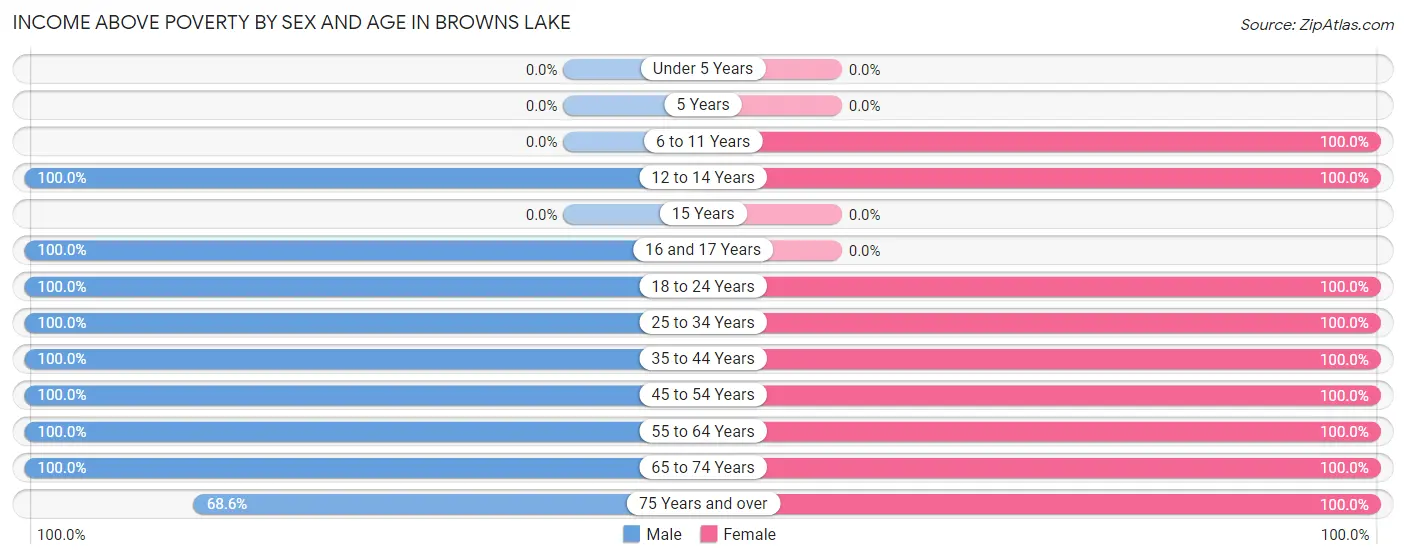
Income Above Poverty by Sex and Age in Browns Lake
According to the poverty statistics in Browns Lake, males aged 12 to 14 years and females aged 6 to 11 years are the age groups that are most secure financially, with 100.0% of males and 100.0% of females in these age groups living above the poverty line.
| Age Bracket | Male | Female |
| Under 5 Years | 0 (0.0%) | 0 (0.0%) |
| 5 Years | 0 (0.0%) | 0 (0.0%) |
| 6 to 11 Years | 0 (0.0%) | 11 (100.0%) |
| 12 to 14 Years | 19 (100.0%) | 12 (100.0%) |
| 15 Years | 0 (0.0%) | 0 (0.0%) |
| 16 and 17 Years | 58 (100.0%) | 0 (0.0%) |
| 18 to 24 Years | 93 (100.0%) | 55 (100.0%) |
| 25 to 34 Years | 20 (100.0%) | 22 (100.0%) |
| 35 to 44 Years | 45 (100.0%) | 44 (100.0%) |
| 45 to 54 Years | 125 (100.0%) | 221 (100.0%) |
| 55 to 64 Years | 180 (100.0%) | 113 (100.0%) |
| 65 to 74 Years | 275 (100.0%) | 260 (100.0%) |
| 75 Years and over | 48 (68.6%) | 66 (100.0%) |
| Total | 863 (97.5%) | 804 (85.0%) |
Income Below Poverty Among Married-Couple Families in Browns Lake
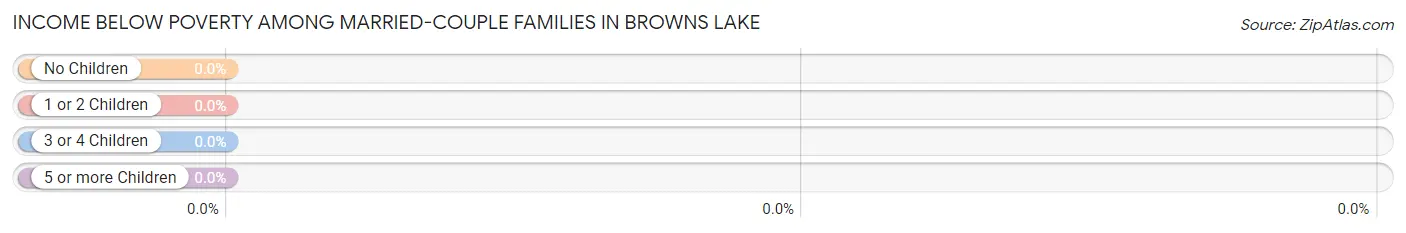
| Children | Above Poverty | Below Poverty |
| No Children | 444 (100.0%) | 0 (0.0%) |
| 1 or 2 Children | 32 (100.0%) | 0 (0.0%) |
| 3 or 4 Children | 0 (0.0%) | 0 (0.0%) |
| 5 or more Children | 0 (0.0%) | 0 (0.0%) |
| Total | 476 (100.0%) | 0 (0.0%) |
Income Below Poverty Among Single-Parent Households in Browns Lake
| Children | Single Father | Single Mother |
| No Children | 0 (0.0%) | 0 (0.0%) |
| 1 or 2 Children | 0 (0.0%) | 0 (0.0%) |
| 3 or 4 Children | 0 (0.0%) | 0 (0.0%) |
| 5 or more Children | 0 (0.0%) | 0 (0.0%) |
| Total | 0 (0.0%) | 0 (0.0%) |
Income Below Poverty Among Married-Couple vs Single-Parent Households in Browns Lake
| Children | Married-Couple Families | Single-Parent Households |
| No Children | 0 (0.0%) | 0 (0.0%) |
| 1 or 2 Children | 0 (0.0%) | 0 (0.0%) |
| 3 or 4 Children | 0 (0.0%) | 0 (0.0%) |
| 5 or more Children | 0 (0.0%) | 0 (0.0%) |
| Total | 0 (0.0%) | 0 (0.0%) |
Race in Browns Lake
The most populous races in Browns Lake are , and White / Caucasian (1,831 | 100.0%).
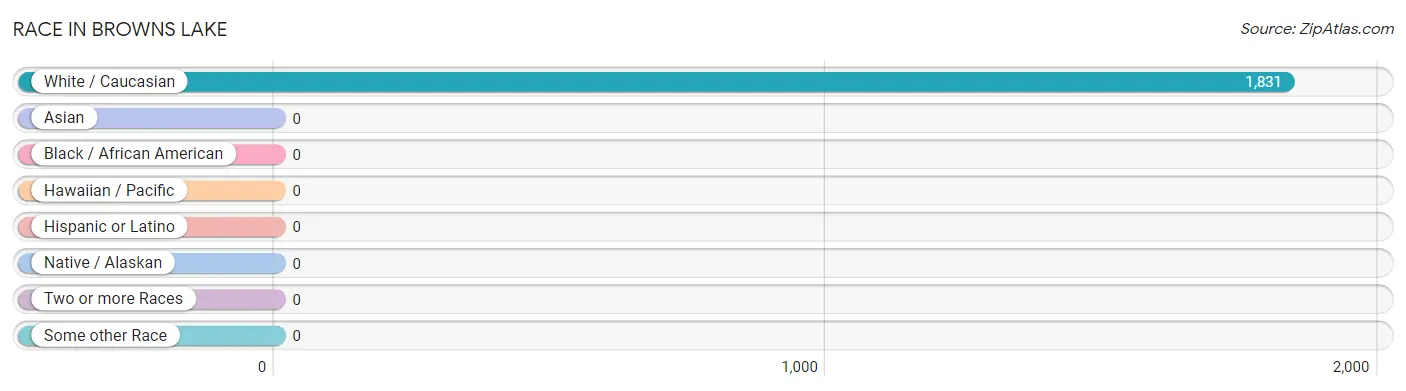
| Race | # Population | % Population |
| Asian | 0 | 0.0% |
| Black / African American | 0 | 0.0% |
| Hawaiian / Pacific | 0 | 0.0% |
| Hispanic or Latino | 0 | 0.0% |
| Native / Alaskan | 0 | 0.0% |
| White / Caucasian | 1,831 | 100.0% |
| Two or more Races | 0 | 0.0% |
| Some other Race | 0 | 0.0% |
| Total | 1,831 | 100.0% |
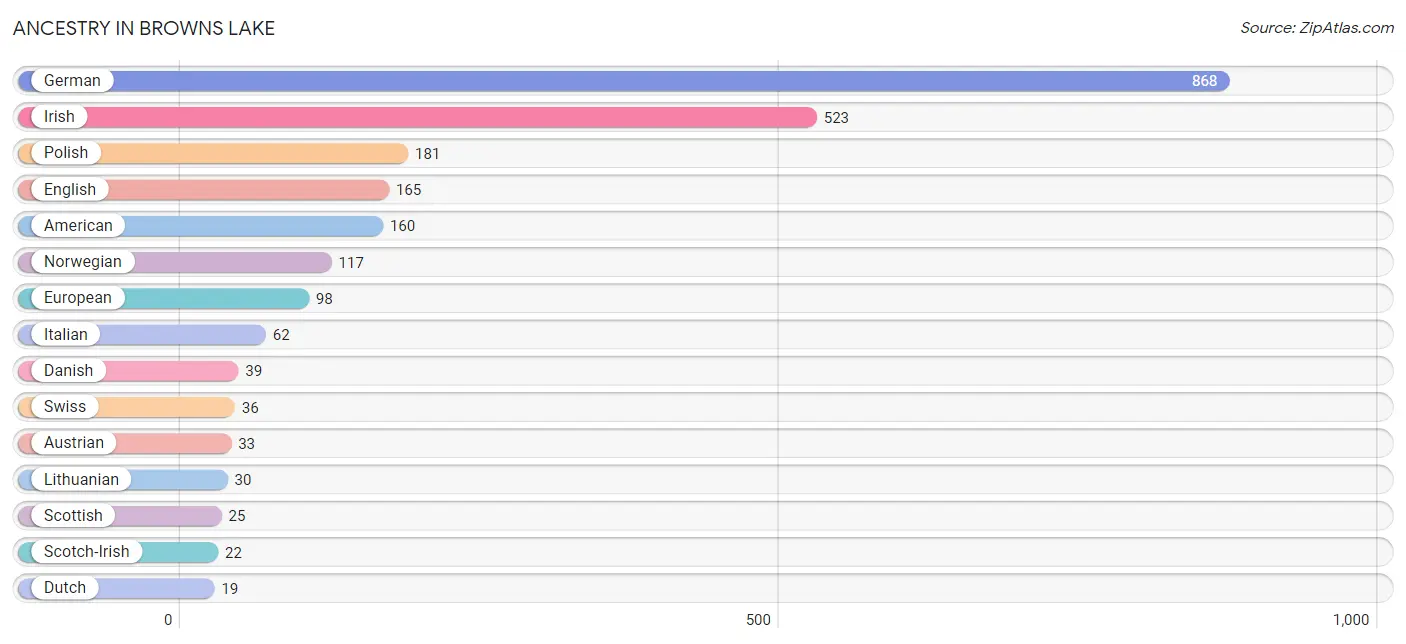
Ancestry in Browns Lake
The most populous ancestries reported in Browns Lake are German (868 | 47.4%), Irish (523 | 28.6%), Polish (181 | 9.9%), English (165 | 9.0%), and American (160 | 8.7%), together accounting for 103.6% of all Browns Lake residents.
| Ancestry | # Population | % Population |
| American | 160 | 8.7% |
| Austrian | 33 | 1.8% |
| Croatian | 15 | 0.8% |
| Danish | 39 | 2.1% |
| Dutch | 19 | 1.0% |
| English | 165 | 9.0% |
| European | 98 | 5.3% |
| German | 868 | 47.4% |
| Irish | 523 | 28.6% |
| Italian | 62 | 3.4% |
| Lithuanian | 30 | 1.6% |
| Norwegian | 117 | 6.4% |
| Polish | 181 | 9.9% |
| Portuguese | 16 | 0.9% |
| Scandinavian | 17 | 0.9% |
| Scotch-Irish | 22 | 1.2% |
| Scottish | 25 | 1.4% |
| Swiss | 36 | 2.0% |
| Ukrainian | 13 | 0.7% | View All 19 Rows |
Immigrants in Browns Lake
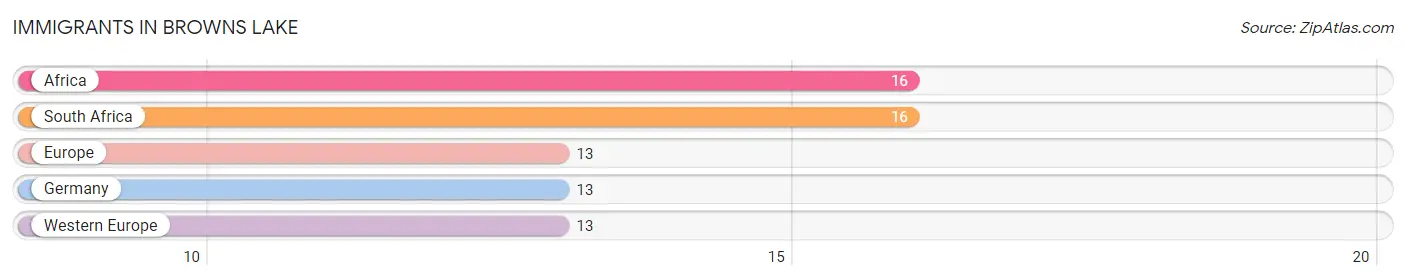
The most numerous immigrant groups reported in Browns Lake came from Africa (16 | 0.9%), South Africa (16 | 0.9%), Europe (13 | 0.7%), Germany (13 | 0.7%), and Western Europe (13 | 0.7%), together accounting for 3.9% of all Browns Lake residents.
| Immigration Origin | # Population | % Population |
| Africa | 16 | 0.9% |
| Europe | 13 | 0.7% |
| Germany | 13 | 0.7% |
| South Africa | 16 | 0.9% |
| Western Europe | 13 | 0.7% | View All 5 Rows |
Sex and Age in Browns Lake
Sex and Age in Browns Lake
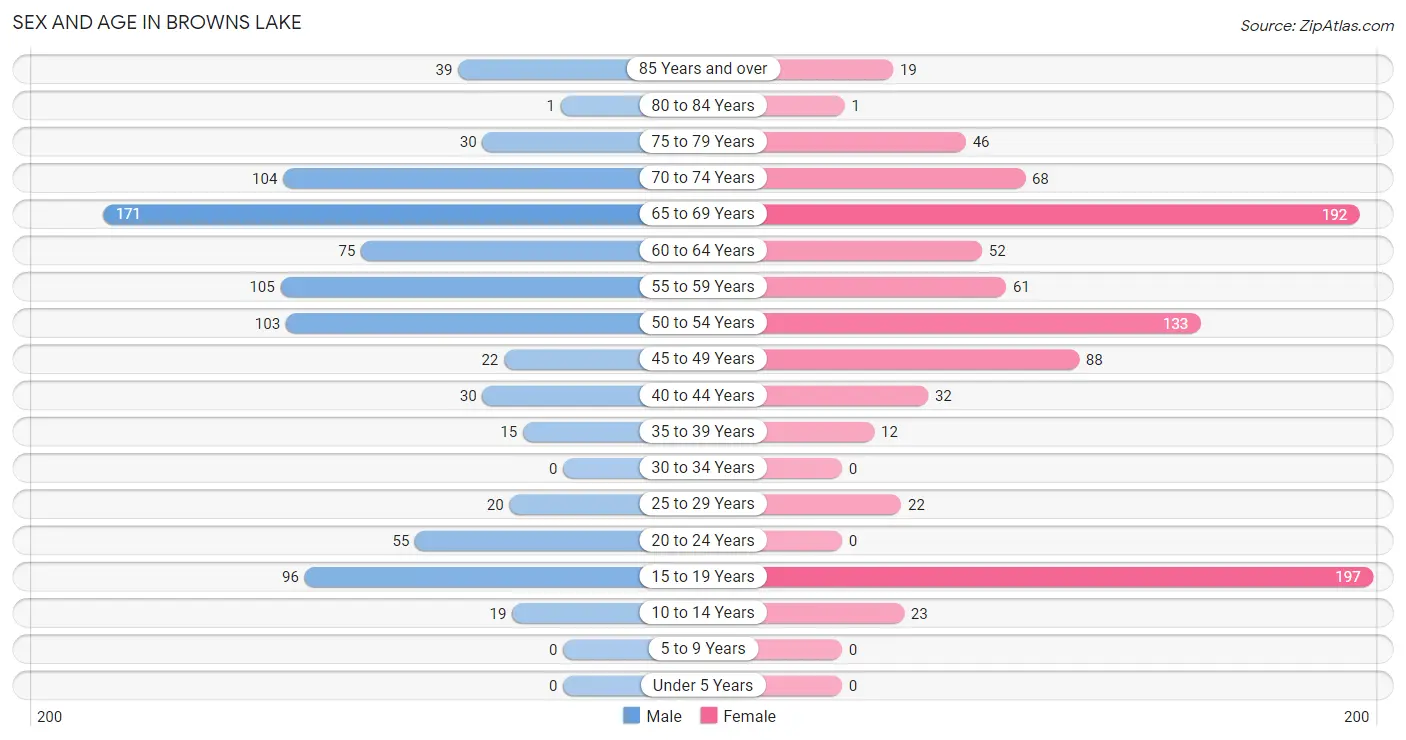
The most populous age groups in Browns Lake are 65 to 69 Years (171 | 19.3%) for men and 15 to 19 Years (197 | 20.8%) for women.
| Age Bracket | Male | Female |
| Under 5 Years | 0 (0.0%) | 0 (0.0%) |
| 5 to 9 Years | 0 (0.0%) | 0 (0.0%) |
| 10 to 14 Years | 19 (2.1%) | 23 (2.4%) |
| 15 to 19 Years | 96 (10.8%) | 197 (20.8%) |
| 20 to 24 Years | 55 (6.2%) | 0 (0.0%) |
| 25 to 29 Years | 20 (2.3%) | 22 (2.3%) |
| 30 to 34 Years | 0 (0.0%) | 0 (0.0%) |
| 35 to 39 Years | 15 (1.7%) | 12 (1.3%) |
| 40 to 44 Years | 30 (3.4%) | 32 (3.4%) |
| 45 to 49 Years | 22 (2.5%) | 88 (9.3%) |
| 50 to 54 Years | 103 (11.6%) | 133 (14.1%) |
| 55 to 59 Years | 105 (11.9%) | 61 (6.5%) |
| 60 to 64 Years | 75 (8.5%) | 52 (5.5%) |
| 65 to 69 Years | 171 (19.3%) | 192 (20.3%) |
| 70 to 74 Years | 104 (11.7%) | 68 (7.2%) |
| 75 to 79 Years | 30 (3.4%) | 46 (4.9%) |
| 80 to 84 Years | 1 (0.1%) | 1 (0.1%) |
| 85 Years and over | 39 (4.4%) | 19 (2.0%) |
| Total | 885 (100.0%) | 946 (100.0%) |
Families and Households in Browns Lake
Median Family Size in Browns Lake
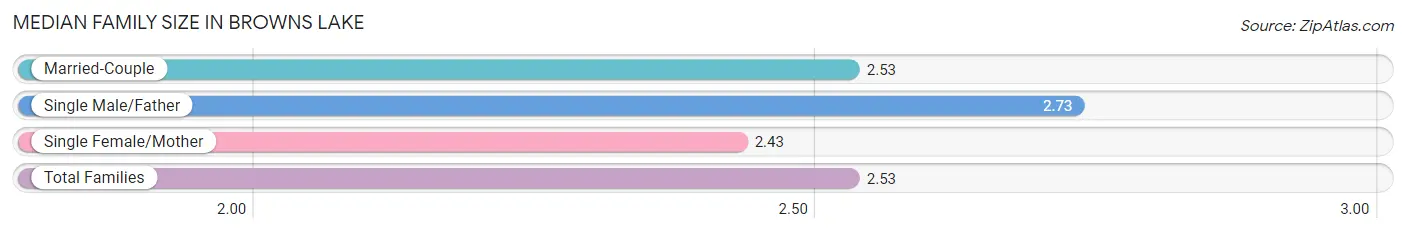
The median family size in Browns Lake is 2.53 persons per family, with single male/father families (22 | 4.1%) accounting for the largest median family size of 2.73 persons per family. On the other hand, single female/mother families (37 | 6.9%) represent the smallest median family size with 2.43 persons per family.
| Family Type | # Families | Family Size |
| Married-Couple | 476 (89.0%) | 2.53 |
| Single Male/Father | 22 (4.1%) | 2.73 |
| Single Female/Mother | 37 (6.9%) | 2.43 |
| Total Families | 535 (100.0%) | 2.53 |
Median Household Size in Browns Lake
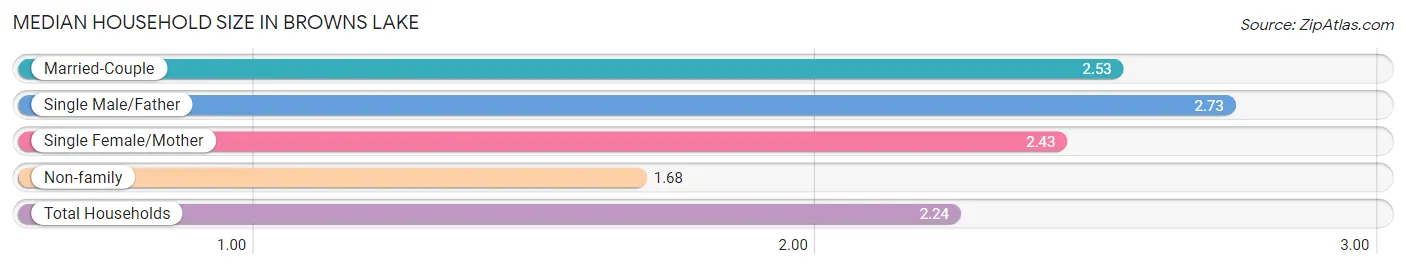
The median household size in Browns Lake is 2.24 persons per household, with single male/father households (22 | 2.7%) accounting for the largest median household size of 2.73 persons per household. non-family households (282 | 34.5%) represent the smallest median household size with 1.68 persons per household.
| Household Type | # Households | Household Size |
| Married-Couple | 476 (58.3%) | 2.53 |
| Single Male/Father | 22 (2.7%) | 2.73 |
| Single Female/Mother | 37 (4.5%) | 2.43 |
| Non-family | 282 (34.5%) | 1.68 |
| Total Households | 817 (100.0%) | 2.24 |
Household Size by Marriage Status in Browns Lake
Out of a total of 817 households in Browns Lake, 535 (65.5%) are family households, while 282 (34.5%) are nonfamily households. The most numerous type of family households are 2-person households, comprising 349, and the most common type of nonfamily households are 1-person households, comprising 224.
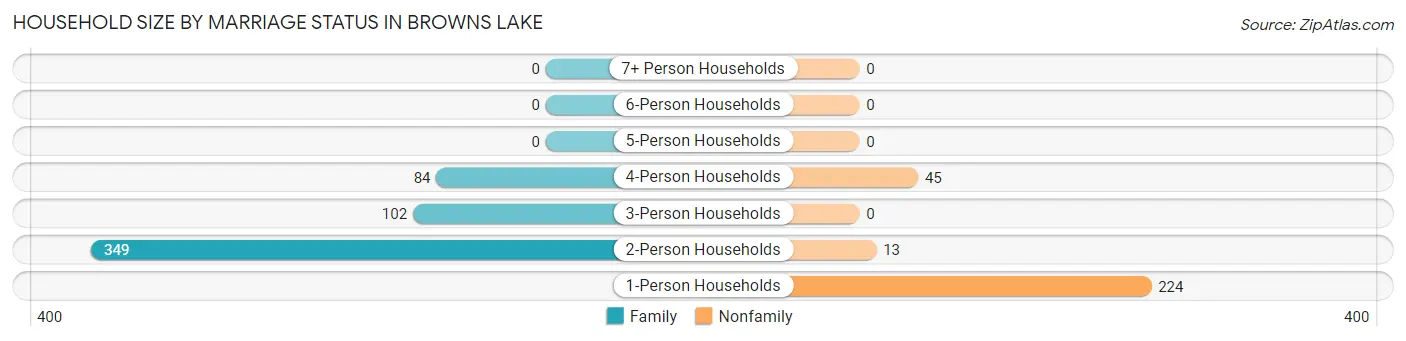
| Household Size | Family Households | Nonfamily Households |
| 1-Person Households | - | 224 (27.4%) |
| 2-Person Households | 349 (42.7%) | 13 (1.6%) |
| 3-Person Households | 102 (12.5%) | 0 (0.0%) |
| 4-Person Households | 84 (10.3%) | 45 (5.5%) |
| 5-Person Households | 0 (0.0%) | 0 (0.0%) |
| 6-Person Households | 0 (0.0%) | 0 (0.0%) |
| 7+ Person Households | 0 (0.0%) | 0 (0.0%) |
| Total | 535 (65.5%) | 282 (34.5%) |
Female Fertility in Browns Lake
Fertility by Age in Browns Lake
| Age Bracket | Women with Births | Births / 1,000 Women |
| 15 to 19 years | 0 (0.0%) | 0.0 |
| 20 to 34 years | 0 (0.0%) | 0.0 |
| 35 to 50 years | 0 (0.0%) | 0.0 |
| Total | 0 (0.0%) | 0.0 |
Fertility by Age by Marriage Status in Browns Lake
| Age Bracket | Married | Unmarried |
| 15 to 19 years | 0 (0.0%) | 0 (0.0%) |
| 20 to 34 years | 0 (0.0%) | 0 (0.0%) |
| 35 to 50 years | 0 (0.0%) | 0 (0.0%) |
| Total | 0 (0.0%) | 0 (0.0%) |
Fertility by Education in Browns Lake
| Educational Attainment | Women with Births | Births / 1,000 Women |
| Less than High School | 0 (0.0%) | 0.0 |
| High School Diploma | 0 (0.0%) | 0.0 |
| College or Associate's Degree | 0 (0.0%) | 0.0 |
| Bachelor's Degree | 0 (0.0%) | 0.0 |
| Graduate Degree | 0 (0.0%) | 0.0 |
| Total | 0 (0.0%) | 0.0 |
Fertility by Education by Marriage Status in Browns Lake
| Educational Attainment | Married | Unmarried |
| Less than High School | 0 (0.0%) | 0 (0.0%) |
| High School Diploma | 0 (0.0%) | 0 (0.0%) |
| College or Associate's Degree | 0 (0.0%) | 0 (0.0%) |
| Bachelor's Degree | 0 (0.0%) | 0 (0.0%) |
| Graduate Degree | 0 (0.0%) | 0 (0.0%) |
| Total | 0 (0.0%) | 0 (0.0%) |
Employment Characteristics in Browns Lake
Employment by Class of Employer in Browns Lake
Among the 865 employed individuals in Browns Lake, private company employees (631 | 73.0%), not-for-profit organizations (106 | 12.2%), and self-employed (incorporated) (84 | 9.7%) make up the most common classes of employment.
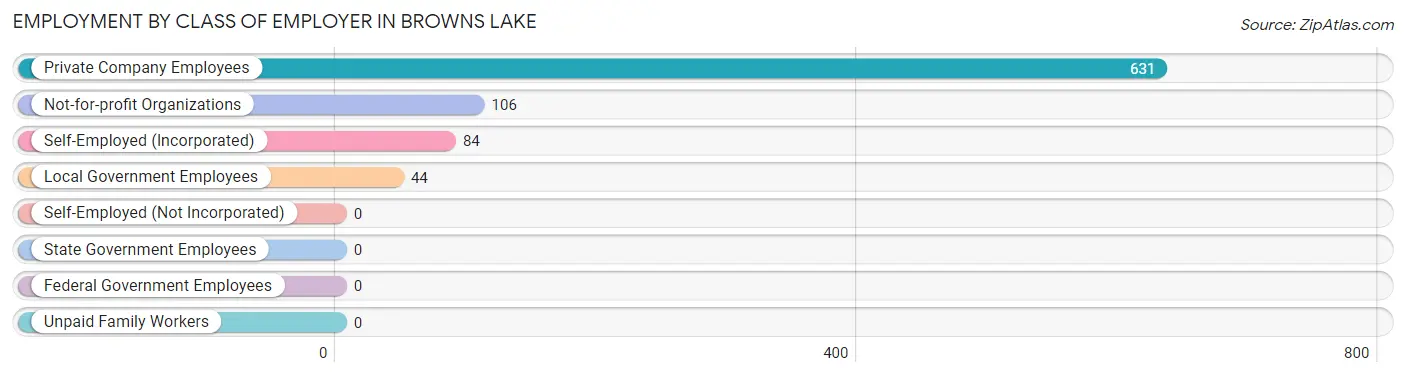
| Employer Class | # Employees | % Employees |
| Private Company Employees | 631 | 73.0% |
| Self-Employed (Incorporated) | 84 | 9.7% |
| Self-Employed (Not Incorporated) | 0 | 0.0% |
| Not-for-profit Organizations | 106 | 12.2% |
| Local Government Employees | 44 | 5.1% |
| State Government Employees | 0 | 0.0% |
| Federal Government Employees | 0 | 0.0% |
| Unpaid Family Workers | 0 | 0.0% |
| Total | 865 | 100.0% |
Employment Status by Age in Browns Lake
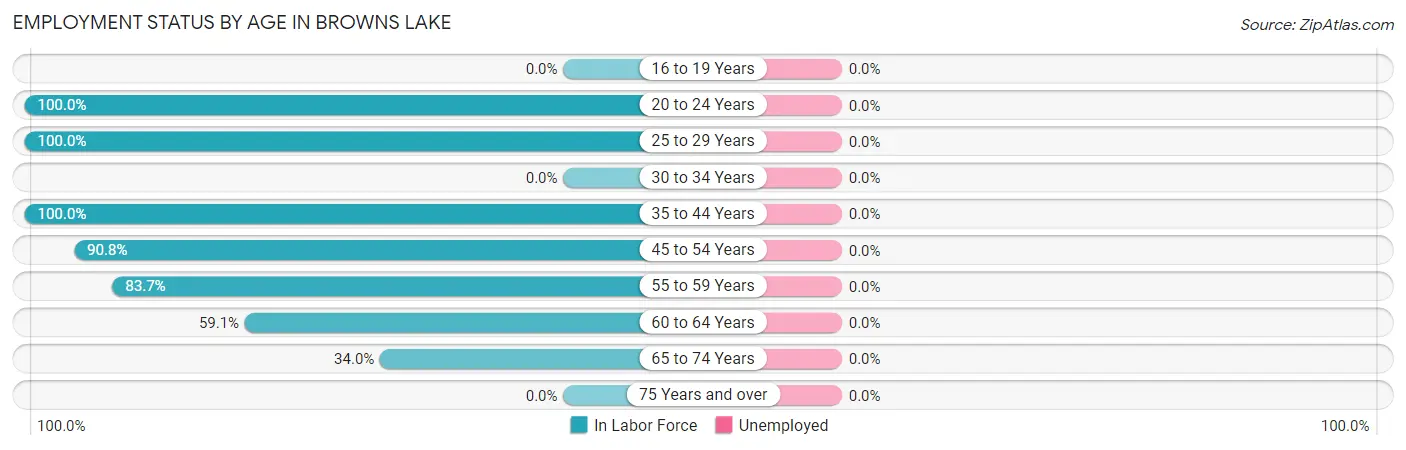
| Age Bracket | In Labor Force | Unemployed |
| 16 to 19 Years | 0 (0.0%) | 0 (0.0%) |
| 20 to 24 Years | 55 (100.0%) | 0 (0.0%) |
| 25 to 29 Years | 42 (100.0%) | 0 (0.0%) |
| 30 to 34 Years | 0 (0.0%) | 0 (0.0%) |
| 35 to 44 Years | 89 (100.0%) | 0 (0.0%) |
| 45 to 54 Years | 314 (90.8%) | 0 (0.0%) |
| 55 to 59 Years | 139 (83.7%) | 0 (0.0%) |
| 60 to 64 Years | 75 (59.1%) | 0 (0.0%) |
| 65 to 74 Years | 182 (34.0%) | 0 (0.0%) |
| 75 Years and over | 0 (0.0%) | 0 (0.0%) |
| Total | 896 (52.2%) | 0 (0.0%) |
Employment Status by Educational Attainment in Browns Lake
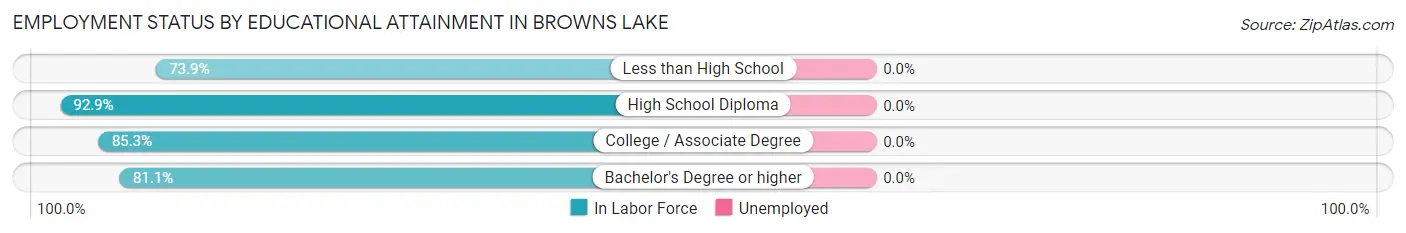
| Educational Attainment | In Labor Force | Unemployed |
| Less than High School | 34 (73.9%) | 0 (0.0%) |
| High School Diploma | 237 (92.9%) | 0 (0.0%) |
| College / Associate Degree | 157 (85.3%) | 0 (0.0%) |
| Bachelor's Degree or higher | 231 (81.1%) | 0 (0.0%) |
| Total | 659 (85.6%) | 0 (0.0%) |
Employment Occupations by Sex in Browns Lake
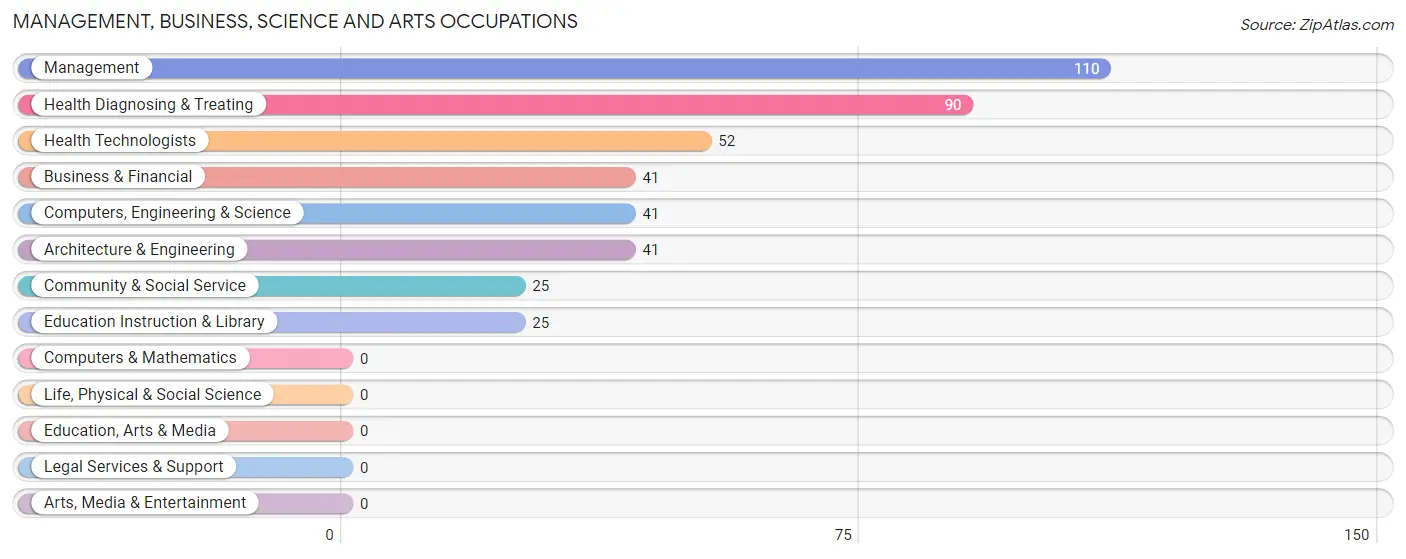
Management, Business, Science and Arts Occupations
The most common Management, Business, Science and Arts occupations in Browns Lake are Management (110 | 12.3%), Health Diagnosing & Treating (90 | 10.0%), Health Technologists (52 | 5.8%), Business & Financial (41 | 4.6%), and Computers, Engineering & Science (41 | 4.6%).
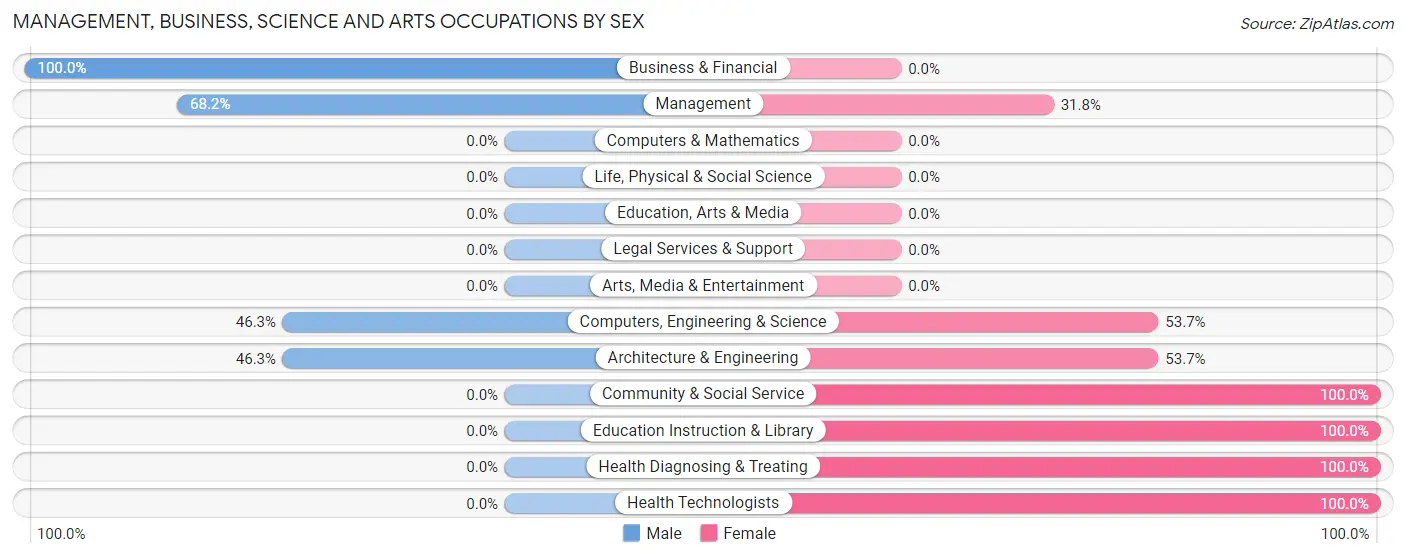
Management, Business, Science and Arts Occupations by Sex
Within the Management, Business, Science and Arts occupations in Browns Lake, the most male-oriented occupations are Business & Financial (100.0%), Management (68.2%), and Computers, Engineering & Science (46.3%), while the most female-oriented occupations are Community & Social Service (100.0%), Education Instruction & Library (100.0%), and Health Diagnosing & Treating (100.0%).
| Occupation | Male | Female |
| Management | 75 (68.2%) | 35 (31.8%) |
| Business & Financial | 41 (100.0%) | 0 (0.0%) |
| Computers, Engineering & Science | 19 (46.3%) | 22 (53.7%) |
| Computers & Mathematics | 0 (0.0%) | 0 (0.0%) |
| Architecture & Engineering | 19 (46.3%) | 22 (53.7%) |
| Life, Physical & Social Science | 0 (0.0%) | 0 (0.0%) |
| Community & Social Service | 0 (0.0%) | 25 (100.0%) |
| Education, Arts & Media | 0 (0.0%) | 0 (0.0%) |
| Legal Services & Support | 0 (0.0%) | 0 (0.0%) |
| Education Instruction & Library | 0 (0.0%) | 25 (100.0%) |
| Arts, Media & Entertainment | 0 (0.0%) | 0 (0.0%) |
| Health Diagnosing & Treating | 0 (0.0%) | 90 (100.0%) |
| Health Technologists | 0 (0.0%) | 52 (100.0%) |
| Total (Category) | 135 (44.0%) | 172 (56.0%) |
| Total (Overall) | 525 (58.6%) | 371 (41.4%) |
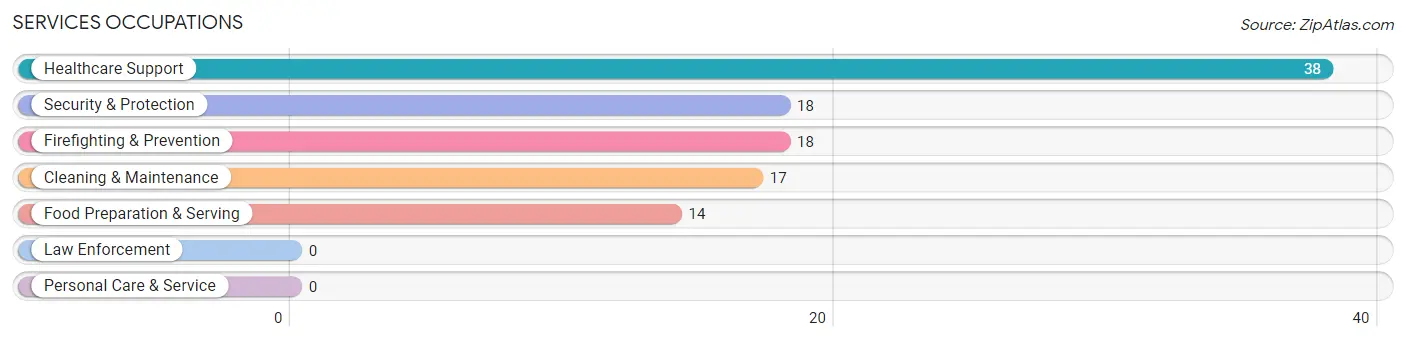
Services Occupations
The most common Services occupations in Browns Lake are Healthcare Support (38 | 4.2%), Security & Protection (18 | 2.0%), Firefighting & Prevention (18 | 2.0%), Cleaning & Maintenance (17 | 1.9%), and Food Preparation & Serving (14 | 1.6%).
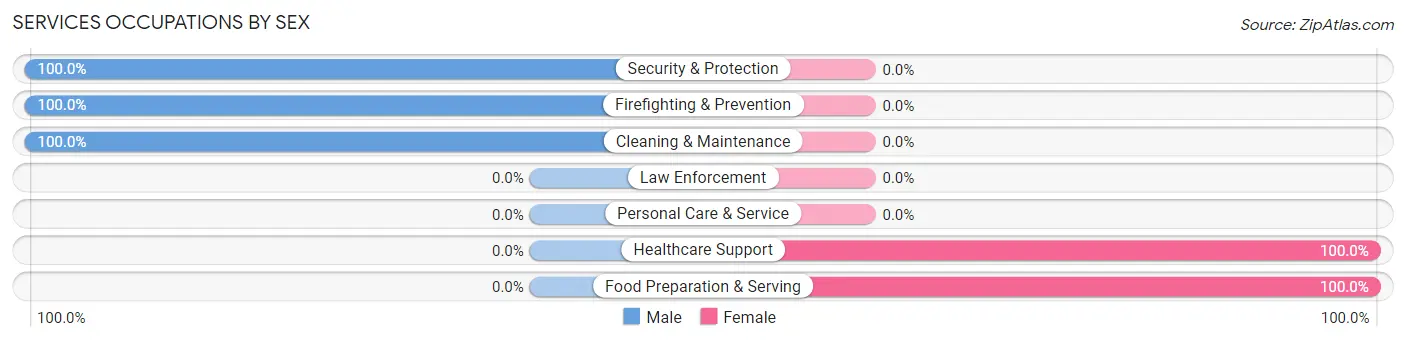
Services Occupations by Sex
Within the Services occupations in Browns Lake, the most male-oriented occupations are Security & Protection (100.0%), Firefighting & Prevention (100.0%), and Cleaning & Maintenance (100.0%), while the most female-oriented occupations are Healthcare Support (100.0%), and Food Preparation & Serving (100.0%).
| Occupation | Male | Female |
| Healthcare Support | 0 (0.0%) | 38 (100.0%) |
| Security & Protection | 18 (100.0%) | 0 (0.0%) |
| Firefighting & Prevention | 18 (100.0%) | 0 (0.0%) |
| Law Enforcement | 0 (0.0%) | 0 (0.0%) |
| Food Preparation & Serving | 0 (0.0%) | 14 (100.0%) |
| Cleaning & Maintenance | 17 (100.0%) | 0 (0.0%) |
| Personal Care & Service | 0 (0.0%) | 0 (0.0%) |
| Total (Category) | 35 (40.2%) | 52 (59.8%) |
| Total (Overall) | 525 (58.6%) | 371 (41.4%) |
Sales and Office Occupations
The most common Sales and Office occupations in Browns Lake are Office & Administration (120 | 13.4%), and Sales & Related (56 | 6.2%).
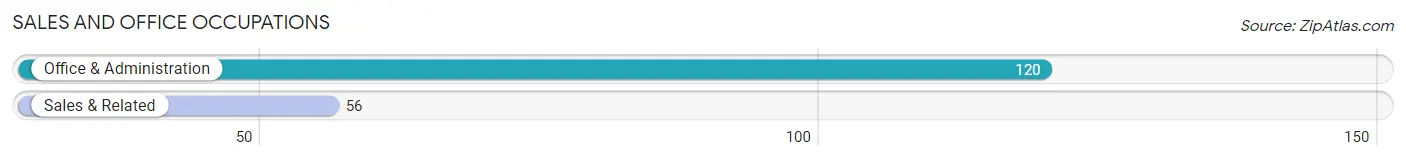
Sales and Office Occupations by Sex
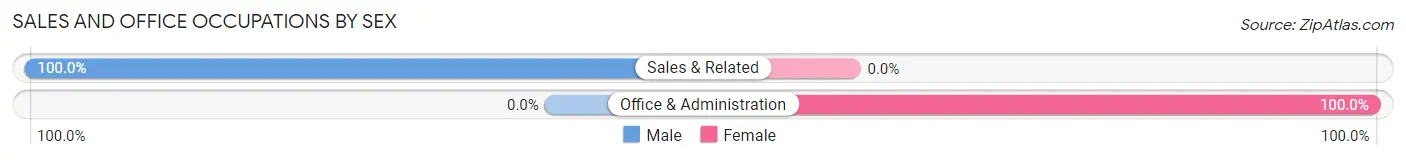
| Occupation | Male | Female |
| Sales & Related | 56 (100.0%) | 0 (0.0%) |
| Office & Administration | 0 (0.0%) | 120 (100.0%) |
| Total (Category) | 56 (31.8%) | 120 (68.2%) |
| Total (Overall) | 525 (58.6%) | 371 (41.4%) |
Natural Resources, Construction and Maintenance Occupations
The most common Natural Resources, Construction and Maintenance occupations in Browns Lake are Installation, Maintenance & Repair (45 | 5.0%), and Construction & Extraction (34 | 3.8%).
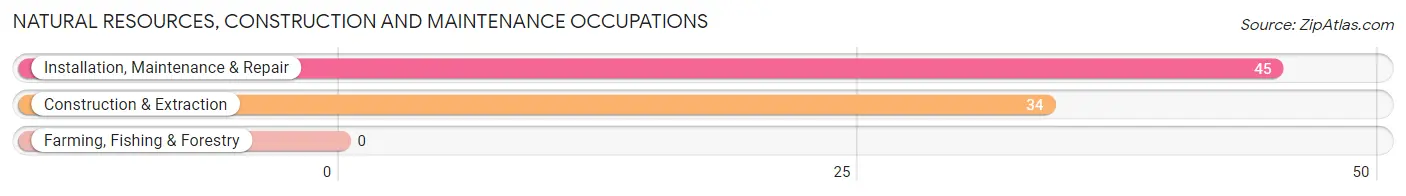
Natural Resources, Construction and Maintenance Occupations by Sex
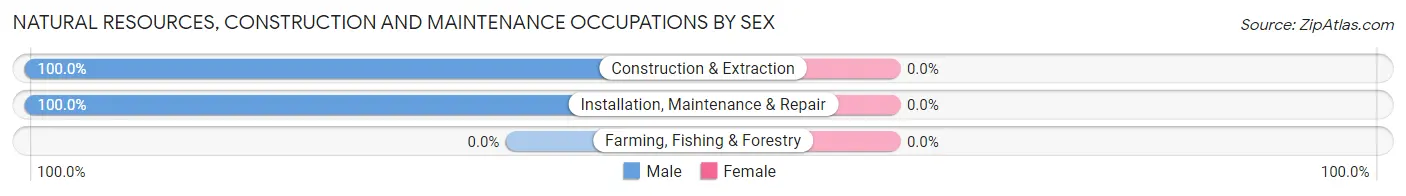
| Occupation | Male | Female |
| Farming, Fishing & Forestry | 0 (0.0%) | 0 (0.0%) |
| Construction & Extraction | 34 (100.0%) | 0 (0.0%) |
| Installation, Maintenance & Repair | 45 (100.0%) | 0 (0.0%) |
| Total (Category) | 79 (100.0%) | 0 (0.0%) |
| Total (Overall) | 525 (58.6%) | 371 (41.4%) |
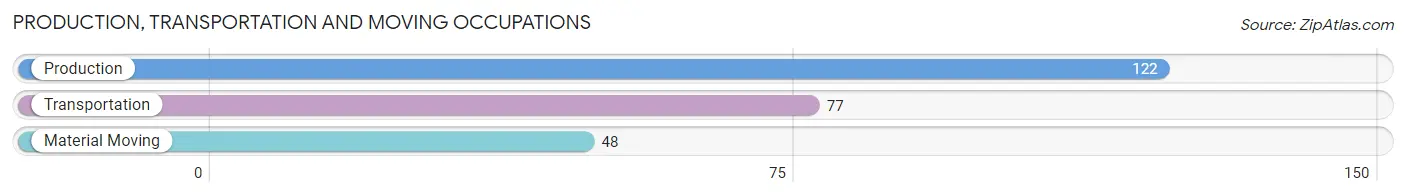
Production, Transportation and Moving Occupations
The most common Production, Transportation and Moving occupations in Browns Lake are Production (122 | 13.6%), Transportation (77 | 8.6%), and Material Moving (48 | 5.4%).
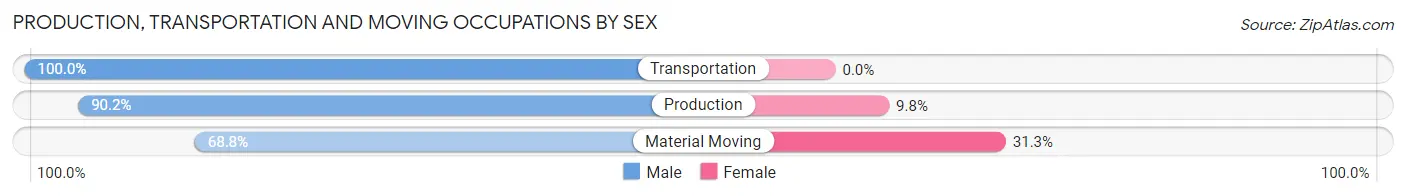
Production, Transportation and Moving Occupations by Sex
| Occupation | Male | Female |
| Production | 110 (90.2%) | 12 (9.8%) |
| Transportation | 77 (100.0%) | 0 (0.0%) |
| Material Moving | 33 (68.8%) | 15 (31.2%) |
| Total (Category) | 220 (89.1%) | 27 (10.9%) |
| Total (Overall) | 525 (58.6%) | 371 (41.4%) |
Employment Industries by Sex in Browns Lake
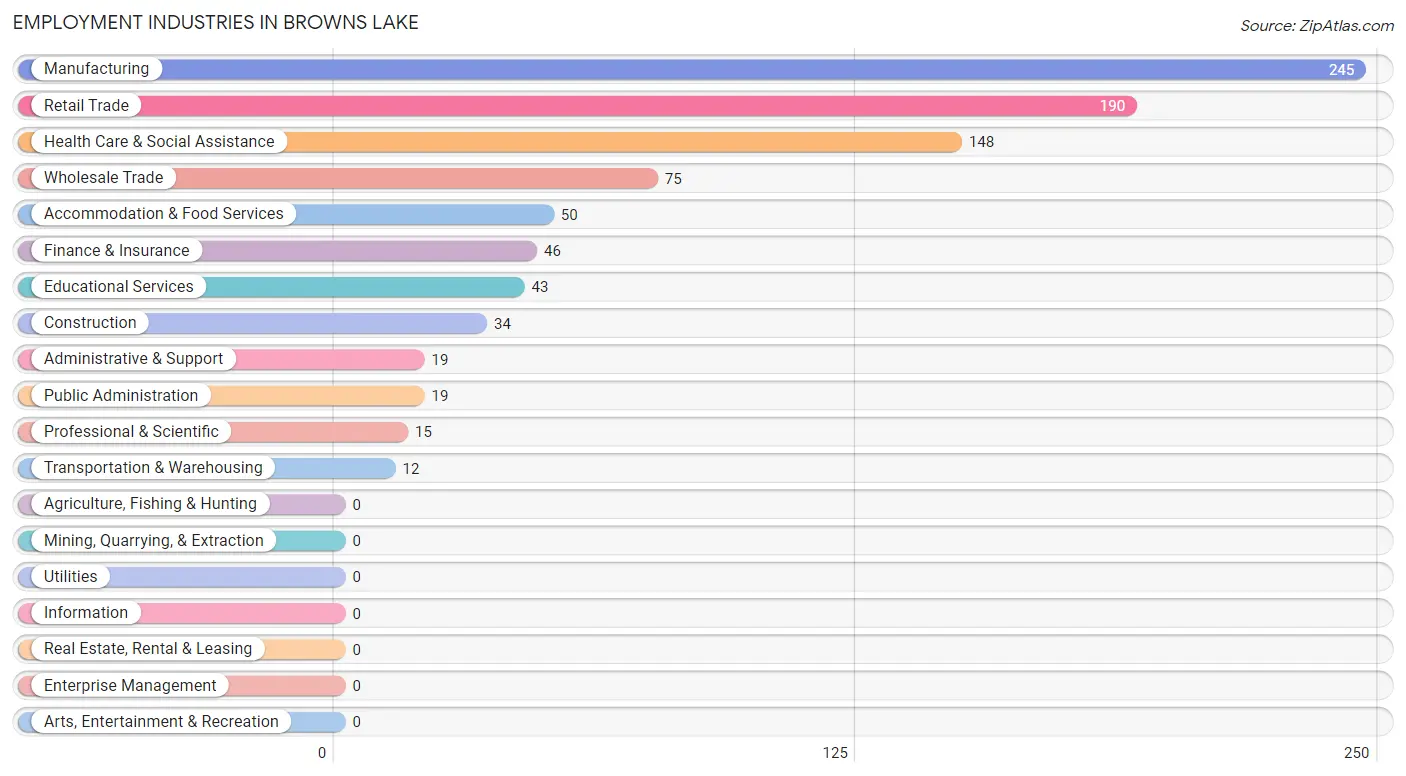
Employment Industries in Browns Lake
The major employment industries in Browns Lake include Manufacturing (245 | 27.3%), Retail Trade (190 | 21.2%), Health Care & Social Assistance (148 | 16.5%), Wholesale Trade (75 | 8.4%), and Accommodation & Food Services (50 | 5.6%).
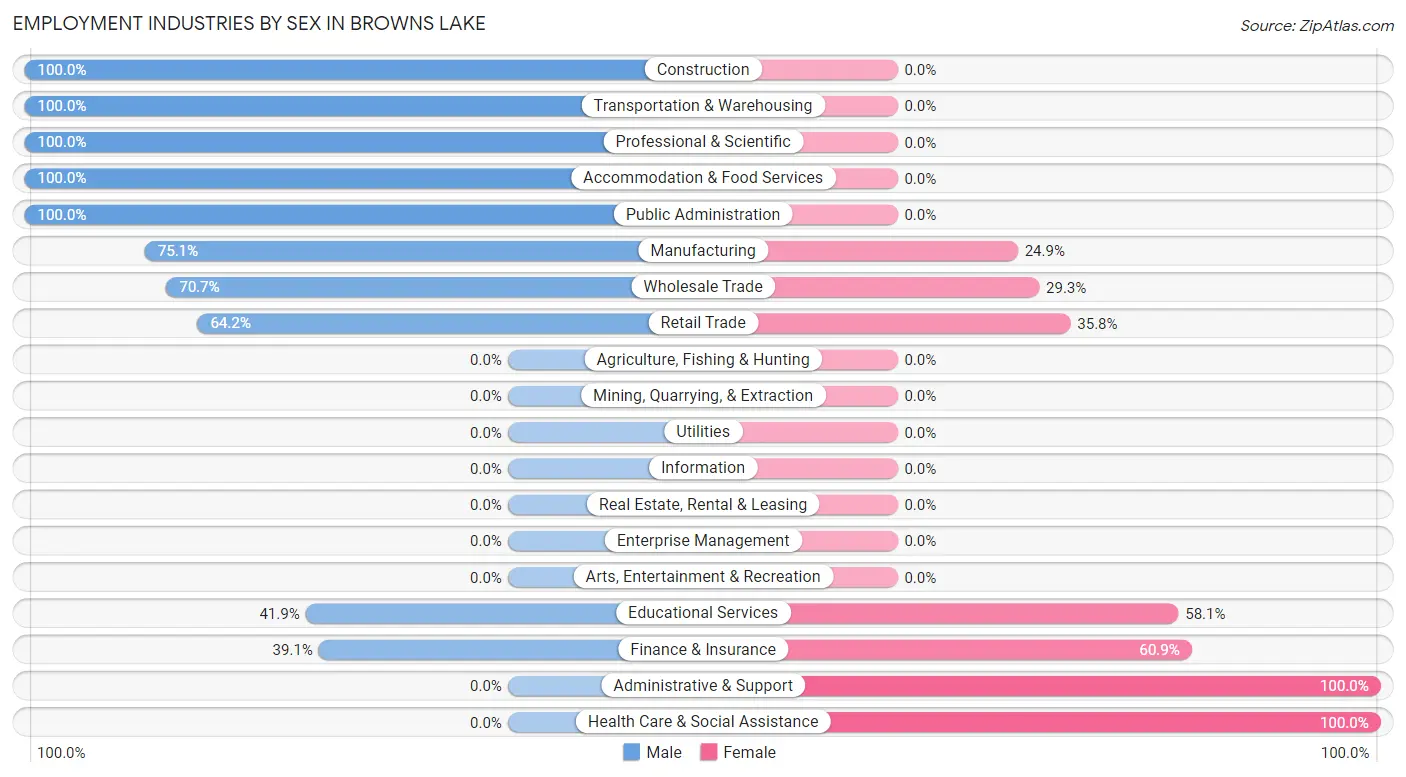
Employment Industries by Sex in Browns Lake
The Browns Lake industries that see more men than women are Construction (100.0%), Transportation & Warehousing (100.0%), and Professional & Scientific (100.0%), whereas the industries that tend to have a higher number of women are Administrative & Support (100.0%), Health Care & Social Assistance (100.0%), and Finance & Insurance (60.9%).
| Industry | Male | Female |
| Agriculture, Fishing & Hunting | 0 (0.0%) | 0 (0.0%) |
| Mining, Quarrying, & Extraction | 0 (0.0%) | 0 (0.0%) |
| Construction | 34 (100.0%) | 0 (0.0%) |
| Manufacturing | 184 (75.1%) | 61 (24.9%) |
| Wholesale Trade | 53 (70.7%) | 22 (29.3%) |
| Retail Trade | 122 (64.2%) | 68 (35.8%) |
| Transportation & Warehousing | 12 (100.0%) | 0 (0.0%) |
| Utilities | 0 (0.0%) | 0 (0.0%) |
| Information | 0 (0.0%) | 0 (0.0%) |
| Finance & Insurance | 18 (39.1%) | 28 (60.9%) |
| Real Estate, Rental & Leasing | 0 (0.0%) | 0 (0.0%) |
| Professional & Scientific | 15 (100.0%) | 0 (0.0%) |
| Enterprise Management | 0 (0.0%) | 0 (0.0%) |
| Administrative & Support | 0 (0.0%) | 19 (100.0%) |
| Educational Services | 18 (41.9%) | 25 (58.1%) |
| Health Care & Social Assistance | 0 (0.0%) | 148 (100.0%) |
| Arts, Entertainment & Recreation | 0 (0.0%) | 0 (0.0%) |
| Accommodation & Food Services | 50 (100.0%) | 0 (0.0%) |
| Public Administration | 19 (100.0%) | 0 (0.0%) |
| Total | 525 (58.6%) | 371 (41.4%) |
Education in Browns Lake
School Enrollment in Browns Lake
The most common levels of schooling among the 370 students in Browns Lake are high school (253 | 68.4%), college / undergraduate (75 | 20.3%), and middle school (42 | 11.4%).
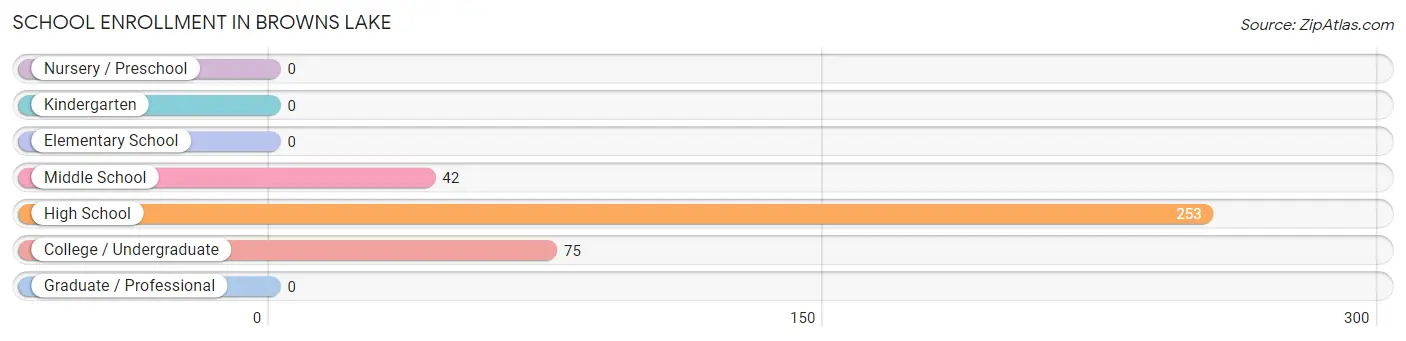
| School Level | # Students | % Students |
| Nursery / Preschool | 0 | 0.0% |
| Kindergarten | 0 | 0.0% |
| Elementary School | 0 | 0.0% |
| Middle School | 42 | 11.4% |
| High School | 253 | 68.4% |
| College / Undergraduate | 75 | 20.3% |
| Graduate / Professional | 0 | 0.0% |
| Total | 370 | 100.0% |
School Enrollment by Age by Funding Source in Browns Lake
Out of a total of 370 students who are enrolled in schools in Browns Lake, 19 (5.1%) attend a private institution, while the remaining 351 (94.9%) are enrolled in public schools. The age group of 15 to 17 year olds has the highest likelihood of being enrolled in private schools, with 19 (10.6% in the age bracket) enrolled. Conversely, the age group of 10 to 14 year olds has the lowest likelihood of being enrolled in a private school, with 42 (100.0% in the age bracket) attending a public institution.
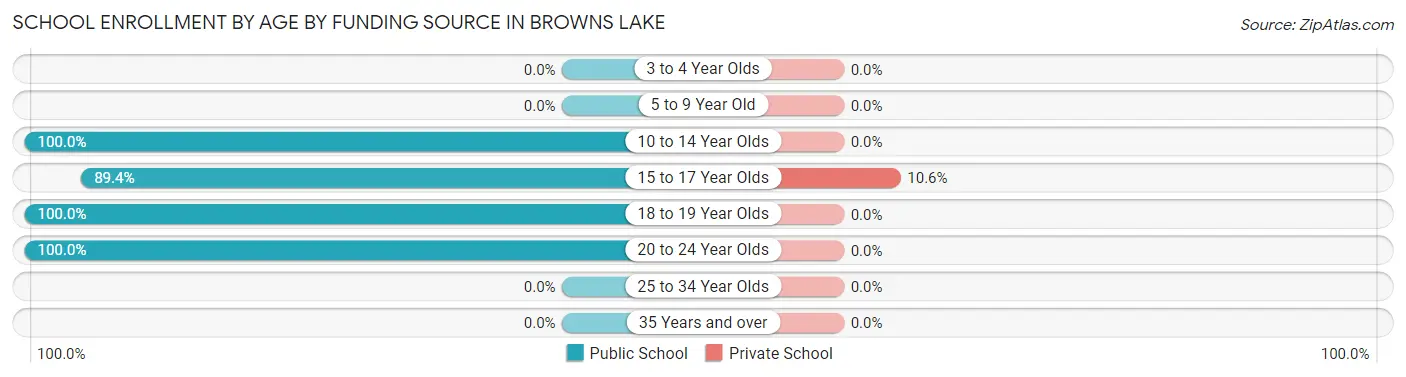
| Age Bracket | Public School | Private School |
| 3 to 4 Year Olds | 0 (0.0%) | 0 (0.0%) |
| 5 to 9 Year Old | 0 (0.0%) | 0 (0.0%) |
| 10 to 14 Year Olds | 42 (100.0%) | 0 (0.0%) |
| 15 to 17 Year Olds | 161 (89.4%) | 19 (10.6%) |
| 18 to 19 Year Olds | 93 (100.0%) | 0 (0.0%) |
| 20 to 24 Year Olds | 55 (100.0%) | 0 (0.0%) |
| 25 to 34 Year Olds | 0 (0.0%) | 0 (0.0%) |
| 35 Years and over | 0 (0.0%) | 0 (0.0%) |
| Total | 351 (94.9%) | 19 (5.1%) |
Educational Attainment by Field of Study in Browns Lake
Education (106 | 20.2%), business (99 | 18.9%), social sciences (67 | 12.8%), arts & humanities (58 | 11.1%), and liberal arts & history (52 | 9.9%) are the most common fields of study among 525 individuals in Browns Lake who have obtained a bachelor's degree or higher.
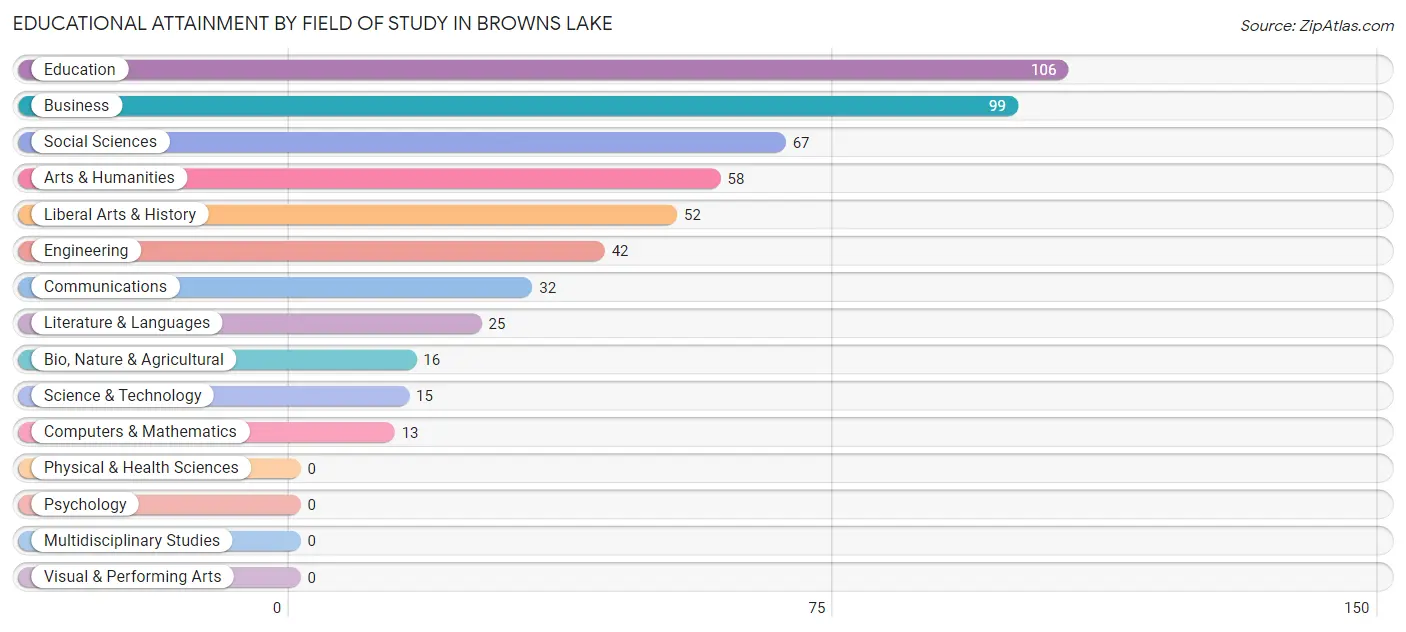
| Field of Study | # Graduates | % Graduates |
| Computers & Mathematics | 13 | 2.5% |
| Bio, Nature & Agricultural | 16 | 3.0% |
| Physical & Health Sciences | 0 | 0.0% |
| Psychology | 0 | 0.0% |
| Social Sciences | 67 | 12.8% |
| Engineering | 42 | 8.0% |
| Multidisciplinary Studies | 0 | 0.0% |
| Science & Technology | 15 | 2.9% |
| Business | 99 | 18.9% |
| Education | 106 | 20.2% |
| Literature & Languages | 25 | 4.8% |
| Liberal Arts & History | 52 | 9.9% |
| Visual & Performing Arts | 0 | 0.0% |
| Communications | 32 | 6.1% |
| Arts & Humanities | 58 | 11.1% |
| Total | 525 | 100.0% |
Transportation & Commute in Browns Lake
Vehicle Availability by Sex in Browns Lake
The most prevalent vehicle ownership categories in Browns Lake are males with 5 or more vehicles (169, accounting for 33.1%) and females with 5 or more vehicles (90, making up 47.6%).
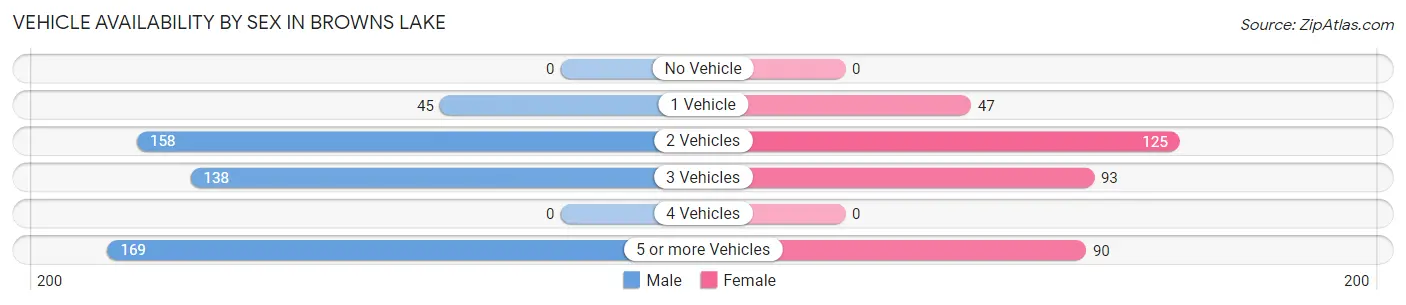
| Vehicles Available | Male | Female |
| No Vehicle | 0 (0.0%) | 0 (0.0%) |
| 1 Vehicle | 45 (8.8%) | 47 (13.2%) |
| 2 Vehicles | 158 (31.0%) | 125 (35.2%) |
| 3 Vehicles | 138 (27.1%) | 93 (26.2%) |
| 4 Vehicles | 0 (0.0%) | 0 (0.0%) |
| 5 or more Vehicles | 169 (33.1%) | 90 (25.4%) |
| Total | 510 (100.0%) | 355 (100.0%) |
Commute Time in Browns Lake
The most frequently occuring commute durations in Browns Lake are 5 to 9 minutes (143 commuters, 18.4%), 35 to 39 minutes (120 commuters, 15.5%), and 15 to 19 minutes (93 commuters, 12.0%).
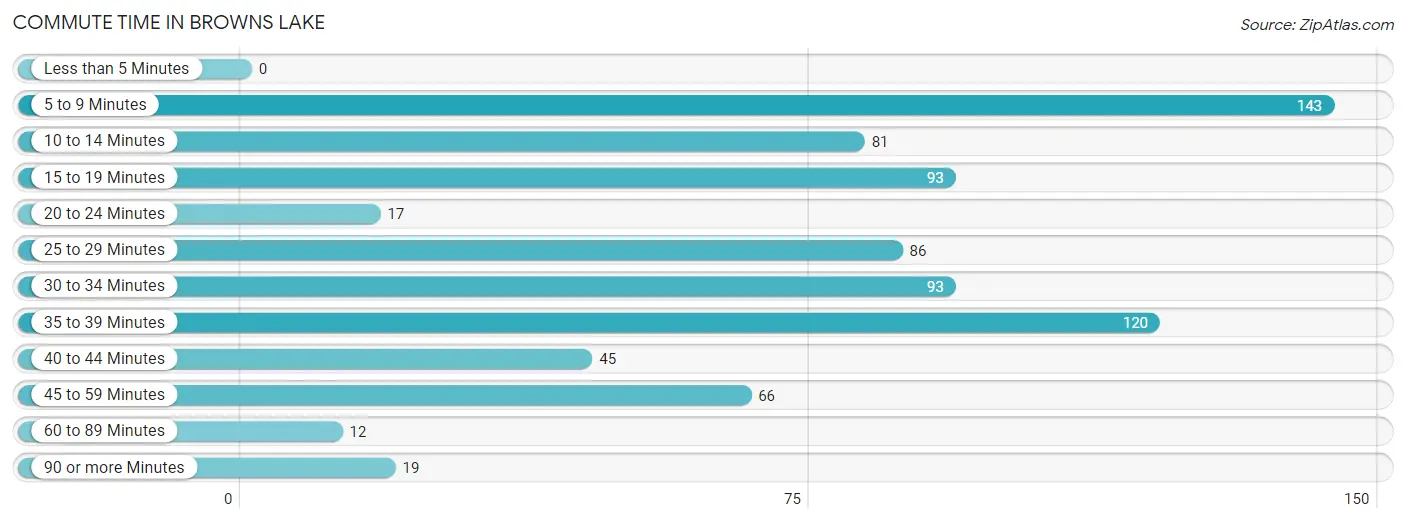
| Commute Time | # Commuters | % Commuters |
| Less than 5 Minutes | 0 | 0.0% |
| 5 to 9 Minutes | 143 | 18.4% |
| 10 to 14 Minutes | 81 | 10.4% |
| 15 to 19 Minutes | 93 | 12.0% |
| 20 to 24 Minutes | 17 | 2.2% |
| 25 to 29 Minutes | 86 | 11.1% |
| 30 to 34 Minutes | 93 | 12.0% |
| 35 to 39 Minutes | 120 | 15.5% |
| 40 to 44 Minutes | 45 | 5.8% |
| 45 to 59 Minutes | 66 | 8.5% |
| 60 to 89 Minutes | 12 | 1.5% |
| 90 or more Minutes | 19 | 2.5% |
Commute Time by Sex in Browns Lake
The most common commute times in Browns Lake are 35 to 39 minutes (120 commuters, 25.2%) for males and 5 to 9 minutes (98 commuters, 32.9%) for females.
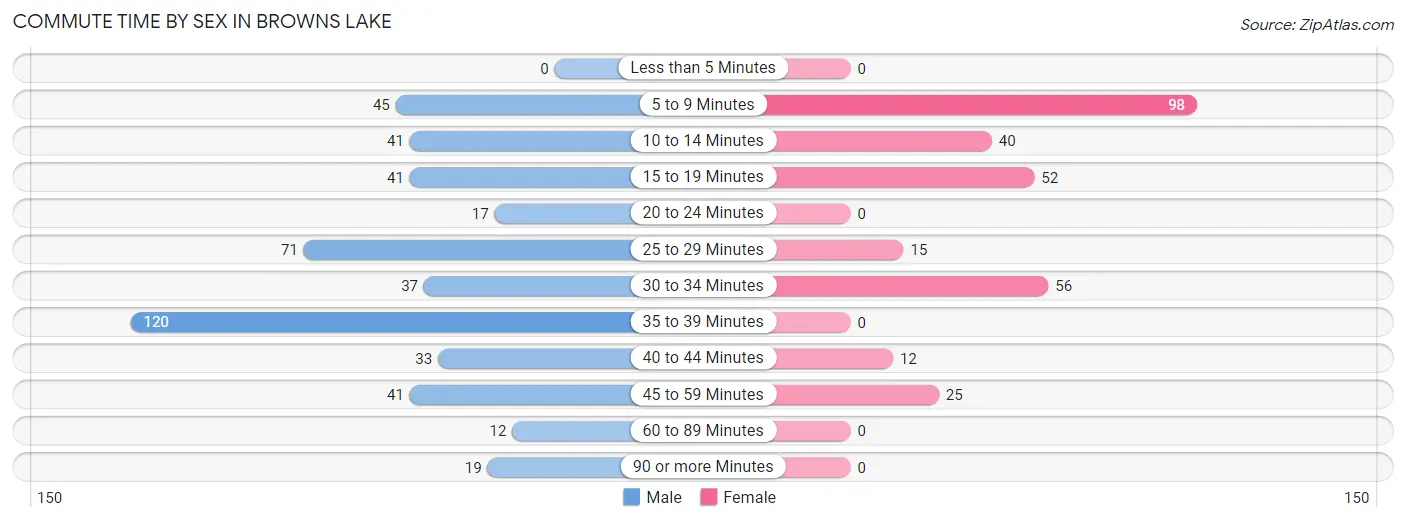
| Commute Time | Male | Female |
| Less than 5 Minutes | 0 (0.0%) | 0 (0.0%) |
| 5 to 9 Minutes | 45 (9.4%) | 98 (32.9%) |
| 10 to 14 Minutes | 41 (8.6%) | 40 (13.4%) |
| 15 to 19 Minutes | 41 (8.6%) | 52 (17.4%) |
| 20 to 24 Minutes | 17 (3.6%) | 0 (0.0%) |
| 25 to 29 Minutes | 71 (14.9%) | 15 (5.0%) |
| 30 to 34 Minutes | 37 (7.8%) | 56 (18.8%) |
| 35 to 39 Minutes | 120 (25.2%) | 0 (0.0%) |
| 40 to 44 Minutes | 33 (6.9%) | 12 (4.0%) |
| 45 to 59 Minutes | 41 (8.6%) | 25 (8.4%) |
| 60 to 89 Minutes | 12 (2.5%) | 0 (0.0%) |
| 90 or more Minutes | 19 (4.0%) | 0 (0.0%) |
Time of Departure to Work by Sex in Browns Lake
The most frequent times of departure to work in Browns Lake are 5:30 AM to 5:59 AM (129, 27.0%) for males and 7:30 AM to 7:59 AM (66, 22.2%) for females.
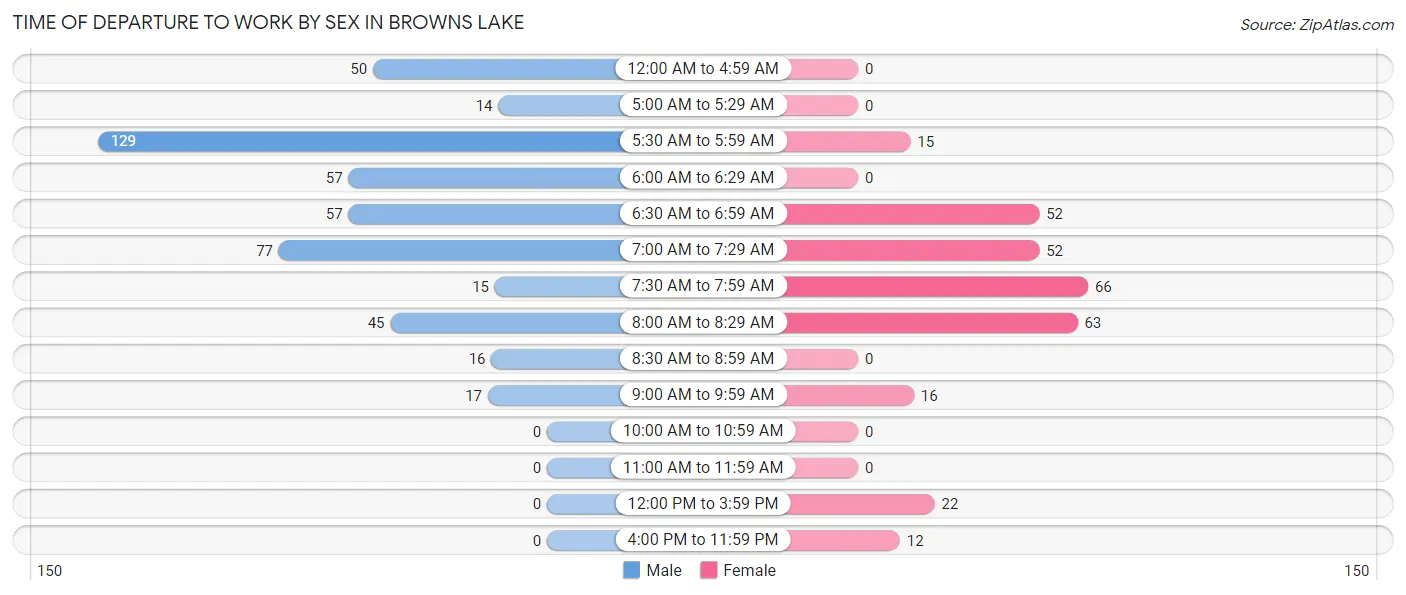
| Time of Departure | Male | Female |
| 12:00 AM to 4:59 AM | 50 (10.5%) | 0 (0.0%) |
| 5:00 AM to 5:29 AM | 14 (2.9%) | 0 (0.0%) |
| 5:30 AM to 5:59 AM | 129 (27.0%) | 15 (5.0%) |
| 6:00 AM to 6:29 AM | 57 (11.9%) | 0 (0.0%) |
| 6:30 AM to 6:59 AM | 57 (11.9%) | 52 (17.4%) |
| 7:00 AM to 7:29 AM | 77 (16.1%) | 52 (17.4%) |
| 7:30 AM to 7:59 AM | 15 (3.1%) | 66 (22.2%) |
| 8:00 AM to 8:29 AM | 45 (9.4%) | 63 (21.1%) |
| 8:30 AM to 8:59 AM | 16 (3.4%) | 0 (0.0%) |
| 9:00 AM to 9:59 AM | 17 (3.6%) | 16 (5.4%) |
| 10:00 AM to 10:59 AM | 0 (0.0%) | 0 (0.0%) |
| 11:00 AM to 11:59 AM | 0 (0.0%) | 0 (0.0%) |
| 12:00 PM to 3:59 PM | 0 (0.0%) | 22 (7.4%) |
| 4:00 PM to 11:59 PM | 0 (0.0%) | 12 (4.0%) |
| Total | 477 (100.0%) | 298 (100.0%) |
Housing Occupancy in Browns Lake
Occupancy by Ownership in Browns Lake
Of the total 817 dwellings in Browns Lake, owner-occupied units account for 793 (97.1%), while renter-occupied units make up 24 (2.9%).
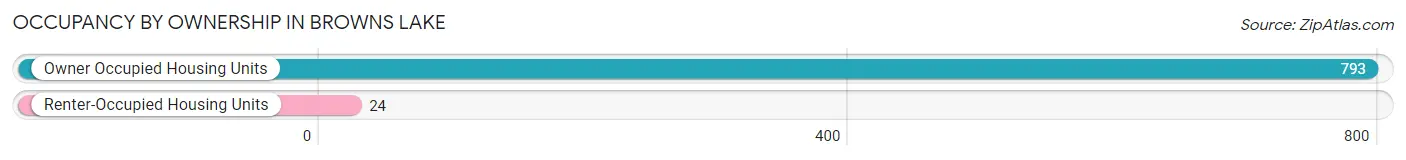
| Occupancy | # Housing Units | % Housing Units |
| Owner Occupied Housing Units | 793 | 97.1% |
| Renter-Occupied Housing Units | 24 | 2.9% |
| Total Occupied Housing Units | 817 | 100.0% |
Occupancy by Household Size in Browns Lake
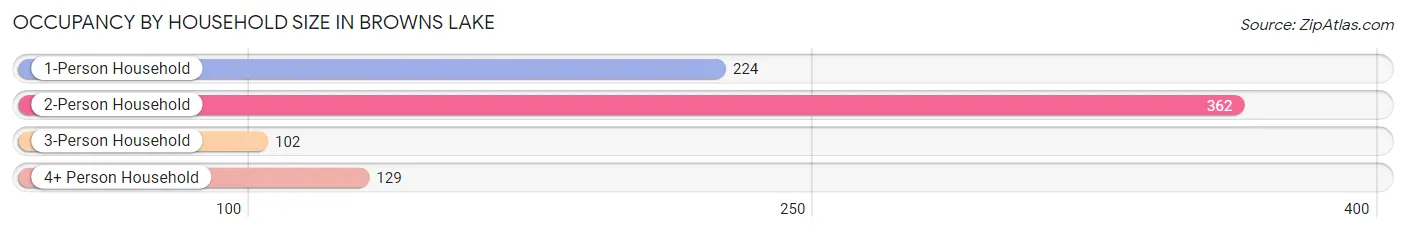
| Household Size | # Housing Units | % Housing Units |
| 1-Person Household | 224 | 27.4% |
| 2-Person Household | 362 | 44.3% |
| 3-Person Household | 102 | 12.5% |
| 4+ Person Household | 129 | 15.8% |
| Total Housing Units | 817 | 100.0% |
Occupancy by Ownership by Household Size in Browns Lake
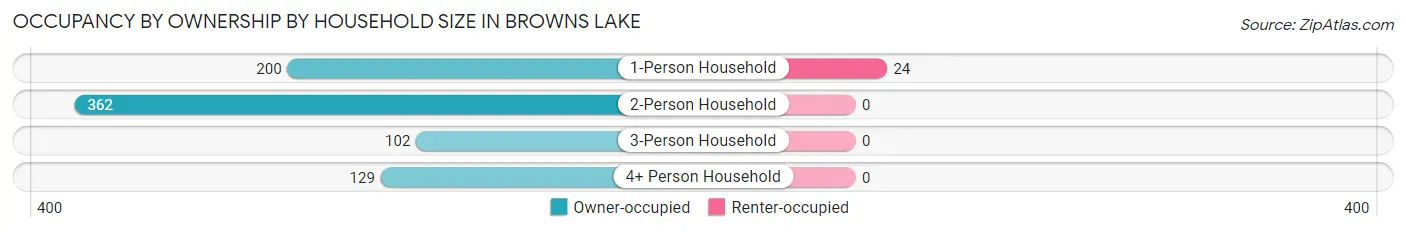
| Household Size | Owner-occupied | Renter-occupied |
| 1-Person Household | 200 (89.3%) | 24 (10.7%) |
| 2-Person Household | 362 (100.0%) | 0 (0.0%) |
| 3-Person Household | 102 (100.0%) | 0 (0.0%) |
| 4+ Person Household | 129 (100.0%) | 0 (0.0%) |
| Total Housing Units | 793 (97.1%) | 24 (2.9%) |
Occupancy by Educational Attainment in Browns Lake
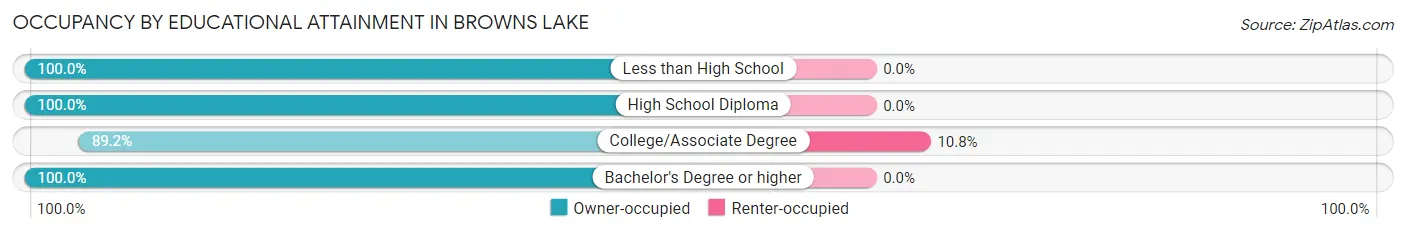
| Household Size | Owner-occupied | Renter-occupied |
| Less than High School | 41 (100.0%) | 0 (0.0%) |
| High School Diploma | 280 (100.0%) | 0 (0.0%) |
| College/Associate Degree | 199 (89.2%) | 24 (10.8%) |
| Bachelor's Degree or higher | 273 (100.0%) | 0 (0.0%) |
Occupancy by Age of Householder in Browns Lake
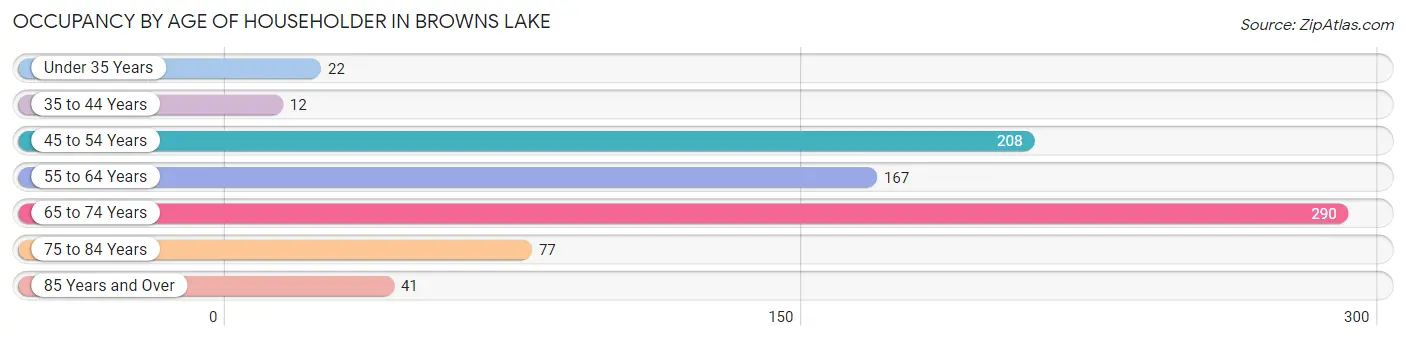
| Age Bracket | # Households | % Households |
| Under 35 Years | 22 | 2.7% |
| 35 to 44 Years | 12 | 1.5% |
| 45 to 54 Years | 208 | 25.5% |
| 55 to 64 Years | 167 | 20.4% |
| 65 to 74 Years | 290 | 35.5% |
| 75 to 84 Years | 77 | 9.4% |
| 85 Years and Over | 41 | 5.0% |
| Total | 817 | 100.0% |
Housing Finances in Browns Lake
Median Income by Occupancy in Browns Lake
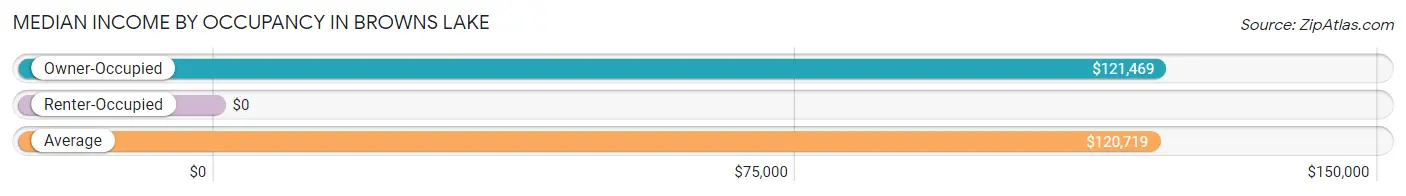
| Occupancy Type | # Households | Median Income |
| Owner-Occupied | 793 (97.1%) | $121,469 |
| Renter-Occupied | 24 (2.9%) | $0 |
| Average | 817 (100.0%) | $120,719 |
Occupancy by Householder Income Bracket in Browns Lake
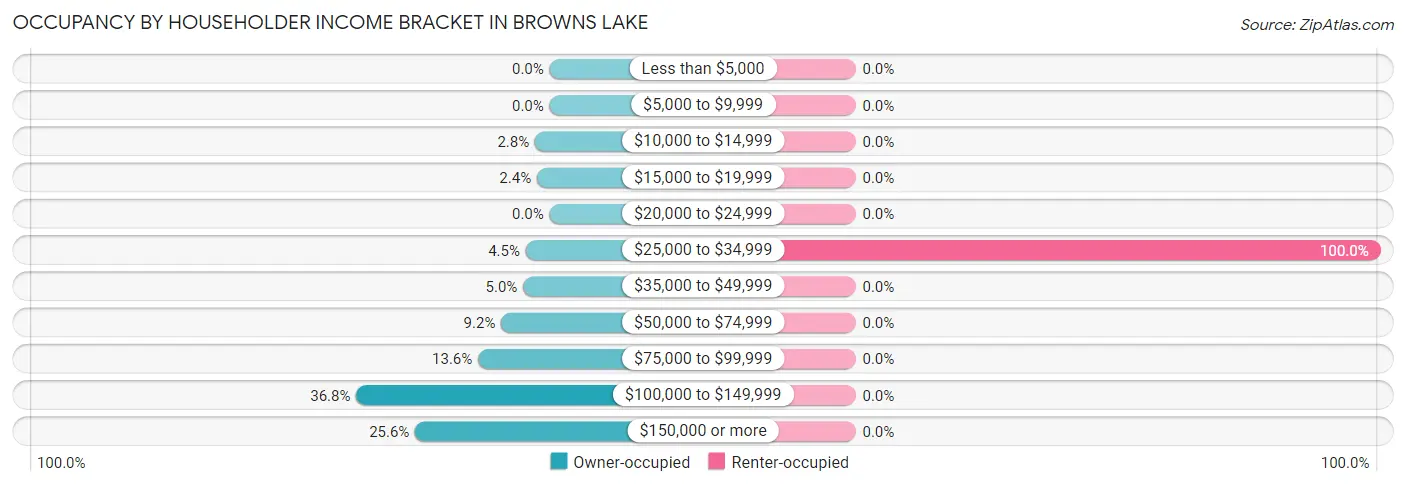
| Income Bracket | Owner-occupied | Renter-occupied |
| Less than $5,000 | 0 (0.0%) | 0 (0.0%) |
| $5,000 to $9,999 | 0 (0.0%) | 0 (0.0%) |
| $10,000 to $14,999 | 22 (2.8%) | 0 (0.0%) |
| $15,000 to $19,999 | 19 (2.4%) | 0 (0.0%) |
| $20,000 to $24,999 | 0 (0.0%) | 0 (0.0%) |
| $25,000 to $34,999 | 36 (4.5%) | 24 (100.0%) |
| $35,000 to $49,999 | 40 (5.0%) | 0 (0.0%) |
| $50,000 to $74,999 | 73 (9.2%) | 0 (0.0%) |
| $75,000 to $99,999 | 108 (13.6%) | 0 (0.0%) |
| $100,000 to $149,999 | 292 (36.8%) | 0 (0.0%) |
| $150,000 or more | 203 (25.6%) | 0 (0.0%) |
| Total | 793 (100.0%) | 24 (100.0%) |
Monthly Housing Cost Tiers in Browns Lake
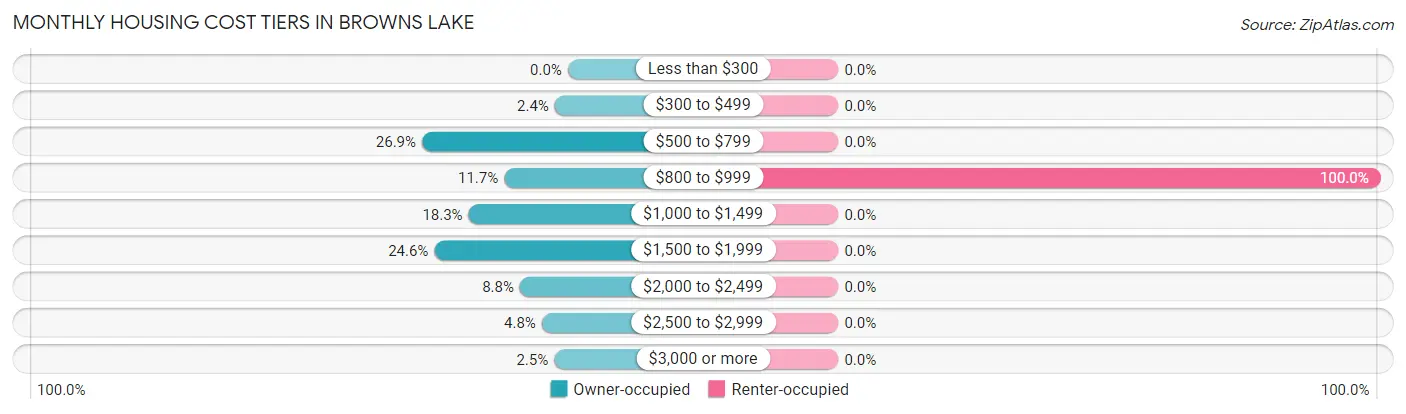
| Monthly Cost | Owner-occupied | Renter-occupied |
| Less than $300 | 0 (0.0%) | 0 (0.0%) |
| $300 to $499 | 19 (2.4%) | 0 (0.0%) |
| $500 to $799 | 213 (26.9%) | 0 (0.0%) |
| $800 to $999 | 93 (11.7%) | 24 (100.0%) |
| $1,000 to $1,499 | 145 (18.3%) | 0 (0.0%) |
| $1,500 to $1,999 | 195 (24.6%) | 0 (0.0%) |
| $2,000 to $2,499 | 70 (8.8%) | 0 (0.0%) |
| $2,500 to $2,999 | 38 (4.8%) | 0 (0.0%) |
| $3,000 or more | 20 (2.5%) | 0 (0.0%) |
| Total | 793 (100.0%) | 24 (100.0%) |
Physical Housing Characteristics in Browns Lake
Housing Structures in Browns Lake
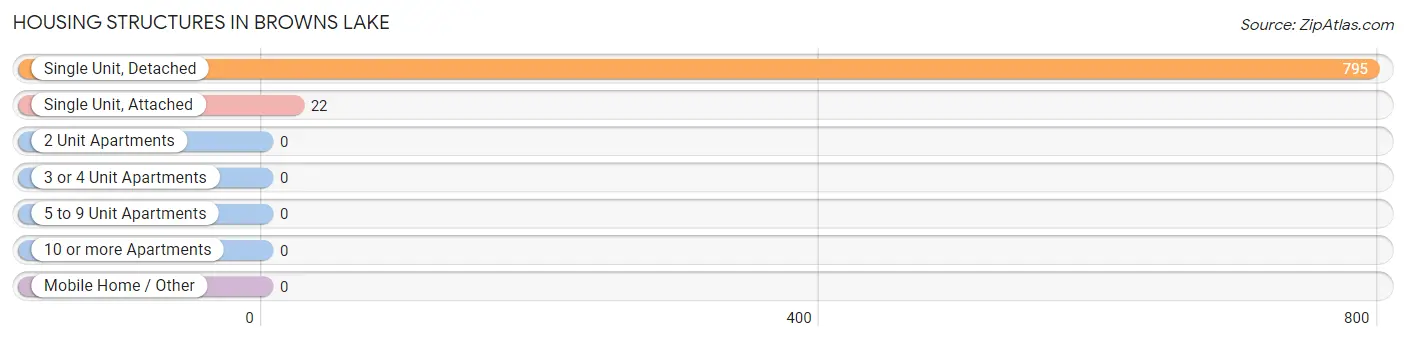
| Structure Type | # Housing Units | % Housing Units |
| Single Unit, Detached | 795 | 97.3% |
| Single Unit, Attached | 22 | 2.7% |
| 2 Unit Apartments | 0 | 0.0% |
| 3 or 4 Unit Apartments | 0 | 0.0% |
| 5 to 9 Unit Apartments | 0 | 0.0% |
| 10 or more Apartments | 0 | 0.0% |
| Mobile Home / Other | 0 | 0.0% |
| Total | 817 | 100.0% |
Housing Structures by Occupancy in Browns Lake
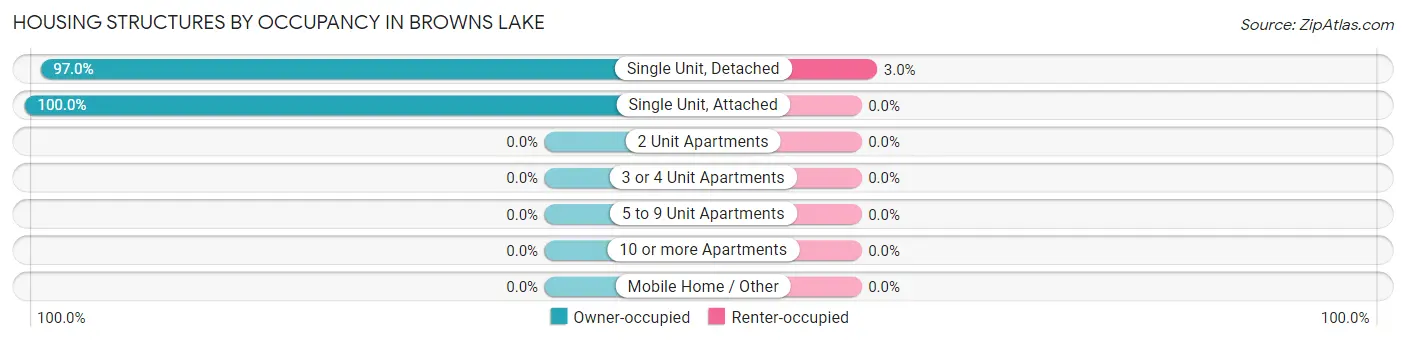
| Structure Type | Owner-occupied | Renter-occupied |
| Single Unit, Detached | 771 (97.0%) | 24 (3.0%) |
| Single Unit, Attached | 22 (100.0%) | 0 (0.0%) |
| 2 Unit Apartments | 0 (0.0%) | 0 (0.0%) |
| 3 or 4 Unit Apartments | 0 (0.0%) | 0 (0.0%) |
| 5 to 9 Unit Apartments | 0 (0.0%) | 0 (0.0%) |
| 10 or more Apartments | 0 (0.0%) | 0 (0.0%) |
| Mobile Home / Other | 0 (0.0%) | 0 (0.0%) |
| Total | 793 (97.1%) | 24 (2.9%) |
Housing Structures by Number of Rooms in Browns Lake
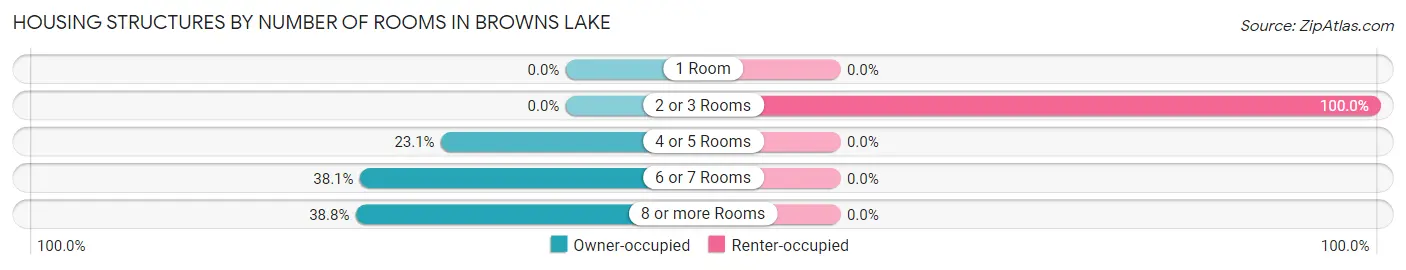
| Number of Rooms | Owner-occupied | Renter-occupied |
| 1 Room | 0 (0.0%) | 0 (0.0%) |
| 2 or 3 Rooms | 0 (0.0%) | 24 (100.0%) |
| 4 or 5 Rooms | 183 (23.1%) | 0 (0.0%) |
| 6 or 7 Rooms | 302 (38.1%) | 0 (0.0%) |
| 8 or more Rooms | 308 (38.8%) | 0 (0.0%) |
| Total | 793 (100.0%) | 24 (100.0%) |
Housing Structure by Heating Type in Browns Lake
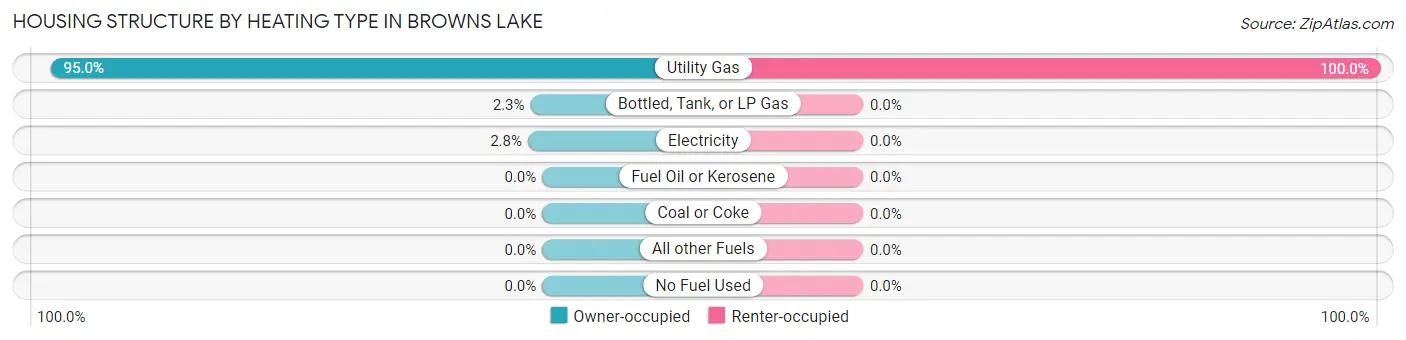
| Heating Type | Owner-occupied | Renter-occupied |
| Utility Gas | 753 (95.0%) | 24 (100.0%) |
| Bottled, Tank, or LP Gas | 18 (2.3%) | 0 (0.0%) |
| Electricity | 22 (2.8%) | 0 (0.0%) |
| Fuel Oil or Kerosene | 0 (0.0%) | 0 (0.0%) |
| Coal or Coke | 0 (0.0%) | 0 (0.0%) |
| All other Fuels | 0 (0.0%) | 0 (0.0%) |
| No Fuel Used | 0 (0.0%) | 0 (0.0%) |
| Total | 793 (100.0%) | 24 (100.0%) |
Household Vehicle Usage in Browns Lake
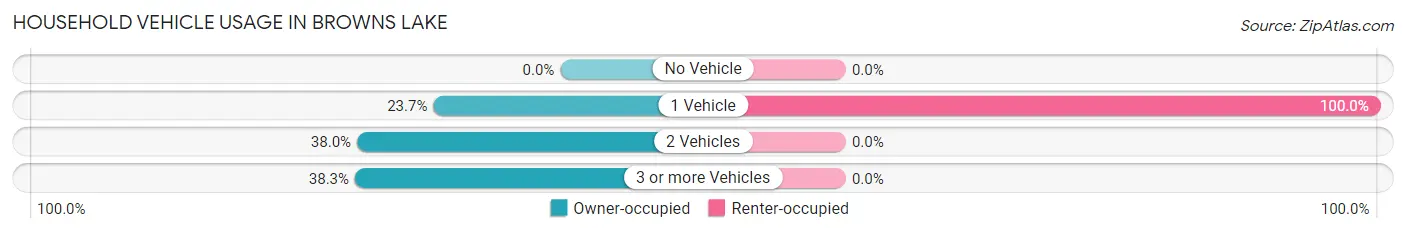
| Vehicles per Household | Owner-occupied | Renter-occupied |
| No Vehicle | 0 (0.0%) | 0 (0.0%) |
| 1 Vehicle | 188 (23.7%) | 24 (100.0%) |
| 2 Vehicles | 301 (38.0%) | 0 (0.0%) |
| 3 or more Vehicles | 304 (38.3%) | 0 (0.0%) |
| Total | 793 (100.0%) | 24 (100.0%) |
Real Estate & Mortgages in Browns Lake
Real Estate and Mortgage Overview in Browns Lake
| Characteristic | Without Mortgage | With Mortgage |
| Housing Units | 270 | 523 |
| Median Property Value | $274,700 | $299,800 |
| Median Household Income | $93,281 | $144 |
| Monthly Housing Costs | $778 | $20 |
| Real Estate Taxes | $3,988 | $0 |
Property Value by Mortgage Status in Browns Lake
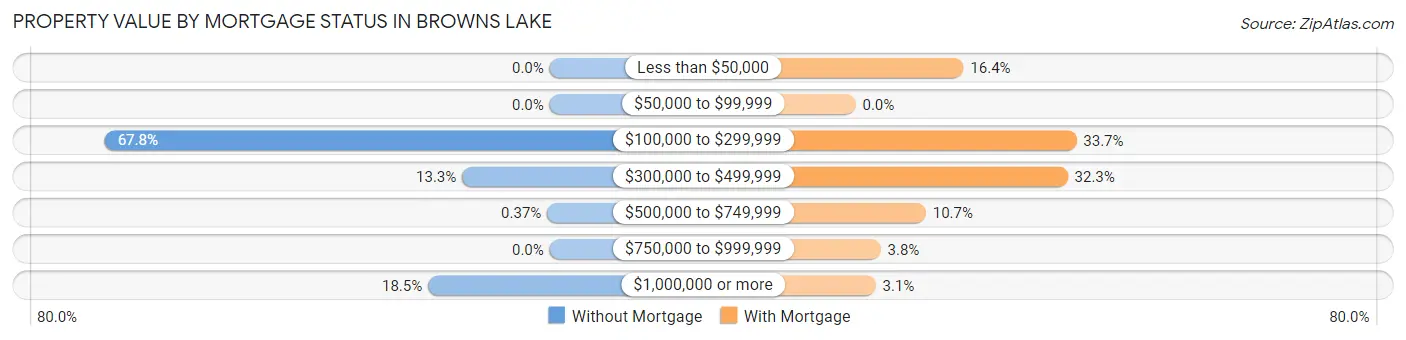
| Property Value | Without Mortgage | With Mortgage |
| Less than $50,000 | 0 (0.0%) | 86 (16.4%) |
| $50,000 to $99,999 | 0 (0.0%) | 0 (0.0%) |
| $100,000 to $299,999 | 183 (67.8%) | 176 (33.7%) |
| $300,000 to $499,999 | 36 (13.3%) | 169 (32.3%) |
| $500,000 to $749,999 | 1 (0.4%) | 56 (10.7%) |
| $750,000 to $999,999 | 0 (0.0%) | 20 (3.8%) |
| $1,000,000 or more | 50 (18.5%) | 16 (3.1%) |
| Total | 270 (100.0%) | 523 (100.0%) |
Household Income by Mortgage Status in Browns Lake
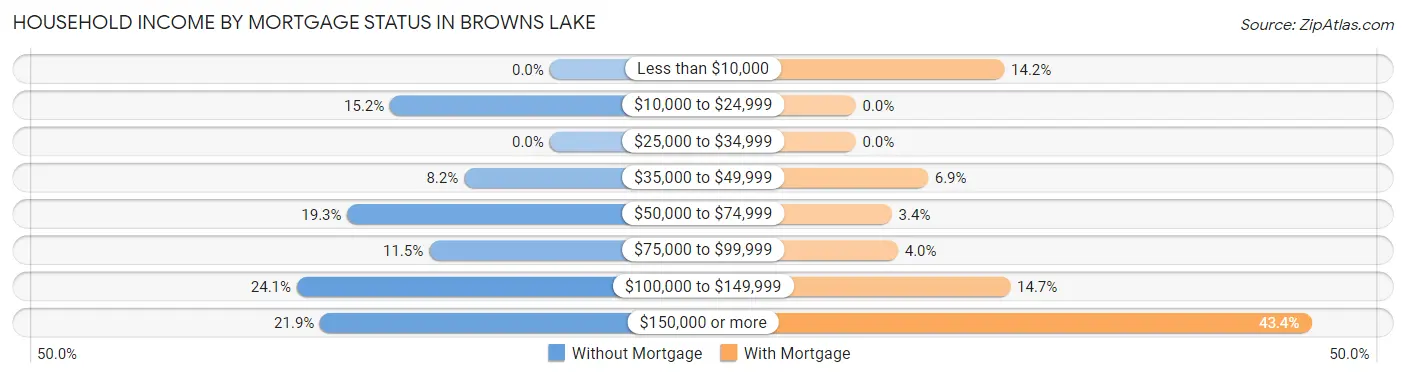
| Household Income | Without Mortgage | With Mortgage |
| Less than $10,000 | 0 (0.0%) | 74 (14.1%) |
| $10,000 to $24,999 | 41 (15.2%) | 0 (0.0%) |
| $25,000 to $34,999 | 0 (0.0%) | 0 (0.0%) |
| $35,000 to $49,999 | 22 (8.2%) | 36 (6.9%) |
| $50,000 to $74,999 | 52 (19.3%) | 18 (3.4%) |
| $75,000 to $99,999 | 31 (11.5%) | 21 (4.0%) |
| $100,000 to $149,999 | 65 (24.1%) | 77 (14.7%) |
| $150,000 or more | 59 (21.8%) | 227 (43.4%) |
| Total | 270 (100.0%) | 523 (100.0%) |
Property Value to Household Income Ratio in Browns Lake
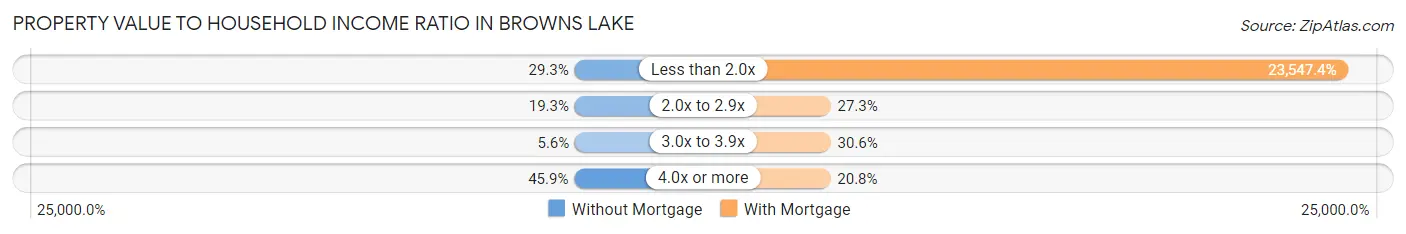
| Value-to-Income Ratio | Without Mortgage | With Mortgage |
| Less than 2.0x | 79 (29.3%) | 123,153 (23,547.4%) |
| 2.0x to 2.9x | 52 (19.3%) | 143 (27.3%) |
| 3.0x to 3.9x | 15 (5.6%) | 160 (30.6%) |
| 4.0x or more | 124 (45.9%) | 109 (20.8%) |
| Total | 270 (100.0%) | 523 (100.0%) |
Real Estate Taxes by Mortgage Status in Browns Lake
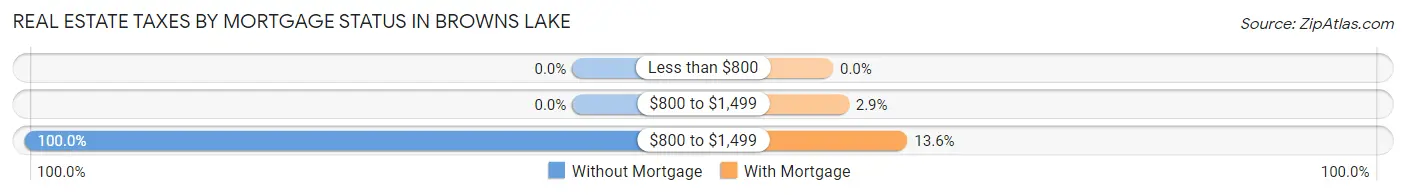
| Property Taxes | Without Mortgage | With Mortgage |
| Less than $800 | 0 (0.0%) | 0 (0.0%) |
| $800 to $1,499 | 0 (0.0%) | 15 (2.9%) |
| $800 to $1,499 | 270 (100.0%) | 71 (13.6%) |
| Total | 270 (100.0%) | 523 (100.0%) |
Health & Disability in Browns Lake
Health Insurance Coverage by Age in Browns Lake
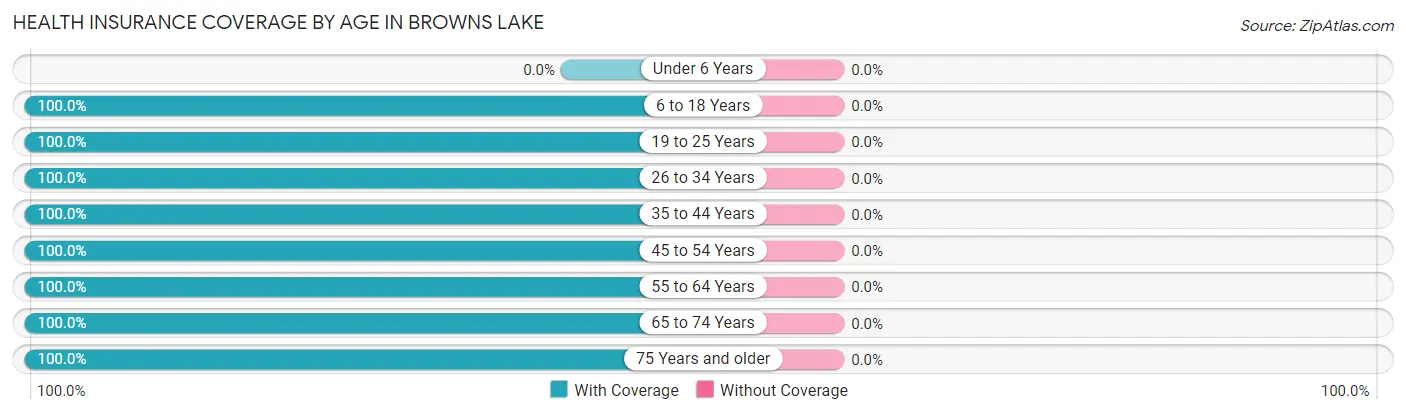
| Age Bracket | With Coverage | Without Coverage |
| Under 6 Years | 0 (0.0%) | 0 (0.0%) |
| 6 to 18 Years | 315 (100.0%) | 0 (0.0%) |
| 19 to 25 Years | 75 (100.0%) | 0 (0.0%) |
| 26 to 34 Years | 42 (100.0%) | 0 (0.0%) |
| 35 to 44 Years | 89 (100.0%) | 0 (0.0%) |
| 45 to 54 Years | 346 (100.0%) | 0 (0.0%) |
| 55 to 64 Years | 293 (100.0%) | 0 (0.0%) |
| 65 to 74 Years | 535 (100.0%) | 0 (0.0%) |
| 75 Years and older | 136 (100.0%) | 0 (0.0%) |
| Total | 1,831 (100.0%) | 0 (0.0%) |
Health Insurance Coverage by Citizenship Status in Browns Lake
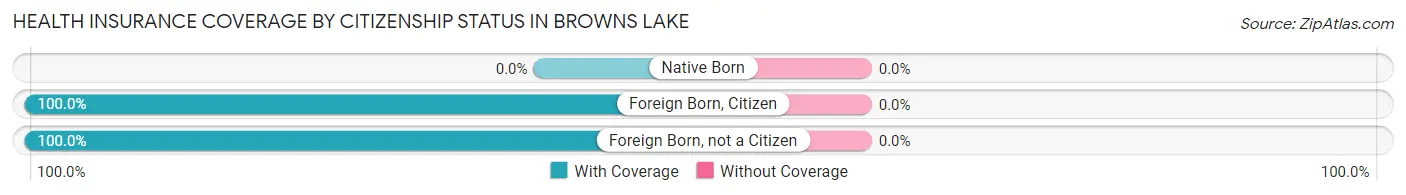
| Citizenship Status | With Coverage | Without Coverage |
| Native Born | 0 (0.0%) | 0 (0.0%) |
| Foreign Born, Citizen | 315 (100.0%) | 0 (0.0%) |
| Foreign Born, not a Citizen | 75 (100.0%) | 0 (0.0%) |
Health Insurance Coverage by Household Income in Browns Lake
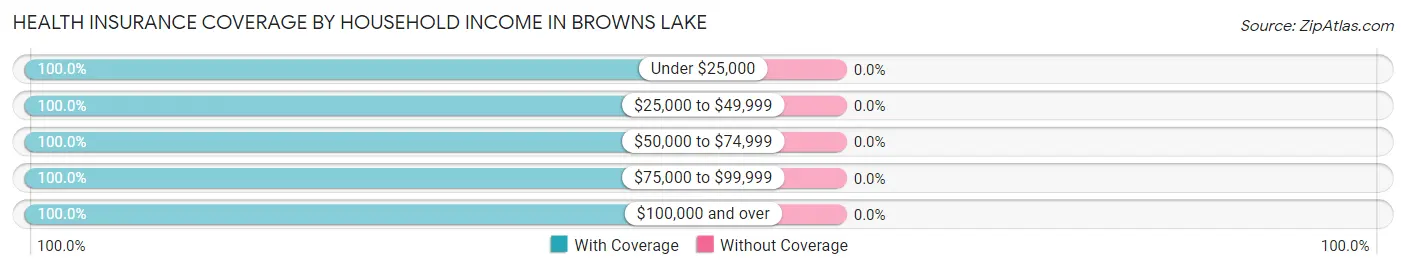
| Household Income | With Coverage | Without Coverage |
| Under $25,000 | 41 (100.0%) | 0 (0.0%) |
| $25,000 to $49,999 | 119 (100.0%) | 0 (0.0%) |
| $50,000 to $74,999 | 141 (100.0%) | 0 (0.0%) |
| $75,000 to $99,999 | 189 (100.0%) | 0 (0.0%) |
| $100,000 and over | 1,341 (100.0%) | 0 (0.0%) |
Public vs Private Health Insurance Coverage by Age in Browns Lake
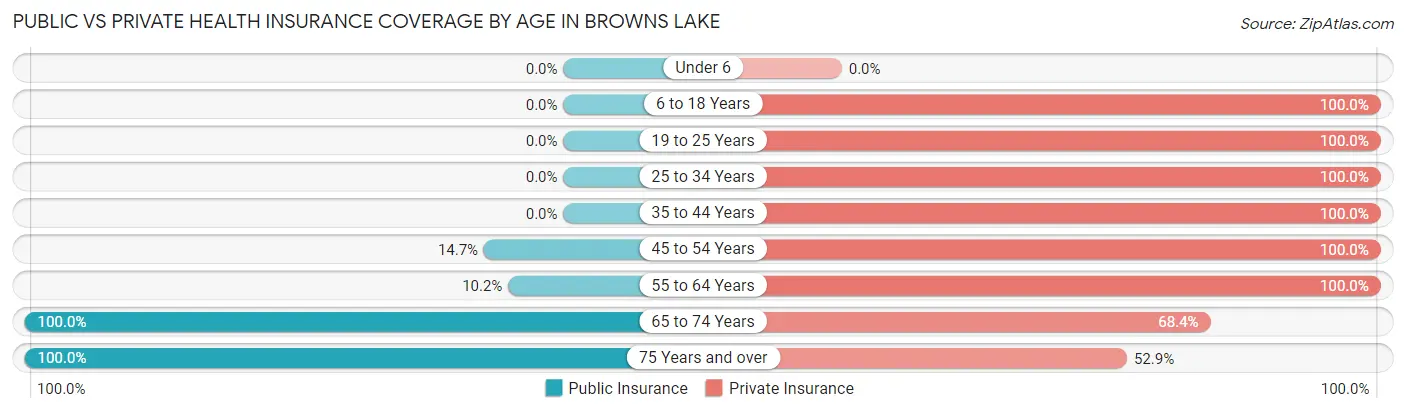
| Age Bracket | Public Insurance | Private Insurance |
| Under 6 | 0 (0.0%) | 0 (0.0%) |
| 6 to 18 Years | 0 (0.0%) | 315 (100.0%) |
| 19 to 25 Years | 0 (0.0%) | 75 (100.0%) |
| 25 to 34 Years | 0 (0.0%) | 42 (100.0%) |
| 35 to 44 Years | 0 (0.0%) | 89 (100.0%) |
| 45 to 54 Years | 51 (14.7%) | 346 (100.0%) |
| 55 to 64 Years | 30 (10.2%) | 293 (100.0%) |
| 65 to 74 Years | 535 (100.0%) | 366 (68.4%) |
| 75 Years and over | 136 (100.0%) | 72 (52.9%) |
| Total | 752 (41.1%) | 1,598 (87.3%) |
Disability Status by Sex by Age in Browns Lake
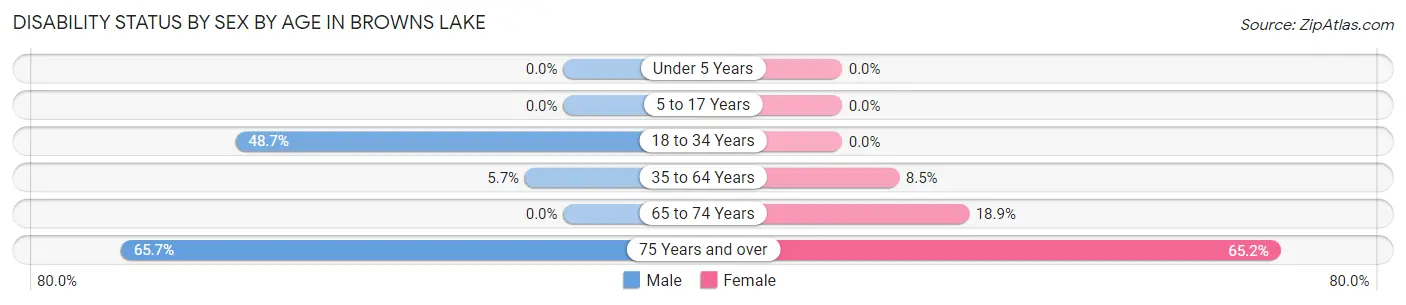
| Age Bracket | Male | Female |
| Under 5 Years | 0 (0.0%) | 0 (0.0%) |
| 5 to 17 Years | 0 (0.0%) | 0 (0.0%) |
| 18 to 34 Years | 55 (48.7%) | 0 (0.0%) |
| 35 to 64 Years | 20 (5.7%) | 32 (8.5%) |
| 65 to 74 Years | 0 (0.0%) | 49 (18.9%) |
| 75 Years and over | 46 (65.7%) | 43 (65.1%) |
Disability Class by Sex by Age in Browns Lake
Disability Class: Hearing Difficulty
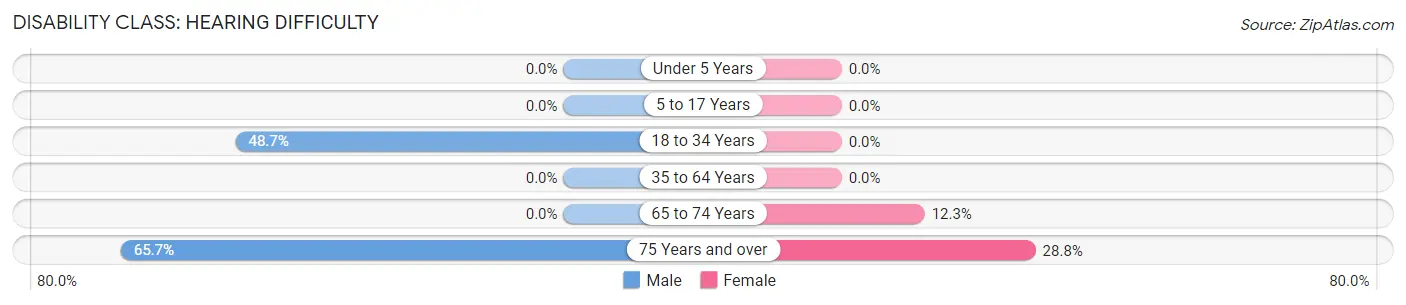
| Age Bracket | Male | Female |
| Under 5 Years | 0 (0.0%) | 0 (0.0%) |
| 5 to 17 Years | 0 (0.0%) | 0 (0.0%) |
| 18 to 34 Years | 55 (48.7%) | 0 (0.0%) |
| 35 to 64 Years | 0 (0.0%) | 0 (0.0%) |
| 65 to 74 Years | 0 (0.0%) | 32 (12.3%) |
| 75 Years and over | 46 (65.7%) | 19 (28.8%) |
Disability Class: Vision Difficulty
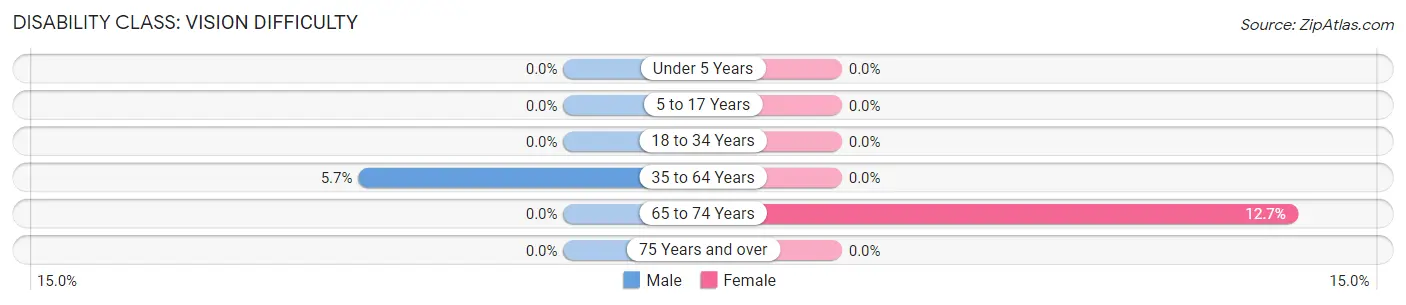
| Age Bracket | Male | Female |
| Under 5 Years | 0 (0.0%) | 0 (0.0%) |
| 5 to 17 Years | 0 (0.0%) | 0 (0.0%) |
| 18 to 34 Years | 0 (0.0%) | 0 (0.0%) |
| 35 to 64 Years | 20 (5.7%) | 0 (0.0%) |
| 65 to 74 Years | 0 (0.0%) | 33 (12.7%) |
| 75 Years and over | 0 (0.0%) | 0 (0.0%) |
Disability Class: Cognitive Difficulty
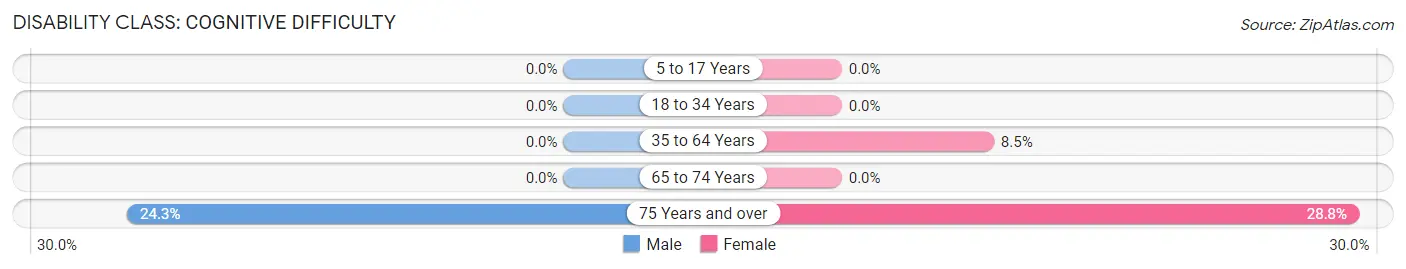
| Age Bracket | Male | Female |
| 5 to 17 Years | 0 (0.0%) | 0 (0.0%) |
| 18 to 34 Years | 0 (0.0%) | 0 (0.0%) |
| 35 to 64 Years | 0 (0.0%) | 32 (8.5%) |
| 65 to 74 Years | 0 (0.0%) | 0 (0.0%) |
| 75 Years and over | 17 (24.3%) | 19 (28.8%) |
Disability Class: Ambulatory Difficulty
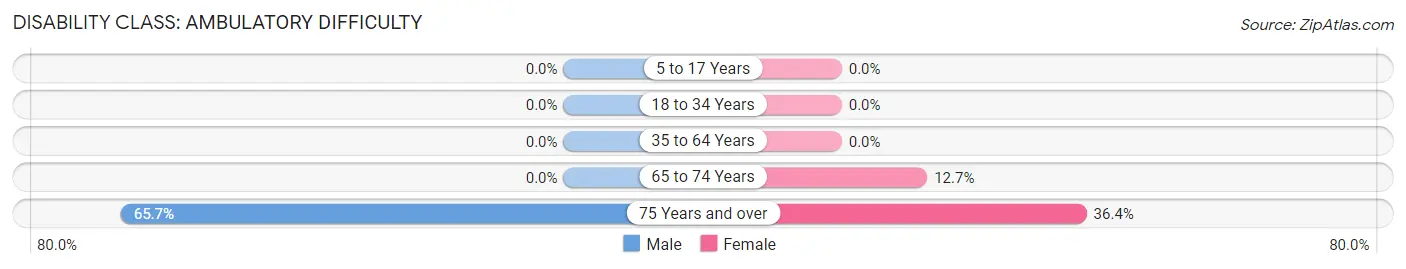
| Age Bracket | Male | Female |
| 5 to 17 Years | 0 (0.0%) | 0 (0.0%) |
| 18 to 34 Years | 0 (0.0%) | 0 (0.0%) |
| 35 to 64 Years | 0 (0.0%) | 0 (0.0%) |
| 65 to 74 Years | 0 (0.0%) | 33 (12.7%) |
| 75 Years and over | 46 (65.7%) | 24 (36.4%) |
Disability Class: Self-Care Difficulty
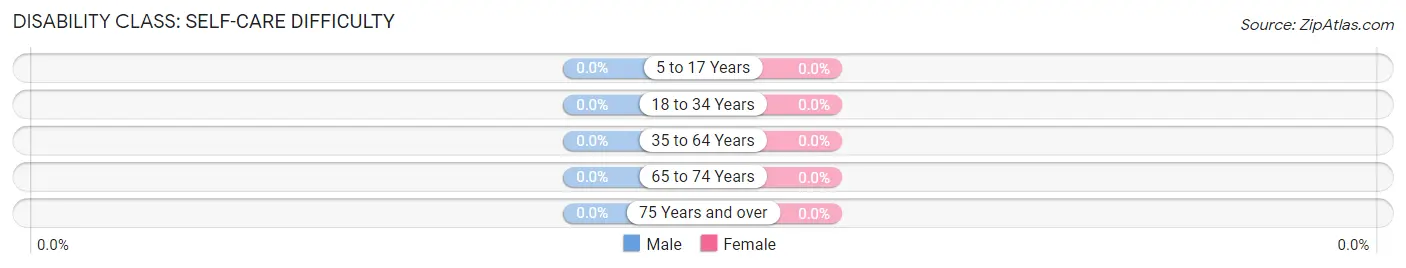
| Age Bracket | Male | Female |
| 5 to 17 Years | 0 (0.0%) | 0 (0.0%) |
| 18 to 34 Years | 0 (0.0%) | 0 (0.0%) |
| 35 to 64 Years | 0 (0.0%) | 0 (0.0%) |
| 65 to 74 Years | 0 (0.0%) | 0 (0.0%) |
| 75 Years and over | 0 (0.0%) | 0 (0.0%) |
Technology Access in Browns Lake
Computing Device Access in Browns Lake
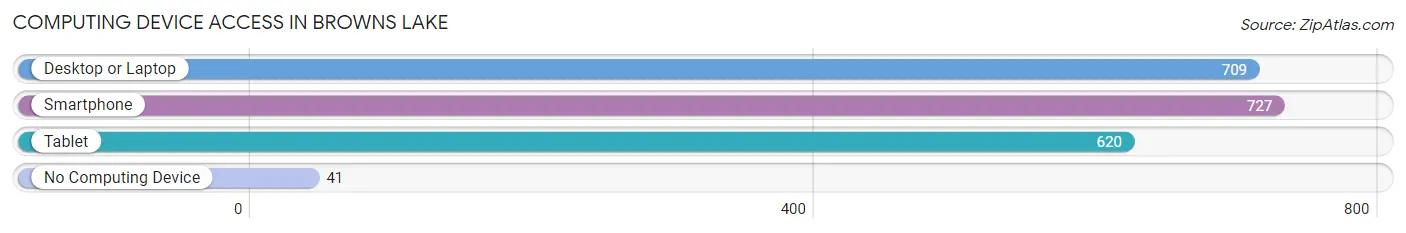
| Device Type | # Households | % Households |
| Desktop or Laptop | 709 | 86.8% |
| Smartphone | 727 | 89.0% |
| Tablet | 620 | 75.9% |
| No Computing Device | 41 | 5.0% |
| Total | 817 | 100.0% |
Internet Access in Browns Lake
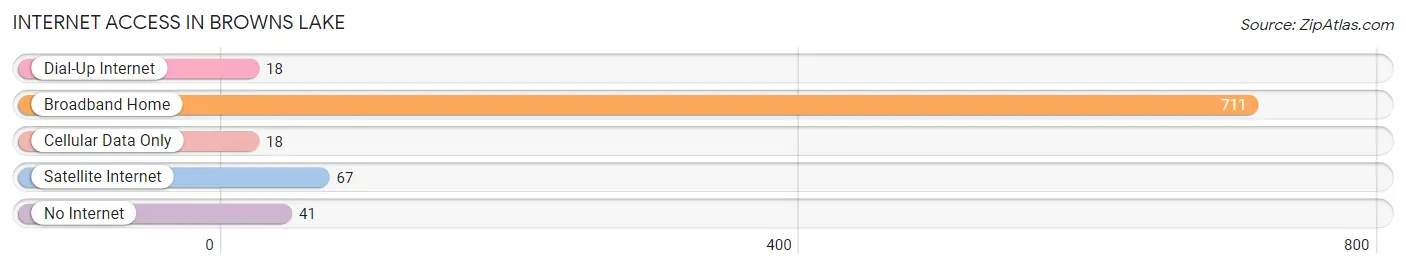
| Internet Type | # Households | % Households |
| Dial-Up Internet | 18 | 2.2% |
| Broadband Home | 711 | 87.0% |
| Cellular Data Only | 18 | 2.2% |
| Satellite Internet | 67 | 8.2% |
| No Internet | 41 | 5.0% |
| Total | 817 | 100.0% |
Browns Lake Summary
Browns Lake is a small lake located in southeastern Wisconsin, in the town of Burlington, Racine County. It is part of the Fox River watershed and is the largest lake in the county. The lake is approximately 1,000 acres in size and is a popular destination for fishing, swimming, boating, and other recreational activities.
History
The area around Browns Lake has been inhabited for thousands of years. The first known inhabitants were the Potawatomi people, who lived in the area for centuries before the arrival of European settlers. The lake was named after the Brown family, who were among the first settlers in the area. The Browns built a log cabin on the lake in 1837 and the lake has been known as Browns Lake ever since.
In the late 19th century, the lake became a popular destination for fishing and recreation. The lake was stocked with fish and a number of resorts and lodges were built around the lake. In the early 20th century, the lake was used for ice fishing and ice skating.
In the 1950s, the lake was developed for recreational use. A number of marinas and boat launches were built around the lake and the lake became a popular destination for boaters and fishermen. In the 1970s, the lake was designated as a state natural area and a number of conservation efforts were undertaken to protect the lake and its surrounding environment.
Geography
Browns Lake is located in southeastern Wisconsin, in the town of Burlington, Racine County. The lake is approximately 1,000 acres in size and is the largest lake in the county. The lake is part of the Fox River watershed and is fed by several small streams. The lake has a maximum depth of 30 feet and an average depth of 10 feet. The lake is surrounded by wetlands, woodlands, and agricultural land.
Economy
The economy of Browns Lake is largely based on tourism and recreation. The lake is a popular destination for fishing, swimming, boating, and other recreational activities. The lake is also home to several marinas and boat launches, as well as a number of resorts and lodges. The lake is also a popular destination for bird watching and wildlife viewing.
Demographics
The population of Browns Lake is approximately 1,000 people. The majority of the population is white (90%), followed by Hispanic (5%), African American (2%), and Asian (2%). The median household income is $50,000 and the median home value is $200,000. The majority of the population is employed in the service industry (30%), followed by manufacturing (20%), retail (15%), and healthcare (10%).
Common Questions
What is Per Capita Income in Browns Lake?
Per Capita income in Browns Lake is $80,531.
What is the Median Family Income in Browns Lake?
Median Family Income in Browns Lake is $126,935.
What is the Median Household income in Browns Lake?
Median Household Income in Browns Lake is $120,719.
What is Income or Wage Gap in Browns Lake?
Income or Wage Gap in Browns Lake is 19.3%.
Women in Browns Lake earn 80.7 cents for every dollar earned by a man.
What is Inequality or Gini Index in Browns Lake?
Inequality or Gini Index in Browns Lake is 0.52.
What is the Total Population of Browns Lake?
Total Population of Browns Lake is 1,831.
What is the Total Male Population of Browns Lake?
Total Male Population of Browns Lake is 885.
What is the Total Female Population of Browns Lake?
Total Female Population of Browns Lake is 946.
What is the Ratio of Males per 100 Females in Browns Lake?
There are 93.55 Males per 100 Females in Browns Lake.
What is the Ratio of Females per 100 Males in Browns Lake?
There are 106.89 Females per 100 Males in Browns Lake.
What is the Median Population Age in Browns Lake?
Median Population Age in Browns Lake is 57.8 Years.
What is the Average Family Size in Browns Lake
Average Family Size in Browns Lake is 2.5 People.
What is the Average Household Size in Browns Lake
Average Household Size in Browns Lake is 2.2 People.
How Large is the Labor Force in Browns Lake?
There are 896 People in the Labor Forcein in Browns Lake.
What is the Percentage of People in the Labor Force in Browns Lake?
52.2% of People are in the Labor Force in Browns Lake.