Mole Lake, WI Map & Demographics
Mole Lake Map
Mole Lake Overview
$18,329
PER CAPITA INCOME
$44,583
AVG FAMILY INCOME
$35,625
AVG HOUSEHOLD INCOME
6.5%
WAGE / INCOME GAP [ % ]
93.5¢/ $1
WAGE / INCOME GAP [ $ ]
0.46
INEQUALITY / GINI INDEX
525
TOTAL POPULATION
269
MALE POPULATION
256
FEMALE POPULATION
105.08
MALES / 100 FEMALES
95.17
FEMALES / 100 MALES
39.1
MEDIAN AGE
3.6
AVG FAMILY SIZE
3.0
AVG HOUSEHOLD SIZE
203
LABOR FORCE [ PEOPLE ]
52.7%
PERCENT IN LABOR FORCE
10.3%
UNEMPLOYMENT RATE
Income in Mole Lake
Income Overview in Mole Lake
Per Capita Income in Mole Lake is $18,329, while median incomes of families and households are $44,583 and $35,625 respectively.
| Characteristic | Number | Measure |
| Per Capita Income | 525 | $18,329 |
| Median Family Income | 115 | $44,583 |
| Mean Family Income | 115 | $57,588 |
| Median Household Income | 175 | $35,625 |
| Mean Household Income | 175 | $50,857 |
| Income Deficit | 115 | $0 |
| Wage / Income Gap (%) | 525 | 6.50% |
| Wage / Income Gap ($) | 525 | 93.50¢ per $1 |
| Gini / Inequality Index | 525 | 0.46 |
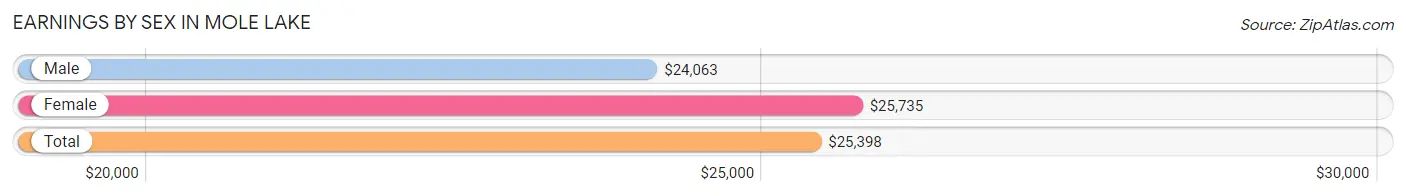
Earnings by Sex in Mole Lake
Average Earnings in Mole Lake are $25,398, $24,063 for men and $25,735 for women, a difference of 6.5%.
| Sex | Number | Average Earnings |
| Male | 115 (53.5%) | $24,063 |
| Female | 100 (46.5%) | $25,735 |
| Total | 215 (100.0%) | $25,398 |
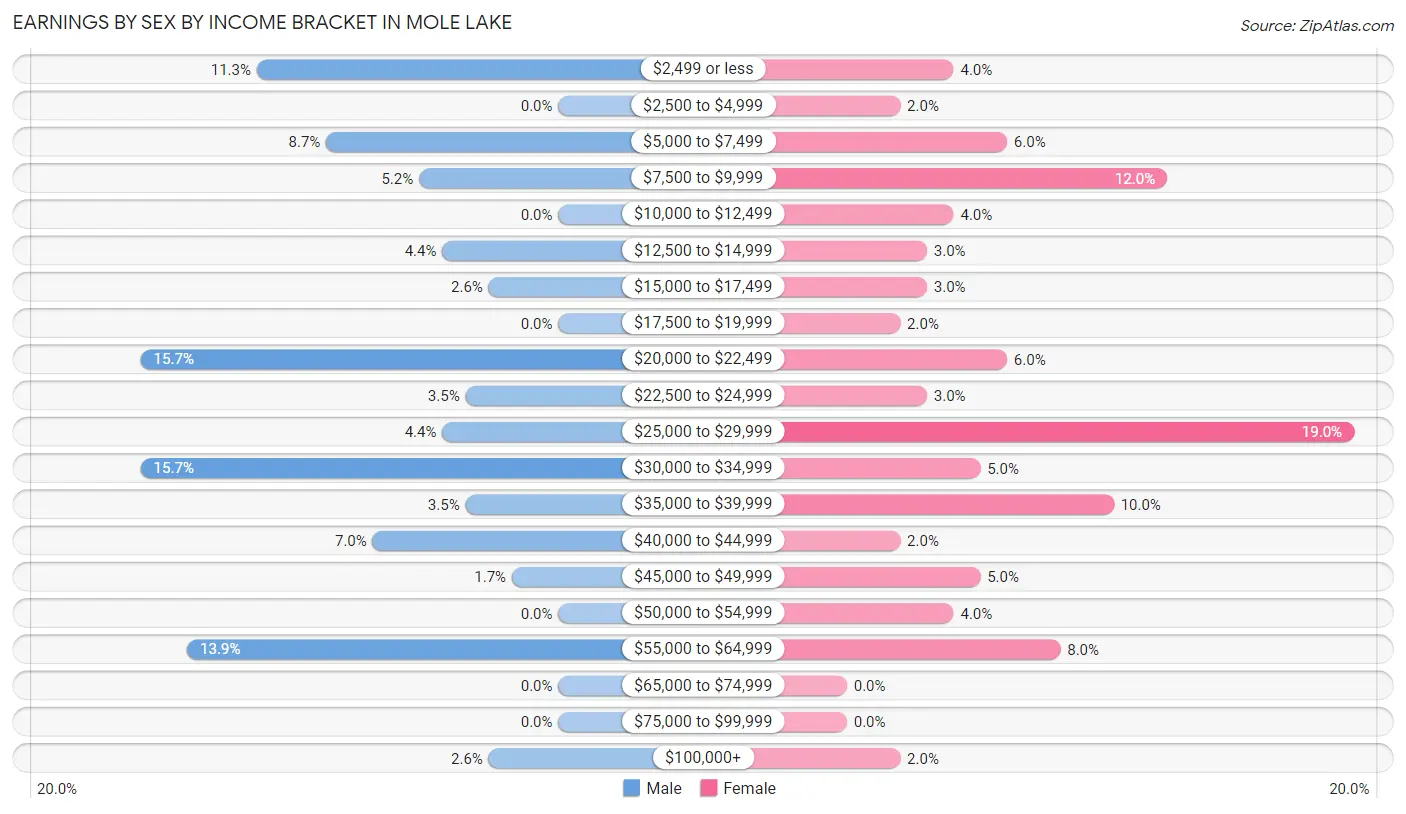
Earnings by Sex by Income Bracket in Mole Lake
The most common earnings brackets in Mole Lake are $20,000 to $22,499 for men (18 | 15.7%) and $25,000 to $29,999 for women (19 | 19.0%).
| Income | Male | Female |
| $2,499 or less | 13 (11.3%) | 4 (4.0%) |
| $2,500 to $4,999 | 0 (0.0%) | 2 (2.0%) |
| $5,000 to $7,499 | 10 (8.7%) | 6 (6.0%) |
| $7,500 to $9,999 | 6 (5.2%) | 12 (12.0%) |
| $10,000 to $12,499 | 0 (0.0%) | 4 (4.0%) |
| $12,500 to $14,999 | 5 (4.3%) | 3 (3.0%) |
| $15,000 to $17,499 | 3 (2.6%) | 3 (3.0%) |
| $17,500 to $19,999 | 0 (0.0%) | 2 (2.0%) |
| $20,000 to $22,499 | 18 (15.7%) | 6 (6.0%) |
| $22,500 to $24,999 | 4 (3.5%) | 3 (3.0%) |
| $25,000 to $29,999 | 5 (4.3%) | 19 (19.0%) |
| $30,000 to $34,999 | 18 (15.7%) | 5 (5.0%) |
| $35,000 to $39,999 | 4 (3.5%) | 10 (10.0%) |
| $40,000 to $44,999 | 8 (7.0%) | 2 (2.0%) |
| $45,000 to $49,999 | 2 (1.7%) | 5 (5.0%) |
| $50,000 to $54,999 | 0 (0.0%) | 4 (4.0%) |
| $55,000 to $64,999 | 16 (13.9%) | 8 (8.0%) |
| $65,000 to $74,999 | 0 (0.0%) | 0 (0.0%) |
| $75,000 to $99,999 | 0 (0.0%) | 0 (0.0%) |
| $100,000+ | 3 (2.6%) | 2 (2.0%) |
| Total | 115 (100.0%) | 100 (100.0%) |
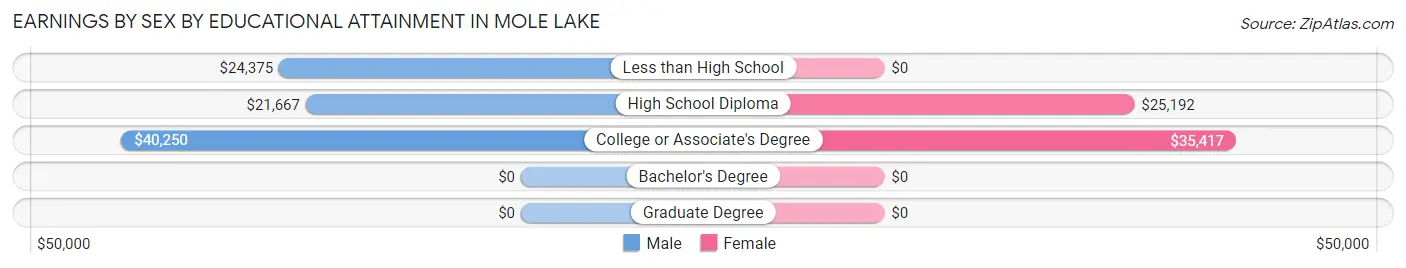
Earnings by Sex by Educational Attainment in Mole Lake
Average earnings in Mole Lake are $25,000 for men and $25,809 for women, a difference of 3.1%. Men with an educational attainment of college or associate's degree enjoy the highest average annual earnings of $40,250, while those with high school diploma education earn the least with $21,667. Women with an educational attainment of college or associate's degree earn the most with the average annual earnings of $35,417, while those with high school diploma education have the smallest earnings of $25,192.
| Educational Attainment | Male Income | Female Income |
| Less than High School | $24,375 | $0 |
| High School Diploma | $21,667 | $25,192 |
| College or Associate's Degree | $40,250 | $35,417 |
| Bachelor's Degree | - | - |
| Graduate Degree | - | - |
| Total | $25,000 | $25,809 |
Family Income in Mole Lake
Family Income Brackets in Mole Lake
According to the Mole Lake family income data, there are 32 families falling into the $50,000 to $74,999 income range, which is the most common income bracket and makes up 27.8% of all families.
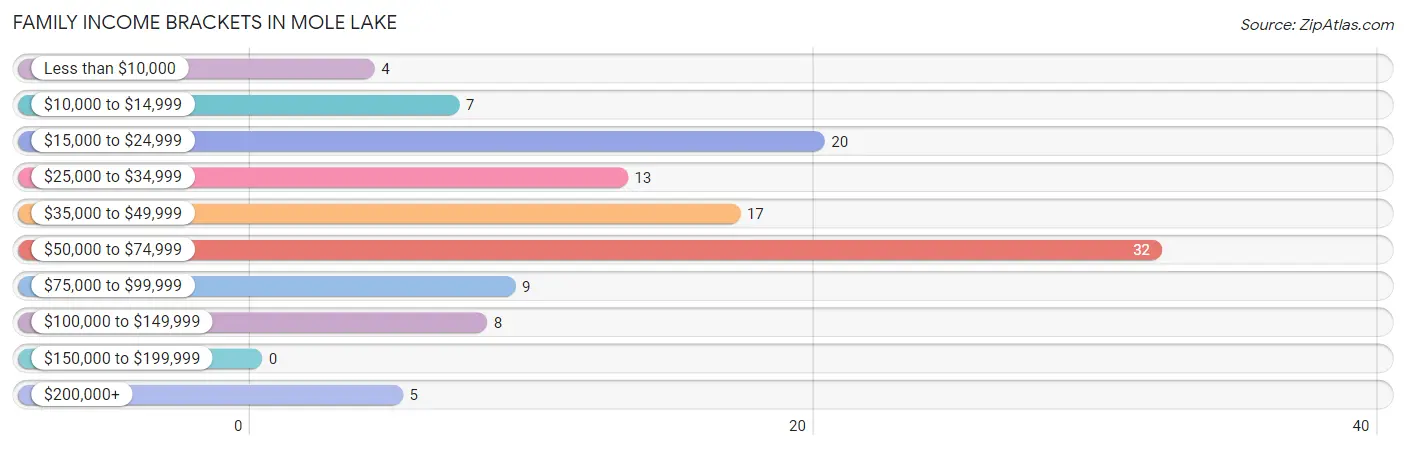
| Income Bracket | # Families | % Families |
| Less than $10,000 | 4 | 3.5% |
| $10,000 to $14,999 | 7 | 6.1% |
| $15,000 to $24,999 | 20 | 17.4% |
| $25,000 to $34,999 | 13 | 11.3% |
| $35,000 to $49,999 | 17 | 14.8% |
| $50,000 to $74,999 | 32 | 27.8% |
| $75,000 to $99,999 | 9 | 7.8% |
| $100,000 to $149,999 | 8 | 7.0% |
| $150,000 to $199,999 | 0 | 0.0% |
| $200,000+ | 5 | 4.3% |
Family Income by Famaliy Size in Mole Lake
2-person families (63 | 54.8%) account for the highest median family income in Mole Lake with $55,521 per family, while 2-person families (63 | 54.8%) have the highest median income of $27,760 per family member.
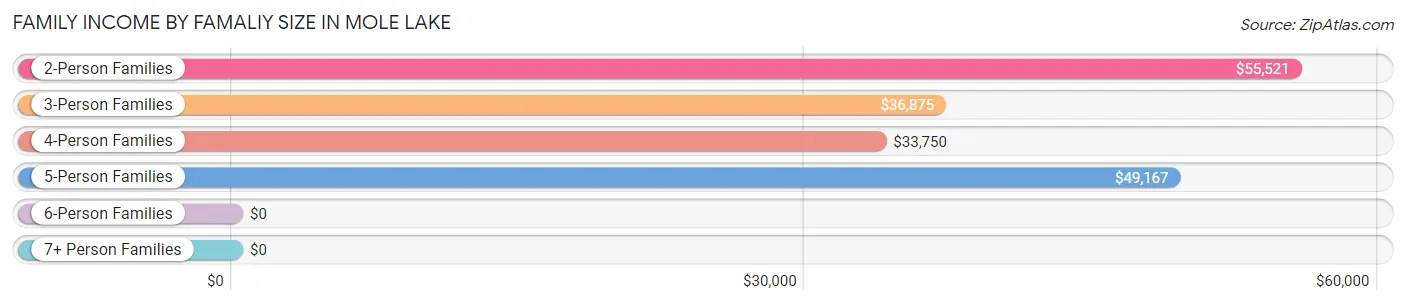
| Income Bracket | # Families | Median Income |
| 2-Person Families | 63 (54.8%) | $55,521 |
| 3-Person Families | 20 (17.4%) | $36,875 |
| 4-Person Families | 15 (13.0%) | $33,750 |
| 5-Person Families | 8 (7.0%) | $49,167 |
| 6-Person Families | 7 (6.1%) | $0 |
| 7+ Person Families | 2 (1.7%) | $0 |
| Total | 115 (100.0%) | $44,583 |
Family Income by Number of Earners in Mole Lake
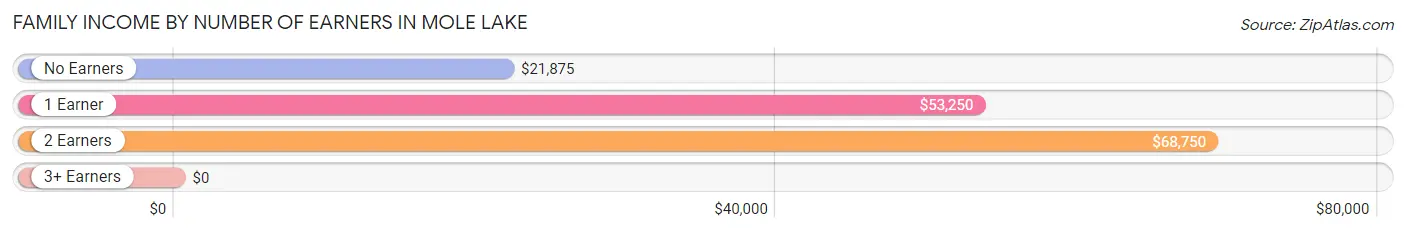
| Number of Earners | # Families | Median Income |
| No Earners | 23 (20.0%) | $21,875 |
| 1 Earner | 51 (44.4%) | $53,250 |
| 2 Earners | 39 (33.9%) | $68,750 |
| 3+ Earners | 2 (1.7%) | $0 |
| Total | 115 (100.0%) | $44,583 |
Household Income in Mole Lake
Household Income Brackets in Mole Lake
With 37 households falling in the category, the $50,000 to $74,999 income range is the most frequent in Mole Lake, accounting for 21.1% of all households. In contrast, only 2 households (1.1%) fall into the $150,000 to $199,999 income bracket, making it the least populous group.
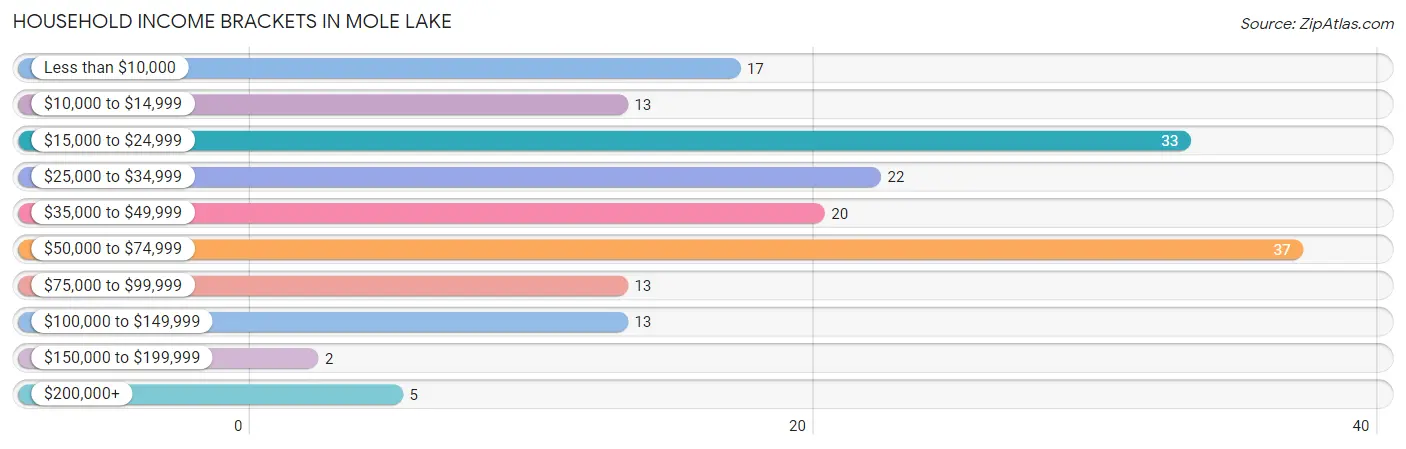
| Income Bracket | # Households | % Households |
| Less than $10,000 | 17 | 9.7% |
| $10,000 to $14,999 | 13 | 7.4% |
| $15,000 to $24,999 | 33 | 18.9% |
| $25,000 to $34,999 | 22 | 12.6% |
| $35,000 to $49,999 | 20 | 11.4% |
| $50,000 to $74,999 | 37 | 21.1% |
| $75,000 to $99,999 | 13 | 7.4% |
| $100,000 to $149,999 | 13 | 7.4% |
| $150,000 to $199,999 | 2 | 1.1% |
| $200,000+ | 5 | 2.9% |
Household Income by Householder Age in Mole Lake
The median household income in Mole Lake is $35,625, with the highest median household income of $43,500 found in the 45 to 64 years age bracket for the primary householder. A total of 104 households (59.4%) fall into this category.
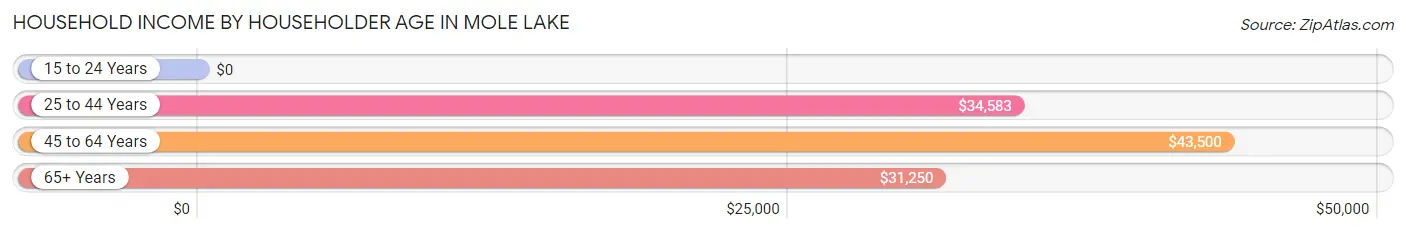
| Income Bracket | # Households | Median Income |
| 15 to 24 Years | 0 (0.0%) | $0 |
| 25 to 44 Years | 43 (24.6%) | $34,583 |
| 45 to 64 Years | 104 (59.4%) | $43,500 |
| 65+ Years | 28 (16.0%) | $31,250 |
| Total | 175 (100.0%) | $35,625 |
Poverty in Mole Lake
Income Below Poverty by Sex and Age in Mole Lake
With 32.0% poverty level for males and 37.4% for females among the residents of Mole Lake, under 5 year old males and 15 year old females are the most vulnerable to poverty, with 15 males (100.0%) and 8 females (100.0%) in their respective age groups living below the poverty level.
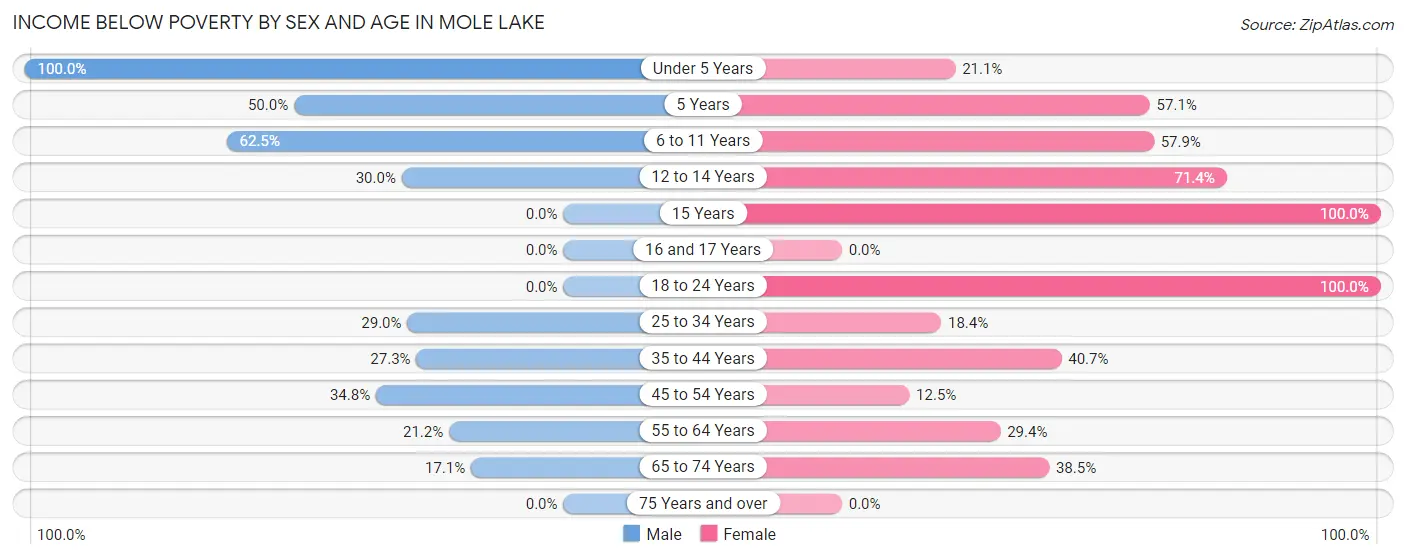
| Age Bracket | Male | Female |
| Under 5 Years | 15 (100.0%) | 4 (21.0%) |
| 5 Years | 2 (50.0%) | 8 (57.1%) |
| 6 to 11 Years | 20 (62.5%) | 11 (57.9%) |
| 12 to 14 Years | 3 (30.0%) | 10 (71.4%) |
| 15 Years | 0 (0.0%) | 8 (100.0%) |
| 16 and 17 Years | 0 (0.0%) | 0 (0.0%) |
| 18 to 24 Years | 0 (0.0%) | 8 (100.0%) |
| 25 to 34 Years | 11 (28.9%) | 7 (18.4%) |
| 35 to 44 Years | 6 (27.3%) | 11 (40.7%) |
| 45 to 54 Years | 8 (34.8%) | 3 (12.5%) |
| 55 to 64 Years | 14 (21.2%) | 15 (29.4%) |
| 65 to 74 Years | 6 (17.1%) | 10 (38.5%) |
| 75 Years and over | 0 (0.0%) | 0 (0.0%) |
| Total | 85 (32.0%) | 95 (37.4%) |
Income Above Poverty by Sex and Age in Mole Lake
According to the poverty statistics in Mole Lake, males aged 16 and 17 years and females aged 75 years and over are the age groups that are most secure financially, with 100.0% of males and 100.0% of females in these age groups living above the poverty line.
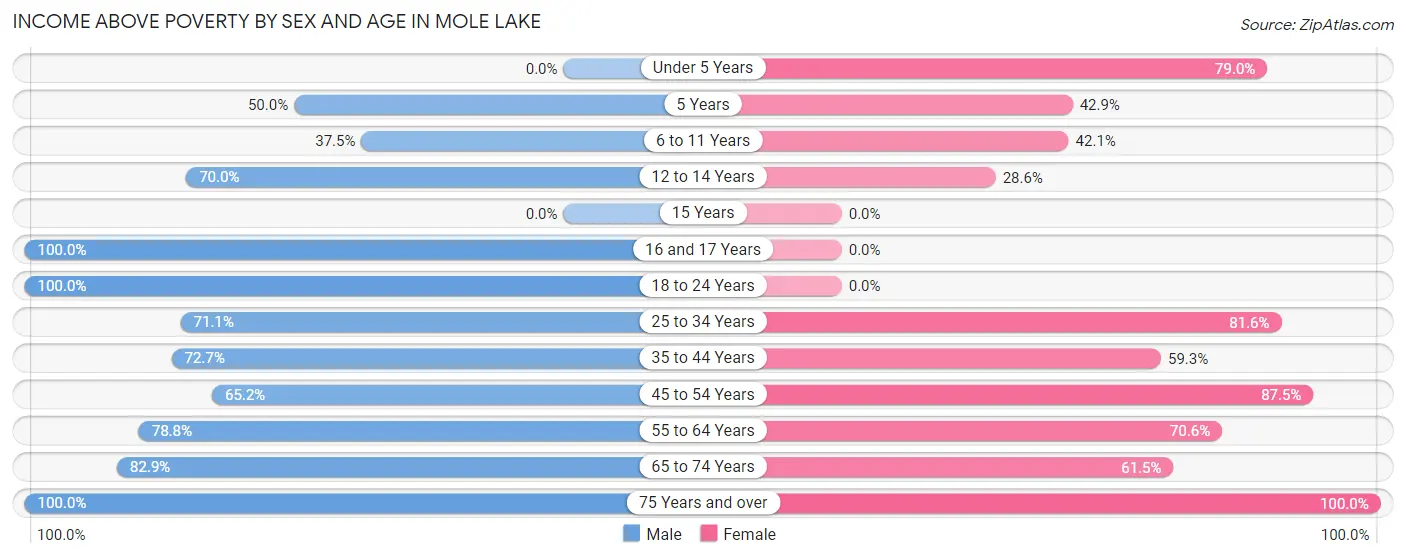
| Age Bracket | Male | Female |
| Under 5 Years | 0 (0.0%) | 15 (78.9%) |
| 5 Years | 2 (50.0%) | 6 (42.9%) |
| 6 to 11 Years | 12 (37.5%) | 8 (42.1%) |
| 12 to 14 Years | 7 (70.0%) | 4 (28.6%) |
| 15 Years | 0 (0.0%) | 0 (0.0%) |
| 16 and 17 Years | 8 (100.0%) | 0 (0.0%) |
| 18 to 24 Years | 11 (100.0%) | 0 (0.0%) |
| 25 to 34 Years | 27 (71.1%) | 31 (81.6%) |
| 35 to 44 Years | 16 (72.7%) | 16 (59.3%) |
| 45 to 54 Years | 15 (65.2%) | 21 (87.5%) |
| 55 to 64 Years | 52 (78.8%) | 36 (70.6%) |
| 65 to 74 Years | 29 (82.9%) | 16 (61.5%) |
| 75 Years and over | 2 (100.0%) | 6 (100.0%) |
| Total | 181 (68.0%) | 159 (62.6%) |
Income Below Poverty Among Married-Couple Families in Mole Lake
The poverty statistics for married-couple families in Mole Lake show that 19.4% or 12 of the total 62 families live below the poverty line. Families with 5 or more children have the highest poverty rate of 50.0%, comprising of 1 families. On the other hand, families with no children have the lowest poverty rate of 14.3%, which includes 6 families.
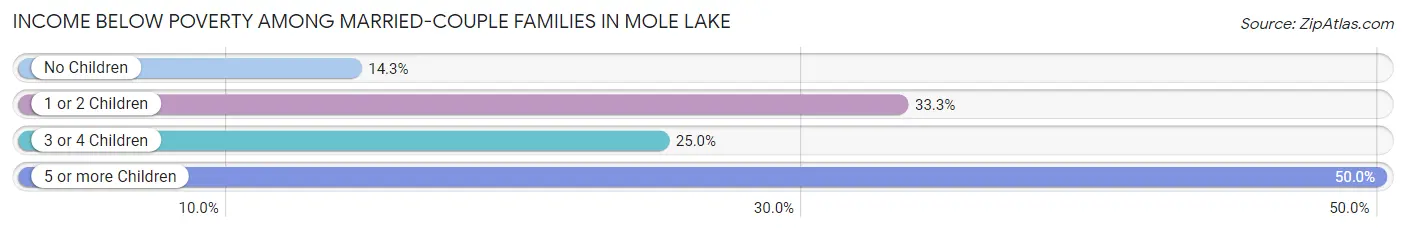
| Children | Above Poverty | Below Poverty |
| No Children | 36 (85.7%) | 6 (14.3%) |
| 1 or 2 Children | 4 (66.7%) | 2 (33.3%) |
| 3 or 4 Children | 9 (75.0%) | 3 (25.0%) |
| 5 or more Children | 1 (50.0%) | 1 (50.0%) |
| Total | 50 (80.6%) | 12 (19.4%) |
Income Below Poverty Among Single-Parent Households in Mole Lake
According to the poverty data in Mole Lake, 9.1% or 2 single-father households and 32.3% or 10 single-mother households are living below the poverty line. Among single-father households, those with 1 or 2 children have the highest poverty rate, with 2 households (22.2%) experiencing poverty. Likewise, among single-mother households, those with 5 or more children have the highest poverty rate, with 1 households (100.0%) falling below the poverty line.
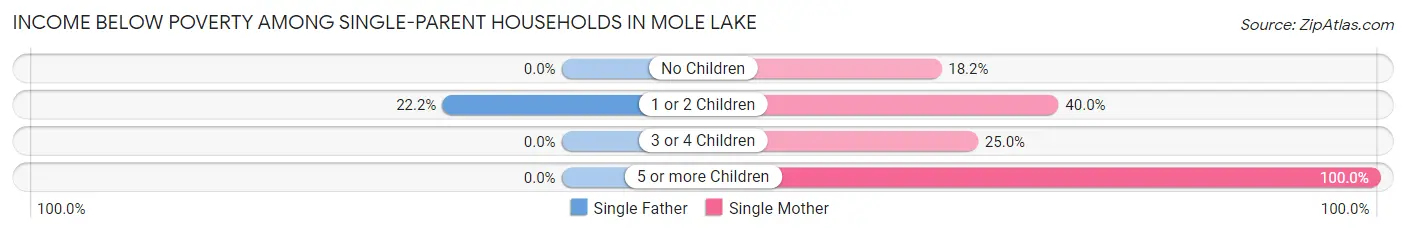
| Children | Single Father | Single Mother |
| No Children | 0 (0.0%) | 2 (18.2%) |
| 1 or 2 Children | 2 (22.2%) | 6 (40.0%) |
| 3 or 4 Children | 0 (0.0%) | 1 (25.0%) |
| 5 or more Children | 0 (0.0%) | 1 (100.0%) |
| Total | 2 (9.1%) | 10 (32.3%) |
Income Below Poverty Among Married-Couple vs Single-Parent Households in Mole Lake
The poverty data for Mole Lake shows that 12 of the married-couple family households (19.4%) and 12 of the single-parent households (22.6%) are living below the poverty level. Within the married-couple family households, those with 5 or more children have the highest poverty rate, with 1 households (50.0%) falling below the poverty line. Among the single-parent households, those with 5 or more children have the highest poverty rate, with 1 household (100.0%) living below poverty.
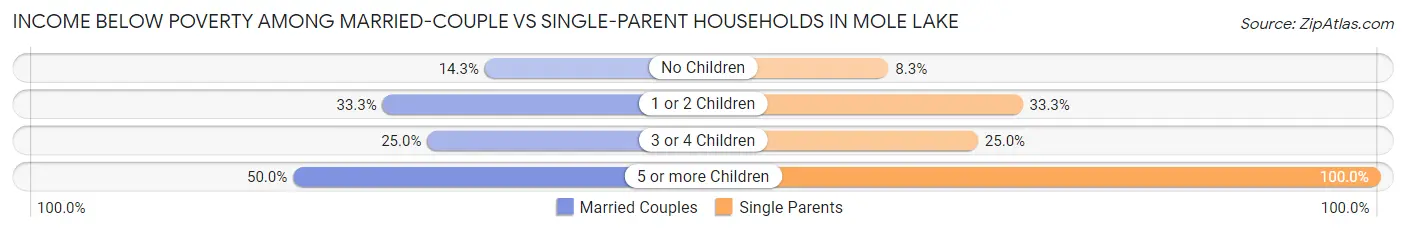
| Children | Married-Couple Families | Single-Parent Households |
| No Children | 6 (14.3%) | 2 (8.3%) |
| 1 or 2 Children | 2 (33.3%) | 8 (33.3%) |
| 3 or 4 Children | 3 (25.0%) | 1 (25.0%) |
| 5 or more Children | 1 (50.0%) | 1 (100.0%) |
| Total | 12 (19.4%) | 12 (22.6%) |
Race in Mole Lake
The most populous races in Mole Lake are Native / Alaskan (400 | 76.2%), White / Caucasian (98 | 18.7%), and Hispanic or Latino (46 | 8.8%).
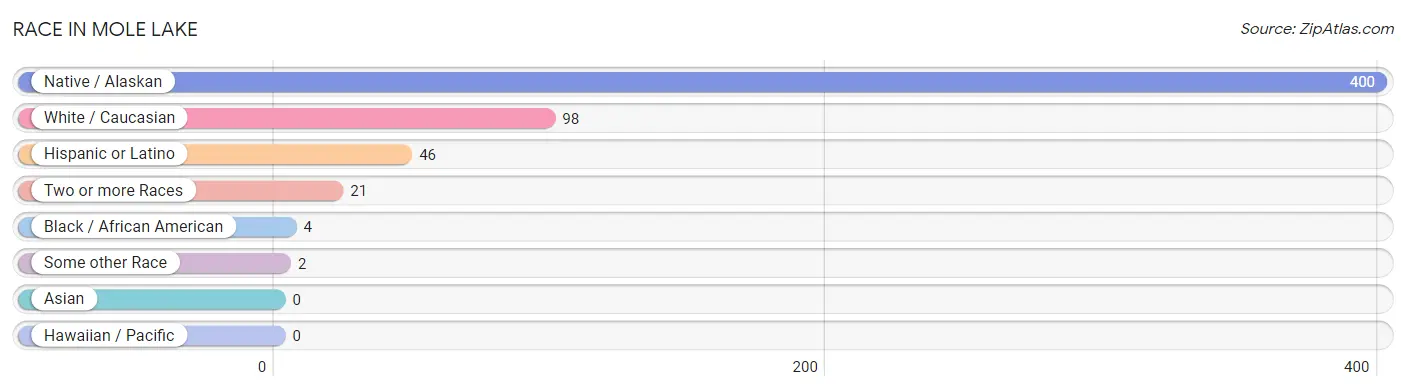
| Race | # Population | % Population |
| Asian | 0 | 0.0% |
| Black / African American | 4 | 0.8% |
| Hawaiian / Pacific | 0 | 0.0% |
| Hispanic or Latino | 46 | 8.8% |
| Native / Alaskan | 400 | 76.2% |
| White / Caucasian | 98 | 18.7% |
| Two or more Races | 21 | 4.0% |
| Some other Race | 2 | 0.4% |
| Total | 525 | 100.0% |
Ancestry in Mole Lake
The most populous ancestries reported in Mole Lake are Chippewa (345 | 65.7%), German (46 | 8.8%), Mexican (46 | 8.8%), Potawatomi (19 | 3.6%), and English (14 | 2.7%), together accounting for 89.5% of all Mole Lake residents.
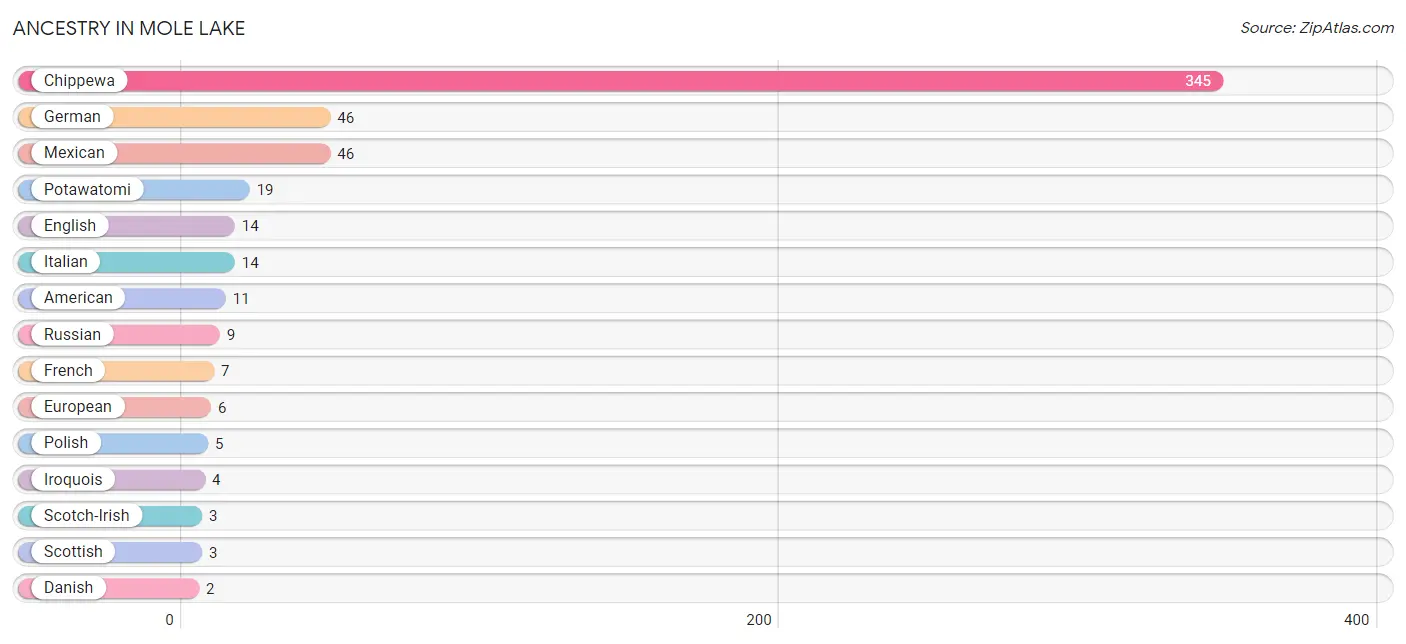
| Ancestry | # Population | % Population |
| American | 11 | 2.1% |
| Chippewa | 345 | 65.7% |
| Danish | 2 | 0.4% |
| English | 14 | 2.7% |
| European | 6 | 1.1% |
| French | 7 | 1.3% |
| German | 46 | 8.8% |
| Irish | 2 | 0.4% |
| Iroquois | 4 | 0.8% |
| Italian | 14 | 2.7% |
| Lithuanian | 1 | 0.2% |
| Menominee | 1 | 0.2% |
| Mexican | 46 | 8.8% |
| Polish | 5 | 0.9% |
| Potawatomi | 19 | 3.6% |
| Russian | 9 | 1.7% |
| Scotch-Irish | 3 | 0.6% |
| Scottish | 3 | 0.6% | View All 18 Rows |
Immigrants in Mole Lake
The most numerous immigrant groups reported in Mole Lake came from Central America (2 | 0.4%), Europe (2 | 0.4%), Germany (2 | 0.4%), Latin America (2 | 0.4%), and Mexico (2 | 0.4%), together accounting for 1.9% of all Mole Lake residents.
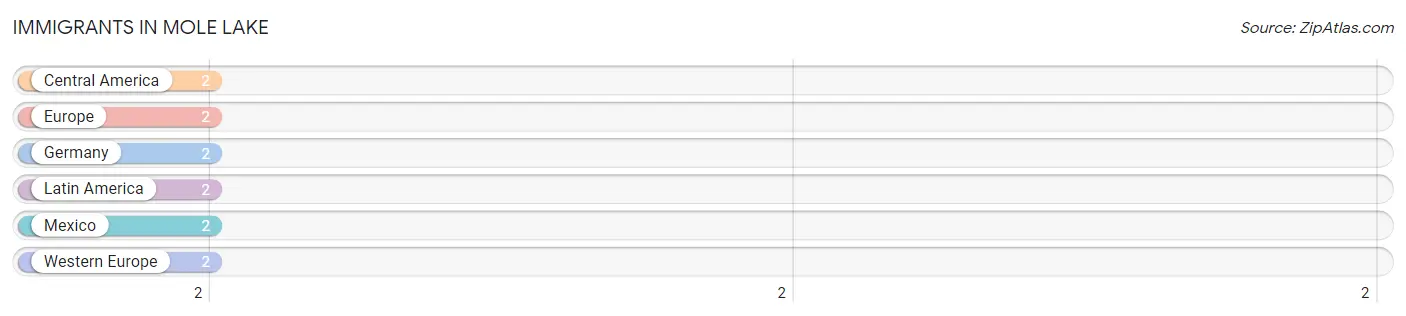
| Immigration Origin | # Population | % Population |
| Central America | 2 | 0.4% |
| Europe | 2 | 0.4% |
| Germany | 2 | 0.4% |
| Latin America | 2 | 0.4% |
| Mexico | 2 | 0.4% |
| Western Europe | 2 | 0.4% | View All 6 Rows |
Sex and Age in Mole Lake
Sex and Age in Mole Lake
The most populous age groups in Mole Lake are 55 to 59 Years (38 | 14.1%) for men and 5 to 9 Years (32 | 12.5%) for women.
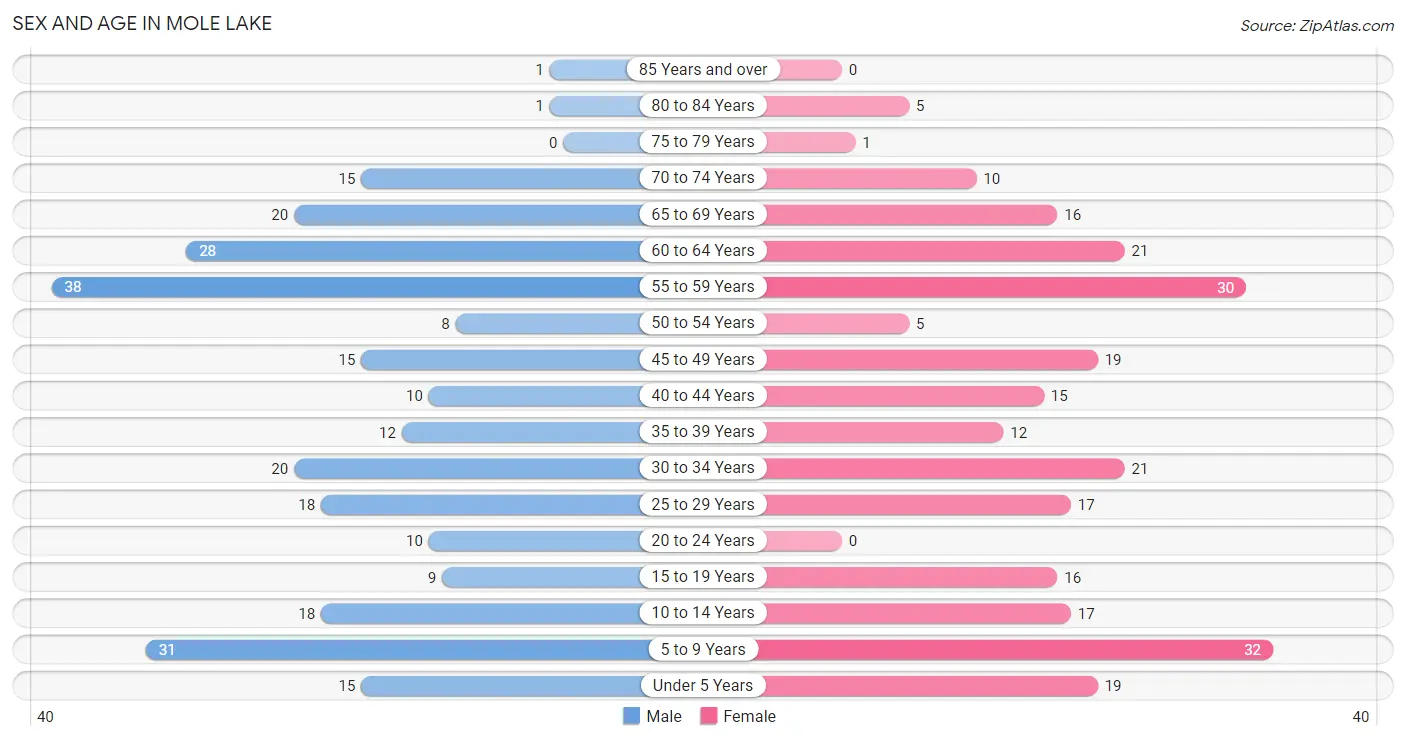
| Age Bracket | Male | Female |
| Under 5 Years | 15 (5.6%) | 19 (7.4%) |
| 5 to 9 Years | 31 (11.5%) | 32 (12.5%) |
| 10 to 14 Years | 18 (6.7%) | 17 (6.6%) |
| 15 to 19 Years | 9 (3.4%) | 16 (6.2%) |
| 20 to 24 Years | 10 (3.7%) | 0 (0.0%) |
| 25 to 29 Years | 18 (6.7%) | 17 (6.6%) |
| 30 to 34 Years | 20 (7.4%) | 21 (8.2%) |
| 35 to 39 Years | 12 (4.5%) | 12 (4.7%) |
| 40 to 44 Years | 10 (3.7%) | 15 (5.9%) |
| 45 to 49 Years | 15 (5.6%) | 19 (7.4%) |
| 50 to 54 Years | 8 (3.0%) | 5 (1.9%) |
| 55 to 59 Years | 38 (14.1%) | 30 (11.7%) |
| 60 to 64 Years | 28 (10.4%) | 21 (8.2%) |
| 65 to 69 Years | 20 (7.4%) | 16 (6.2%) |
| 70 to 74 Years | 15 (5.6%) | 10 (3.9%) |
| 75 to 79 Years | 0 (0.0%) | 1 (0.4%) |
| 80 to 84 Years | 1 (0.4%) | 5 (1.9%) |
| 85 Years and over | 1 (0.4%) | 0 (0.0%) |
| Total | 269 (100.0%) | 256 (100.0%) |
Families and Households in Mole Lake
Median Family Size in Mole Lake
The median family size in Mole Lake is 3.58 persons per family, with single female/mother families (31 | 27.0%) accounting for the largest median family size of 4.06 persons per family. On the other hand, single male/father families (22 | 19.1%) represent the smallest median family size with 2.64 persons per family.
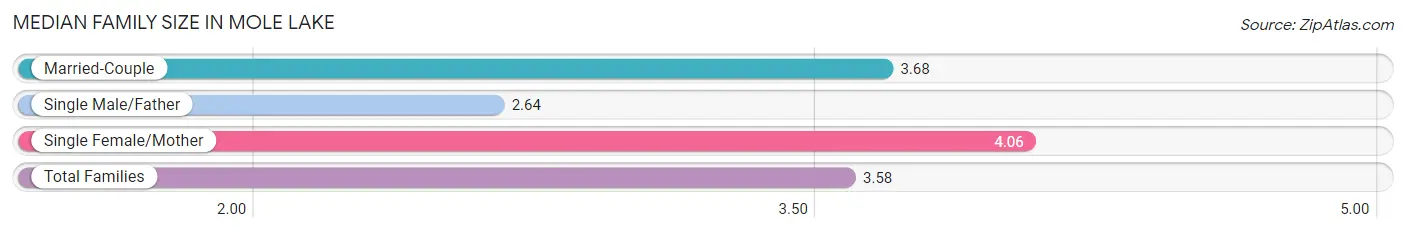
| Family Type | # Families | Family Size |
| Married-Couple | 62 (53.9%) | 3.68 |
| Single Male/Father | 22 (19.1%) | 2.64 |
| Single Female/Mother | 31 (27.0%) | 4.06 |
| Total Families | 115 (100.0%) | 3.58 |
Median Household Size in Mole Lake
The median household size in Mole Lake is 3.00 persons per household, with single female/mother households (31 | 17.7%) accounting for the largest median household size of 5.06 persons per household. non-family households (60 | 34.3%) represent the smallest median household size with 1.10 persons per household.
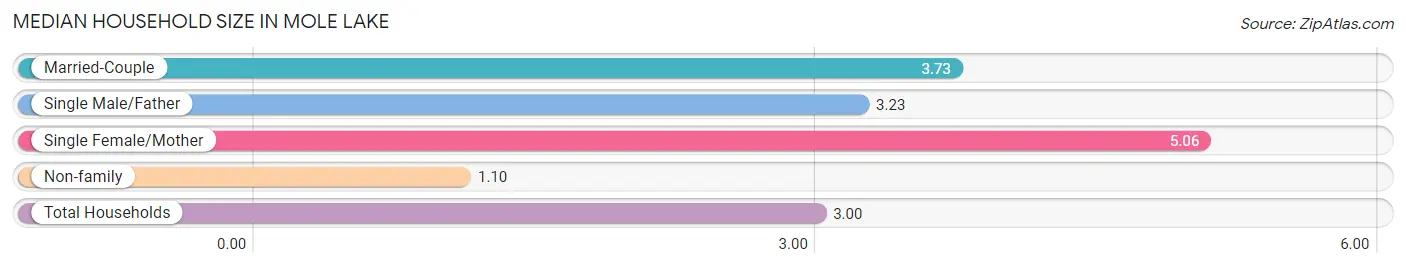
| Household Type | # Households | Household Size |
| Married-Couple | 62 (35.4%) | 3.73 |
| Single Male/Father | 22 (12.6%) | 3.23 |
| Single Female/Mother | 31 (17.7%) | 5.06 |
| Non-family | 60 (34.3%) | 1.10 |
| Total Households | 175 (100.0%) | 3.00 |
Household Size by Marriage Status in Mole Lake
Out of a total of 175 households in Mole Lake, 115 (65.7%) are family households, while 60 (34.3%) are nonfamily households. The most numerous type of family households are 2-person households, comprising 57, and the most common type of nonfamily households are 1-person households, comprising 56.
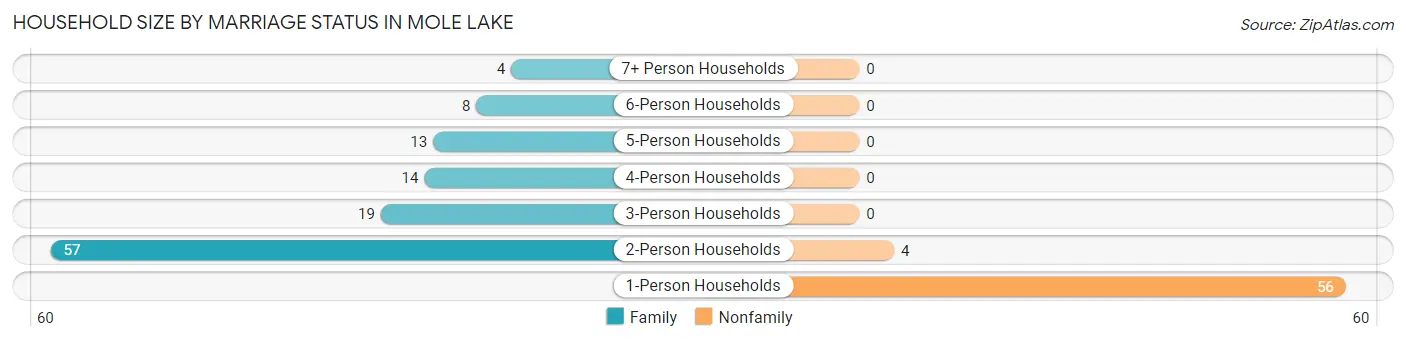
| Household Size | Family Households | Nonfamily Households |
| 1-Person Households | - | 56 (32.0%) |
| 2-Person Households | 57 (32.6%) | 4 (2.3%) |
| 3-Person Households | 19 (10.9%) | 0 (0.0%) |
| 4-Person Households | 14 (8.0%) | 0 (0.0%) |
| 5-Person Households | 13 (7.4%) | 0 (0.0%) |
| 6-Person Households | 8 (4.6%) | 0 (0.0%) |
| 7+ Person Households | 4 (2.3%) | 0 (0.0%) |
| Total | 115 (65.7%) | 60 (34.3%) |
Female Fertility in Mole Lake
Fertility by Age in Mole Lake
Average fertility rate in Mole Lake is 60.0 births per 1,000 women. Women in the age bracket of 20 to 34 years have the highest fertility rate with 132.0 births per 1,000 women. Women in the age bracket of 20 to 34 years acount for 83.3% of all women with births.
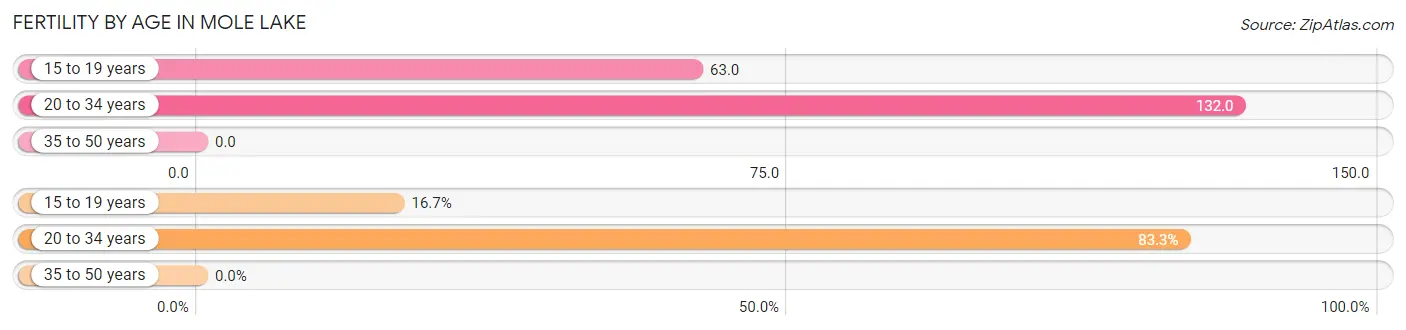
| Age Bracket | Women with Births | Births / 1,000 Women |
| 15 to 19 years | 1 (16.7%) | 63.0 |
| 20 to 34 years | 5 (83.3%) | 132.0 |
| 35 to 50 years | 0 (0.0%) | 0.0 |
| Total | 6 (100.0%) | 60.0 |
Fertility by Age by Marriage Status in Mole Lake
50.0% of women with births (6) in Mole Lake are married. The highest percentage of unmarried women with births falls into 15 to 19 years age bracket with 100.0% of them unmarried at the time of birth, while the lowest percentage of unmarried women with births belong to 20 to 34 years age bracket with 40.0% of them unmarried.
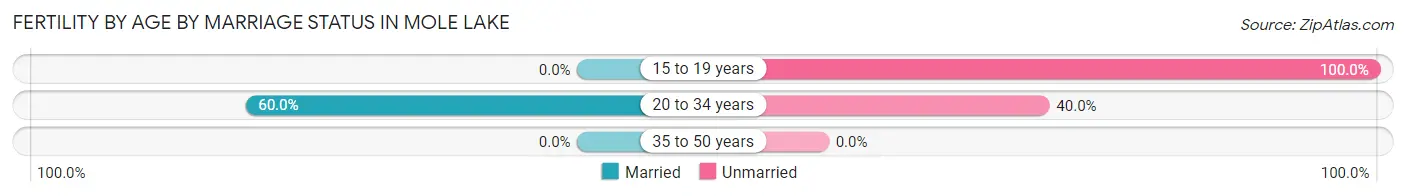
| Age Bracket | Married | Unmarried |
| 15 to 19 years | 0 (0.0%) | 1 (100.0%) |
| 20 to 34 years | 3 (60.0%) | 2 (40.0%) |
| 35 to 50 years | 0 (0.0%) | 0 (0.0%) |
| Total | 3 (50.0%) | 3 (50.0%) |
Fertility by Education in Mole Lake
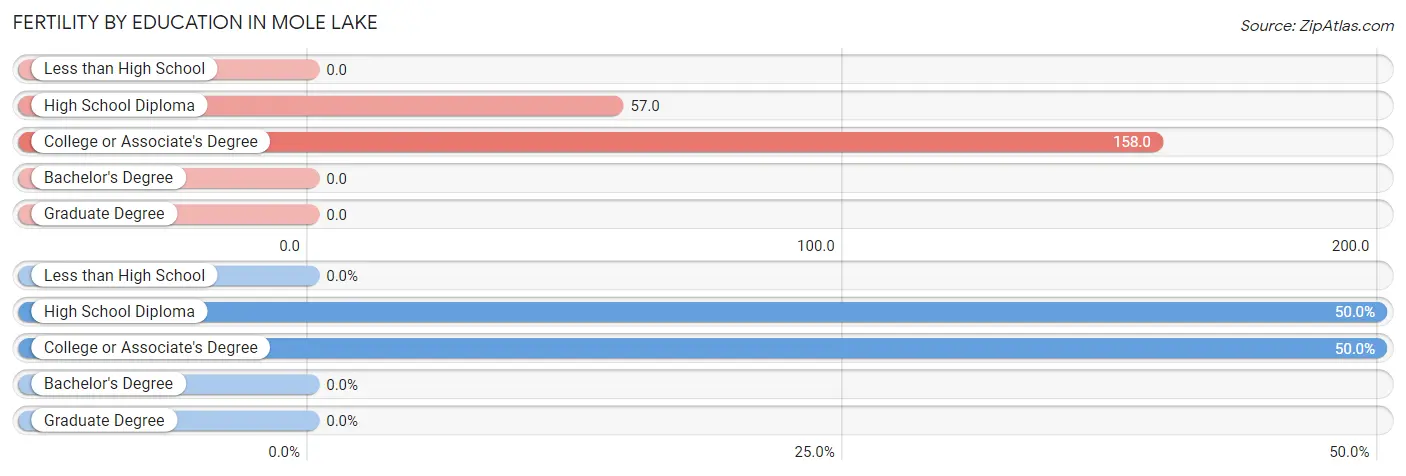
| Educational Attainment | Women with Births | Births / 1,000 Women |
| Less than High School | 0 (0.0%) | 0.0 |
| High School Diploma | 3 (50.0%) | 57.0 |
| College or Associate's Degree | 3 (50.0%) | 158.0 |
| Bachelor's Degree | 0 (0.0%) | 0.0 |
| Graduate Degree | 0 (0.0%) | 0.0 |
| Total | 6 (100.0%) | 60.0 |
Fertility by Education by Marriage Status in Mole Lake
50.0% of women with births in Mole Lake are unmarried. Women with the educational attainment of college or associate's degree are most likely to be married with 66.7% of them married at childbirth, while women with the educational attainment of high school diploma are least likely to be married with 66.7% of them unmarried at childbirth.
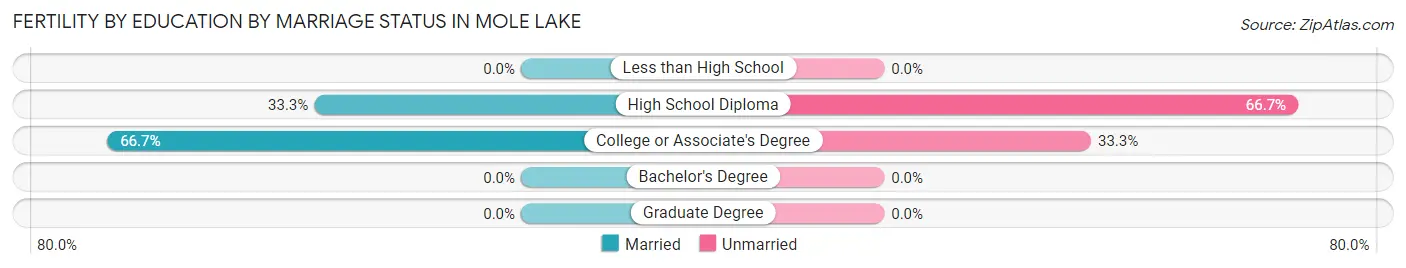
| Educational Attainment | Married | Unmarried |
| Less than High School | 0 (0.0%) | 0 (0.0%) |
| High School Diploma | 1 (33.3%) | 2 (66.7%) |
| College or Associate's Degree | 2 (66.7%) | 1 (33.3%) |
| Bachelor's Degree | 0 (0.0%) | 0 (0.0%) |
| Graduate Degree | 0 (0.0%) | 0 (0.0%) |
| Total | 3 (50.0%) | 3 (50.0%) |
Employment Characteristics in Mole Lake
Employment by Class of Employer in Mole Lake
Among the 177 employed individuals in Mole Lake, private company employees (95 | 53.7%), local government employees (34 | 19.2%), and federal government employees (23 | 13.0%) make up the most common classes of employment.
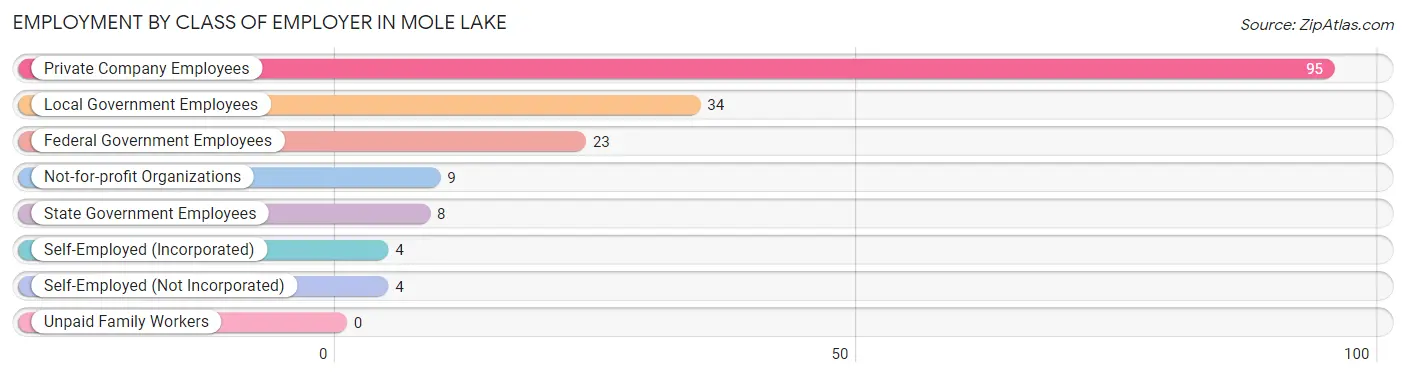
| Employer Class | # Employees | % Employees |
| Private Company Employees | 95 | 53.7% |
| Self-Employed (Incorporated) | 4 | 2.3% |
| Self-Employed (Not Incorporated) | 4 | 2.3% |
| Not-for-profit Organizations | 9 | 5.1% |
| Local Government Employees | 34 | 19.2% |
| State Government Employees | 8 | 4.5% |
| Federal Government Employees | 23 | 13.0% |
| Unpaid Family Workers | 0 | 0.0% |
| Total | 177 | 100.0% |
Employment Status by Age in Mole Lake
According to the labor force statistics for Mole Lake, out of the total population over 16 years of age (385), 52.7% or 203 individuals are in the labor force, with 10.3% or 21 of them unemployed. The age group with the highest labor force participation rate is 25 to 29 years, with 82.9% or 29 individuals in the labor force. Within the labor force, the 45 to 54 years age range has the highest percentage of unemployed individuals, with 39.1% or 9 of them being unemployed.
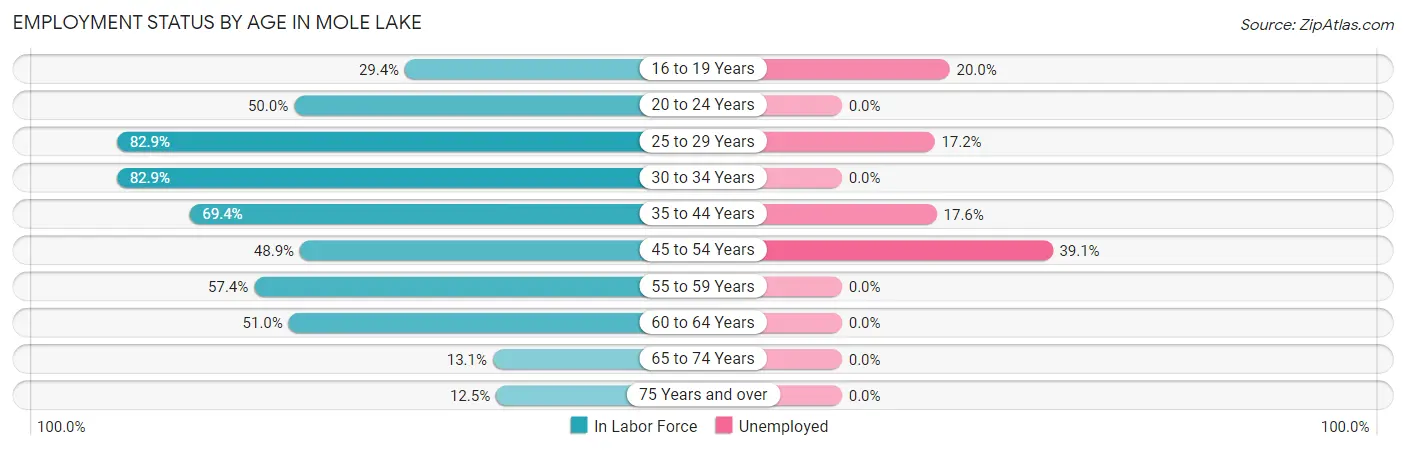
| Age Bracket | In Labor Force | Unemployed |
| 16 to 19 Years | 5 (29.4%) | 1 (20.0%) |
| 20 to 24 Years | 5 (50.0%) | 0 (0.0%) |
| 25 to 29 Years | 29 (82.9%) | 5 (17.2%) |
| 30 to 34 Years | 34 (82.9%) | 0 (0.0%) |
| 35 to 44 Years | 34 (69.4%) | 6 (17.6%) |
| 45 to 54 Years | 23 (48.9%) | 9 (39.1%) |
| 55 to 59 Years | 39 (57.4%) | 0 (0.0%) |
| 60 to 64 Years | 25 (51.0%) | 0 (0.0%) |
| 65 to 74 Years | 8 (13.1%) | 0 (0.0%) |
| 75 Years and over | 1 (12.5%) | 0 (0.0%) |
| Total | 203 (52.7%) | 21 (10.3%) |
Employment Status by Educational Attainment in Mole Lake
According to labor force statistics for Mole Lake, 63.7% of individuals (184) out of the total population between 25 and 64 years of age (289) are in the labor force, with 10.9% or 20 of them being unemployed. The group with the highest labor force participation rate are those with the educational attainment of bachelor's degree or higher, with 100.0% or 6 individuals in the labor force. Within the labor force, individuals with bachelor's degree or higher education have the highest percentage of unemployment, with 66.7% or 4 of them being unemployed.
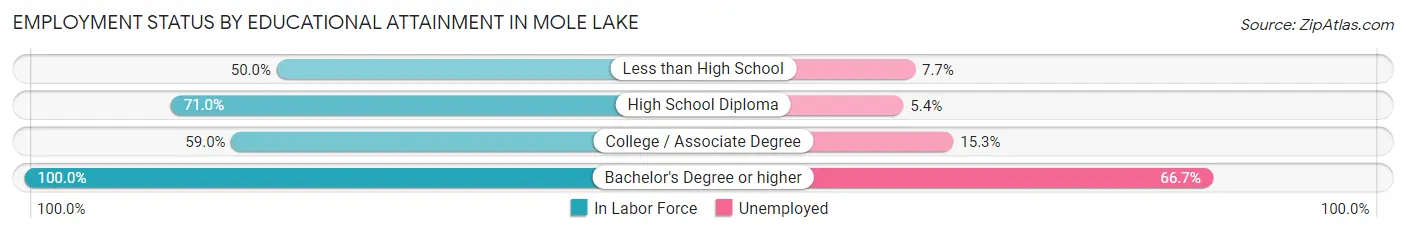
| Educational Attainment | In Labor Force | Unemployed |
| Less than High School | 26 (50.0%) | 4 (7.7%) |
| High School Diploma | 93 (71.0%) | 7 (5.4%) |
| College / Associate Degree | 59 (59.0%) | 15 (15.3%) |
| Bachelor's Degree or higher | 6 (100.0%) | 4 (66.7%) |
| Total | 184 (63.7%) | 32 (10.9%) |
Employment Occupations by Sex in Mole Lake
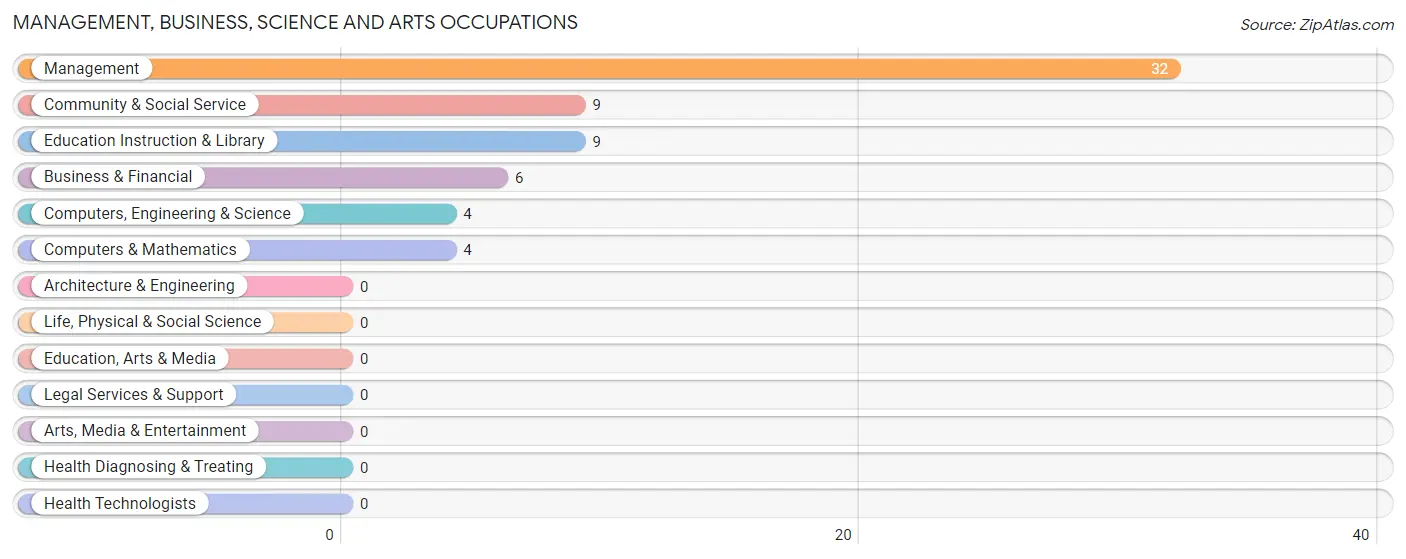
Management, Business, Science and Arts Occupations
The most common Management, Business, Science and Arts occupations in Mole Lake are Management (32 | 17.6%), Community & Social Service (9 | 5.0%), Education Instruction & Library (9 | 5.0%), Business & Financial (6 | 3.3%), and Computers, Engineering & Science (4 | 2.2%).
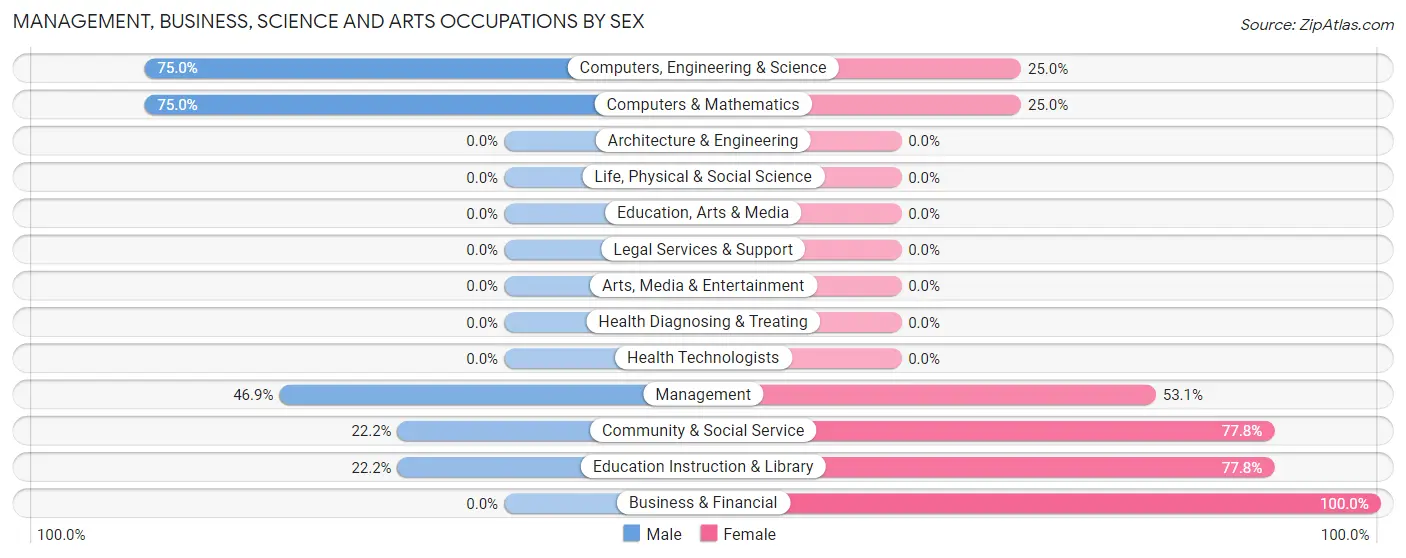
Management, Business, Science and Arts Occupations by Sex
Within the Management, Business, Science and Arts occupations in Mole Lake, the most male-oriented occupations are Computers, Engineering & Science (75.0%), Computers & Mathematics (75.0%), and Management (46.9%), while the most female-oriented occupations are Business & Financial (100.0%), Community & Social Service (77.8%), and Education Instruction & Library (77.8%).
| Occupation | Male | Female |
| Management | 15 (46.9%) | 17 (53.1%) |
| Business & Financial | 0 (0.0%) | 6 (100.0%) |
| Computers, Engineering & Science | 3 (75.0%) | 1 (25.0%) |
| Computers & Mathematics | 3 (75.0%) | 1 (25.0%) |
| Architecture & Engineering | 0 (0.0%) | 0 (0.0%) |
| Life, Physical & Social Science | 0 (0.0%) | 0 (0.0%) |
| Community & Social Service | 2 (22.2%) | 7 (77.8%) |
| Education, Arts & Media | 0 (0.0%) | 0 (0.0%) |
| Legal Services & Support | 0 (0.0%) | 0 (0.0%) |
| Education Instruction & Library | 2 (22.2%) | 7 (77.8%) |
| Arts, Media & Entertainment | 0 (0.0%) | 0 (0.0%) |
| Health Diagnosing & Treating | 0 (0.0%) | 0 (0.0%) |
| Health Technologists | 0 (0.0%) | 0 (0.0%) |
| Total (Category) | 20 (39.2%) | 31 (60.8%) |
| Total (Overall) | 103 (56.6%) | 79 (43.4%) |
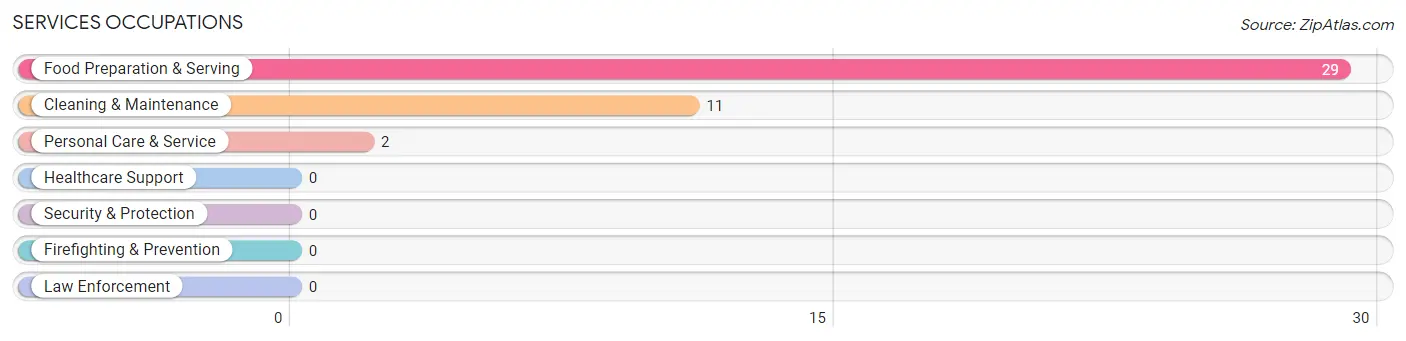
Services Occupations
The most common Services occupations in Mole Lake are Food Preparation & Serving (29 | 15.9%), Cleaning & Maintenance (11 | 6.0%), and Personal Care & Service (2 | 1.1%).
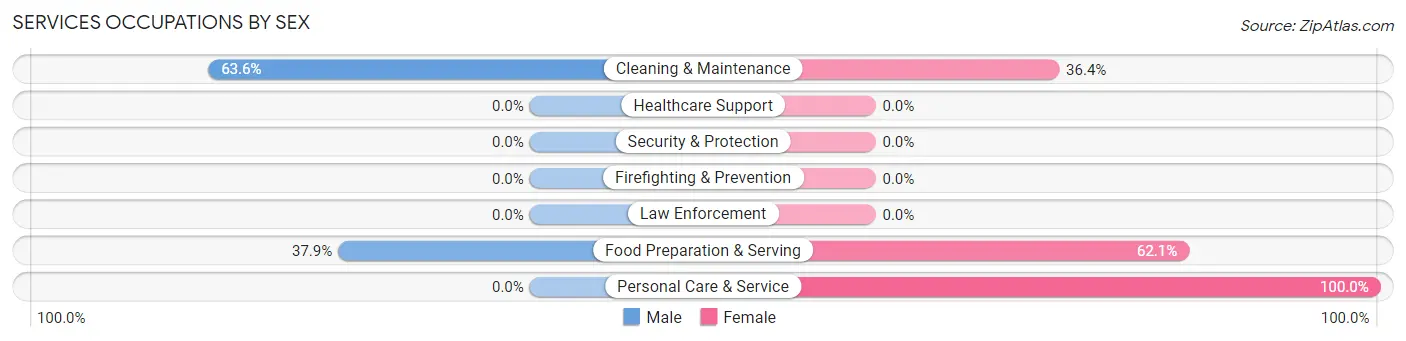
Services Occupations by Sex
Within the Services occupations in Mole Lake, the most male-oriented occupations are Cleaning & Maintenance (63.6%), and Food Preparation & Serving (37.9%), while the most female-oriented occupations are Personal Care & Service (100.0%), Food Preparation & Serving (62.1%), and Cleaning & Maintenance (36.4%).
| Occupation | Male | Female |
| Healthcare Support | 0 (0.0%) | 0 (0.0%) |
| Security & Protection | 0 (0.0%) | 0 (0.0%) |
| Firefighting & Prevention | 0 (0.0%) | 0 (0.0%) |
| Law Enforcement | 0 (0.0%) | 0 (0.0%) |
| Food Preparation & Serving | 11 (37.9%) | 18 (62.1%) |
| Cleaning & Maintenance | 7 (63.6%) | 4 (36.4%) |
| Personal Care & Service | 0 (0.0%) | 2 (100.0%) |
| Total (Category) | 18 (42.9%) | 24 (57.1%) |
| Total (Overall) | 103 (56.6%) | 79 (43.4%) |
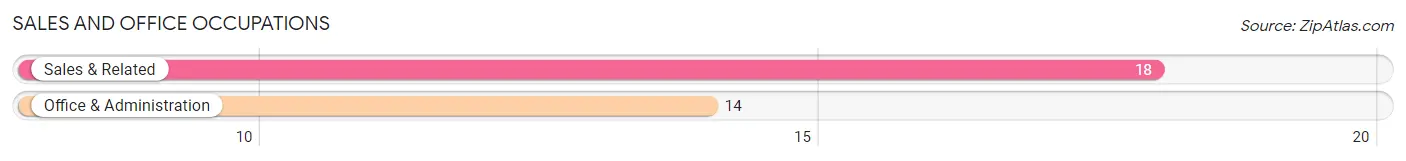
Sales and Office Occupations
The most common Sales and Office occupations in Mole Lake are Sales & Related (18 | 9.9%), and Office & Administration (14 | 7.7%).
Sales and Office Occupations by Sex
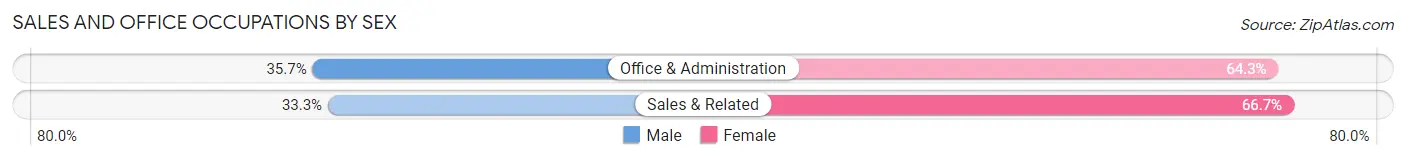
| Occupation | Male | Female |
| Sales & Related | 6 (33.3%) | 12 (66.7%) |
| Office & Administration | 5 (35.7%) | 9 (64.3%) |
| Total (Category) | 11 (34.4%) | 21 (65.6%) |
| Total (Overall) | 103 (56.6%) | 79 (43.4%) |
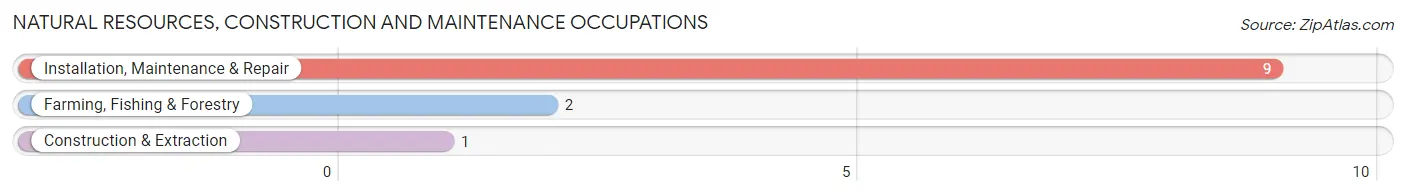
Natural Resources, Construction and Maintenance Occupations
The most common Natural Resources, Construction and Maintenance occupations in Mole Lake are Installation, Maintenance & Repair (9 | 5.0%), Farming, Fishing & Forestry (2 | 1.1%), and Construction & Extraction (1 | 0.5%).
Natural Resources, Construction and Maintenance Occupations by Sex
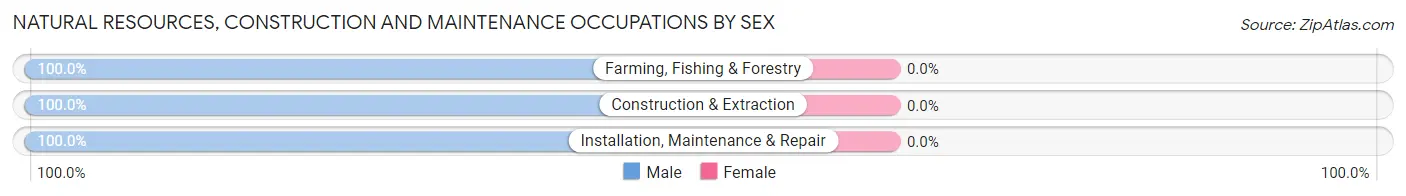
| Occupation | Male | Female |
| Farming, Fishing & Forestry | 2 (100.0%) | 0 (0.0%) |
| Construction & Extraction | 1 (100.0%) | 0 (0.0%) |
| Installation, Maintenance & Repair | 9 (100.0%) | 0 (0.0%) |
| Total (Category) | 12 (100.0%) | 0 (0.0%) |
| Total (Overall) | 103 (56.6%) | 79 (43.4%) |
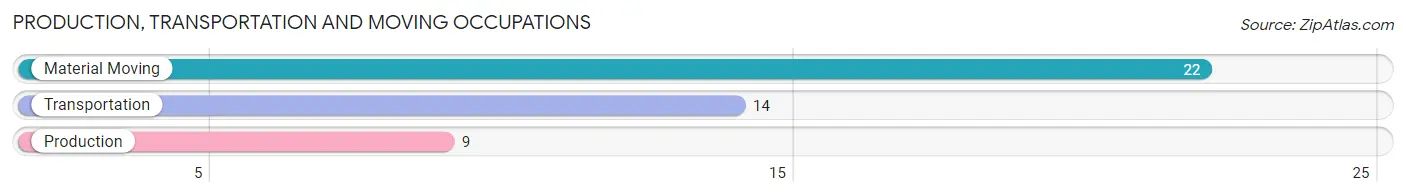
Production, Transportation and Moving Occupations
The most common Production, Transportation and Moving occupations in Mole Lake are Material Moving (22 | 12.1%), Transportation (14 | 7.7%), and Production (9 | 5.0%).
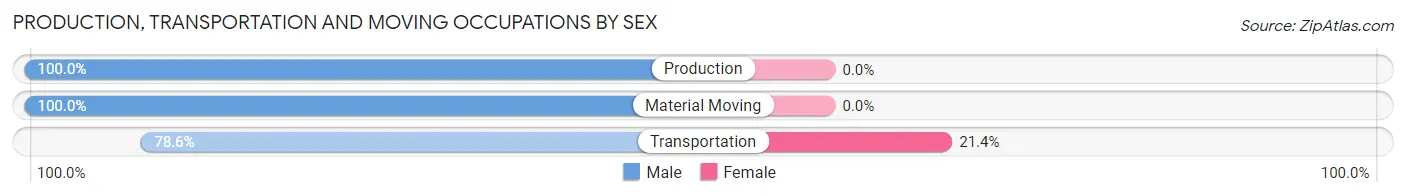
Production, Transportation and Moving Occupations by Sex
| Occupation | Male | Female |
| Production | 9 (100.0%) | 0 (0.0%) |
| Transportation | 11 (78.6%) | 3 (21.4%) |
| Material Moving | 22 (100.0%) | 0 (0.0%) |
| Total (Category) | 42 (93.3%) | 3 (6.7%) |
| Total (Overall) | 103 (56.6%) | 79 (43.4%) |
Employment Industries by Sex in Mole Lake
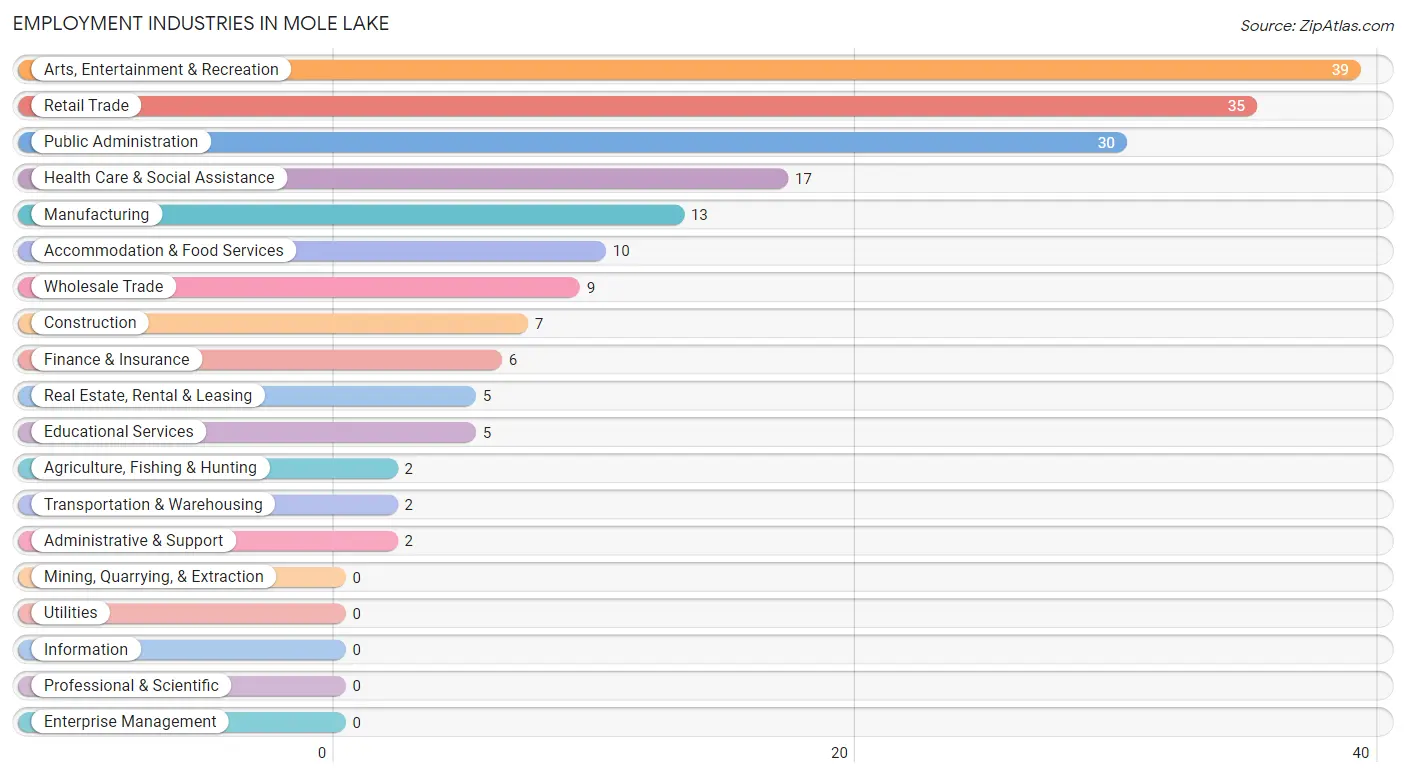
Employment Industries in Mole Lake
The major employment industries in Mole Lake include Arts, Entertainment & Recreation (39 | 21.4%), Retail Trade (35 | 19.2%), Public Administration (30 | 16.5%), Health Care & Social Assistance (17 | 9.3%), and Manufacturing (13 | 7.1%).
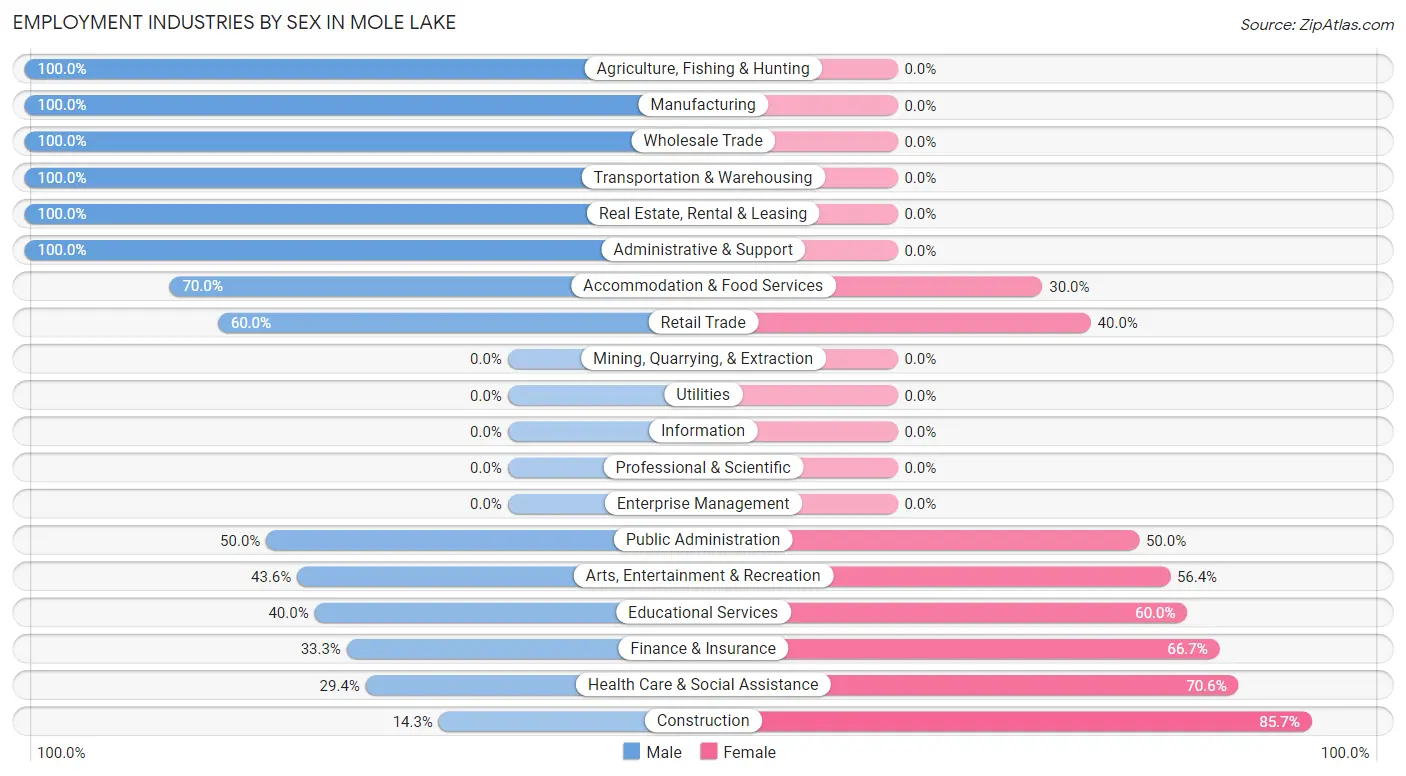
Employment Industries by Sex in Mole Lake
The Mole Lake industries that see more men than women are Agriculture, Fishing & Hunting (100.0%), Manufacturing (100.0%), and Wholesale Trade (100.0%), whereas the industries that tend to have a higher number of women are Construction (85.7%), Health Care & Social Assistance (70.6%), and Finance & Insurance (66.7%).
| Industry | Male | Female |
| Agriculture, Fishing & Hunting | 2 (100.0%) | 0 (0.0%) |
| Mining, Quarrying, & Extraction | 0 (0.0%) | 0 (0.0%) |
| Construction | 1 (14.3%) | 6 (85.7%) |
| Manufacturing | 13 (100.0%) | 0 (0.0%) |
| Wholesale Trade | 9 (100.0%) | 0 (0.0%) |
| Retail Trade | 21 (60.0%) | 14 (40.0%) |
| Transportation & Warehousing | 2 (100.0%) | 0 (0.0%) |
| Utilities | 0 (0.0%) | 0 (0.0%) |
| Information | 0 (0.0%) | 0 (0.0%) |
| Finance & Insurance | 2 (33.3%) | 4 (66.7%) |
| Real Estate, Rental & Leasing | 5 (100.0%) | 0 (0.0%) |
| Professional & Scientific | 0 (0.0%) | 0 (0.0%) |
| Enterprise Management | 0 (0.0%) | 0 (0.0%) |
| Administrative & Support | 2 (100.0%) | 0 (0.0%) |
| Educational Services | 2 (40.0%) | 3 (60.0%) |
| Health Care & Social Assistance | 5 (29.4%) | 12 (70.6%) |
| Arts, Entertainment & Recreation | 17 (43.6%) | 22 (56.4%) |
| Accommodation & Food Services | 7 (70.0%) | 3 (30.0%) |
| Public Administration | 15 (50.0%) | 15 (50.0%) |
| Total | 103 (56.6%) | 79 (43.4%) |
Education in Mole Lake
School Enrollment in Mole Lake
The most common levels of schooling among the 120 students in Mole Lake are elementary school (39 | 32.5%), middle school (29 | 24.2%), and nursery / preschool (21 | 17.5%).
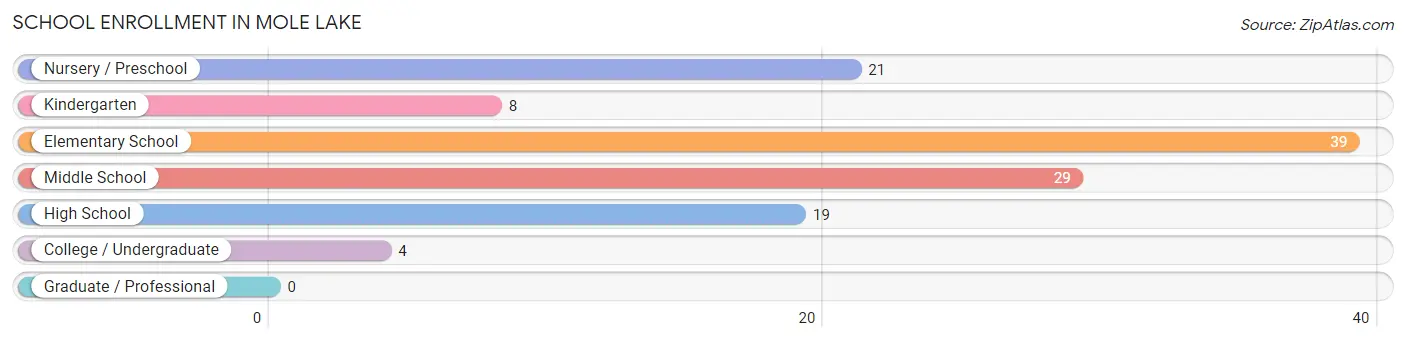
| School Level | # Students | % Students |
| Nursery / Preschool | 21 | 17.5% |
| Kindergarten | 8 | 6.7% |
| Elementary School | 39 | 32.5% |
| Middle School | 29 | 24.2% |
| High School | 19 | 15.8% |
| College / Undergraduate | 4 | 3.3% |
| Graduate / Professional | 0 | 0.0% |
| Total | 120 | 100.0% |
School Enrollment by Age by Funding Source in Mole Lake
Out of a total of 120 students who are enrolled in schools in Mole Lake, 3 (2.5%) attend a private institution, while the remaining 117 (97.5%) are enrolled in public schools. The age group of 5 to 9 year old has the highest likelihood of being enrolled in private schools, with 2 (3.3% in the age bracket) enrolled. Conversely, the age group of 3 to 4 year olds has the lowest likelihood of being enrolled in a private school, with 5 (100.0% in the age bracket) attending a public institution.
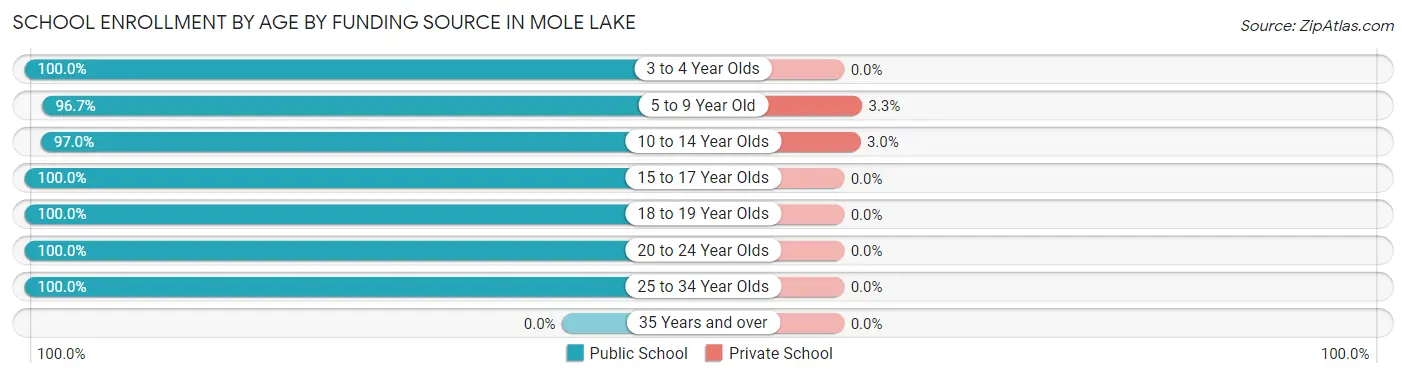
| Age Bracket | Public School | Private School |
| 3 to 4 Year Olds | 5 (100.0%) | 0 (0.0%) |
| 5 to 9 Year Old | 58 (96.7%) | 2 (3.3%) |
| 10 to 14 Year Olds | 32 (97.0%) | 1 (3.0%) |
| 15 to 17 Year Olds | 16 (100.0%) | 0 (0.0%) |
| 18 to 19 Year Olds | 2 (100.0%) | 0 (0.0%) |
| 20 to 24 Year Olds | 2 (100.0%) | 0 (0.0%) |
| 25 to 34 Year Olds | 2 (100.0%) | 0 (0.0%) |
| 35 Years and over | 0 (0.0%) | 0 (0.0%) |
| Total | 117 (97.5%) | 3 (2.5%) |
Educational Attainment by Field of Study in Mole Lake
Social sciences (4 | 57.1%), and business (3 | 42.9%) are the most common fields of study among 7 individuals in Mole Lake who have obtained a bachelor's degree or higher.
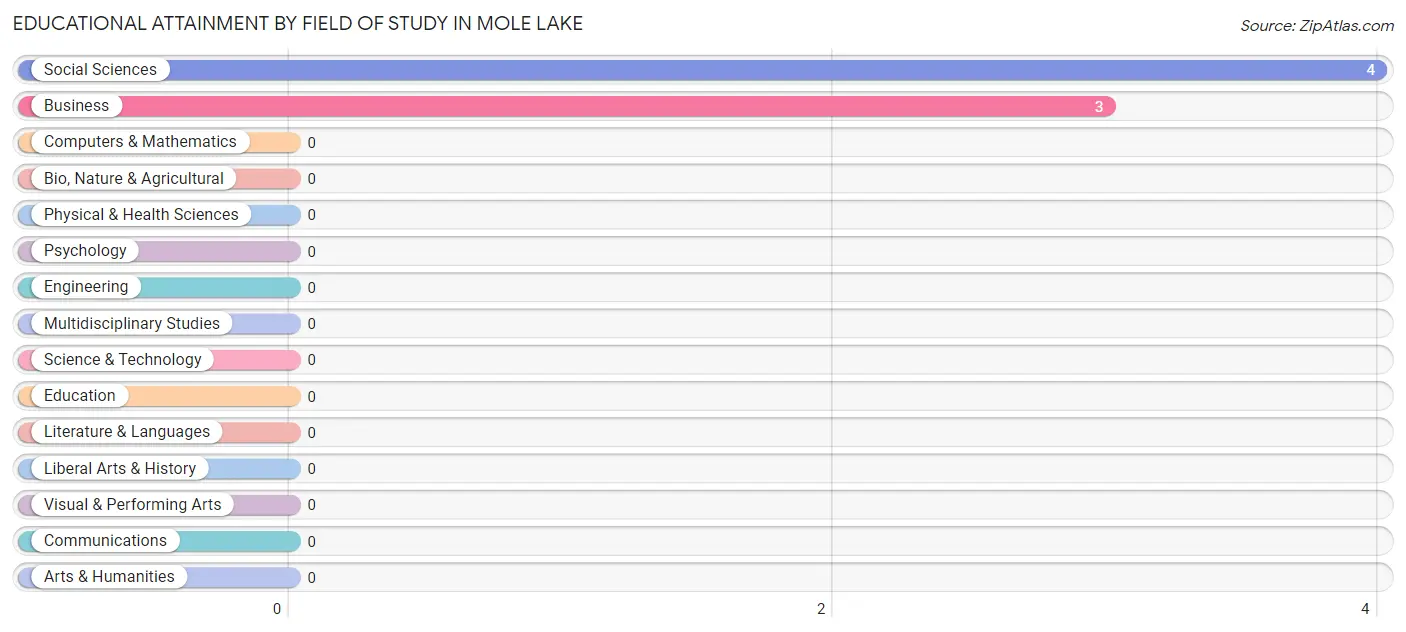
| Field of Study | # Graduates | % Graduates |
| Computers & Mathematics | 0 | 0.0% |
| Bio, Nature & Agricultural | 0 | 0.0% |
| Physical & Health Sciences | 0 | 0.0% |
| Psychology | 0 | 0.0% |
| Social Sciences | 4 | 57.1% |
| Engineering | 0 | 0.0% |
| Multidisciplinary Studies | 0 | 0.0% |
| Science & Technology | 0 | 0.0% |
| Business | 3 | 42.9% |
| Education | 0 | 0.0% |
| Literature & Languages | 0 | 0.0% |
| Liberal Arts & History | 0 | 0.0% |
| Visual & Performing Arts | 0 | 0.0% |
| Communications | 0 | 0.0% |
| Arts & Humanities | 0 | 0.0% |
| Total | 7 | 100.0% |
Transportation & Commute in Mole Lake
Vehicle Availability by Sex in Mole Lake
The most prevalent vehicle ownership categories in Mole Lake are males with 2 vehicles (38, accounting for 37.6%) and females with 2 vehicles (36, making up 50.0%).
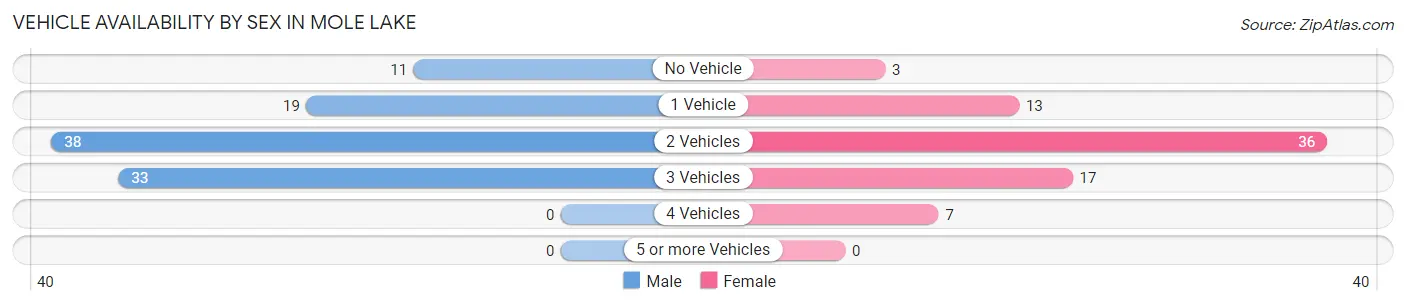
| Vehicles Available | Male | Female |
| No Vehicle | 11 (10.9%) | 3 (4.0%) |
| 1 Vehicle | 19 (18.8%) | 13 (17.1%) |
| 2 Vehicles | 38 (37.6%) | 36 (47.4%) |
| 3 Vehicles | 33 (32.7%) | 17 (22.4%) |
| 4 Vehicles | 0 (0.0%) | 7 (9.2%) |
| 5 or more Vehicles | 0 (0.0%) | 0 (0.0%) |
| Total | 101 (100.0%) | 76 (100.0%) |
Commute Time in Mole Lake
The most frequently occuring commute durations in Mole Lake are 5 to 9 minutes (57 commuters, 32.2%), less than 5 minutes (29 commuters, 16.4%), and 15 to 19 minutes (28 commuters, 15.8%).
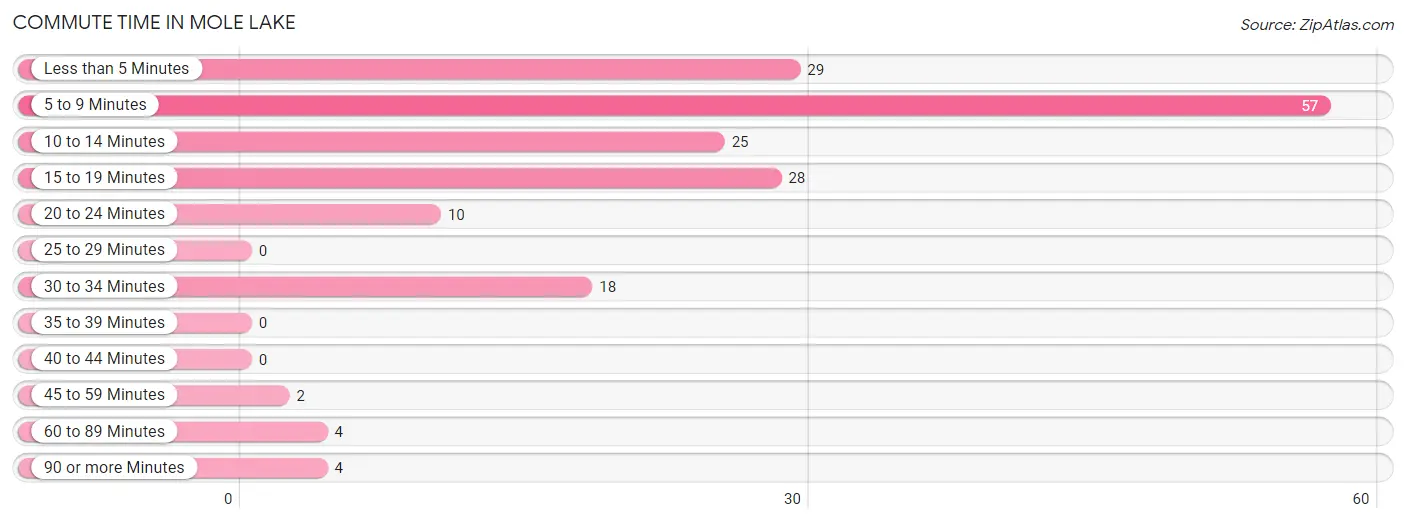
| Commute Time | # Commuters | % Commuters |
| Less than 5 Minutes | 29 | 16.4% |
| 5 to 9 Minutes | 57 | 32.2% |
| 10 to 14 Minutes | 25 | 14.1% |
| 15 to 19 Minutes | 28 | 15.8% |
| 20 to 24 Minutes | 10 | 5.7% |
| 25 to 29 Minutes | 0 | 0.0% |
| 30 to 34 Minutes | 18 | 10.2% |
| 35 to 39 Minutes | 0 | 0.0% |
| 40 to 44 Minutes | 0 | 0.0% |
| 45 to 59 Minutes | 2 | 1.1% |
| 60 to 89 Minutes | 4 | 2.3% |
| 90 or more Minutes | 4 | 2.3% |
Commute Time by Sex in Mole Lake
The most common commute times in Mole Lake are 5 to 9 minutes (36 commuters, 35.6%) for males and 5 to 9 minutes (21 commuters, 27.6%) for females.
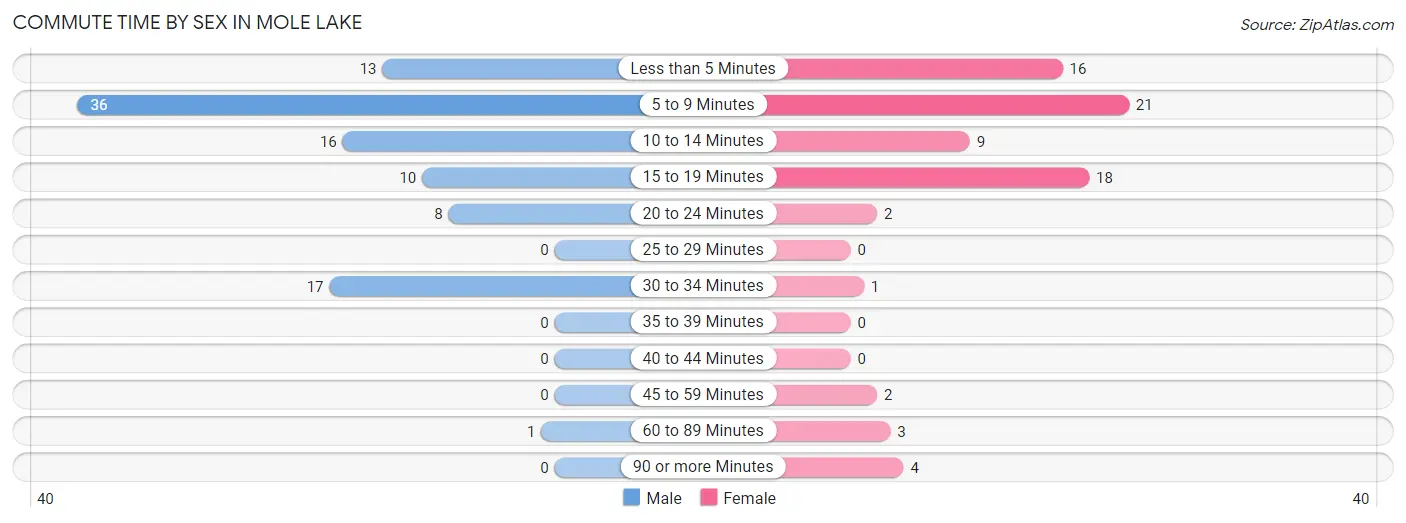
| Commute Time | Male | Female |
| Less than 5 Minutes | 13 (12.9%) | 16 (21.0%) |
| 5 to 9 Minutes | 36 (35.6%) | 21 (27.6%) |
| 10 to 14 Minutes | 16 (15.8%) | 9 (11.8%) |
| 15 to 19 Minutes | 10 (9.9%) | 18 (23.7%) |
| 20 to 24 Minutes | 8 (7.9%) | 2 (2.6%) |
| 25 to 29 Minutes | 0 (0.0%) | 0 (0.0%) |
| 30 to 34 Minutes | 17 (16.8%) | 1 (1.3%) |
| 35 to 39 Minutes | 0 (0.0%) | 0 (0.0%) |
| 40 to 44 Minutes | 0 (0.0%) | 0 (0.0%) |
| 45 to 59 Minutes | 0 (0.0%) | 2 (2.6%) |
| 60 to 89 Minutes | 1 (1.0%) | 3 (4.0%) |
| 90 or more Minutes | 0 (0.0%) | 4 (5.3%) |
Time of Departure to Work by Sex in Mole Lake
The most frequent times of departure to work in Mole Lake are 7:30 AM to 7:59 AM (18, 17.8%) for males and 6:30 AM to 6:59 AM (21, 27.6%) for females.
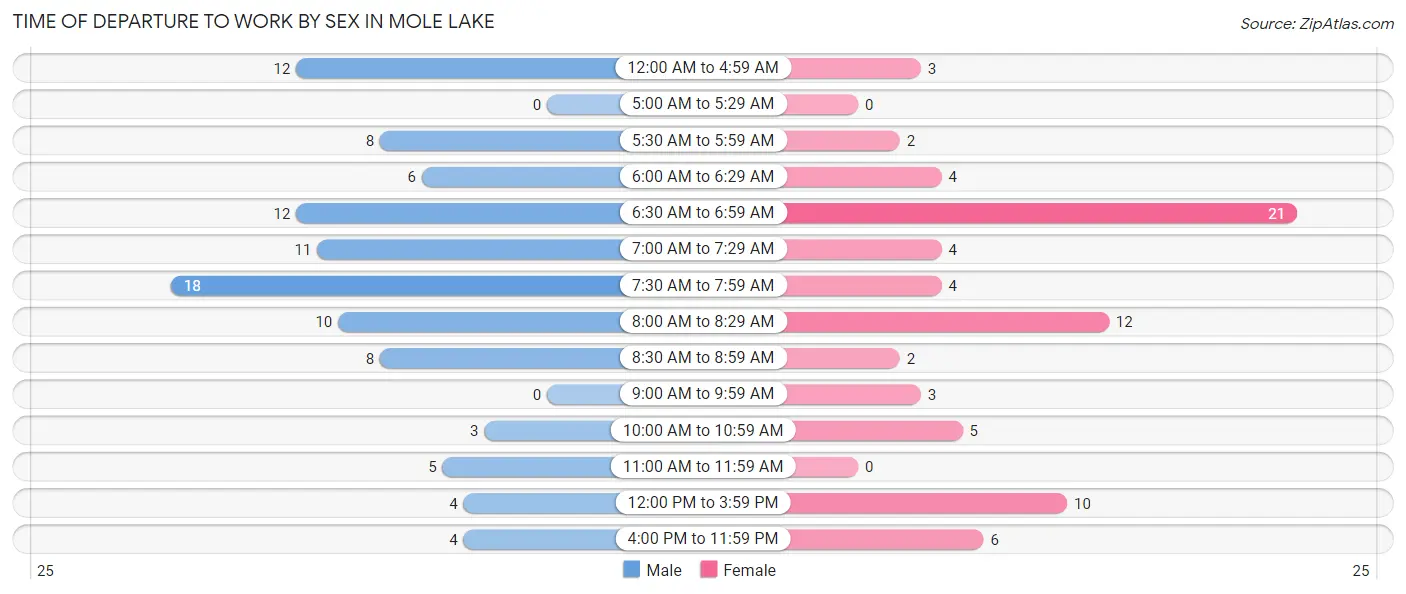
| Time of Departure | Male | Female |
| 12:00 AM to 4:59 AM | 12 (11.9%) | 3 (4.0%) |
| 5:00 AM to 5:29 AM | 0 (0.0%) | 0 (0.0%) |
| 5:30 AM to 5:59 AM | 8 (7.9%) | 2 (2.6%) |
| 6:00 AM to 6:29 AM | 6 (5.9%) | 4 (5.3%) |
| 6:30 AM to 6:59 AM | 12 (11.9%) | 21 (27.6%) |
| 7:00 AM to 7:29 AM | 11 (10.9%) | 4 (5.3%) |
| 7:30 AM to 7:59 AM | 18 (17.8%) | 4 (5.3%) |
| 8:00 AM to 8:29 AM | 10 (9.9%) | 12 (15.8%) |
| 8:30 AM to 8:59 AM | 8 (7.9%) | 2 (2.6%) |
| 9:00 AM to 9:59 AM | 0 (0.0%) | 3 (4.0%) |
| 10:00 AM to 10:59 AM | 3 (3.0%) | 5 (6.6%) |
| 11:00 AM to 11:59 AM | 5 (5.0%) | 0 (0.0%) |
| 12:00 PM to 3:59 PM | 4 (4.0%) | 10 (13.2%) |
| 4:00 PM to 11:59 PM | 4 (4.0%) | 6 (7.9%) |
| Total | 101 (100.0%) | 76 (100.0%) |
Housing Occupancy in Mole Lake
Occupancy by Ownership in Mole Lake
Of the total 175 dwellings in Mole Lake, owner-occupied units account for 75 (42.9%), while renter-occupied units make up 100 (57.1%).
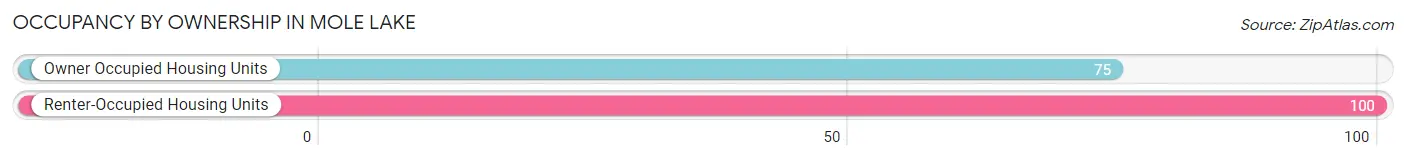
| Occupancy | # Housing Units | % Housing Units |
| Owner Occupied Housing Units | 75 | 42.9% |
| Renter-Occupied Housing Units | 100 | 57.1% |
| Total Occupied Housing Units | 175 | 100.0% |
Occupancy by Household Size in Mole Lake
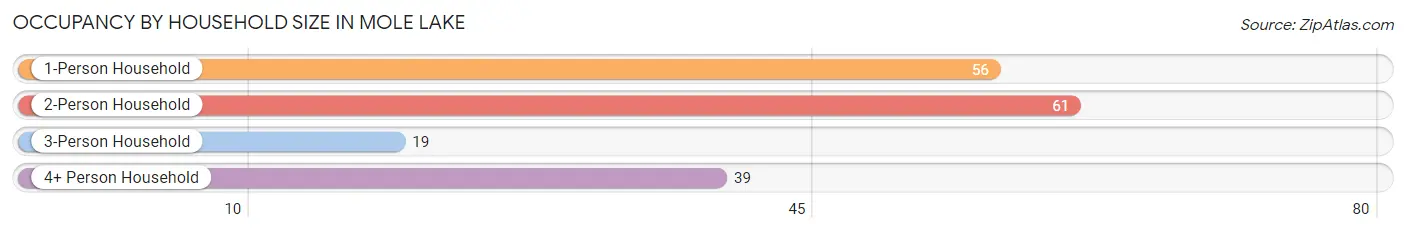
| Household Size | # Housing Units | % Housing Units |
| 1-Person Household | 56 | 32.0% |
| 2-Person Household | 61 | 34.9% |
| 3-Person Household | 19 | 10.9% |
| 4+ Person Household | 39 | 22.3% |
| Total Housing Units | 175 | 100.0% |
Occupancy by Ownership by Household Size in Mole Lake
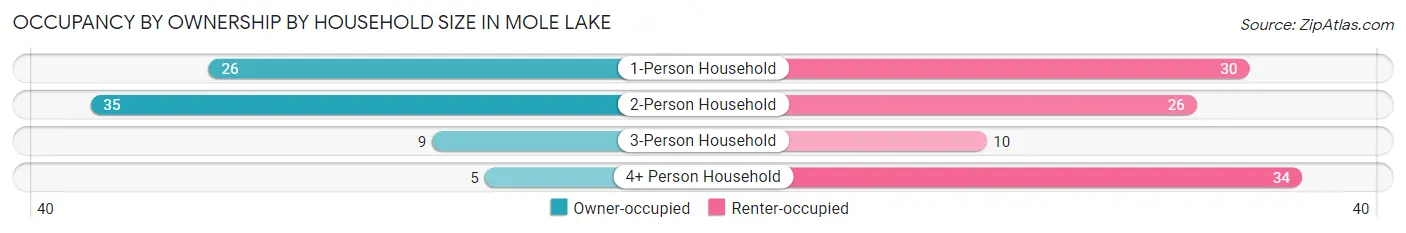
| Household Size | Owner-occupied | Renter-occupied |
| 1-Person Household | 26 (46.4%) | 30 (53.6%) |
| 2-Person Household | 35 (57.4%) | 26 (42.6%) |
| 3-Person Household | 9 (47.4%) | 10 (52.6%) |
| 4+ Person Household | 5 (12.8%) | 34 (87.2%) |
| Total Housing Units | 75 (42.9%) | 100 (57.1%) |
Occupancy by Educational Attainment in Mole Lake
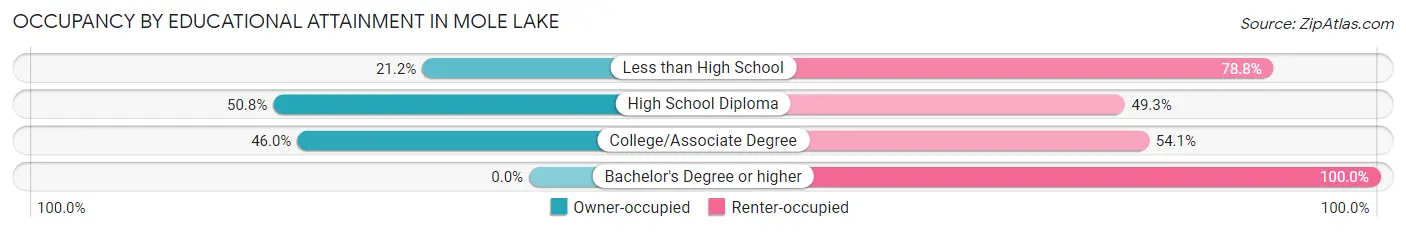
| Household Size | Owner-occupied | Renter-occupied |
| Less than High School | 7 (21.2%) | 26 (78.8%) |
| High School Diploma | 34 (50.7%) | 33 (49.2%) |
| College/Associate Degree | 34 (46.0%) | 40 (54.0%) |
| Bachelor's Degree or higher | 0 (0.0%) | 1 (100.0%) |
Occupancy by Age of Householder in Mole Lake
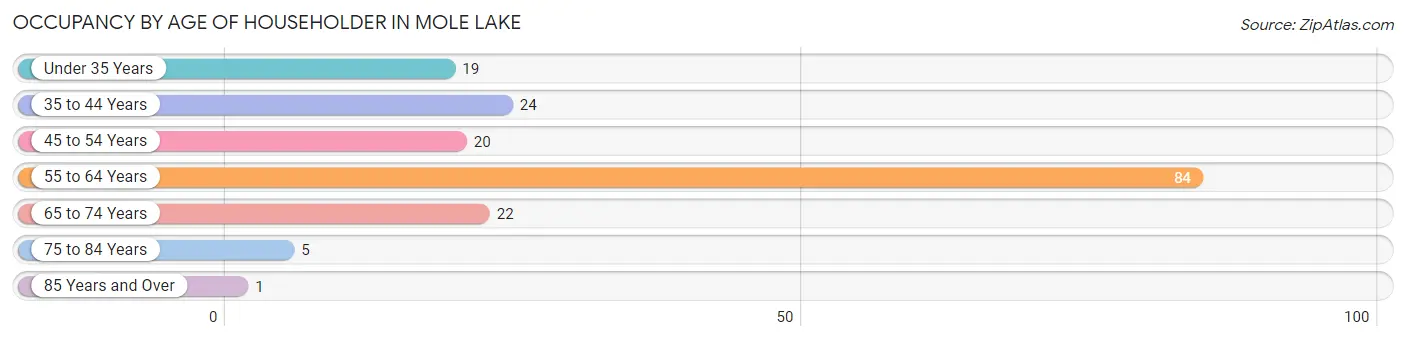
| Age Bracket | # Households | % Households |
| Under 35 Years | 19 | 10.9% |
| 35 to 44 Years | 24 | 13.7% |
| 45 to 54 Years | 20 | 11.4% |
| 55 to 64 Years | 84 | 48.0% |
| 65 to 74 Years | 22 | 12.6% |
| 75 to 84 Years | 5 | 2.9% |
| 85 Years and Over | 1 | 0.6% |
| Total | 175 | 100.0% |
Housing Finances in Mole Lake
Median Income by Occupancy in Mole Lake
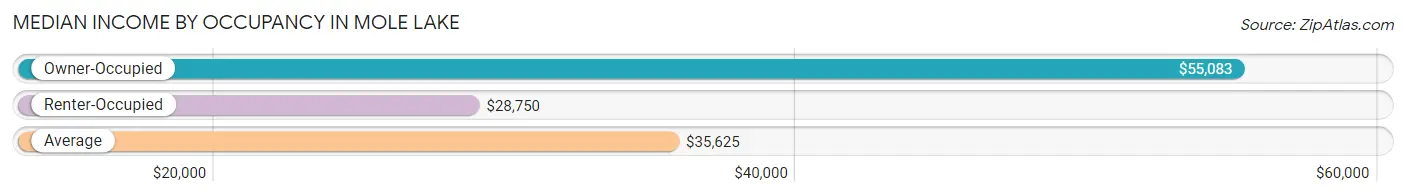
| Occupancy Type | # Households | Median Income |
| Owner-Occupied | 75 (42.9%) | $55,083 |
| Renter-Occupied | 100 (57.1%) | $28,750 |
| Average | 175 (100.0%) | $35,625 |
Occupancy by Householder Income Bracket in Mole Lake
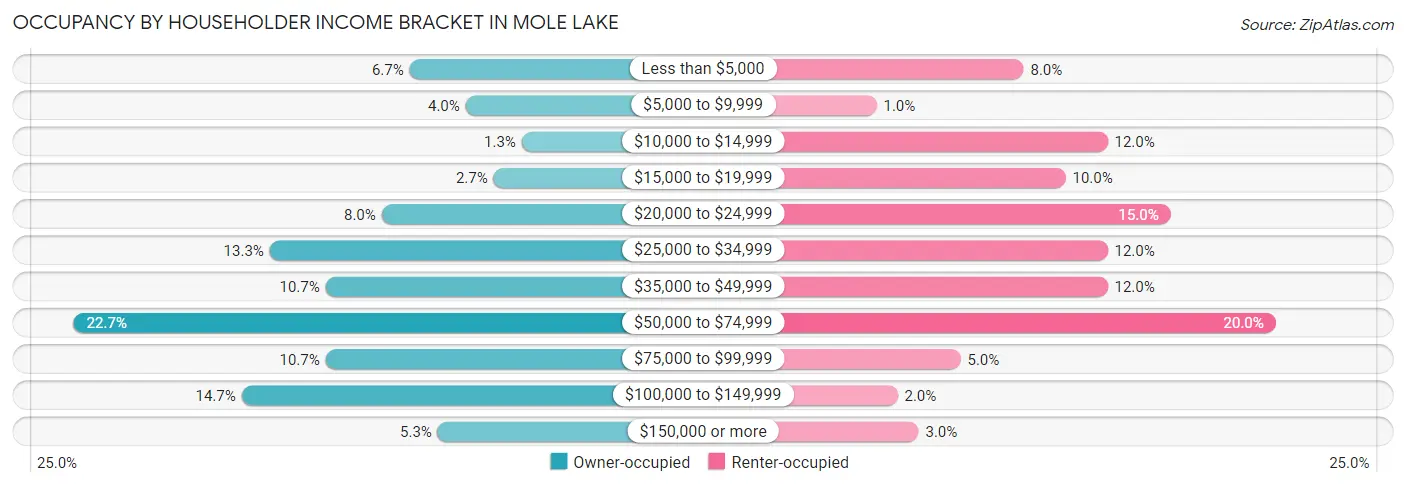
| Income Bracket | Owner-occupied | Renter-occupied |
| Less than $5,000 | 5 (6.7%) | 8 (8.0%) |
| $5,000 to $9,999 | 3 (4.0%) | 1 (1.0%) |
| $10,000 to $14,999 | 1 (1.3%) | 12 (12.0%) |
| $15,000 to $19,999 | 2 (2.7%) | 10 (10.0%) |
| $20,000 to $24,999 | 6 (8.0%) | 15 (15.0%) |
| $25,000 to $34,999 | 10 (13.3%) | 12 (12.0%) |
| $35,000 to $49,999 | 8 (10.7%) | 12 (12.0%) |
| $50,000 to $74,999 | 17 (22.7%) | 20 (20.0%) |
| $75,000 to $99,999 | 8 (10.7%) | 5 (5.0%) |
| $100,000 to $149,999 | 11 (14.7%) | 2 (2.0%) |
| $150,000 or more | 4 (5.3%) | 3 (3.0%) |
| Total | 75 (100.0%) | 100 (100.0%) |
Monthly Housing Cost Tiers in Mole Lake
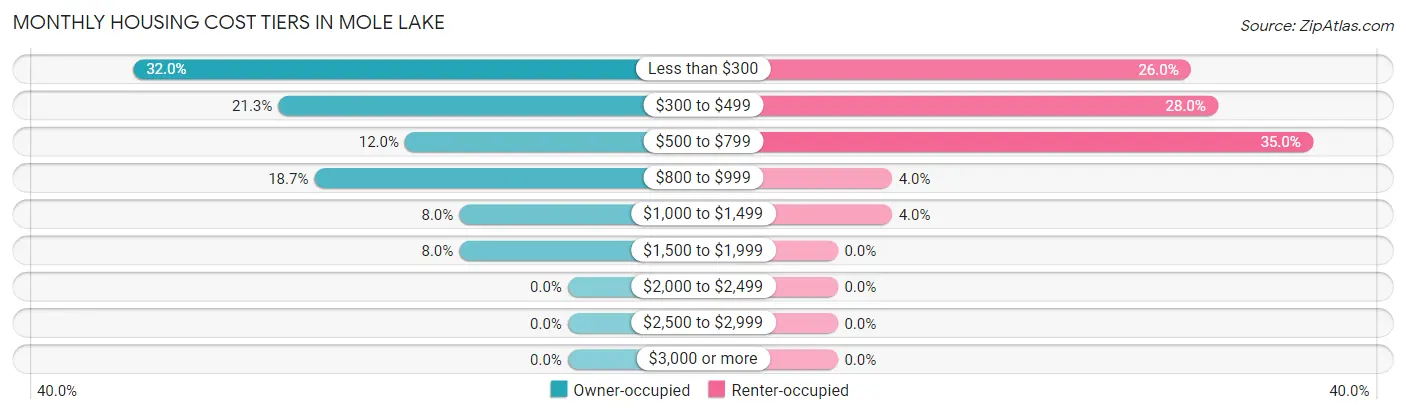
| Monthly Cost | Owner-occupied | Renter-occupied |
| Less than $300 | 24 (32.0%) | 26 (26.0%) |
| $300 to $499 | 16 (21.3%) | 28 (28.0%) |
| $500 to $799 | 9 (12.0%) | 35 (35.0%) |
| $800 to $999 | 14 (18.7%) | 4 (4.0%) |
| $1,000 to $1,499 | 6 (8.0%) | 4 (4.0%) |
| $1,500 to $1,999 | 6 (8.0%) | 0 (0.0%) |
| $2,000 to $2,499 | 0 (0.0%) | 0 (0.0%) |
| $2,500 to $2,999 | 0 (0.0%) | 0 (0.0%) |
| $3,000 or more | 0 (0.0%) | 0 (0.0%) |
| Total | 75 (100.0%) | 100 (100.0%) |
Physical Housing Characteristics in Mole Lake
Housing Structures in Mole Lake
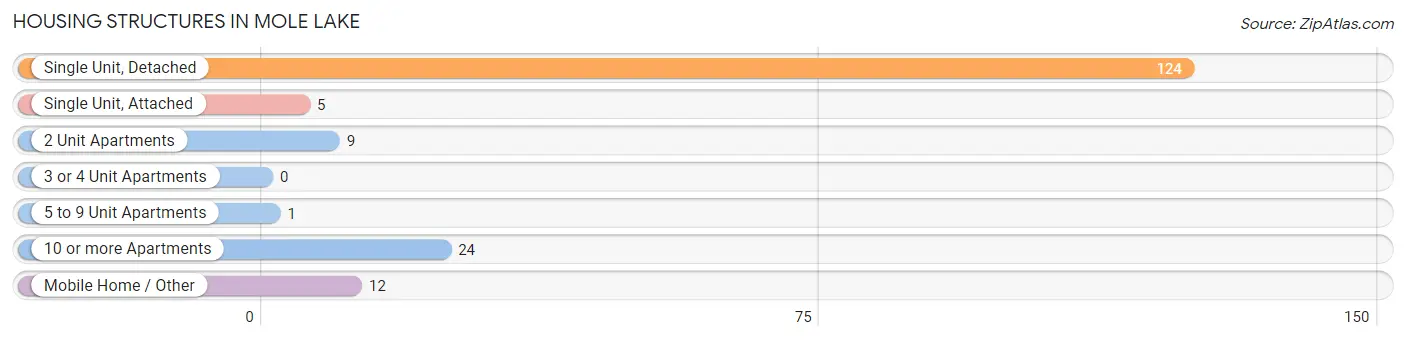
| Structure Type | # Housing Units | % Housing Units |
| Single Unit, Detached | 124 | 70.9% |
| Single Unit, Attached | 5 | 2.9% |
| 2 Unit Apartments | 9 | 5.1% |
| 3 or 4 Unit Apartments | 0 | 0.0% |
| 5 to 9 Unit Apartments | 1 | 0.6% |
| 10 or more Apartments | 24 | 13.7% |
| Mobile Home / Other | 12 | 6.9% |
| Total | 175 | 100.0% |
Housing Structures by Occupancy in Mole Lake
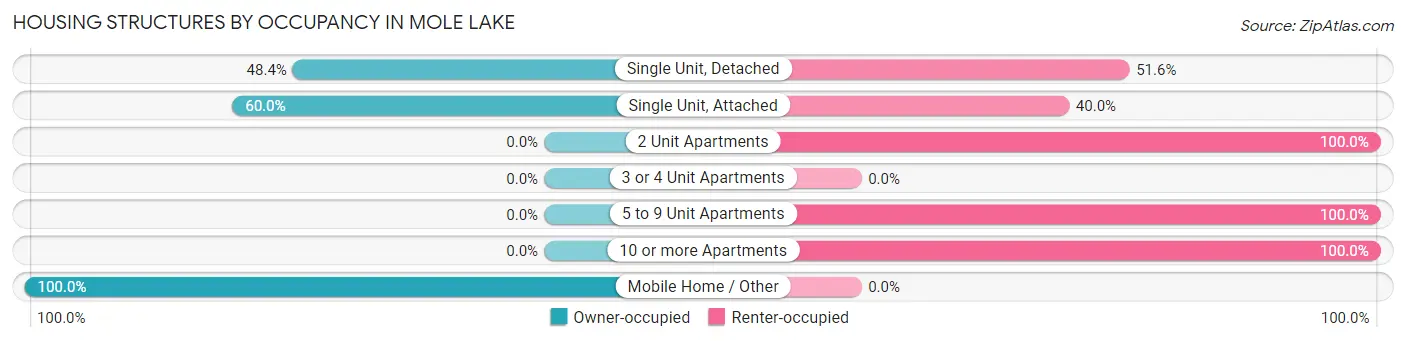
| Structure Type | Owner-occupied | Renter-occupied |
| Single Unit, Detached | 60 (48.4%) | 64 (51.6%) |
| Single Unit, Attached | 3 (60.0%) | 2 (40.0%) |
| 2 Unit Apartments | 0 (0.0%) | 9 (100.0%) |
| 3 or 4 Unit Apartments | 0 (0.0%) | 0 (0.0%) |
| 5 to 9 Unit Apartments | 0 (0.0%) | 1 (100.0%) |
| 10 or more Apartments | 0 (0.0%) | 24 (100.0%) |
| Mobile Home / Other | 12 (100.0%) | 0 (0.0%) |
| Total | 75 (42.9%) | 100 (57.1%) |
Housing Structures by Number of Rooms in Mole Lake
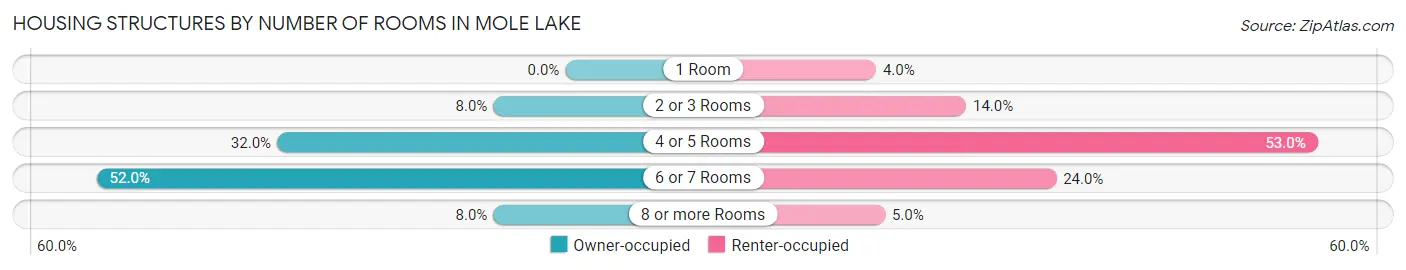
| Number of Rooms | Owner-occupied | Renter-occupied |
| 1 Room | 0 (0.0%) | 4 (4.0%) |
| 2 or 3 Rooms | 6 (8.0%) | 14 (14.0%) |
| 4 or 5 Rooms | 24 (32.0%) | 53 (53.0%) |
| 6 or 7 Rooms | 39 (52.0%) | 24 (24.0%) |
| 8 or more Rooms | 6 (8.0%) | 5 (5.0%) |
| Total | 75 (100.0%) | 100 (100.0%) |
Housing Structure by Heating Type in Mole Lake
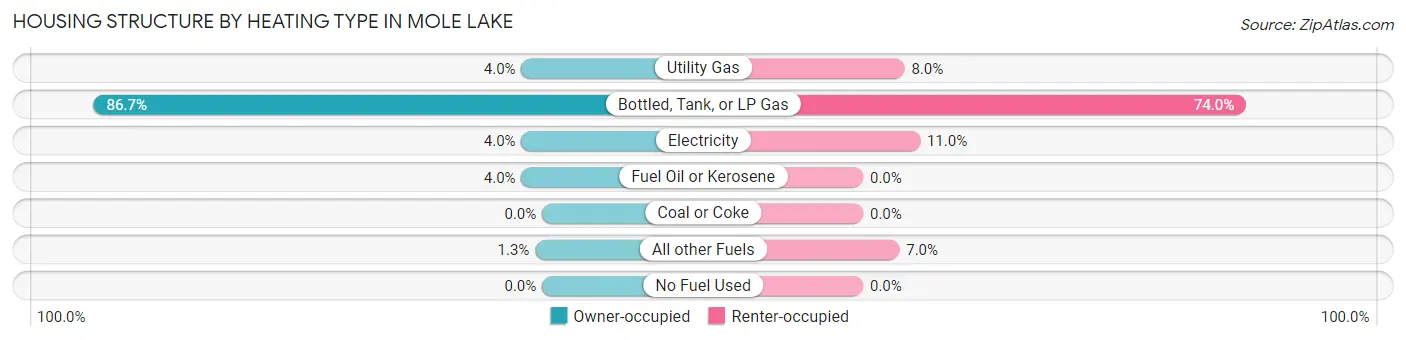
| Heating Type | Owner-occupied | Renter-occupied |
| Utility Gas | 3 (4.0%) | 8 (8.0%) |
| Bottled, Tank, or LP Gas | 65 (86.7%) | 74 (74.0%) |
| Electricity | 3 (4.0%) | 11 (11.0%) |
| Fuel Oil or Kerosene | 3 (4.0%) | 0 (0.0%) |
| Coal or Coke | 0 (0.0%) | 0 (0.0%) |
| All other Fuels | 1 (1.3%) | 7 (7.0%) |
| No Fuel Used | 0 (0.0%) | 0 (0.0%) |
| Total | 75 (100.0%) | 100 (100.0%) |
Household Vehicle Usage in Mole Lake
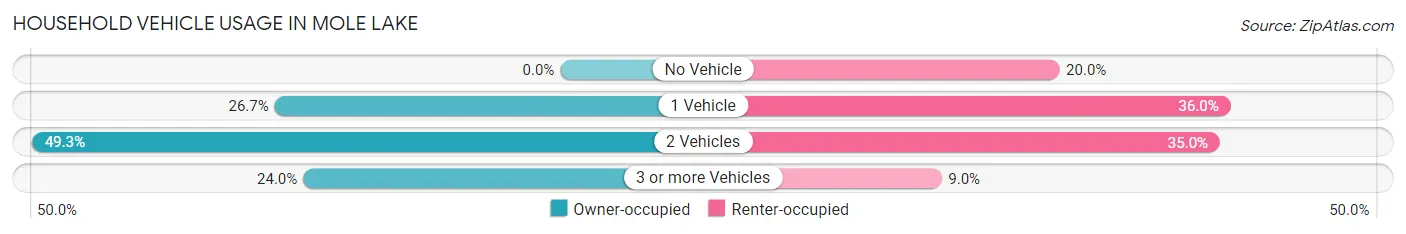
| Vehicles per Household | Owner-occupied | Renter-occupied |
| No Vehicle | 0 (0.0%) | 20 (20.0%) |
| 1 Vehicle | 20 (26.7%) | 36 (36.0%) |
| 2 Vehicles | 37 (49.3%) | 35 (35.0%) |
| 3 or more Vehicles | 18 (24.0%) | 9 (9.0%) |
| Total | 75 (100.0%) | 100 (100.0%) |
Real Estate & Mortgages in Mole Lake
Real Estate and Mortgage Overview in Mole Lake
| Characteristic | Without Mortgage | With Mortgage |
| Housing Units | 53 | 22 |
| Median Property Value | $108,900 | $165,000 |
| Median Household Income | $36,875 | $0 |
| Monthly Housing Costs | $325 | $0 |
| Real Estate Taxes | $3,250 | $13 |
Property Value by Mortgage Status in Mole Lake
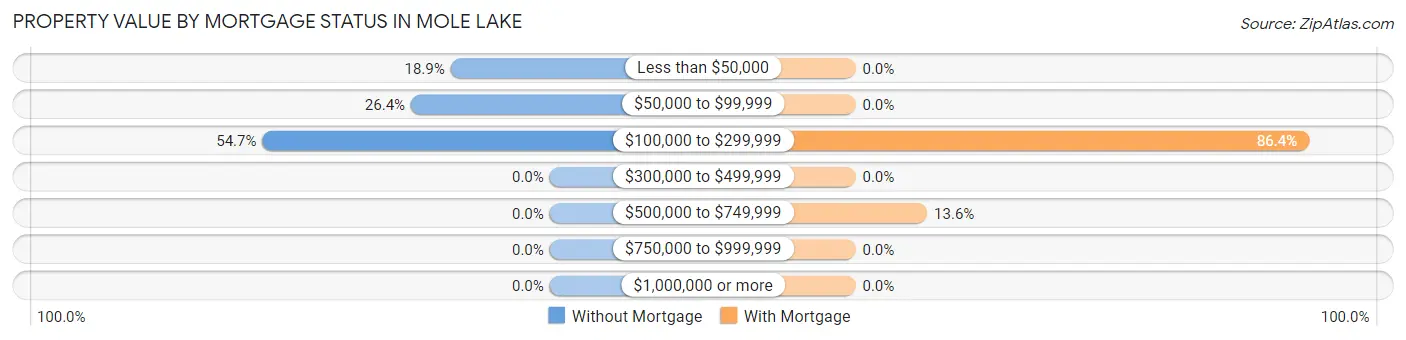
| Property Value | Without Mortgage | With Mortgage |
| Less than $50,000 | 10 (18.9%) | 0 (0.0%) |
| $50,000 to $99,999 | 14 (26.4%) | 0 (0.0%) |
| $100,000 to $299,999 | 29 (54.7%) | 19 (86.4%) |
| $300,000 to $499,999 | 0 (0.0%) | 0 (0.0%) |
| $500,000 to $749,999 | 0 (0.0%) | 3 (13.6%) |
| $750,000 to $999,999 | 0 (0.0%) | 0 (0.0%) |
| $1,000,000 or more | 0 (0.0%) | 0 (0.0%) |
| Total | 53 (100.0%) | 22 (100.0%) |
Household Income by Mortgage Status in Mole Lake
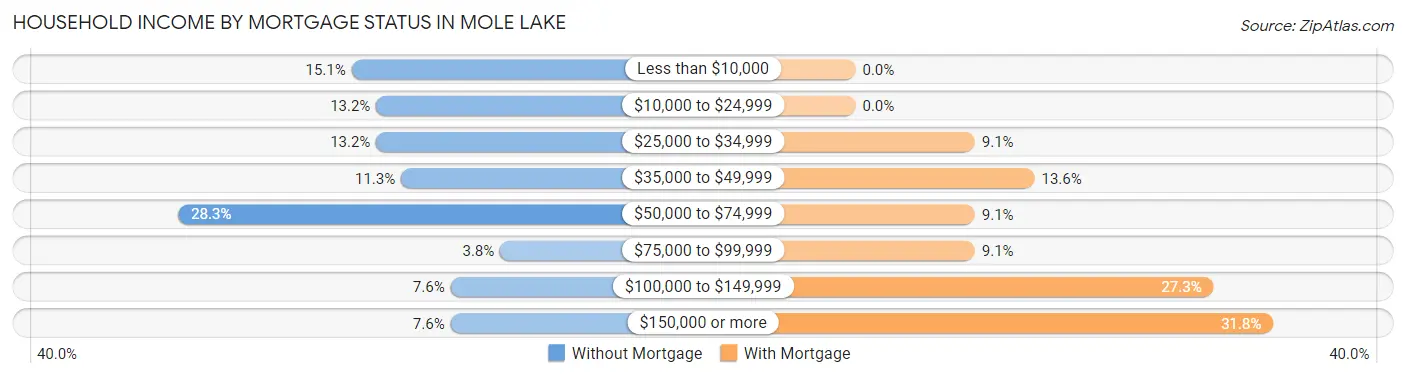
| Household Income | Without Mortgage | With Mortgage |
| Less than $10,000 | 8 (15.1%) | 0 (0.0%) |
| $10,000 to $24,999 | 7 (13.2%) | 0 (0.0%) |
| $25,000 to $34,999 | 7 (13.2%) | 2 (9.1%) |
| $35,000 to $49,999 | 6 (11.3%) | 3 (13.6%) |
| $50,000 to $74,999 | 15 (28.3%) | 2 (9.1%) |
| $75,000 to $99,999 | 2 (3.8%) | 2 (9.1%) |
| $100,000 to $149,999 | 4 (7.5%) | 6 (27.3%) |
| $150,000 or more | 4 (7.5%) | 7 (31.8%) |
| Total | 53 (100.0%) | 22 (100.0%) |
Property Value to Household Income Ratio in Mole Lake
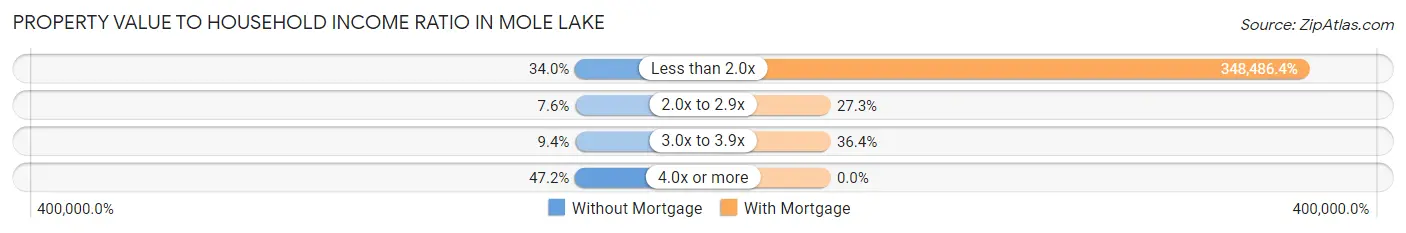
| Value-to-Income Ratio | Without Mortgage | With Mortgage |
| Less than 2.0x | 18 (34.0%) | 76,667 (348,486.4%) |
| 2.0x to 2.9x | 4 (7.5%) | 6 (27.3%) |
| 3.0x to 3.9x | 5 (9.4%) | 8 (36.4%) |
| 4.0x or more | 25 (47.2%) | 0 (0.0%) |
| Total | 53 (100.0%) | 22 (100.0%) |
Real Estate Taxes by Mortgage Status in Mole Lake
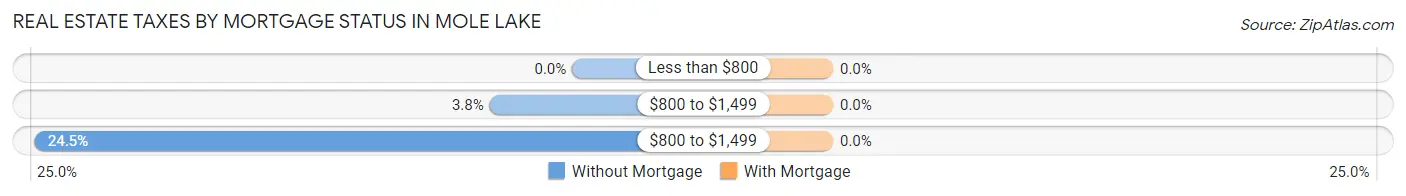
| Property Taxes | Without Mortgage | With Mortgage |
| Less than $800 | 0 (0.0%) | 0 (0.0%) |
| $800 to $1,499 | 2 (3.8%) | 0 (0.0%) |
| $800 to $1,499 | 13 (24.5%) | 0 (0.0%) |
| Total | 53 (100.0%) | 22 (100.0%) |
Health & Disability in Mole Lake
Health Insurance Coverage by Age in Mole Lake
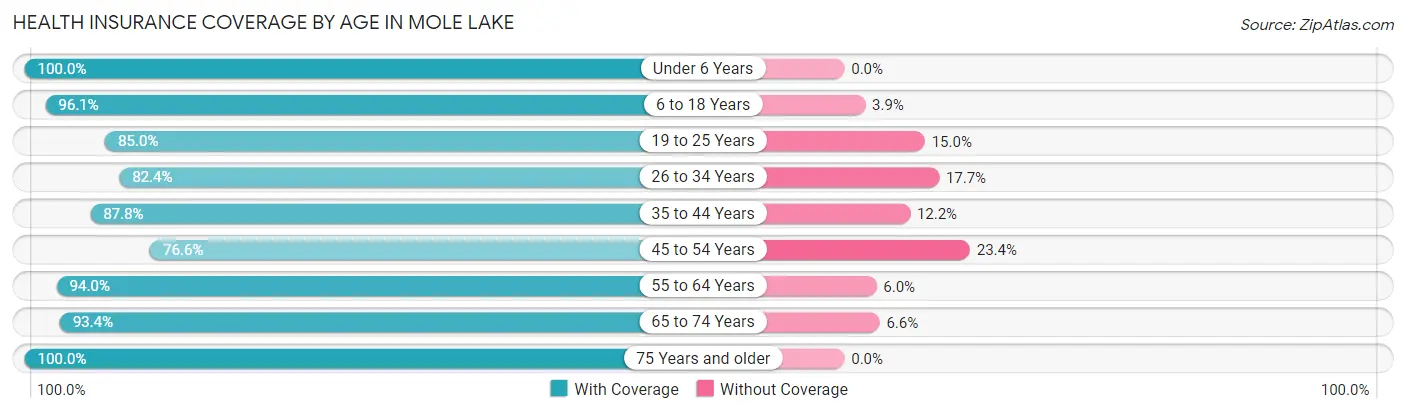
| Age Bracket | With Coverage | Without Coverage |
| Under 6 Years | 52 (100.0%) | 0 (0.0%) |
| 6 to 18 Years | 99 (96.1%) | 4 (3.9%) |
| 19 to 25 Years | 17 (85.0%) | 3 (15.0%) |
| 26 to 34 Years | 56 (82.4%) | 12 (17.6%) |
| 35 to 44 Years | 43 (87.8%) | 6 (12.2%) |
| 45 to 54 Years | 36 (76.6%) | 11 (23.4%) |
| 55 to 64 Years | 110 (94.0%) | 7 (6.0%) |
| 65 to 74 Years | 57 (93.4%) | 4 (6.6%) |
| 75 Years and older | 8 (100.0%) | 0 (0.0%) |
| Total | 478 (91.0%) | 47 (8.9%) |
Health Insurance Coverage by Citizenship Status in Mole Lake
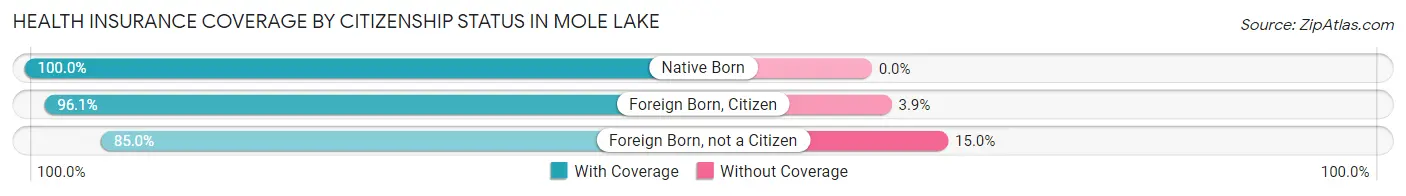
| Citizenship Status | With Coverage | Without Coverage |
| Native Born | 52 (100.0%) | 0 (0.0%) |
| Foreign Born, Citizen | 99 (96.1%) | 4 (3.9%) |
| Foreign Born, not a Citizen | 17 (85.0%) | 3 (15.0%) |
Health Insurance Coverage by Household Income in Mole Lake
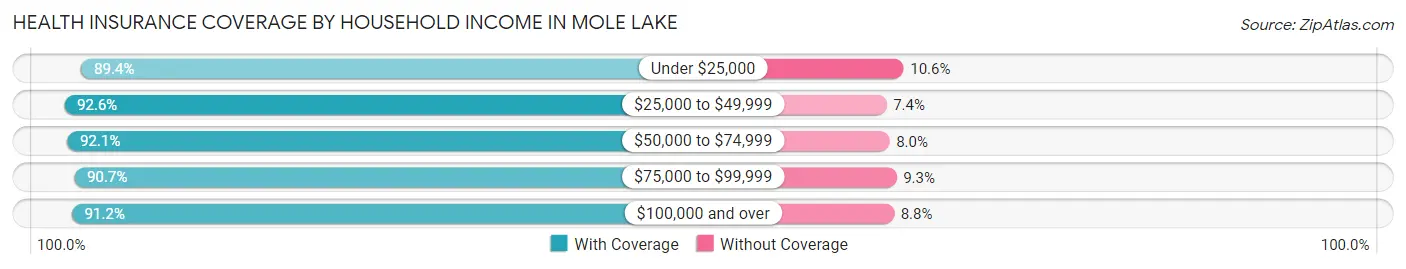
| Household Income | With Coverage | Without Coverage |
| Under $25,000 | 152 (89.4%) | 18 (10.6%) |
| $25,000 to $49,999 | 113 (92.6%) | 9 (7.4%) |
| $50,000 to $74,999 | 81 (92.0%) | 7 (8.0%) |
| $75,000 to $99,999 | 49 (90.7%) | 5 (9.3%) |
| $100,000 and over | 83 (91.2%) | 8 (8.8%) |
Public vs Private Health Insurance Coverage by Age in Mole Lake
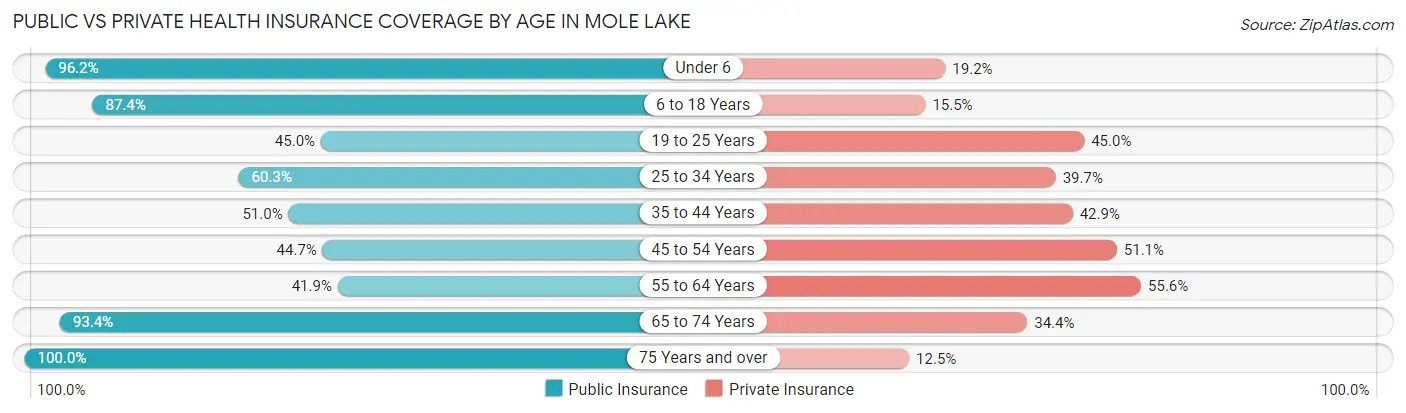
| Age Bracket | Public Insurance | Private Insurance |
| Under 6 | 50 (96.2%) | 10 (19.2%) |
| 6 to 18 Years | 90 (87.4%) | 16 (15.5%) |
| 19 to 25 Years | 9 (45.0%) | 9 (45.0%) |
| 25 to 34 Years | 41 (60.3%) | 27 (39.7%) |
| 35 to 44 Years | 25 (51.0%) | 21 (42.9%) |
| 45 to 54 Years | 21 (44.7%) | 24 (51.1%) |
| 55 to 64 Years | 49 (41.9%) | 65 (55.6%) |
| 65 to 74 Years | 57 (93.4%) | 21 (34.4%) |
| 75 Years and over | 8 (100.0%) | 1 (12.5%) |
| Total | 350 (66.7%) | 194 (36.9%) |
Disability Status by Sex by Age in Mole Lake
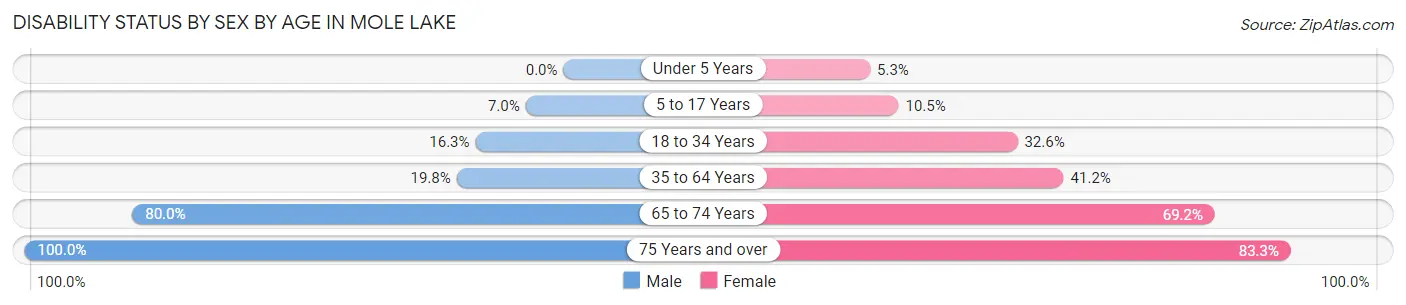
| Age Bracket | Male | Female |
| Under 5 Years | 0 (0.0%) | 1 (5.3%) |
| 5 to 17 Years | 4 (7.0%) | 6 (10.5%) |
| 18 to 34 Years | 8 (16.3%) | 15 (32.6%) |
| 35 to 64 Years | 22 (19.8%) | 42 (41.2%) |
| 65 to 74 Years | 28 (80.0%) | 18 (69.2%) |
| 75 Years and over | 2 (100.0%) | 5 (83.3%) |
Disability Class by Sex by Age in Mole Lake
Disability Class: Hearing Difficulty
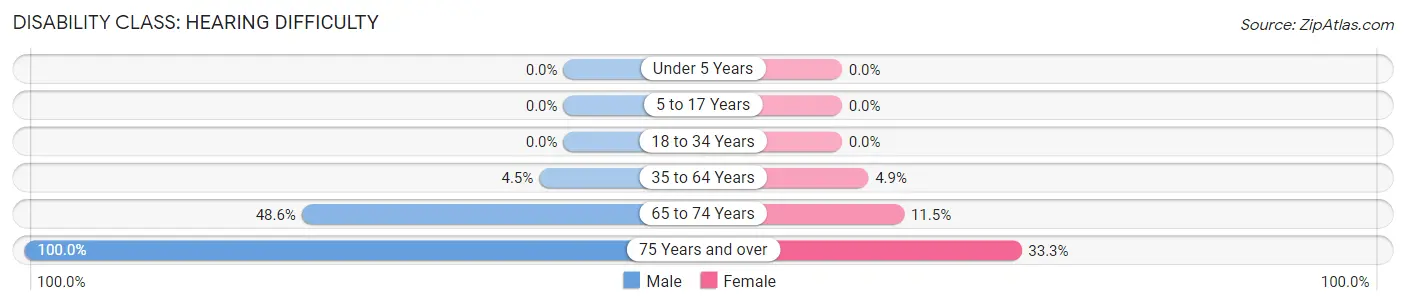
| Age Bracket | Male | Female |
| Under 5 Years | 0 (0.0%) | 0 (0.0%) |
| 5 to 17 Years | 0 (0.0%) | 0 (0.0%) |
| 18 to 34 Years | 0 (0.0%) | 0 (0.0%) |
| 35 to 64 Years | 5 (4.5%) | 5 (4.9%) |
| 65 to 74 Years | 17 (48.6%) | 3 (11.5%) |
| 75 Years and over | 2 (100.0%) | 2 (33.3%) |
Disability Class: Vision Difficulty
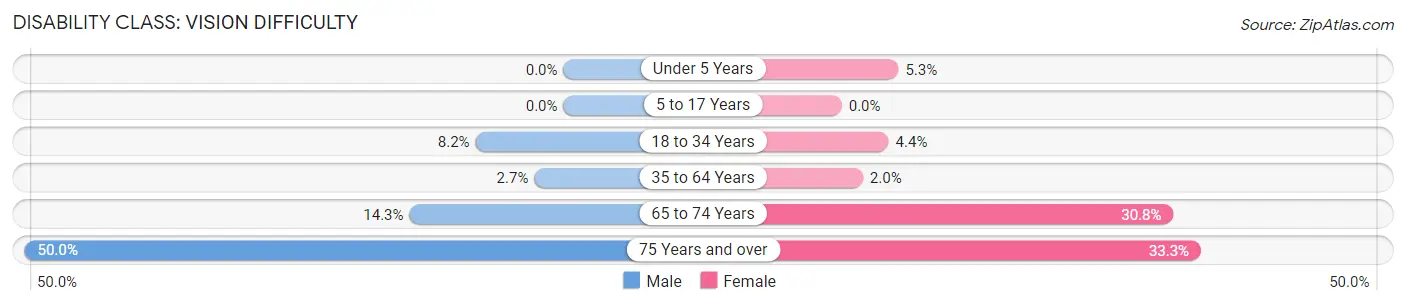
| Age Bracket | Male | Female |
| Under 5 Years | 0 (0.0%) | 1 (5.3%) |
| 5 to 17 Years | 0 (0.0%) | 0 (0.0%) |
| 18 to 34 Years | 4 (8.2%) | 2 (4.3%) |
| 35 to 64 Years | 3 (2.7%) | 2 (2.0%) |
| 65 to 74 Years | 5 (14.3%) | 8 (30.8%) |
| 75 Years and over | 1 (50.0%) | 2 (33.3%) |
Disability Class: Cognitive Difficulty
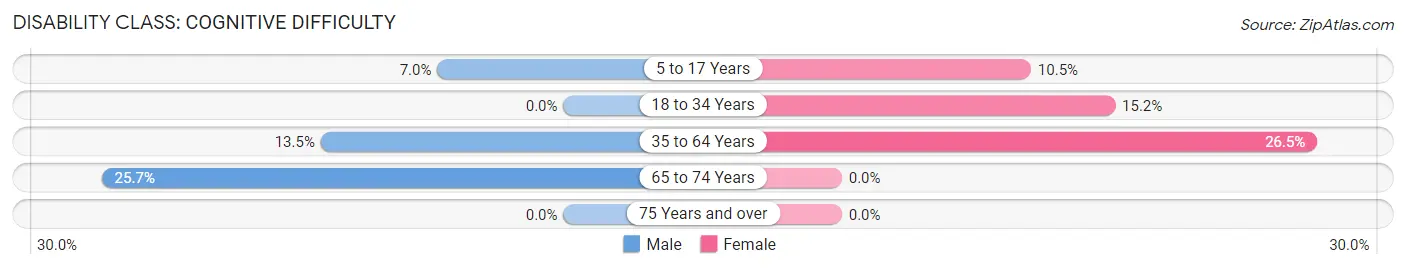
| Age Bracket | Male | Female |
| 5 to 17 Years | 4 (7.0%) | 6 (10.5%) |
| 18 to 34 Years | 0 (0.0%) | 7 (15.2%) |
| 35 to 64 Years | 15 (13.5%) | 27 (26.5%) |
| 65 to 74 Years | 9 (25.7%) | 0 (0.0%) |
| 75 Years and over | 0 (0.0%) | 0 (0.0%) |
Disability Class: Ambulatory Difficulty
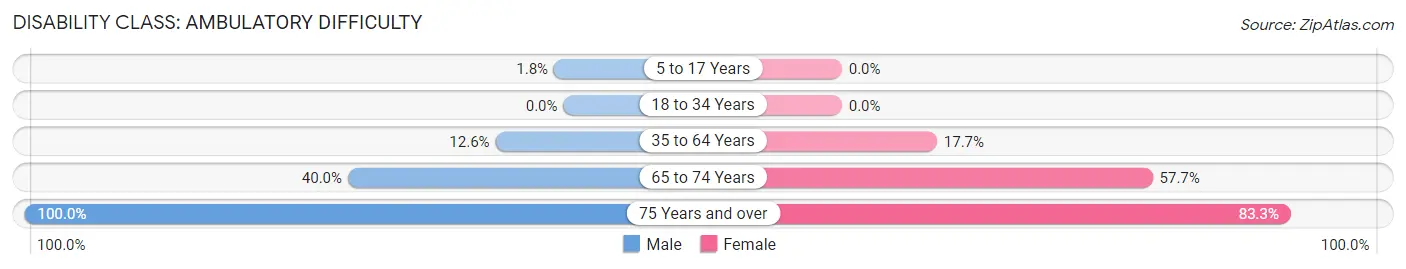
| Age Bracket | Male | Female |
| 5 to 17 Years | 1 (1.8%) | 0 (0.0%) |
| 18 to 34 Years | 0 (0.0%) | 0 (0.0%) |
| 35 to 64 Years | 14 (12.6%) | 18 (17.6%) |
| 65 to 74 Years | 14 (40.0%) | 15 (57.7%) |
| 75 Years and over | 2 (100.0%) | 5 (83.3%) |
Disability Class: Self-Care Difficulty
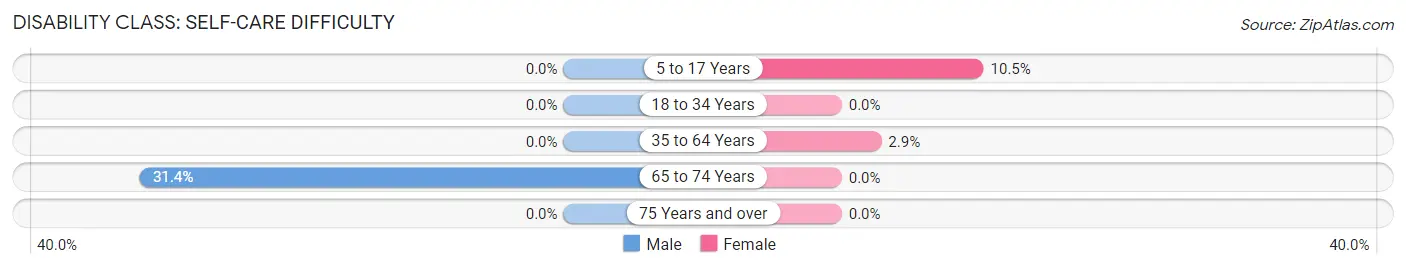
| Age Bracket | Male | Female |
| 5 to 17 Years | 0 (0.0%) | 6 (10.5%) |
| 18 to 34 Years | 0 (0.0%) | 0 (0.0%) |
| 35 to 64 Years | 0 (0.0%) | 3 (2.9%) |
| 65 to 74 Years | 11 (31.4%) | 0 (0.0%) |
| 75 Years and over | 0 (0.0%) | 0 (0.0%) |
Technology Access in Mole Lake
Computing Device Access in Mole Lake
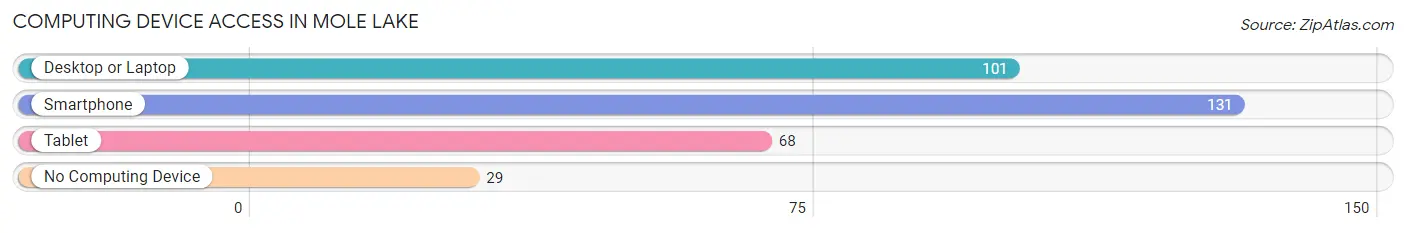
| Device Type | # Households | % Households |
| Desktop or Laptop | 101 | 57.7% |
| Smartphone | 131 | 74.9% |
| Tablet | 68 | 38.9% |
| No Computing Device | 29 | 16.6% |
| Total | 175 | 100.0% |
Internet Access in Mole Lake
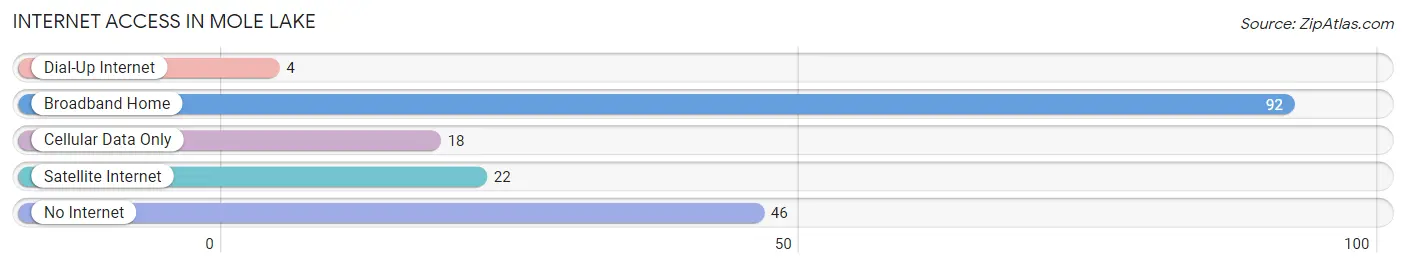
| Internet Type | # Households | % Households |
| Dial-Up Internet | 4 | 2.3% |
| Broadband Home | 92 | 52.6% |
| Cellular Data Only | 18 | 10.3% |
| Satellite Internet | 22 | 12.6% |
| No Internet | 46 | 26.3% |
| Total | 175 | 100.0% |
Mole Lake Summary
Mole Lake is a small unincorporated community located in Forest County, Wisconsin, United States. It is situated on the Mole Lake Indian Reservation, which is home to the Sokaogon Chippewa Community. The community is located on the shores of Mole Lake, a small lake in the Nicolet National Forest.
History
Mole Lake has a long and rich history. The area was first inhabited by the Ojibwe people, who were the original inhabitants of the area. The Ojibwe were a nomadic people who moved around the area in search of food and resources. They were known for their fishing and hunting skills, and they used the lake for fishing and gathering wild rice.
In the late 1800s, the area was opened up to logging and mining. The Mole Lake area was heavily logged, and the lake was used to transport logs to the sawmill. The area was also home to a number of mining operations, including copper, iron, and zinc.
In the early 1900s, the area was opened up to tourism. The lake was a popular destination for fishing and camping, and the area was also home to a number of resorts. The Mole Lake Indian Reservation was established in the early 1900s, and the Sokaogon Chippewa Community was established in the late 1940s.
Geography
Mole Lake is located in the Nicolet National Forest in northern Wisconsin. The lake is approximately 2,000 acres in size and is surrounded by a mix of hardwood and coniferous forests. The lake is fed by several small streams and is home to a variety of fish species, including walleye, northern pike, and smallmouth bass.
The area is also home to a variety of wildlife, including white-tailed deer, black bear, and a variety of birds. The area is also home to a number of rare and endangered species, including the timber wolf, bald eagle, and the Kirtland's warbler.
Economy
Mole Lake is a small, rural community with a limited economy. The primary industry in the area is tourism, with the lake and surrounding forests providing a variety of recreational activities. The area is also home to a number of small businesses, including restaurants, convenience stores, and gas stations.
The Sokaogon Chippewa Community is the largest employer in the area, with the tribe operating a number of businesses, including a casino, hotel, and golf course. The tribe also operates a number of other businesses, including a gas station, convenience store, and restaurant.
Demographics
As of the 2010 census, the population of Mole Lake was 1,072. The population is primarily Native American, with the Sokaogon Chippewa Community making up the majority of the population. The median age of the population is 37.7 years, and the median household income is $30,938. The area is predominantly white, with only 4.3% of the population identifying as African American. The area is also home to a small Hispanic population, with 4.2% of the population identifying as Hispanic or Latino.
Common Questions
What is Per Capita Income in Mole Lake?
Per Capita income in Mole Lake is $18,329.
What is the Median Family Income in Mole Lake?
Median Family Income in Mole Lake is $44,583.
What is the Median Household income in Mole Lake?
Median Household Income in Mole Lake is $35,625.
What is Income or Wage Gap in Mole Lake?
Income or Wage Gap in Mole Lake is 6.5%.
Women in Mole Lake earn 93.5 cents for every dollar earned by a man.
What is Inequality or Gini Index in Mole Lake?
Inequality or Gini Index in Mole Lake is 0.46.
What is the Total Population of Mole Lake?
Total Population of Mole Lake is 525.
What is the Total Male Population of Mole Lake?
Total Male Population of Mole Lake is 269.
What is the Total Female Population of Mole Lake?
Total Female Population of Mole Lake is 256.
What is the Ratio of Males per 100 Females in Mole Lake?
There are 105.08 Males per 100 Females in Mole Lake.
What is the Ratio of Females per 100 Males in Mole Lake?
There are 95.17 Females per 100 Males in Mole Lake.
What is the Median Population Age in Mole Lake?
Median Population Age in Mole Lake is 39.1 Years.
What is the Average Family Size in Mole Lake
Average Family Size in Mole Lake is 3.6 People.
What is the Average Household Size in Mole Lake
Average Household Size in Mole Lake is 3.0 People.
How Large is the Labor Force in Mole Lake?
There are 203 People in the Labor Forcein in Mole Lake.
What is the Percentage of People in the Labor Force in Mole Lake?
52.7% of People are in the Labor Force in Mole Lake.
What is the Unemployment Rate in Mole Lake?
Unemployment Rate in Mole Lake is 10.3%.