Bayfield, WI Map & Demographics
Bayfield Map
Bayfield Overview
$39,704
PER CAPITA INCOME
$83,598
AVG FAMILY INCOME
$69,792
AVG HOUSEHOLD INCOME
59.6%
WAGE / INCOME GAP [ % ]
40.4¢/ $1
WAGE / INCOME GAP [ $ ]
0.34
INEQUALITY / GINI INDEX
617
TOTAL POPULATION
311
MALE POPULATION
306
FEMALE POPULATION
101.63
MALES / 100 FEMALES
98.39
FEMALES / 100 MALES
63.4
MEDIAN AGE
2.2
AVG FAMILY SIZE
1.8
AVG HOUSEHOLD SIZE
273
LABOR FORCE [ PEOPLE ]
48.4%
PERCENT IN LABOR FORCE
3.0%
UNEMPLOYMENT RATE
Bayfield Zip Codes
Bayfield Area Codes
Income in Bayfield
Income Overview in Bayfield
Per Capita Income in Bayfield is $39,704, while median incomes of families and households are $83,598 and $69,792 respectively.
| Characteristic | Number | Measure |
| Per Capita Income | 617 | $39,704 |
| Median Family Income | 174 | $83,598 |
| Mean Family Income | 174 | $99,299 |
| Median Household Income | 339 | $69,792 |
| Mean Household Income | 339 | $82,373 |
| Income Deficit | 174 | $0 |
| Wage / Income Gap (%) | 617 | 59.60% |
| Wage / Income Gap ($) | 617 | 40.40¢ per $1 |
| Gini / Inequality Index | 617 | 0.34 |
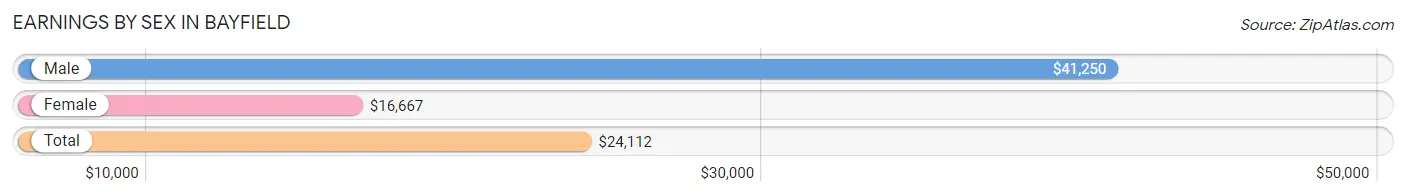
Earnings by Sex in Bayfield
Average Earnings in Bayfield are $24,112, $41,250 for men and $16,667 for women, a difference of 59.6%.
| Sex | Number | Average Earnings |
| Male | 133 (44.5%) | $41,250 |
| Female | 166 (55.5%) | $16,667 |
| Total | 299 (100.0%) | $24,112 |
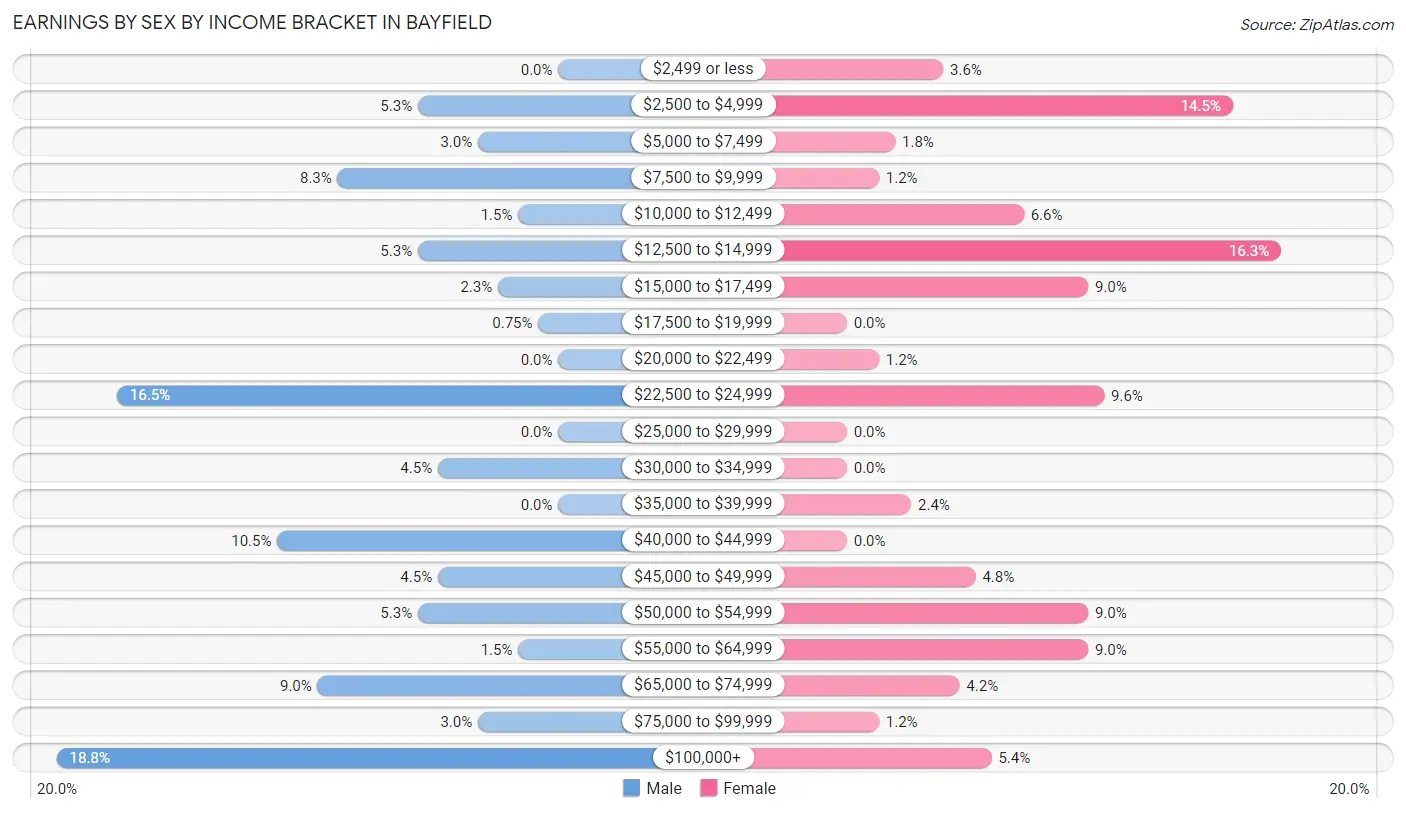
Earnings by Sex by Income Bracket in Bayfield
The most common earnings brackets in Bayfield are $100,000+ for men (25 | 18.8%) and $12,500 to $14,999 for women (27 | 16.3%).
| Income | Male | Female |
| $2,499 or less | 0 (0.0%) | 6 (3.6%) |
| $2,500 to $4,999 | 7 (5.3%) | 24 (14.5%) |
| $5,000 to $7,499 | 4 (3.0%) | 3 (1.8%) |
| $7,500 to $9,999 | 11 (8.3%) | 2 (1.2%) |
| $10,000 to $12,499 | 2 (1.5%) | 11 (6.6%) |
| $12,500 to $14,999 | 7 (5.3%) | 27 (16.3%) |
| $15,000 to $17,499 | 3 (2.3%) | 15 (9.0%) |
| $17,500 to $19,999 | 1 (0.7%) | 0 (0.0%) |
| $20,000 to $22,499 | 0 (0.0%) | 2 (1.2%) |
| $22,500 to $24,999 | 22 (16.5%) | 16 (9.6%) |
| $25,000 to $29,999 | 0 (0.0%) | 0 (0.0%) |
| $30,000 to $34,999 | 6 (4.5%) | 0 (0.0%) |
| $35,000 to $39,999 | 0 (0.0%) | 4 (2.4%) |
| $40,000 to $44,999 | 14 (10.5%) | 0 (0.0%) |
| $45,000 to $49,999 | 6 (4.5%) | 8 (4.8%) |
| $50,000 to $54,999 | 7 (5.3%) | 15 (9.0%) |
| $55,000 to $64,999 | 2 (1.5%) | 15 (9.0%) |
| $65,000 to $74,999 | 12 (9.0%) | 7 (4.2%) |
| $75,000 to $99,999 | 4 (3.0%) | 2 (1.2%) |
| $100,000+ | 25 (18.8%) | 9 (5.4%) |
| Total | 133 (100.0%) | 166 (100.0%) |
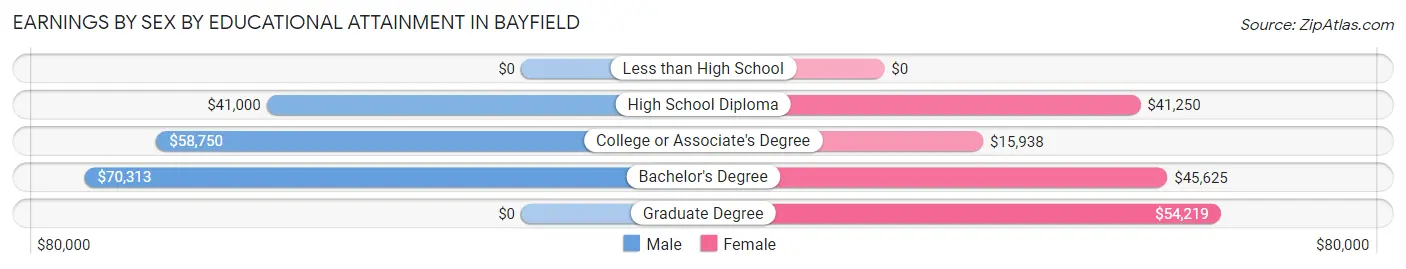
Earnings by Sex by Educational Attainment in Bayfield
Average earnings in Bayfield are $48,542 for men and $23,269 for women, a difference of 52.1%. Men with an educational attainment of bachelor's degree enjoy the highest average annual earnings of $70,313, while those with high school diploma education earn the least with $41,000. Women with an educational attainment of graduate degree earn the most with the average annual earnings of $54,219, while those with college or associate's degree education have the smallest earnings of $15,938.
| Educational Attainment | Male Income | Female Income |
| Less than High School | - | - |
| High School Diploma | $41,000 | $41,250 |
| College or Associate's Degree | $58,750 | $15,938 |
| Bachelor's Degree | $70,313 | $45,625 |
| Graduate Degree | - | - |
| Total | $48,542 | $23,269 |
Family Income in Bayfield
Family Income Brackets in Bayfield
According to the Bayfield family income data, there are 46 families falling into the $75,000 to $99,999 income range, which is the most common income bracket and makes up 26.4% of all families.
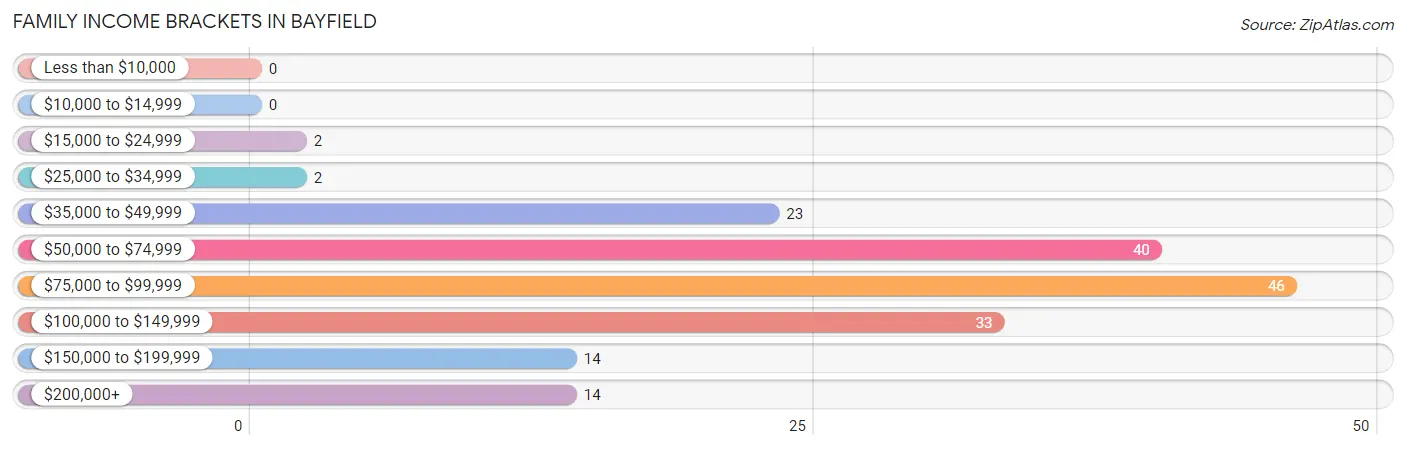
| Income Bracket | # Families | % Families |
| Less than $10,000 | 0 | 0.0% |
| $10,000 to $14,999 | 0 | 0.0% |
| $15,000 to $24,999 | 2 | 1.1% |
| $25,000 to $34,999 | 2 | 1.1% |
| $35,000 to $49,999 | 23 | 13.2% |
| $50,000 to $74,999 | 40 | 23.0% |
| $75,000 to $99,999 | 46 | 26.4% |
| $100,000 to $149,999 | 33 | 19.0% |
| $150,000 to $199,999 | 14 | 8.0% |
| $200,000+ | 14 | 8.0% |
Family Income by Famaliy Size in Bayfield
3-person families (25 | 14.4%) account for the highest median family income in Bayfield with $201,875 per family, while 3-person families (25 | 14.4%) have the highest median income of $67,292 per family member.
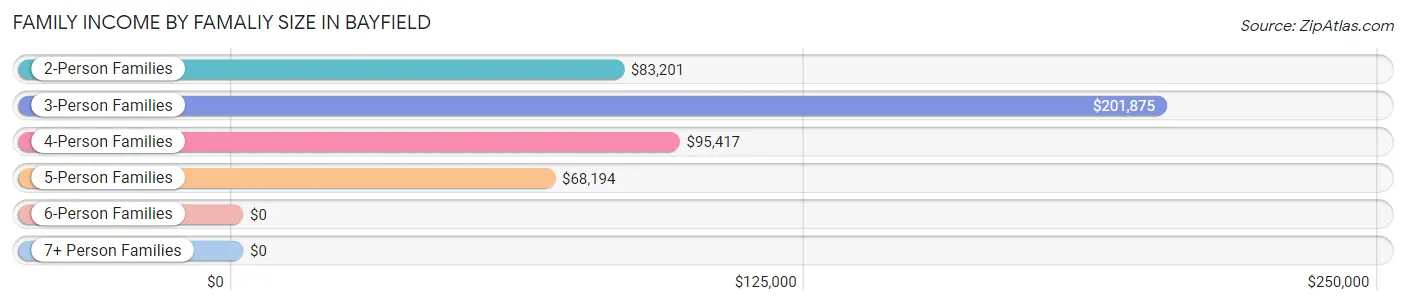
| Income Bracket | # Families | Median Income |
| 2-Person Families | 127 (73.0%) | $83,201 |
| 3-Person Families | 25 (14.4%) | $201,875 |
| 4-Person Families | 5 (2.9%) | $95,417 |
| 5-Person Families | 17 (9.8%) | $68,194 |
| 6-Person Families | 0 (0.0%) | $0 |
| 7+ Person Families | 0 (0.0%) | $0 |
| Total | 174 (100.0%) | $83,598 |
Family Income by Number of Earners in Bayfield
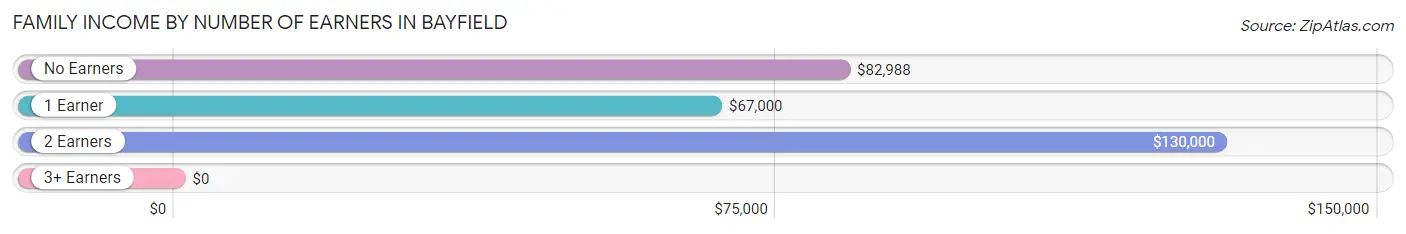
| Number of Earners | # Families | Median Income |
| No Earners | 66 (37.9%) | $82,988 |
| 1 Earner | 44 (25.3%) | $67,000 |
| 2 Earners | 62 (35.6%) | $130,000 |
| 3+ Earners | 2 (1.1%) | $0 |
| Total | 174 (100.0%) | $83,598 |
Household Income in Bayfield
Household Income Brackets in Bayfield
With 96 households falling in the category, the $75,000 to $99,999 income range is the most frequent in Bayfield, accounting for 28.3% of all households. In contrast, only 7 households (2.1%) fall into the $15,000 to $24,999 income bracket, making it the least populous group.
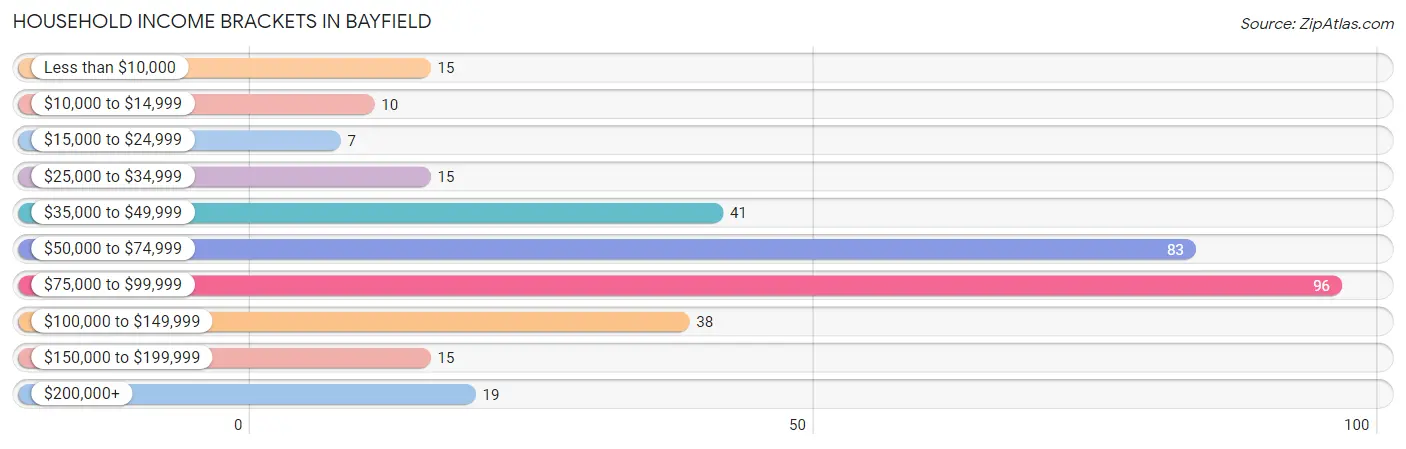
| Income Bracket | # Households | % Households |
| Less than $10,000 | 15 | 4.4% |
| $10,000 to $14,999 | 10 | 2.9% |
| $15,000 to $24,999 | 7 | 2.1% |
| $25,000 to $34,999 | 15 | 4.4% |
| $35,000 to $49,999 | 41 | 12.1% |
| $50,000 to $74,999 | 83 | 24.5% |
| $75,000 to $99,999 | 96 | 28.3% |
| $100,000 to $149,999 | 38 | 11.2% |
| $150,000 to $199,999 | 15 | 4.4% |
| $200,000+ | 19 | 5.6% |
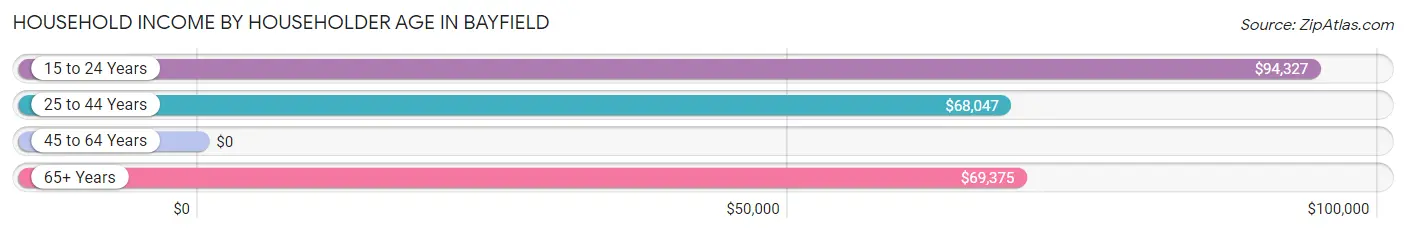
Household Income by Householder Age in Bayfield
The median household income in Bayfield is $69,792, with the highest median household income of $94,327 found in the 15 to 24 years age bracket for the primary householder. A total of 29 households (8.6%) fall into this category. Meanwhile, the 45 to 64 years age bracket for the primary householder has the lowest median household income of $0, with 38 households (11.2%) in this group.
| Income Bracket | # Households | Median Income |
| 15 to 24 Years | 29 (8.6%) | $94,327 |
| 25 to 44 Years | 63 (18.6%) | $68,047 |
| 45 to 64 Years | 38 (11.2%) | $0 |
| 65+ Years | 209 (61.7%) | $69,375 |
| Total | 339 (100.0%) | $69,792 |
Poverty in Bayfield
Income Below Poverty by Sex and Age in Bayfield
With 3.5% poverty level for males and 15.7% for females among the residents of Bayfield, 25 to 34 year old males and 18 to 24 year old females are the most vulnerable to poverty, with 7 males (21.2%) and 21 females (50.0%) in their respective age groups living below the poverty level.
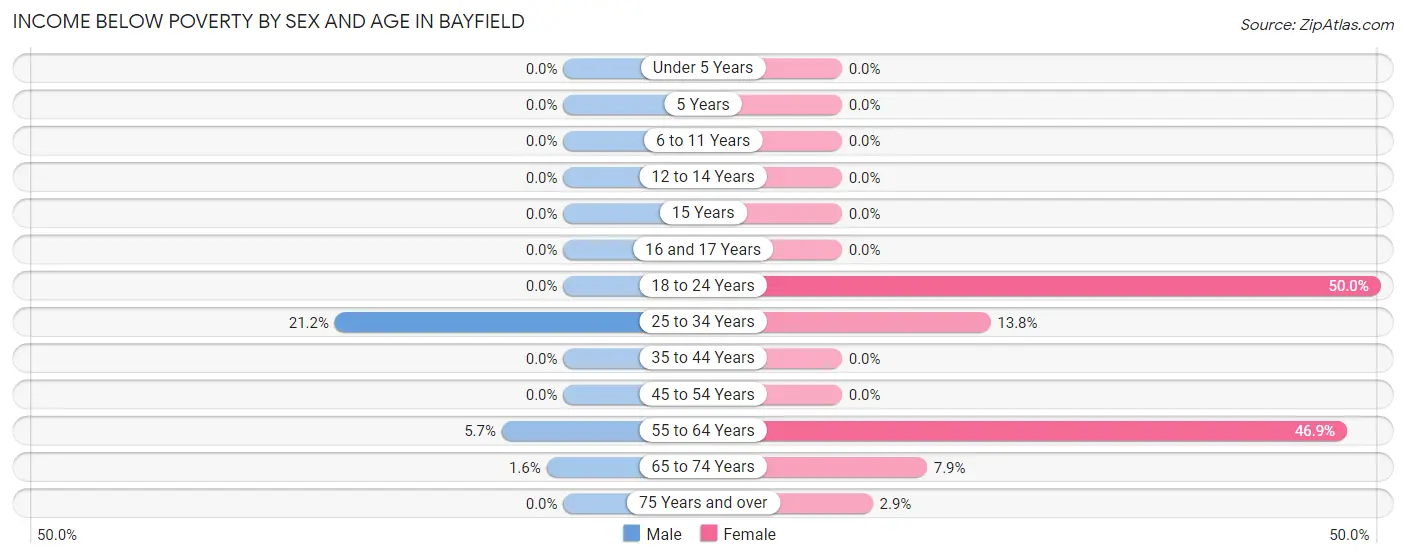
| Age Bracket | Male | Female |
| Under 5 Years | 0 (0.0%) | 0 (0.0%) |
| 5 Years | 0 (0.0%) | 0 (0.0%) |
| 6 to 11 Years | 0 (0.0%) | 0 (0.0%) |
| 12 to 14 Years | 0 (0.0%) | 0 (0.0%) |
| 15 Years | 0 (0.0%) | 0 (0.0%) |
| 16 and 17 Years | 0 (0.0%) | 0 (0.0%) |
| 18 to 24 Years | 0 (0.0%) | 21 (50.0%) |
| 25 to 34 Years | 7 (21.2%) | 4 (13.8%) |
| 35 to 44 Years | 0 (0.0%) | 0 (0.0%) |
| 45 to 54 Years | 0 (0.0%) | 0 (0.0%) |
| 55 to 64 Years | 2 (5.7%) | 15 (46.9%) |
| 65 to 74 Years | 2 (1.6%) | 6 (7.9%) |
| 75 Years and over | 0 (0.0%) | 2 (2.9%) |
| Total | 11 (3.5%) | 48 (15.7%) |
Income Above Poverty by Sex and Age in Bayfield
According to the poverty statistics in Bayfield, males aged under 5 years and females aged under 5 years are the age groups that are most secure financially, with 100.0% of males and 100.0% of females in these age groups living above the poverty line.
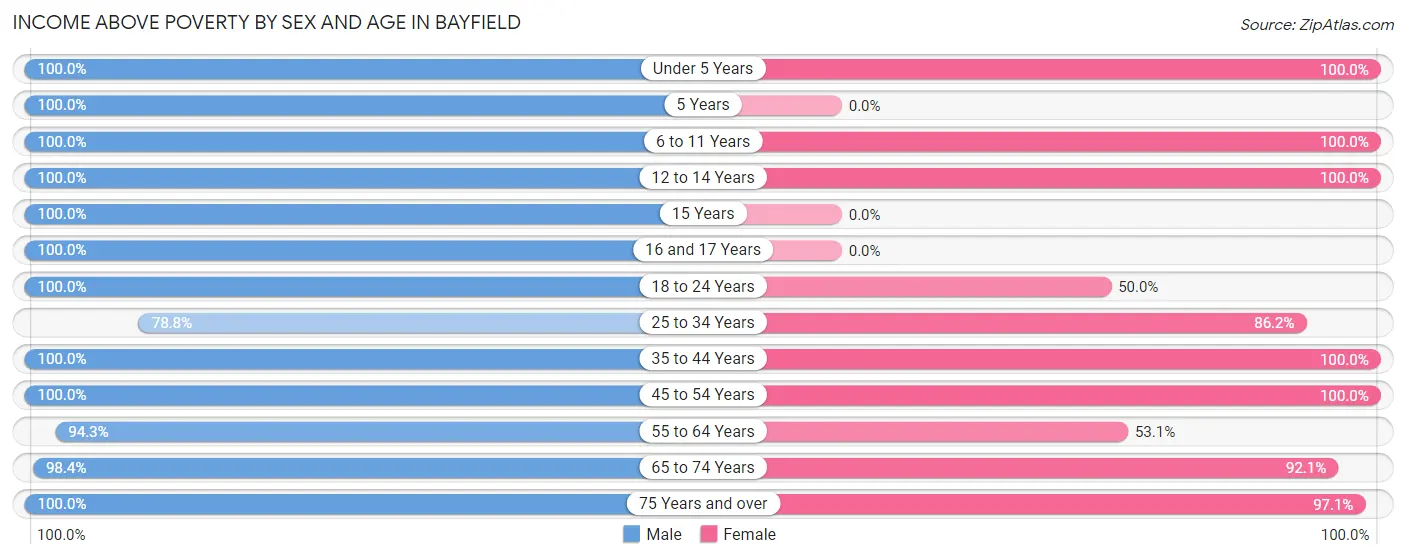
| Age Bracket | Male | Female |
| Under 5 Years | 9 (100.0%) | 3 (100.0%) |
| 5 Years | 2 (100.0%) | 0 (0.0%) |
| 6 to 11 Years | 16 (100.0%) | 5 (100.0%) |
| 12 to 14 Years | 10 (100.0%) | 1 (100.0%) |
| 15 Years | 7 (100.0%) | 0 (0.0%) |
| 16 and 17 Years | 8 (100.0%) | 0 (0.0%) |
| 18 to 24 Years | 25 (100.0%) | 21 (50.0%) |
| 25 to 34 Years | 26 (78.8%) | 25 (86.2%) |
| 35 to 44 Years | 16 (100.0%) | 43 (100.0%) |
| 45 to 54 Years | 1 (100.0%) | 5 (100.0%) |
| 55 to 64 Years | 33 (94.3%) | 17 (53.1%) |
| 65 to 74 Years | 126 (98.4%) | 70 (92.1%) |
| 75 Years and over | 21 (100.0%) | 68 (97.1%) |
| Total | 300 (96.5%) | 258 (84.3%) |
Income Below Poverty Among Married-Couple Families in Bayfield
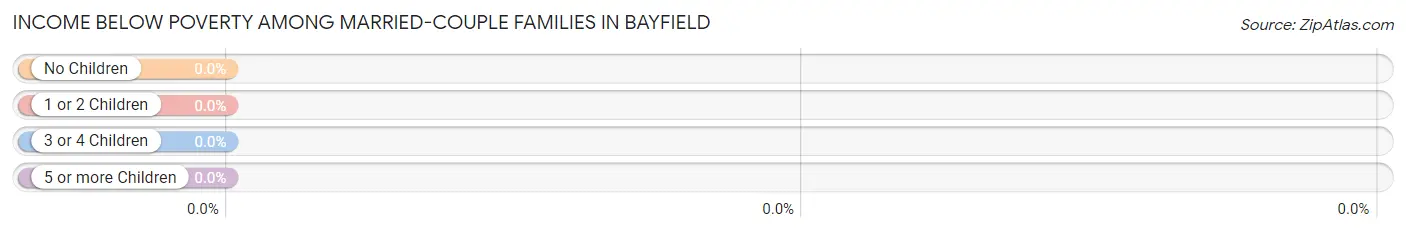
| Children | Above Poverty | Below Poverty |
| No Children | 115 (100.0%) | 0 (0.0%) |
| 1 or 2 Children | 6 (100.0%) | 0 (0.0%) |
| 3 or 4 Children | 17 (100.0%) | 0 (0.0%) |
| 5 or more Children | 0 (0.0%) | 0 (0.0%) |
| Total | 138 (100.0%) | 0 (0.0%) |
Income Below Poverty Among Single-Parent Households in Bayfield
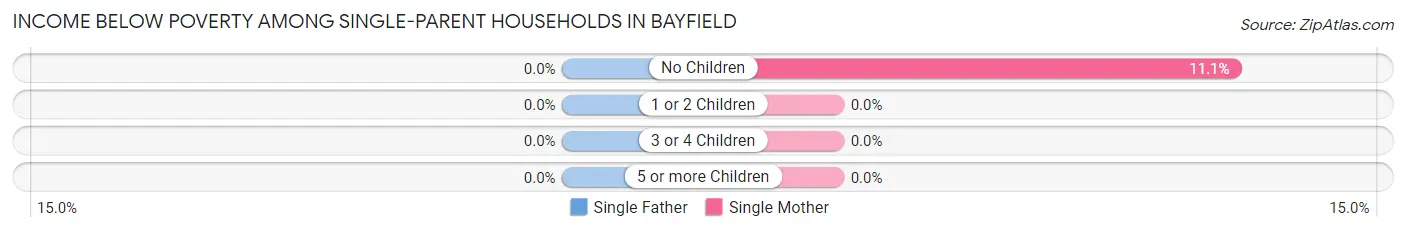
| Children | Single Father | Single Mother |
| No Children | 0 (0.0%) | 2 (11.1%) |
| 1 or 2 Children | 0 (0.0%) | 0 (0.0%) |
| 3 or 4 Children | 0 (0.0%) | 0 (0.0%) |
| 5 or more Children | 0 (0.0%) | 0 (0.0%) |
| Total | 0 (0.0%) | 2 (7.1%) |
Income Below Poverty Among Married-Couple vs Single-Parent Households in Bayfield
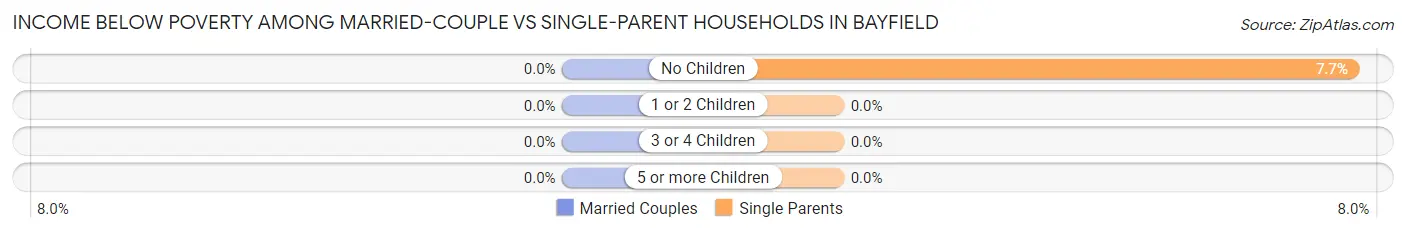
| Children | Married-Couple Families | Single-Parent Households |
| No Children | 0 (0.0%) | 2 (7.7%) |
| 1 or 2 Children | 0 (0.0%) | 0 (0.0%) |
| 3 or 4 Children | 0 (0.0%) | 0 (0.0%) |
| 5 or more Children | 0 (0.0%) | 0 (0.0%) |
| Total | 0 (0.0%) | 2 (5.6%) |
Race in Bayfield
The most populous races in Bayfield are White / Caucasian (505 | 81.9%), Native / Alaskan (61 | 9.9%), and Two or more Races (36 | 5.8%).
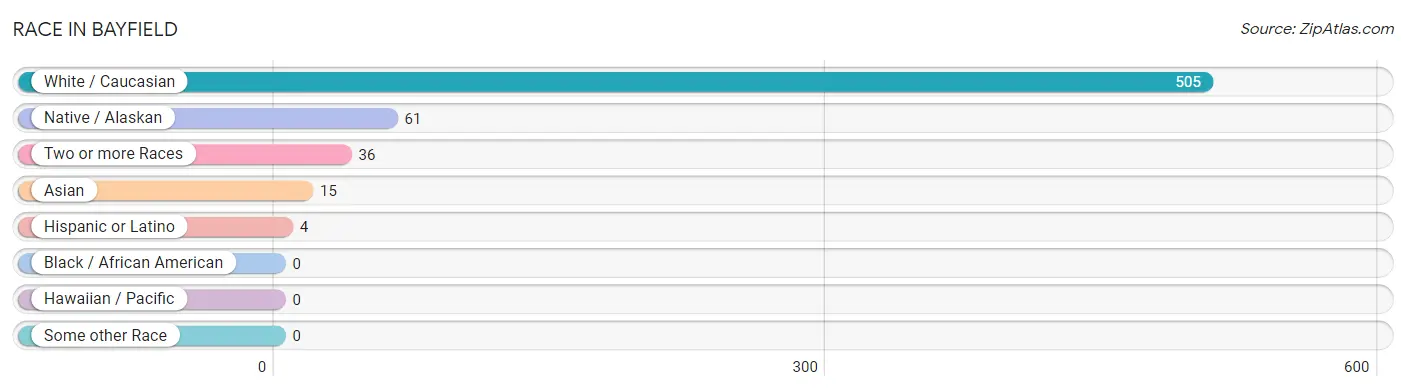
| Race | # Population | % Population |
| Asian | 15 | 2.4% |
| Black / African American | 0 | 0.0% |
| Hawaiian / Pacific | 0 | 0.0% |
| Hispanic or Latino | 4 | 0.6% |
| Native / Alaskan | 61 | 9.9% |
| White / Caucasian | 505 | 81.9% |
| Two or more Races | 36 | 5.8% |
| Some other Race | 0 | 0.0% |
| Total | 617 | 100.0% |
Ancestry in Bayfield
The most populous ancestries reported in Bayfield are German (184 | 29.8%), Swedish (83 | 13.5%), Norwegian (80 | 13.0%), Irish (71 | 11.5%), and Chippewa (68 | 11.0%), together accounting for 78.8% of all Bayfield residents.
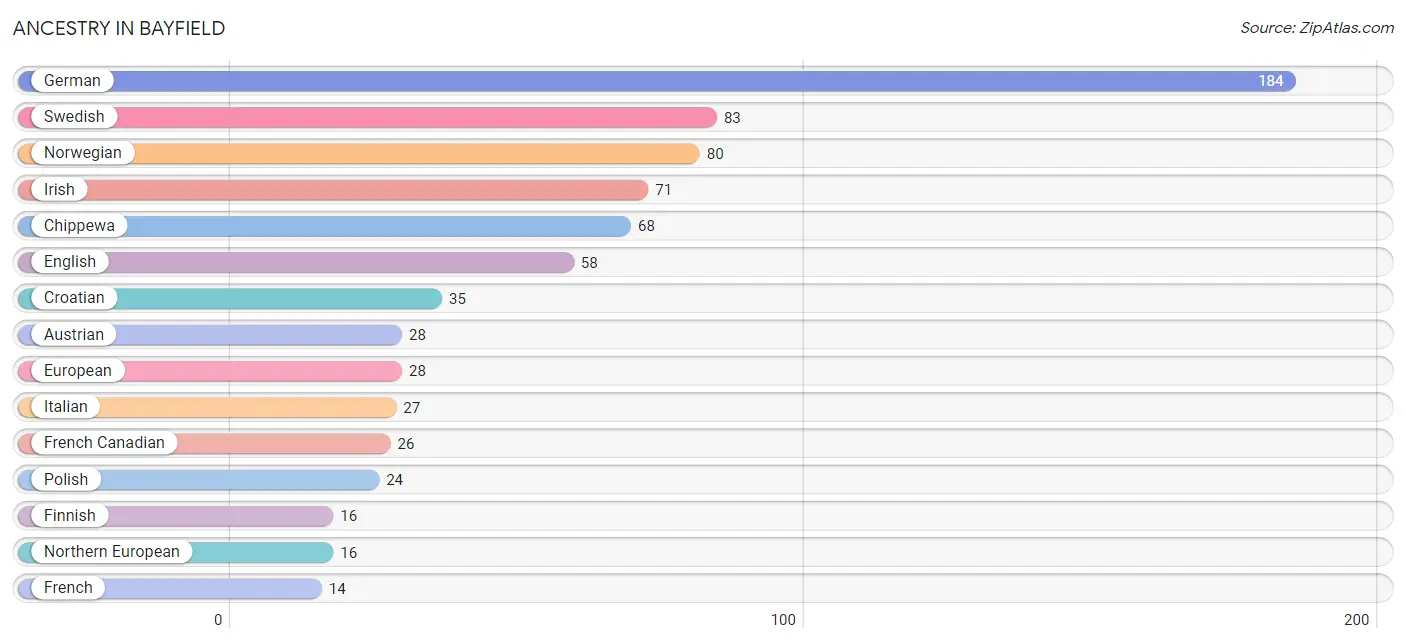
| Ancestry | # Population | % Population |
| American | 1 | 0.2% |
| Austrian | 28 | 4.5% |
| Belgian | 2 | 0.3% |
| Bhutanese | 4 | 0.6% |
| Burmese | 13 | 2.1% |
| Chippewa | 68 | 11.0% |
| Croatian | 35 | 5.7% |
| Czech | 1 | 0.2% |
| Danish | 10 | 1.6% |
| Dutch | 11 | 1.8% |
| English | 58 | 9.4% |
| European | 28 | 4.5% |
| Finnish | 16 | 2.6% |
| French | 14 | 2.3% |
| French Canadian | 26 | 4.2% |
| German | 184 | 29.8% |
| Hungarian | 5 | 0.8% |
| Indian (Asian) | 2 | 0.3% |
| Irish | 71 | 11.5% |
| Israeli | 5 | 0.8% |
| Italian | 27 | 4.4% |
| Laotian | 4 | 0.6% |
| Northern European | 16 | 2.6% |
| Norwegian | 80 | 13.0% |
| Polish | 24 | 3.9% |
| Scandinavian | 5 | 0.8% |
| Scotch-Irish | 8 | 1.3% |
| Scottish | 2 | 0.3% |
| Swedish | 83 | 13.5% |
| Swiss | 2 | 0.3% | View All 30 Rows |
Immigrants in Bayfield
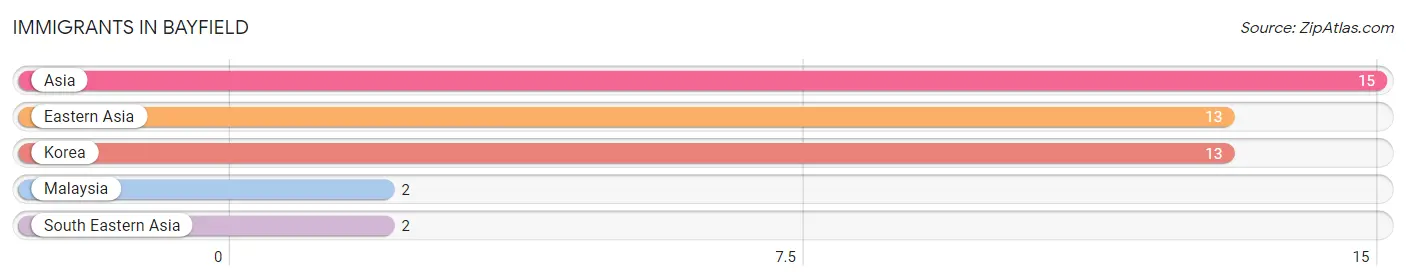
The most numerous immigrant groups reported in Bayfield came from Asia (15 | 2.4%), Eastern Asia (13 | 2.1%), Korea (13 | 2.1%), Malaysia (2 | 0.3%), and South Eastern Asia (2 | 0.3%), together accounting for 7.3% of all Bayfield residents.
| Immigration Origin | # Population | % Population |
| Asia | 15 | 2.4% |
| Eastern Asia | 13 | 2.1% |
| Korea | 13 | 2.1% |
| Malaysia | 2 | 0.3% |
| South Eastern Asia | 2 | 0.3% | View All 5 Rows |
Sex and Age in Bayfield
Sex and Age in Bayfield
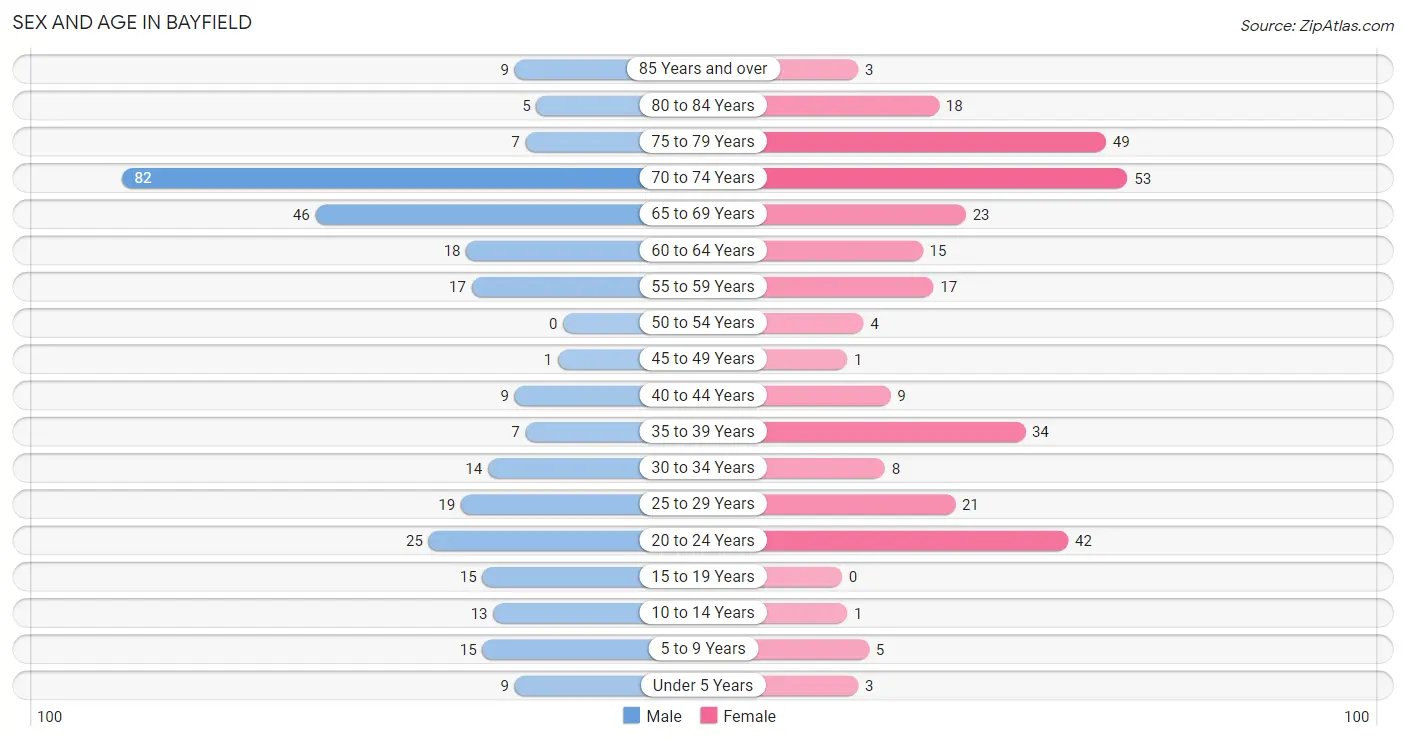
The most populous age groups in Bayfield are 70 to 74 Years (82 | 26.4%) for men and 70 to 74 Years (53 | 17.3%) for women.
| Age Bracket | Male | Female |
| Under 5 Years | 9 (2.9%) | 3 (1.0%) |
| 5 to 9 Years | 15 (4.8%) | 5 (1.6%) |
| 10 to 14 Years | 13 (4.2%) | 1 (0.3%) |
| 15 to 19 Years | 15 (4.8%) | 0 (0.0%) |
| 20 to 24 Years | 25 (8.0%) | 42 (13.7%) |
| 25 to 29 Years | 19 (6.1%) | 21 (6.9%) |
| 30 to 34 Years | 14 (4.5%) | 8 (2.6%) |
| 35 to 39 Years | 7 (2.2%) | 34 (11.1%) |
| 40 to 44 Years | 9 (2.9%) | 9 (2.9%) |
| 45 to 49 Years | 1 (0.3%) | 1 (0.3%) |
| 50 to 54 Years | 0 (0.0%) | 4 (1.3%) |
| 55 to 59 Years | 17 (5.5%) | 17 (5.6%) |
| 60 to 64 Years | 18 (5.8%) | 15 (4.9%) |
| 65 to 69 Years | 46 (14.8%) | 23 (7.5%) |
| 70 to 74 Years | 82 (26.4%) | 53 (17.3%) |
| 75 to 79 Years | 7 (2.2%) | 49 (16.0%) |
| 80 to 84 Years | 5 (1.6%) | 18 (5.9%) |
| 85 Years and over | 9 (2.9%) | 3 (1.0%) |
| Total | 311 (100.0%) | 306 (100.0%) |
Families and Households in Bayfield
Median Family Size in Bayfield
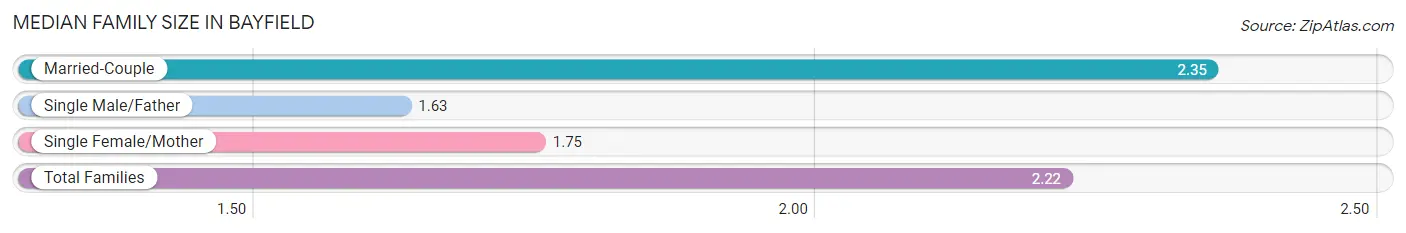
The median family size in Bayfield is 2.22 persons per family, with married-couple families (138 | 79.3%) accounting for the largest median family size of 2.35 persons per family. On the other hand, single male/father families (8 | 4.6%) represent the smallest median family size with 1.63 persons per family.
| Family Type | # Families | Family Size |
| Married-Couple | 138 (79.3%) | 2.35 |
| Single Male/Father | 8 (4.6%) | 1.63 |
| Single Female/Mother | 28 (16.1%) | 1.75 |
| Total Families | 174 (100.0%) | 2.22 |
Median Household Size in Bayfield
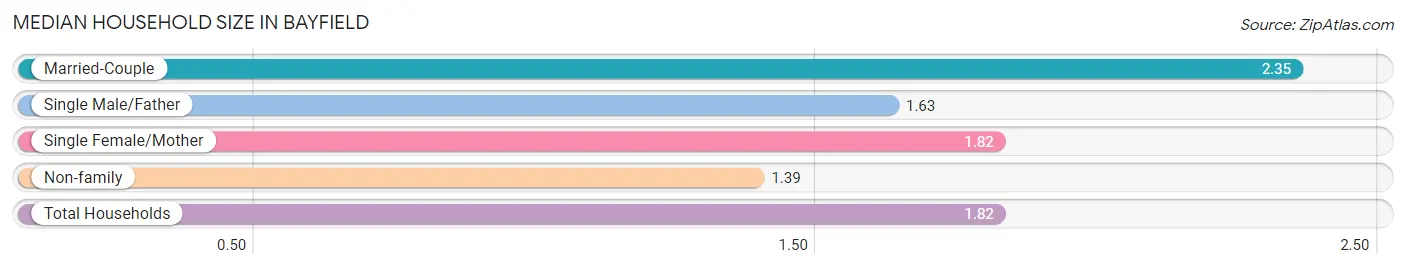
The median household size in Bayfield is 1.82 persons per household, with married-couple households (138 | 40.7%) accounting for the largest median household size of 2.35 persons per household. non-family households (165 | 48.7%) represent the smallest median household size with 1.39 persons per household.
| Household Type | # Households | Household Size |
| Married-Couple | 138 (40.7%) | 2.35 |
| Single Male/Father | 8 (2.4%) | 1.63 |
| Single Female/Mother | 28 (8.3%) | 1.82 |
| Non-family | 165 (48.7%) | 1.39 |
| Total Households | 339 (100.0%) | 1.82 |
Household Size by Marriage Status in Bayfield
Out of a total of 339 households in Bayfield, 174 (51.3%) are family households, while 165 (48.7%) are nonfamily households. The most numerous type of family households are 2-person households, comprising 127, and the most common type of nonfamily households are 1-person households, comprising 112.
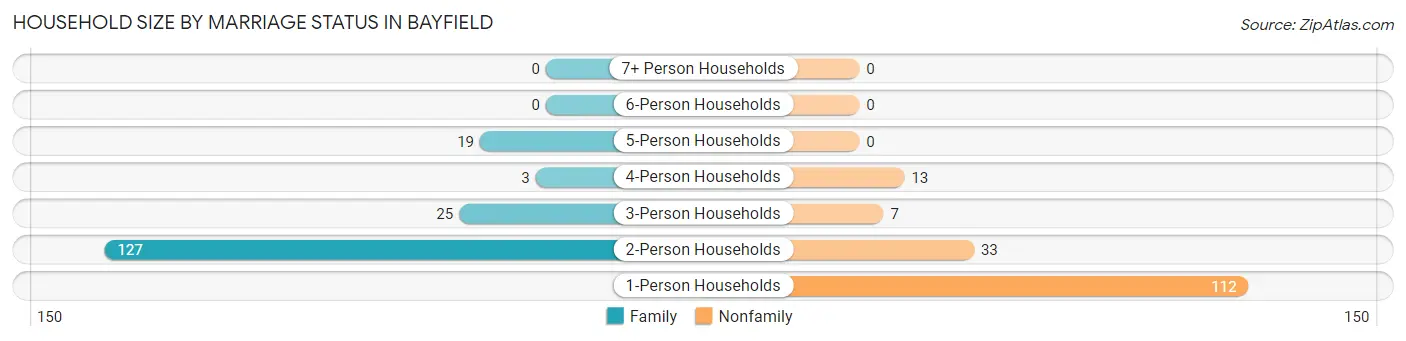
| Household Size | Family Households | Nonfamily Households |
| 1-Person Households | - | 112 (33.0%) |
| 2-Person Households | 127 (37.5%) | 33 (9.7%) |
| 3-Person Households | 25 (7.4%) | 7 (2.1%) |
| 4-Person Households | 3 (0.9%) | 13 (3.8%) |
| 5-Person Households | 19 (5.6%) | 0 (0.0%) |
| 6-Person Households | 0 (0.0%) | 0 (0.0%) |
| 7+ Person Households | 0 (0.0%) | 0 (0.0%) |
| Total | 174 (51.3%) | 165 (48.7%) |
Female Fertility in Bayfield
Fertility by Age in Bayfield
Average fertility rate in Bayfield is 17.0 births per 1,000 women. Women in the age bracket of 20 to 34 years have the highest fertility rate with 28.0 births per 1,000 women. Women in the age bracket of 20 to 34 years acount for 100.0% of all women with births.
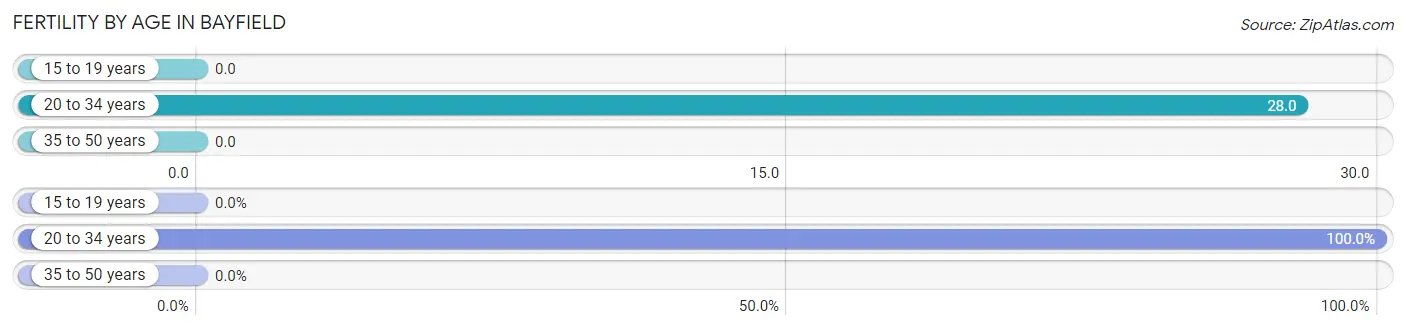
| Age Bracket | Women with Births | Births / 1,000 Women |
| 15 to 19 years | 0 (0.0%) | 0.0 |
| 20 to 34 years | 2 (100.0%) | 28.0 |
| 35 to 50 years | 0 (0.0%) | 0.0 |
| Total | 2 (100.0%) | 17.0 |
Fertility by Age by Marriage Status in Bayfield

| Age Bracket | Married | Unmarried |
| 15 to 19 years | 0 (0.0%) | 0 (0.0%) |
| 20 to 34 years | 2 (100.0%) | 0 (0.0%) |
| 35 to 50 years | 0 (0.0%) | 0 (0.0%) |
| Total | 2 (100.0%) | 0 (0.0%) |
Fertility by Education in Bayfield
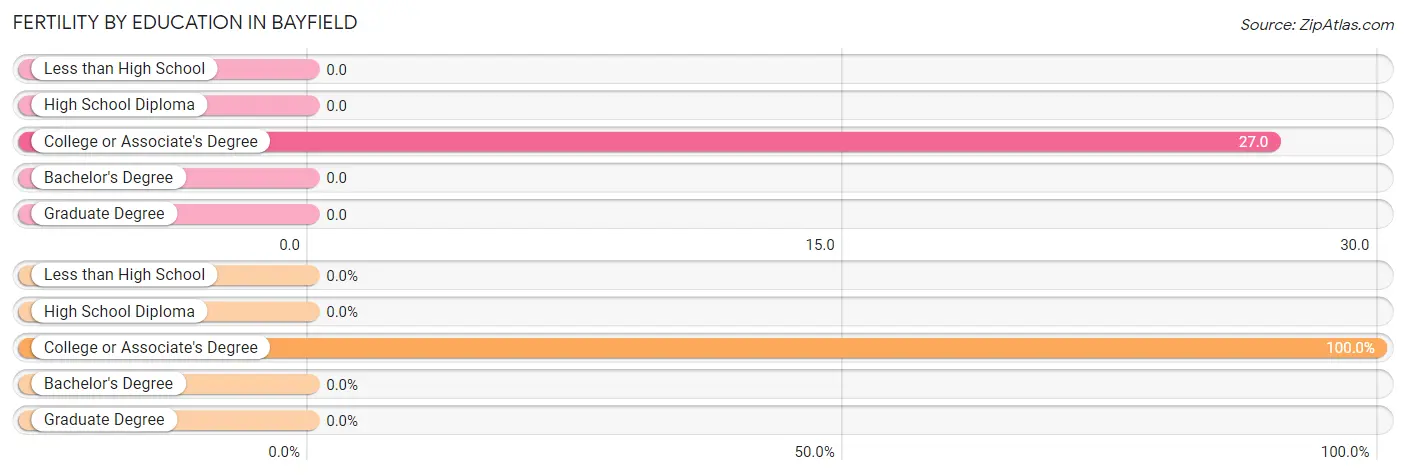
| Educational Attainment | Women with Births | Births / 1,000 Women |
| Less than High School | 0 (0.0%) | 0.0 |
| High School Diploma | 0 (0.0%) | 0.0 |
| College or Associate's Degree | 2 (100.0%) | 27.0 |
| Bachelor's Degree | 0 (0.0%) | 0.0 |
| Graduate Degree | 0 (0.0%) | 0.0 |
| Total | 2 (100.0%) | 17.0 |
Fertility by Education by Marriage Status in Bayfield
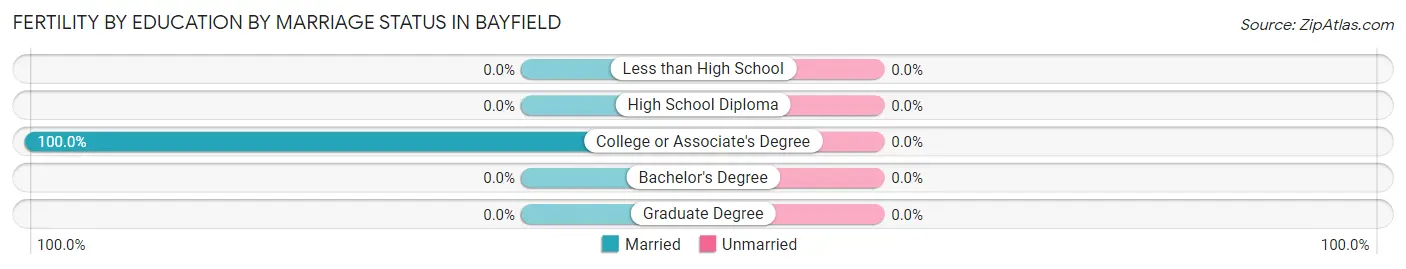
| Educational Attainment | Married | Unmarried |
| Less than High School | 0 (0.0%) | 0 (0.0%) |
| High School Diploma | 0 (0.0%) | 0 (0.0%) |
| College or Associate's Degree | 2 (100.0%) | 0 (0.0%) |
| Bachelor's Degree | 0 (0.0%) | 0 (0.0%) |
| Graduate Degree | 0 (0.0%) | 0 (0.0%) |
| Total | 2 (100.0%) | 0 (0.0%) |
Employment Characteristics in Bayfield
Employment by Class of Employer in Bayfield
Among the 265 employed individuals in Bayfield, private company employees (182 | 68.7%), self-employed (not incorporated) (25 | 9.4%), and local government employees (17 | 6.4%) make up the most common classes of employment.
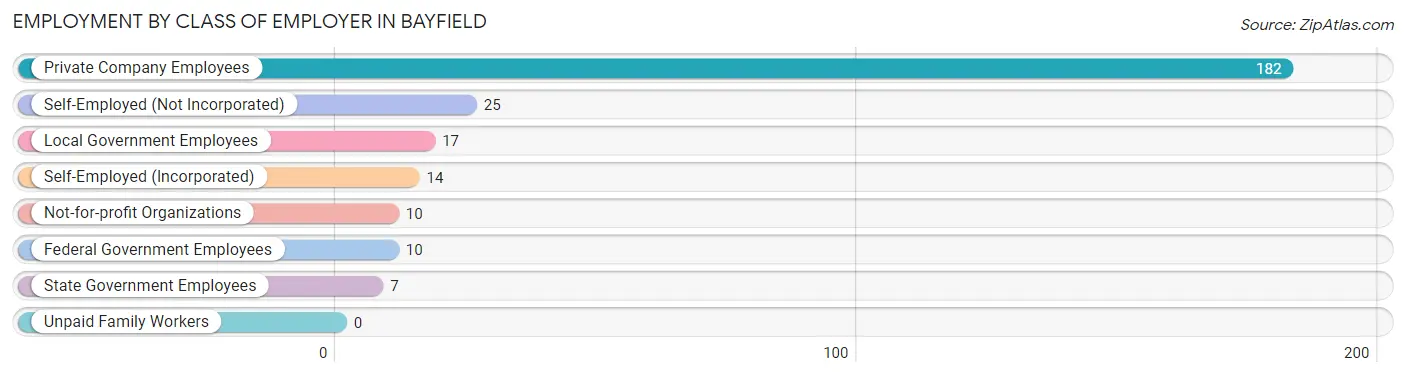
| Employer Class | # Employees | % Employees |
| Private Company Employees | 182 | 68.7% |
| Self-Employed (Incorporated) | 14 | 5.3% |
| Self-Employed (Not Incorporated) | 25 | 9.4% |
| Not-for-profit Organizations | 10 | 3.8% |
| Local Government Employees | 17 | 6.4% |
| State Government Employees | 7 | 2.6% |
| Federal Government Employees | 10 | 3.8% |
| Unpaid Family Workers | 0 | 0.0% |
| Total | 265 | 100.0% |
Employment Status by Age in Bayfield
According to the labor force statistics for Bayfield, out of the total population over 16 years of age (564), 48.4% or 273 individuals are in the labor force, with 3.0% or 8 of them unemployed. The age group with the highest labor force participation rate is 30 to 34 years, with 100.0% or 22 individuals in the labor force. Within the labor force, the 45 to 54 years age range has the highest percentage of unemployed individuals, with 66.7% or 4 of them being unemployed.
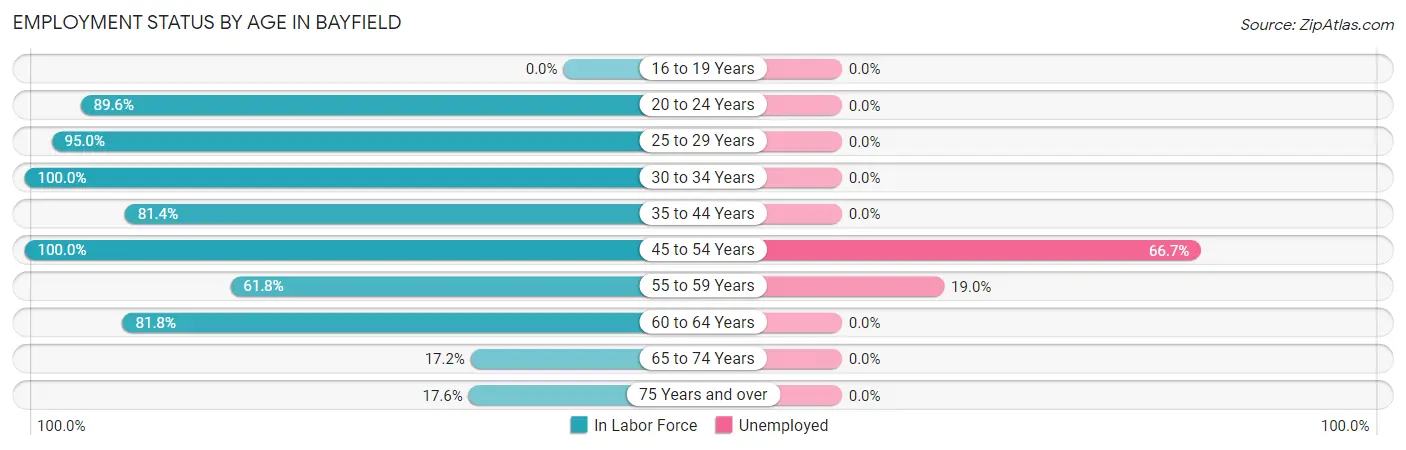
| Age Bracket | In Labor Force | Unemployed |
| 16 to 19 Years | 0 (0.0%) | 0 (0.0%) |
| 20 to 24 Years | 60 (89.6%) | 0 (0.0%) |
| 25 to 29 Years | 38 (95.0%) | 0 (0.0%) |
| 30 to 34 Years | 22 (100.0%) | 0 (0.0%) |
| 35 to 44 Years | 48 (81.4%) | 0 (0.0%) |
| 45 to 54 Years | 6 (100.0%) | 4 (66.7%) |
| 55 to 59 Years | 21 (61.8%) | 4 (19.0%) |
| 60 to 64 Years | 27 (81.8%) | 0 (0.0%) |
| 65 to 74 Years | 35 (17.2%) | 0 (0.0%) |
| 75 Years and over | 16 (17.6%) | 0 (0.0%) |
| Total | 273 (48.4%) | 8 (3.0%) |
Employment Status by Educational Attainment in Bayfield
According to labor force statistics for Bayfield, 83.5% of individuals (162) out of the total population between 25 and 64 years of age (194) are in the labor force, with 5.1% or 8 of them being unemployed. The group with the highest labor force participation rate are those with the educational attainment of bachelor's degree or higher, with 92.4% or 73 individuals in the labor force. Within the labor force, individuals with high school diploma education have the highest percentage of unemployment, with 47.1% or 11 of them being unemployed.
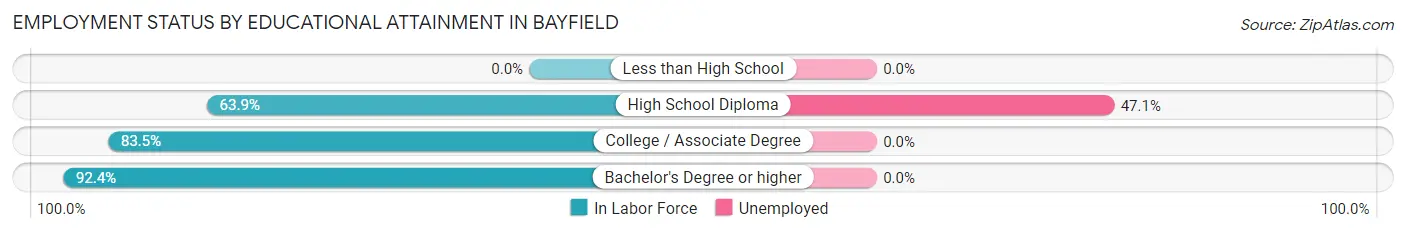
| Educational Attainment | In Labor Force | Unemployed |
| Less than High School | 0 (0.0%) | 0 (0.0%) |
| High School Diploma | 23 (63.9%) | 17 (47.1%) |
| College / Associate Degree | 66 (83.5%) | 0 (0.0%) |
| Bachelor's Degree or higher | 73 (92.4%) | 0 (0.0%) |
| Total | 162 (83.5%) | 10 (5.1%) |
Employment Occupations by Sex in Bayfield
Management, Business, Science and Arts Occupations
The most common Management, Business, Science and Arts occupations in Bayfield are Management (69 | 26.6%), Community & Social Service (40 | 15.4%), Education Instruction & Library (19 | 7.3%), Education, Arts & Media (9 | 3.5%), and Arts, Media & Entertainment (7 | 2.7%).
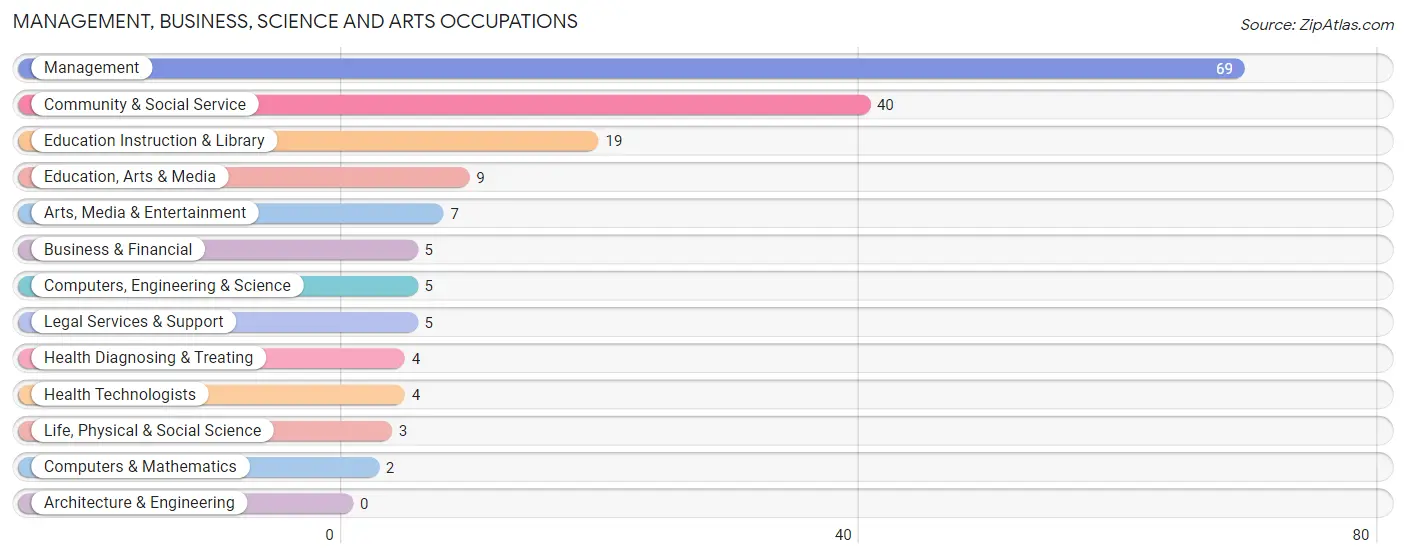
Management, Business, Science and Arts Occupations by Sex
Within the Management, Business, Science and Arts occupations in Bayfield, the most male-oriented occupations are Computers, Engineering & Science (100.0%), Computers & Mathematics (100.0%), and Life, Physical & Social Science (100.0%), while the most female-oriented occupations are Business & Financial (100.0%), Health Diagnosing & Treating (100.0%), and Health Technologists (100.0%).
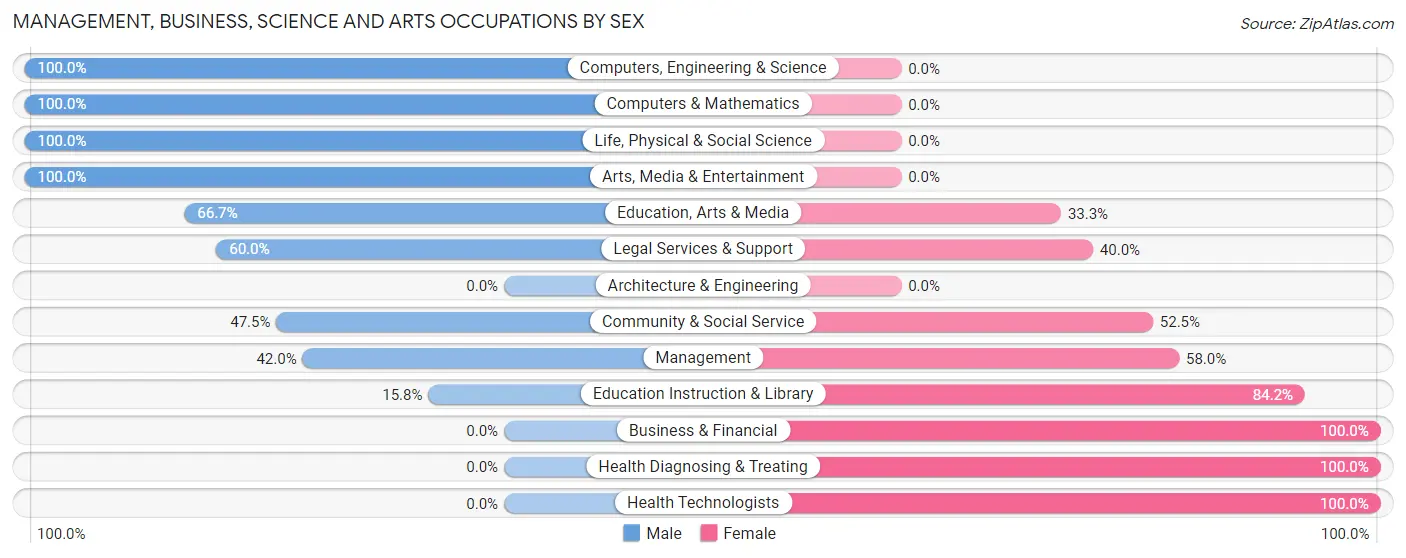
| Occupation | Male | Female |
| Management | 29 (42.0%) | 40 (58.0%) |
| Business & Financial | 0 (0.0%) | 5 (100.0%) |
| Computers, Engineering & Science | 5 (100.0%) | 0 (0.0%) |
| Computers & Mathematics | 2 (100.0%) | 0 (0.0%) |
| Architecture & Engineering | 0 (0.0%) | 0 (0.0%) |
| Life, Physical & Social Science | 3 (100.0%) | 0 (0.0%) |
| Community & Social Service | 19 (47.5%) | 21 (52.5%) |
| Education, Arts & Media | 6 (66.7%) | 3 (33.3%) |
| Legal Services & Support | 3 (60.0%) | 2 (40.0%) |
| Education Instruction & Library | 3 (15.8%) | 16 (84.2%) |
| Arts, Media & Entertainment | 7 (100.0%) | 0 (0.0%) |
| Health Diagnosing & Treating | 0 (0.0%) | 4 (100.0%) |
| Health Technologists | 0 (0.0%) | 4 (100.0%) |
| Total (Category) | 53 (43.1%) | 70 (56.9%) |
| Total (Overall) | 106 (40.9%) | 153 (59.1%) |
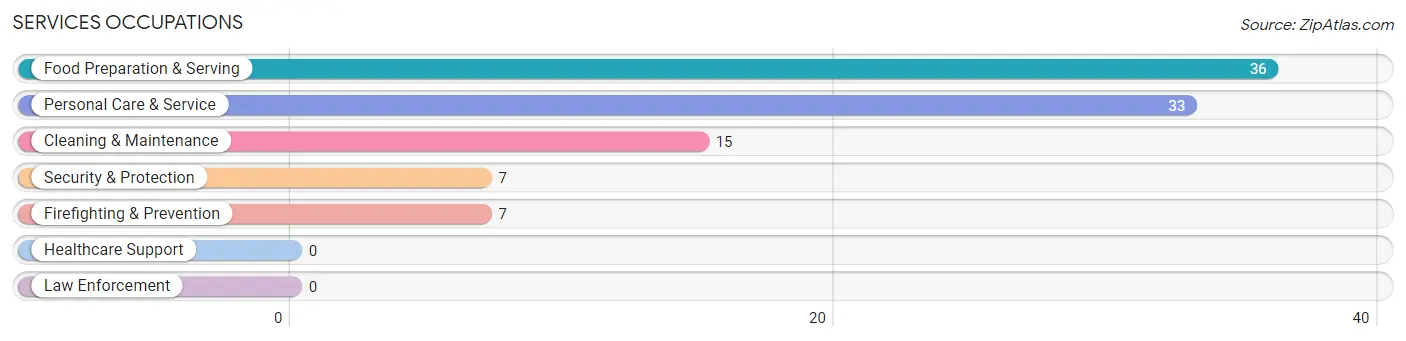
Services Occupations
The most common Services occupations in Bayfield are Food Preparation & Serving (36 | 13.9%), Personal Care & Service (33 | 12.7%), Cleaning & Maintenance (15 | 5.8%), Security & Protection (7 | 2.7%), and Firefighting & Prevention (7 | 2.7%).
Services Occupations by Sex
Within the Services occupations in Bayfield, the most male-oriented occupations are Cleaning & Maintenance (100.0%), Food Preparation & Serving (63.9%), and Personal Care & Service (15.1%), while the most female-oriented occupations are Security & Protection (100.0%), Firefighting & Prevention (100.0%), and Personal Care & Service (84.9%).
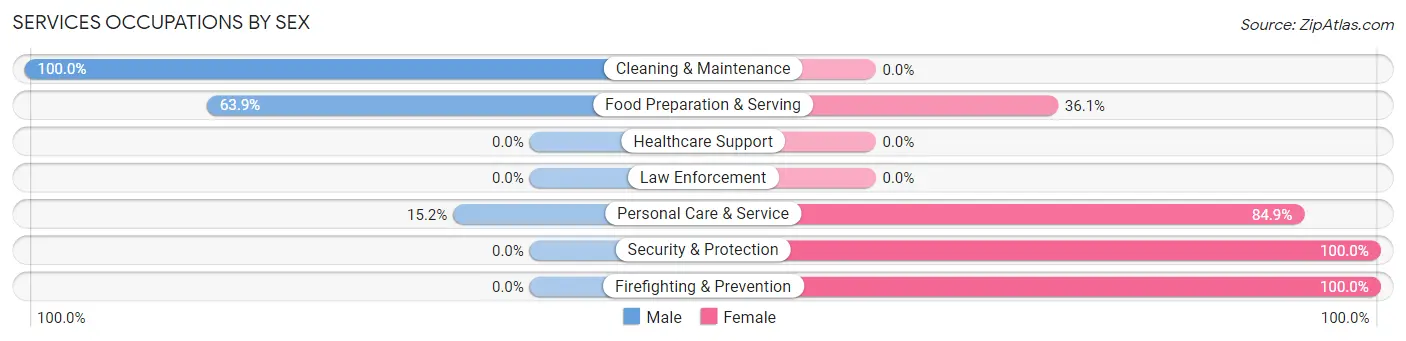
| Occupation | Male | Female |
| Healthcare Support | 0 (0.0%) | 0 (0.0%) |
| Security & Protection | 0 (0.0%) | 7 (100.0%) |
| Firefighting & Prevention | 0 (0.0%) | 7 (100.0%) |
| Law Enforcement | 0 (0.0%) | 0 (0.0%) |
| Food Preparation & Serving | 23 (63.9%) | 13 (36.1%) |
| Cleaning & Maintenance | 15 (100.0%) | 0 (0.0%) |
| Personal Care & Service | 5 (15.1%) | 28 (84.9%) |
| Total (Category) | 43 (47.2%) | 48 (52.7%) |
| Total (Overall) | 106 (40.9%) | 153 (59.1%) |
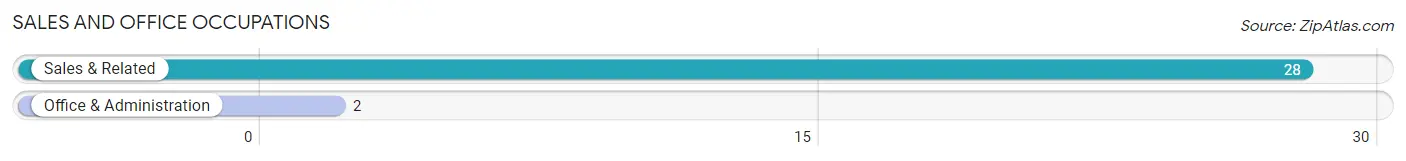
Sales and Office Occupations
The most common Sales and Office occupations in Bayfield are Sales & Related (28 | 10.8%), and Office & Administration (2 | 0.8%).
Sales and Office Occupations by Sex
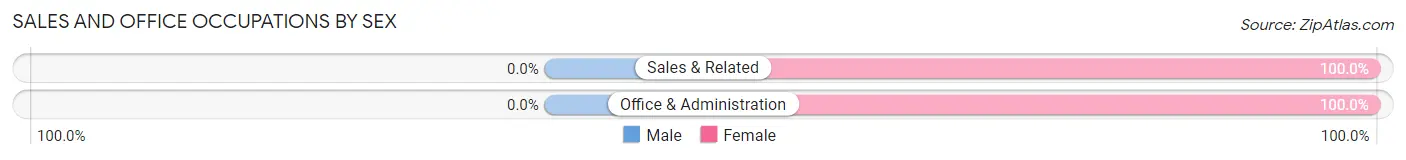
| Occupation | Male | Female |
| Sales & Related | 0 (0.0%) | 28 (100.0%) |
| Office & Administration | 0 (0.0%) | 2 (100.0%) |
| Total (Category) | 0 (0.0%) | 30 (100.0%) |
| Total (Overall) | 106 (40.9%) | 153 (59.1%) |
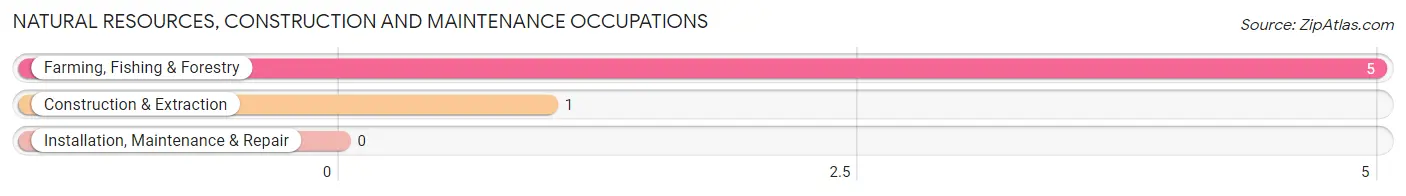
Natural Resources, Construction and Maintenance Occupations
The most common Natural Resources, Construction and Maintenance occupations in Bayfield are Farming, Fishing & Forestry (5 | 1.9%), and Construction & Extraction (1 | 0.4%).
Natural Resources, Construction and Maintenance Occupations by Sex
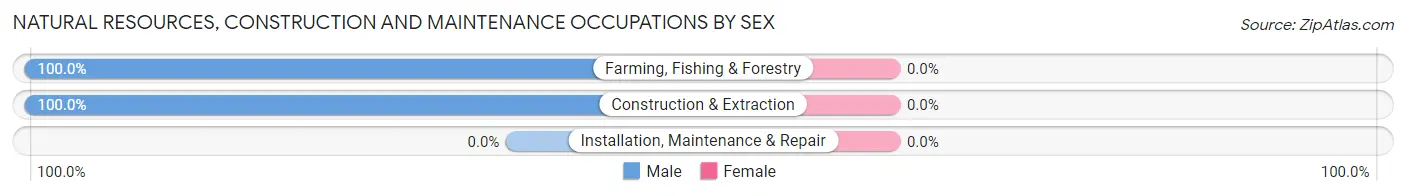
| Occupation | Male | Female |
| Farming, Fishing & Forestry | 5 (100.0%) | 0 (0.0%) |
| Construction & Extraction | 1 (100.0%) | 0 (0.0%) |
| Installation, Maintenance & Repair | 0 (0.0%) | 0 (0.0%) |
| Total (Category) | 6 (100.0%) | 0 (0.0%) |
| Total (Overall) | 106 (40.9%) | 153 (59.1%) |
Production, Transportation and Moving Occupations
The most common Production, Transportation and Moving occupations in Bayfield are Production (6 | 2.3%), and Transportation (3 | 1.2%).
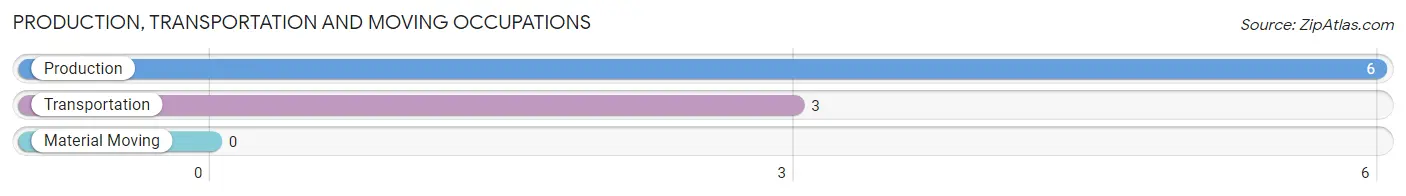
Production, Transportation and Moving Occupations by Sex
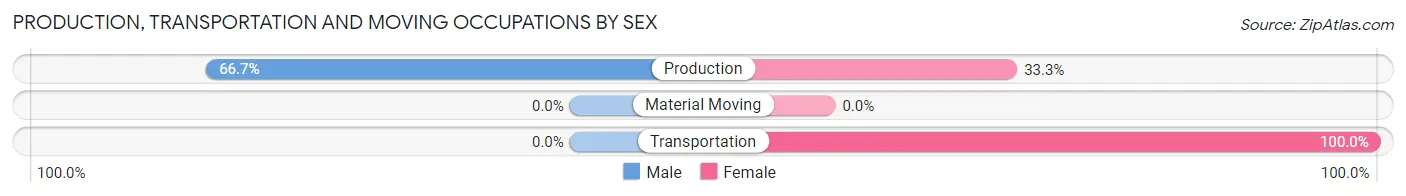
| Occupation | Male | Female |
| Production | 4 (66.7%) | 2 (33.3%) |
| Transportation | 0 (0.0%) | 3 (100.0%) |
| Material Moving | 0 (0.0%) | 0 (0.0%) |
| Total (Category) | 4 (44.4%) | 5 (55.6%) |
| Total (Overall) | 106 (40.9%) | 153 (59.1%) |
Employment Industries by Sex in Bayfield
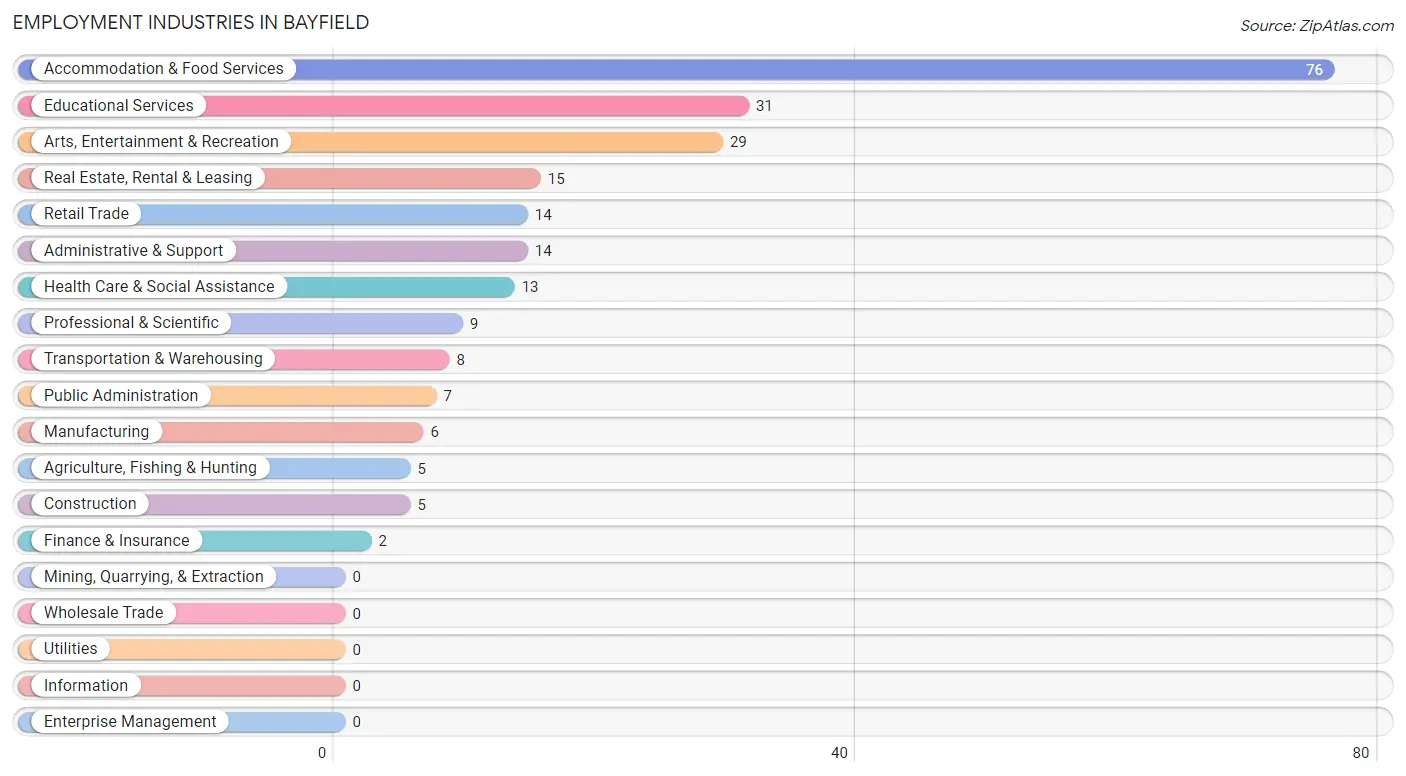
Employment Industries in Bayfield
The major employment industries in Bayfield include Accommodation & Food Services (76 | 29.3%), Educational Services (31 | 12.0%), Arts, Entertainment & Recreation (29 | 11.2%), Real Estate, Rental & Leasing (15 | 5.8%), and Retail Trade (14 | 5.4%).
Employment Industries by Sex in Bayfield
The Bayfield industries that see more men than women are Agriculture, Fishing & Hunting (100.0%), Construction (100.0%), and Finance & Insurance (100.0%), whereas the industries that tend to have a higher number of women are Retail Trade (100.0%), Educational Services (90.3%), and Arts, Entertainment & Recreation (82.8%).
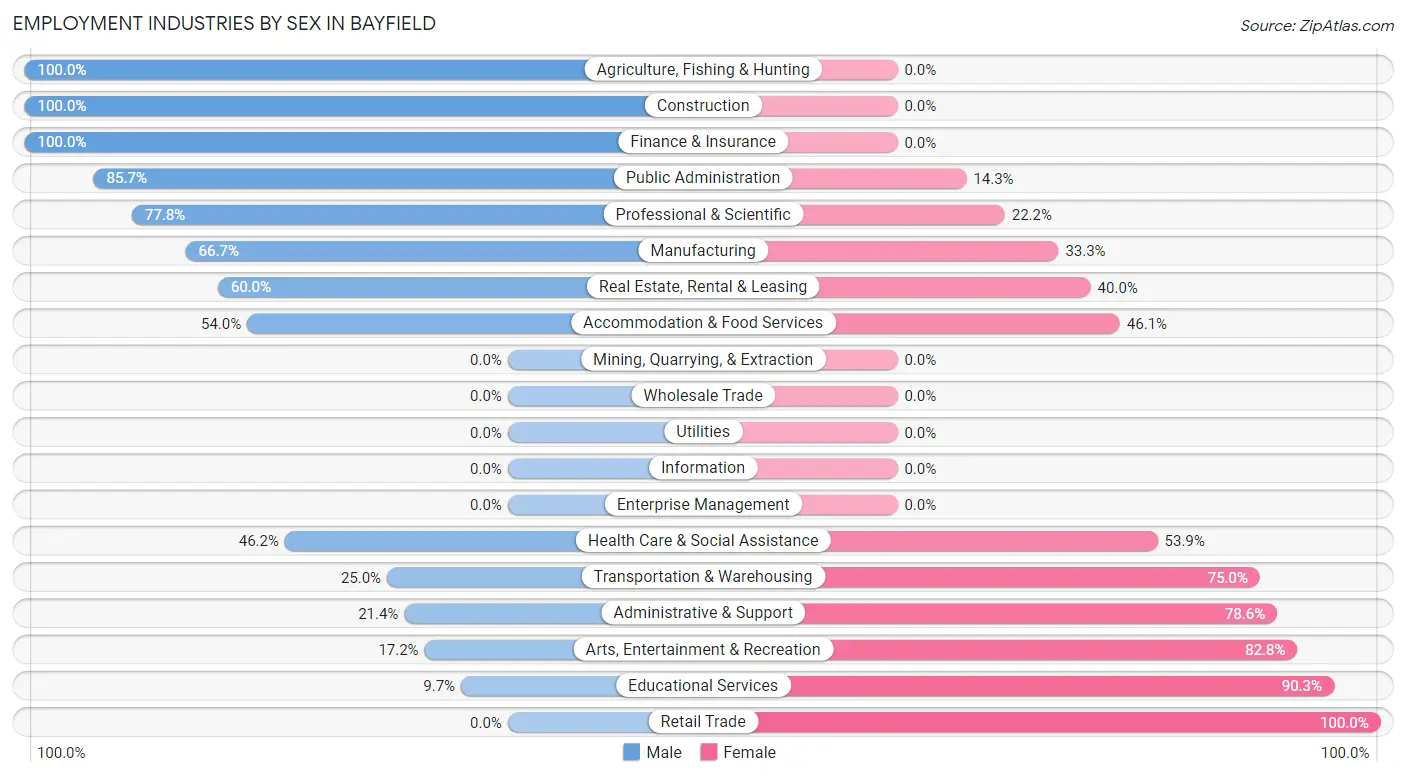
| Industry | Male | Female |
| Agriculture, Fishing & Hunting | 5 (100.0%) | 0 (0.0%) |
| Mining, Quarrying, & Extraction | 0 (0.0%) | 0 (0.0%) |
| Construction | 5 (100.0%) | 0 (0.0%) |
| Manufacturing | 4 (66.7%) | 2 (33.3%) |
| Wholesale Trade | 0 (0.0%) | 0 (0.0%) |
| Retail Trade | 0 (0.0%) | 14 (100.0%) |
| Transportation & Warehousing | 2 (25.0%) | 6 (75.0%) |
| Utilities | 0 (0.0%) | 0 (0.0%) |
| Information | 0 (0.0%) | 0 (0.0%) |
| Finance & Insurance | 2 (100.0%) | 0 (0.0%) |
| Real Estate, Rental & Leasing | 9 (60.0%) | 6 (40.0%) |
| Professional & Scientific | 7 (77.8%) | 2 (22.2%) |
| Enterprise Management | 0 (0.0%) | 0 (0.0%) |
| Administrative & Support | 3 (21.4%) | 11 (78.6%) |
| Educational Services | 3 (9.7%) | 28 (90.3%) |
| Health Care & Social Assistance | 6 (46.2%) | 7 (53.8%) |
| Arts, Entertainment & Recreation | 5 (17.2%) | 24 (82.8%) |
| Accommodation & Food Services | 41 (53.9%) | 35 (46.1%) |
| Public Administration | 6 (85.7%) | 1 (14.3%) |
| Total | 106 (40.9%) | 153 (59.1%) |
Education in Bayfield
School Enrollment in Bayfield
The most common levels of schooling among the 60 students in Bayfield are high school (15 | 25.0%), middle school (14 | 23.3%), and kindergarten (11 | 18.3%).
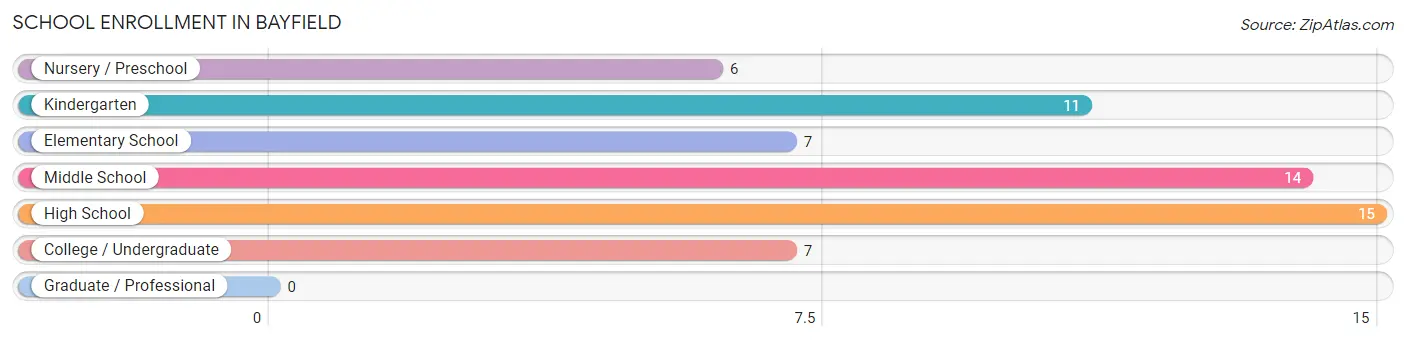
| School Level | # Students | % Students |
| Nursery / Preschool | 6 | 10.0% |
| Kindergarten | 11 | 18.3% |
| Elementary School | 7 | 11.7% |
| Middle School | 14 | 23.3% |
| High School | 15 | 25.0% |
| College / Undergraduate | 7 | 11.7% |
| Graduate / Professional | 0 | 0.0% |
| Total | 60 | 100.0% |
School Enrollment by Age by Funding Source in Bayfield
Out of a total of 60 students who are enrolled in schools in Bayfield, 11 (18.3%) attend a private institution, while the remaining 49 (81.7%) are enrolled in public schools. The age group of 20 to 24 year olds has the highest likelihood of being enrolled in private schools, with 7 (100.0% in the age bracket) enrolled. Conversely, the age group of 3 to 4 year olds has the lowest likelihood of being enrolled in a private school, with 4 (100.0% in the age bracket) attending a public institution.
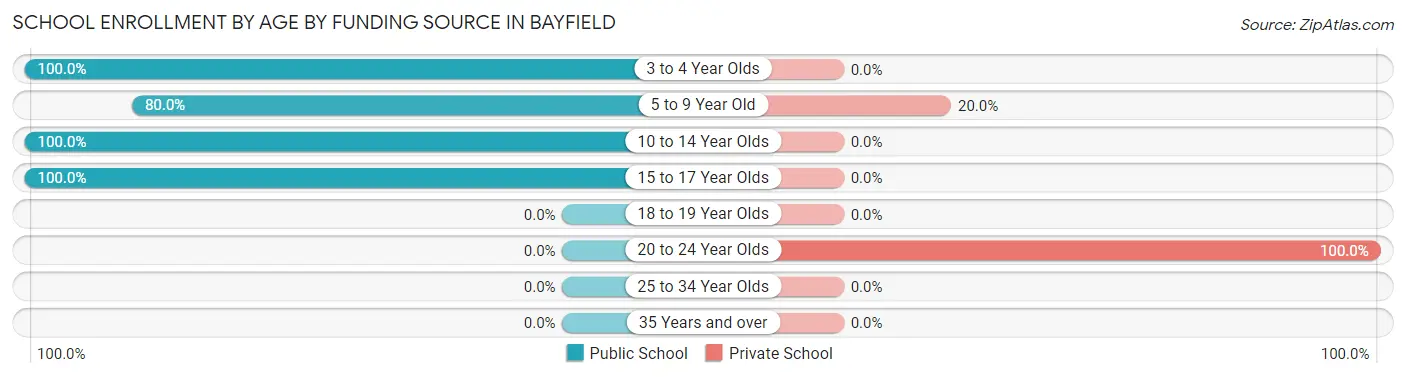
| Age Bracket | Public School | Private School |
| 3 to 4 Year Olds | 4 (100.0%) | 0 (0.0%) |
| 5 to 9 Year Old | 16 (80.0%) | 4 (20.0%) |
| 10 to 14 Year Olds | 14 (100.0%) | 0 (0.0%) |
| 15 to 17 Year Olds | 15 (100.0%) | 0 (0.0%) |
| 18 to 19 Year Olds | 0 (0.0%) | 0 (0.0%) |
| 20 to 24 Year Olds | 0 (0.0%) | 7 (100.0%) |
| 25 to 34 Year Olds | 0 (0.0%) | 0 (0.0%) |
| 35 Years and over | 0 (0.0%) | 0 (0.0%) |
| Total | 49 (81.7%) | 11 (18.3%) |
Educational Attainment by Field of Study in Bayfield
Social sciences (96 | 28.1%), education (56 | 16.4%), psychology (38 | 11.1%), business (24 | 7.0%), and science & technology (22 | 6.5%) are the most common fields of study among 341 individuals in Bayfield who have obtained a bachelor's degree or higher.
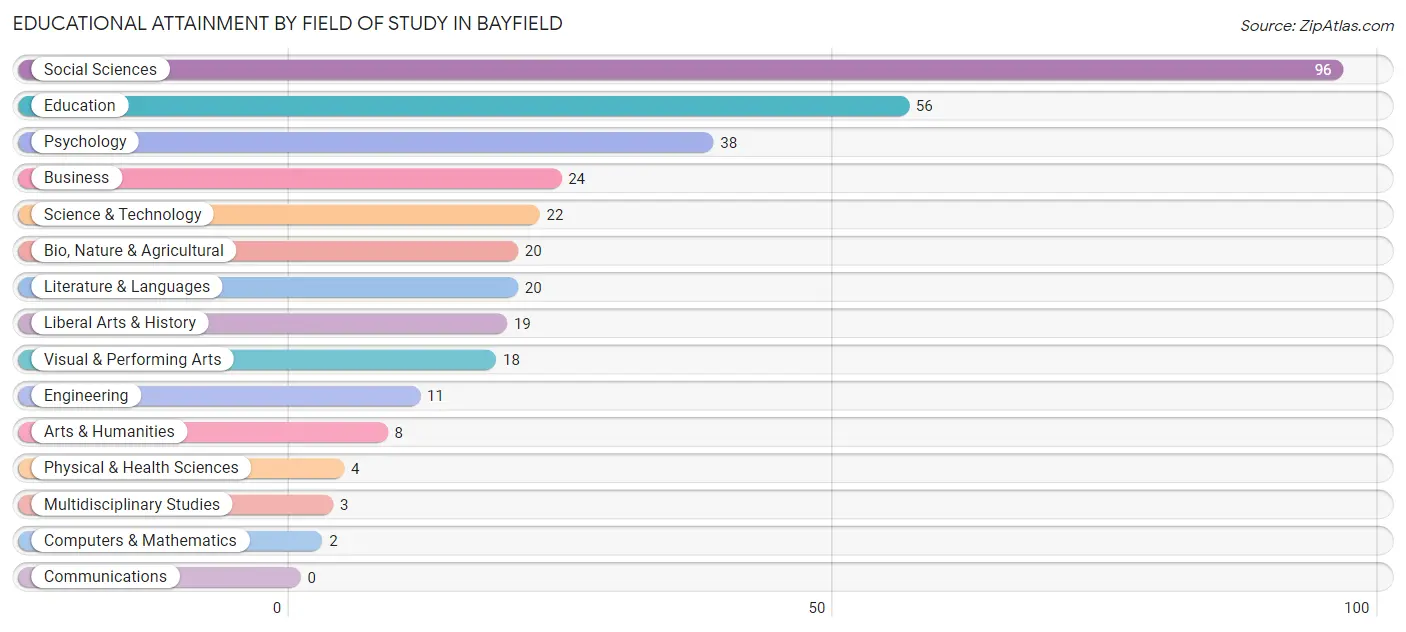
| Field of Study | # Graduates | % Graduates |
| Computers & Mathematics | 2 | 0.6% |
| Bio, Nature & Agricultural | 20 | 5.9% |
| Physical & Health Sciences | 4 | 1.2% |
| Psychology | 38 | 11.1% |
| Social Sciences | 96 | 28.1% |
| Engineering | 11 | 3.2% |
| Multidisciplinary Studies | 3 | 0.9% |
| Science & Technology | 22 | 6.5% |
| Business | 24 | 7.0% |
| Education | 56 | 16.4% |
| Literature & Languages | 20 | 5.9% |
| Liberal Arts & History | 19 | 5.6% |
| Visual & Performing Arts | 18 | 5.3% |
| Communications | 0 | 0.0% |
| Arts & Humanities | 8 | 2.4% |
| Total | 341 | 100.0% |
Transportation & Commute in Bayfield
Vehicle Availability by Sex in Bayfield
The most prevalent vehicle ownership categories in Bayfield are males with 1 vehicle (45, accounting for 40.2%) and females with 1 vehicle (64, making up 29.4%).
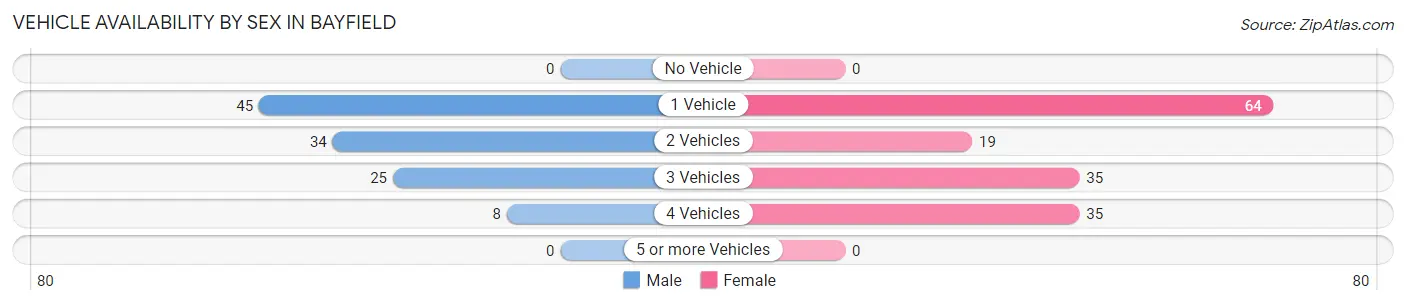
| Vehicles Available | Male | Female |
| No Vehicle | 0 (0.0%) | 0 (0.0%) |
| 1 Vehicle | 45 (40.2%) | 64 (41.8%) |
| 2 Vehicles | 34 (30.4%) | 19 (12.4%) |
| 3 Vehicles | 25 (22.3%) | 35 (22.9%) |
| 4 Vehicles | 8 (7.1%) | 35 (22.9%) |
| 5 or more Vehicles | 0 (0.0%) | 0 (0.0%) |
| Total | 112 (100.0%) | 153 (100.0%) |
Commute Time in Bayfield
The most frequently occuring commute durations in Bayfield are 5 to 9 minutes (85 commuters, 39.2%), less than 5 minutes (59 commuters, 27.2%), and 10 to 14 minutes (41 commuters, 18.9%).
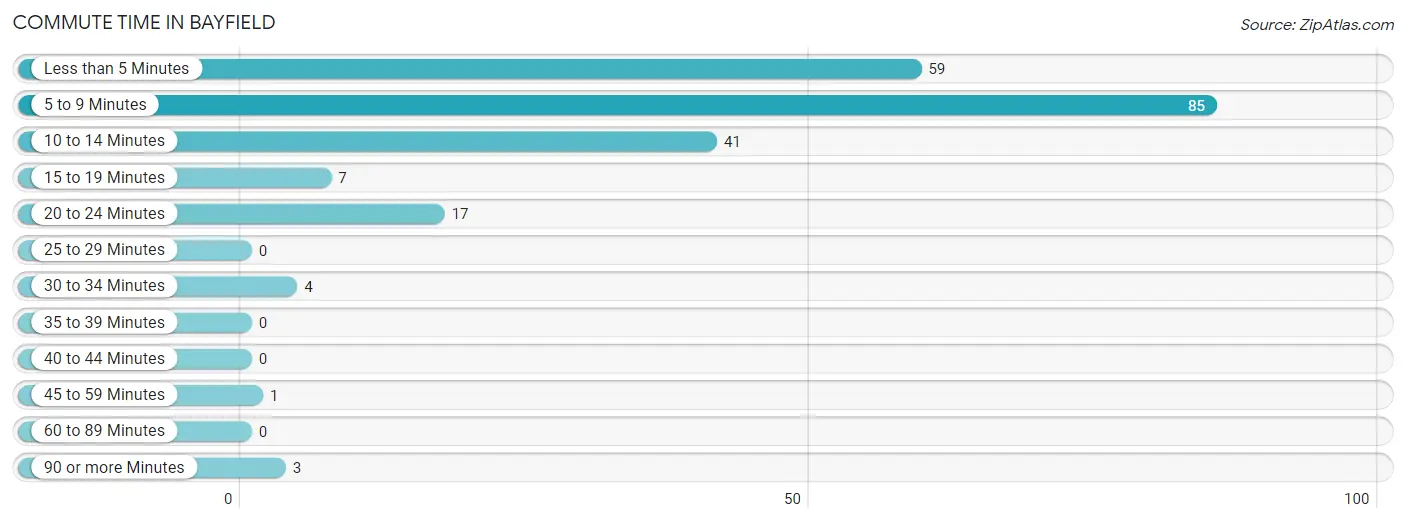
| Commute Time | # Commuters | % Commuters |
| Less than 5 Minutes | 59 | 27.2% |
| 5 to 9 Minutes | 85 | 39.2% |
| 10 to 14 Minutes | 41 | 18.9% |
| 15 to 19 Minutes | 7 | 3.2% |
| 20 to 24 Minutes | 17 | 7.8% |
| 25 to 29 Minutes | 0 | 0.0% |
| 30 to 34 Minutes | 4 | 1.8% |
| 35 to 39 Minutes | 0 | 0.0% |
| 40 to 44 Minutes | 0 | 0.0% |
| 45 to 59 Minutes | 1 | 0.5% |
| 60 to 89 Minutes | 0 | 0.0% |
| 90 or more Minutes | 3 | 1.4% |
Commute Time by Sex in Bayfield
The most common commute times in Bayfield are 5 to 9 minutes (35 commuters, 38.5%) for males and 5 to 9 minutes (50 commuters, 39.7%) for females.
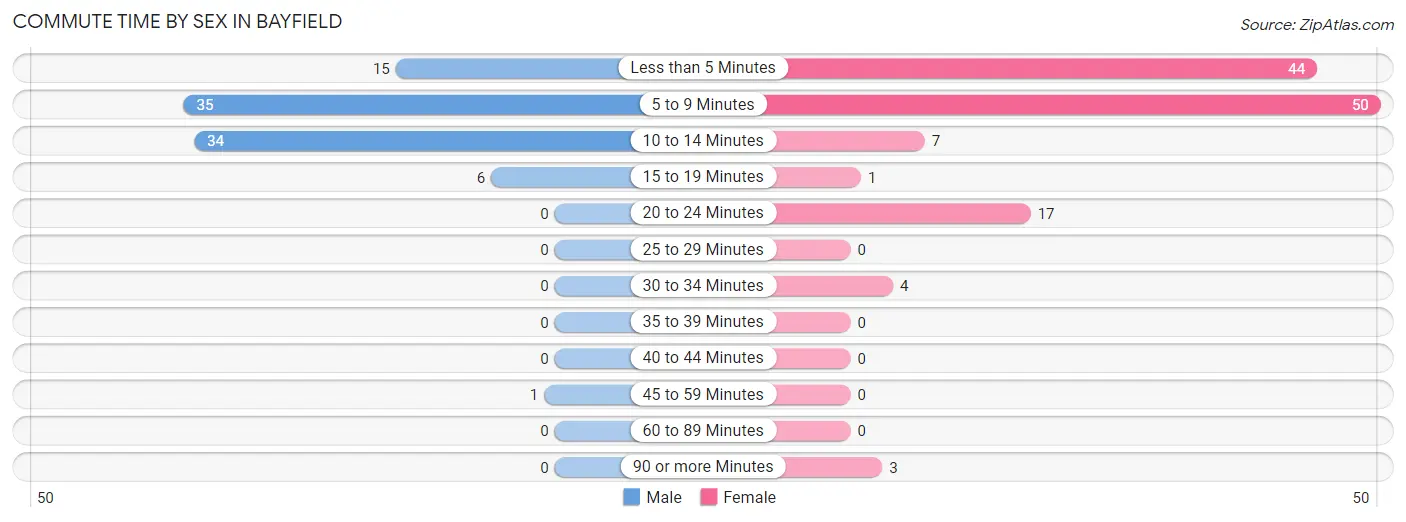
| Commute Time | Male | Female |
| Less than 5 Minutes | 15 (16.5%) | 44 (34.9%) |
| 5 to 9 Minutes | 35 (38.5%) | 50 (39.7%) |
| 10 to 14 Minutes | 34 (37.4%) | 7 (5.6%) |
| 15 to 19 Minutes | 6 (6.6%) | 1 (0.8%) |
| 20 to 24 Minutes | 0 (0.0%) | 17 (13.5%) |
| 25 to 29 Minutes | 0 (0.0%) | 0 (0.0%) |
| 30 to 34 Minutes | 0 (0.0%) | 4 (3.2%) |
| 35 to 39 Minutes | 0 (0.0%) | 0 (0.0%) |
| 40 to 44 Minutes | 0 (0.0%) | 0 (0.0%) |
| 45 to 59 Minutes | 1 (1.1%) | 0 (0.0%) |
| 60 to 89 Minutes | 0 (0.0%) | 0 (0.0%) |
| 90 or more Minutes | 0 (0.0%) | 3 (2.4%) |
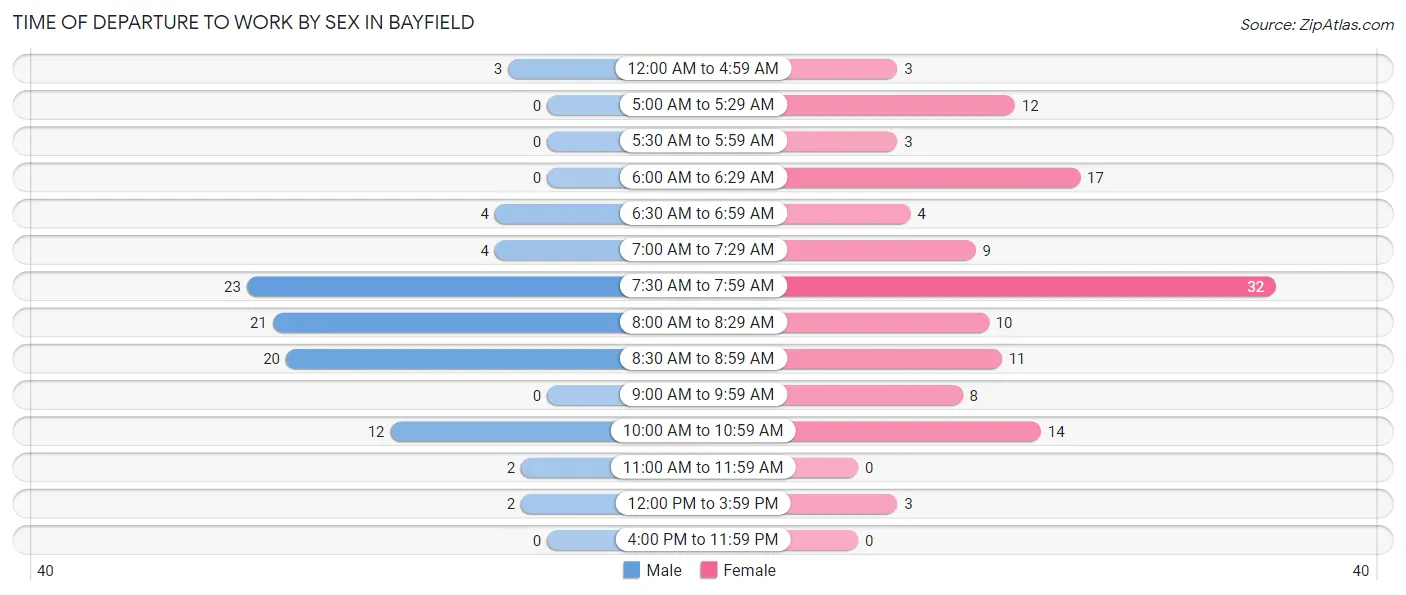
Time of Departure to Work by Sex in Bayfield
The most frequent times of departure to work in Bayfield are 7:30 AM to 7:59 AM (23, 25.3%) for males and 7:30 AM to 7:59 AM (32, 25.4%) for females.
| Time of Departure | Male | Female |
| 12:00 AM to 4:59 AM | 3 (3.3%) | 3 (2.4%) |
| 5:00 AM to 5:29 AM | 0 (0.0%) | 12 (9.5%) |
| 5:30 AM to 5:59 AM | 0 (0.0%) | 3 (2.4%) |
| 6:00 AM to 6:29 AM | 0 (0.0%) | 17 (13.5%) |
| 6:30 AM to 6:59 AM | 4 (4.4%) | 4 (3.2%) |
| 7:00 AM to 7:29 AM | 4 (4.4%) | 9 (7.1%) |
| 7:30 AM to 7:59 AM | 23 (25.3%) | 32 (25.4%) |
| 8:00 AM to 8:29 AM | 21 (23.1%) | 10 (7.9%) |
| 8:30 AM to 8:59 AM | 20 (22.0%) | 11 (8.7%) |
| 9:00 AM to 9:59 AM | 0 (0.0%) | 8 (6.4%) |
| 10:00 AM to 10:59 AM | 12 (13.2%) | 14 (11.1%) |
| 11:00 AM to 11:59 AM | 2 (2.2%) | 0 (0.0%) |
| 12:00 PM to 3:59 PM | 2 (2.2%) | 3 (2.4%) |
| 4:00 PM to 11:59 PM | 0 (0.0%) | 0 (0.0%) |
| Total | 91 (100.0%) | 126 (100.0%) |
Housing Occupancy in Bayfield
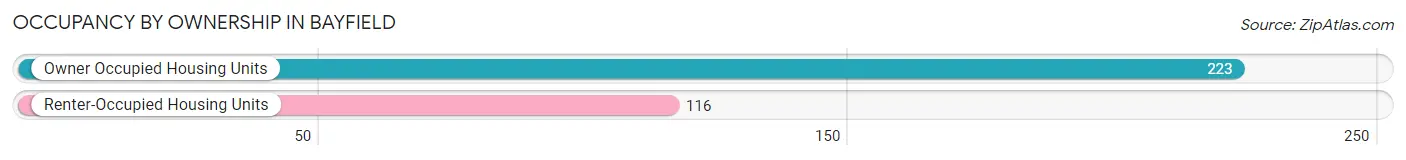
Occupancy by Ownership in Bayfield
Of the total 339 dwellings in Bayfield, owner-occupied units account for 223 (65.8%), while renter-occupied units make up 116 (34.2%).
| Occupancy | # Housing Units | % Housing Units |
| Owner Occupied Housing Units | 223 | 65.8% |
| Renter-Occupied Housing Units | 116 | 34.2% |
| Total Occupied Housing Units | 339 | 100.0% |
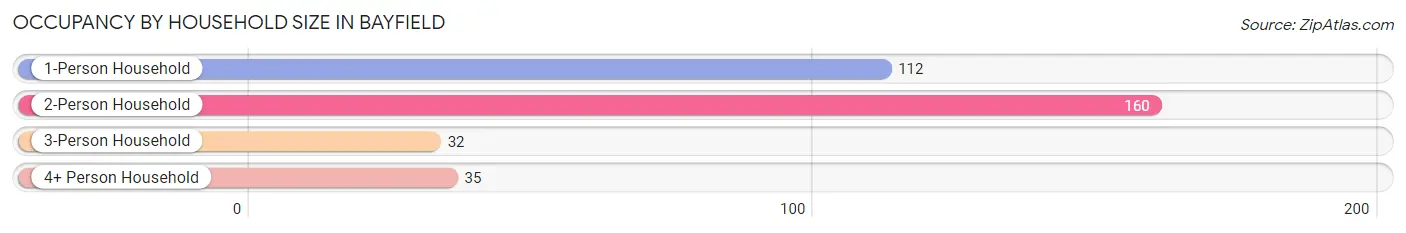
Occupancy by Household Size in Bayfield
| Household Size | # Housing Units | % Housing Units |
| 1-Person Household | 112 | 33.0% |
| 2-Person Household | 160 | 47.2% |
| 3-Person Household | 32 | 9.4% |
| 4+ Person Household | 35 | 10.3% |
| Total Housing Units | 339 | 100.0% |
Occupancy by Ownership by Household Size in Bayfield
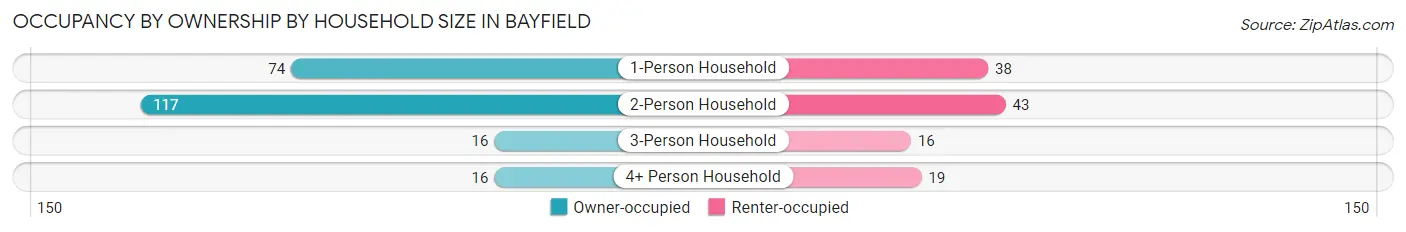
| Household Size | Owner-occupied | Renter-occupied |
| 1-Person Household | 74 (66.1%) | 38 (33.9%) |
| 2-Person Household | 117 (73.1%) | 43 (26.9%) |
| 3-Person Household | 16 (50.0%) | 16 (50.0%) |
| 4+ Person Household | 16 (45.7%) | 19 (54.3%) |
| Total Housing Units | 223 (65.8%) | 116 (34.2%) |
Occupancy by Educational Attainment in Bayfield
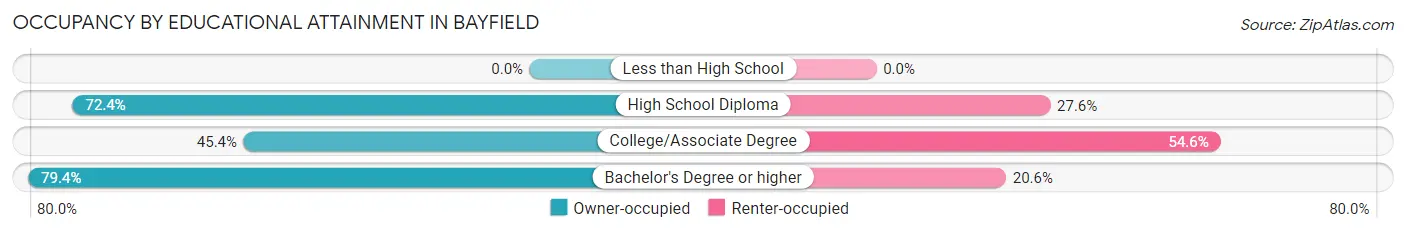
| Household Size | Owner-occupied | Renter-occupied |
| Less than High School | 0 (0.0%) | 0 (0.0%) |
| High School Diploma | 21 (72.4%) | 8 (27.6%) |
| College/Associate Degree | 59 (45.4%) | 71 (54.6%) |
| Bachelor's Degree or higher | 143 (79.4%) | 37 (20.6%) |
Occupancy by Age of Householder in Bayfield
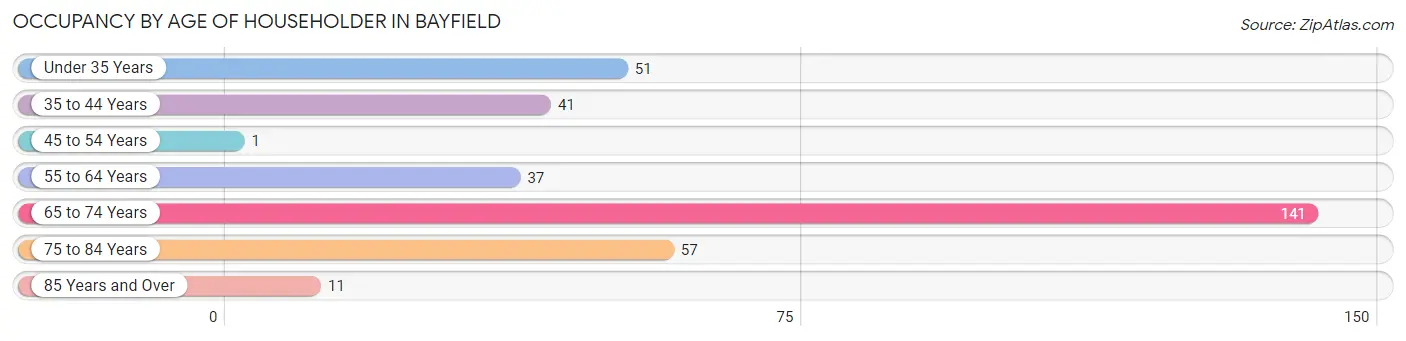
| Age Bracket | # Households | % Households |
| Under 35 Years | 51 | 15.0% |
| 35 to 44 Years | 41 | 12.1% |
| 45 to 54 Years | 1 | 0.3% |
| 55 to 64 Years | 37 | 10.9% |
| 65 to 74 Years | 141 | 41.6% |
| 75 to 84 Years | 57 | 16.8% |
| 85 Years and Over | 11 | 3.2% |
| Total | 339 | 100.0% |
Housing Finances in Bayfield
Median Income by Occupancy in Bayfield
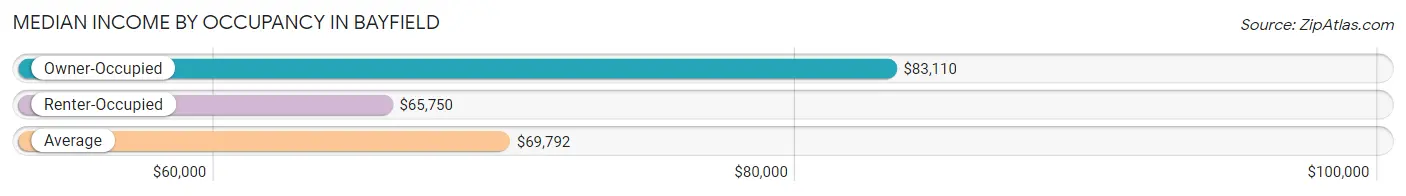
| Occupancy Type | # Households | Median Income |
| Owner-Occupied | 223 (65.8%) | $83,110 |
| Renter-Occupied | 116 (34.2%) | $65,750 |
| Average | 339 (100.0%) | $69,792 |
Occupancy by Householder Income Bracket in Bayfield
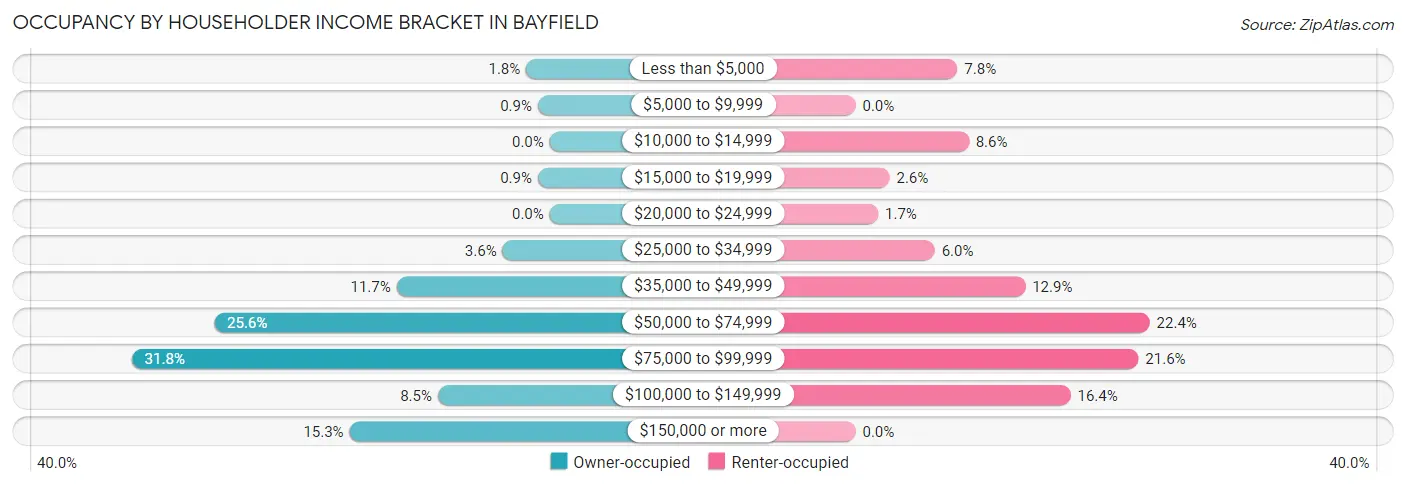
| Income Bracket | Owner-occupied | Renter-occupied |
| Less than $5,000 | 4 (1.8%) | 9 (7.8%) |
| $5,000 to $9,999 | 2 (0.9%) | 0 (0.0%) |
| $10,000 to $14,999 | 0 (0.0%) | 10 (8.6%) |
| $15,000 to $19,999 | 2 (0.9%) | 3 (2.6%) |
| $20,000 to $24,999 | 0 (0.0%) | 2 (1.7%) |
| $25,000 to $34,999 | 8 (3.6%) | 7 (6.0%) |
| $35,000 to $49,999 | 26 (11.7%) | 15 (12.9%) |
| $50,000 to $74,999 | 57 (25.6%) | 26 (22.4%) |
| $75,000 to $99,999 | 71 (31.8%) | 25 (21.5%) |
| $100,000 to $149,999 | 19 (8.5%) | 19 (16.4%) |
| $150,000 or more | 34 (15.2%) | 0 (0.0%) |
| Total | 223 (100.0%) | 116 (100.0%) |
Monthly Housing Cost Tiers in Bayfield
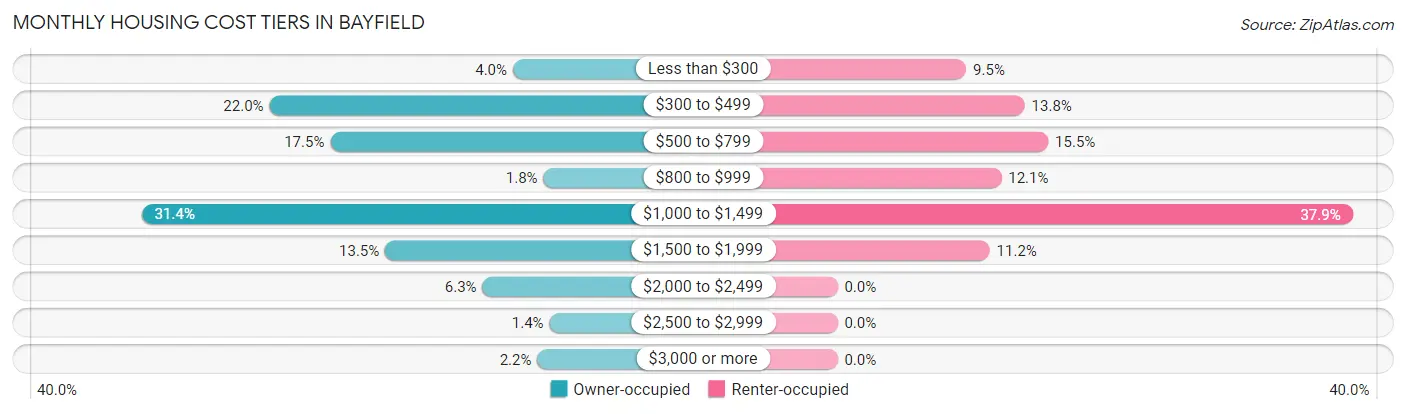
| Monthly Cost | Owner-occupied | Renter-occupied |
| Less than $300 | 9 (4.0%) | 11 (9.5%) |
| $300 to $499 | 49 (22.0%) | 16 (13.8%) |
| $500 to $799 | 39 (17.5%) | 18 (15.5%) |
| $800 to $999 | 4 (1.8%) | 14 (12.1%) |
| $1,000 to $1,499 | 70 (31.4%) | 44 (37.9%) |
| $1,500 to $1,999 | 30 (13.5%) | 13 (11.2%) |
| $2,000 to $2,499 | 14 (6.3%) | 0 (0.0%) |
| $2,500 to $2,999 | 3 (1.3%) | 0 (0.0%) |
| $3,000 or more | 5 (2.2%) | 0 (0.0%) |
| Total | 223 (100.0%) | 116 (100.0%) |
Physical Housing Characteristics in Bayfield
Housing Structures in Bayfield
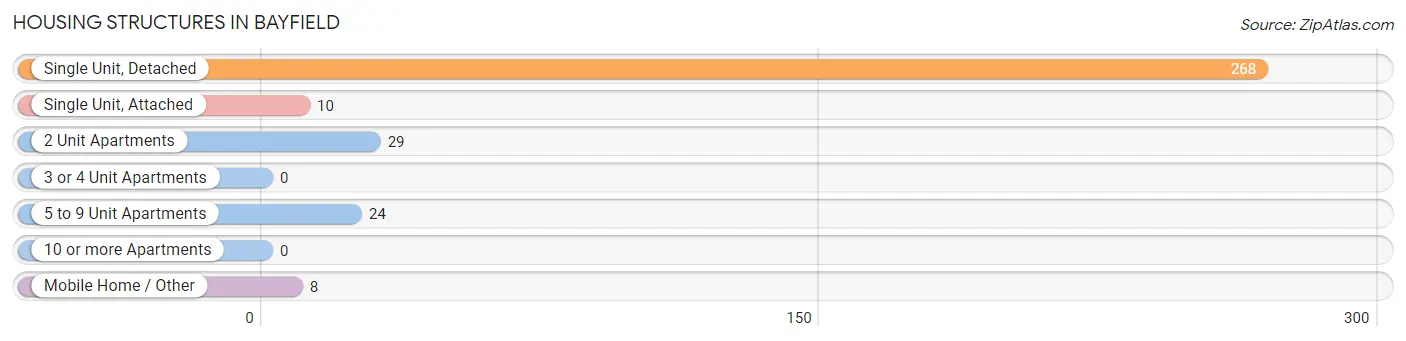
| Structure Type | # Housing Units | % Housing Units |
| Single Unit, Detached | 268 | 79.1% |
| Single Unit, Attached | 10 | 2.9% |
| 2 Unit Apartments | 29 | 8.6% |
| 3 or 4 Unit Apartments | 0 | 0.0% |
| 5 to 9 Unit Apartments | 24 | 7.1% |
| 10 or more Apartments | 0 | 0.0% |
| Mobile Home / Other | 8 | 2.4% |
| Total | 339 | 100.0% |
Housing Structures by Occupancy in Bayfield
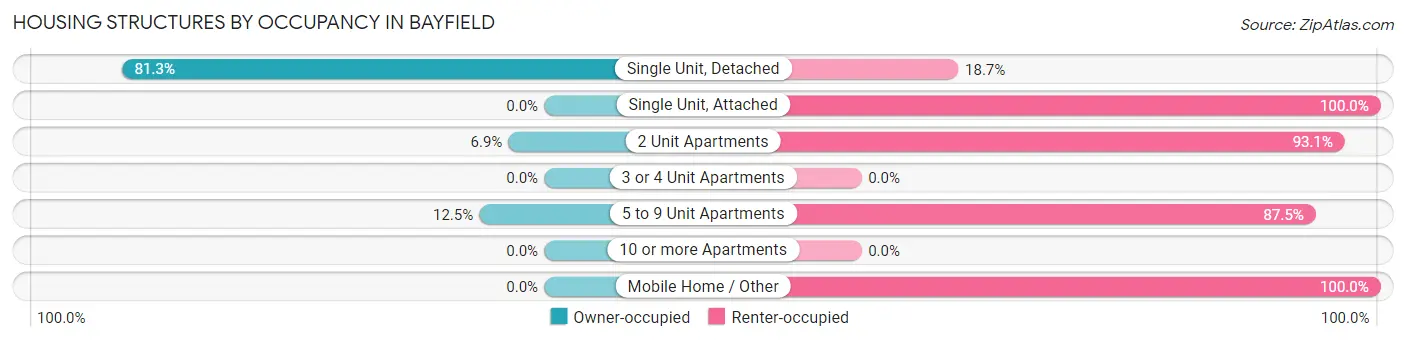
| Structure Type | Owner-occupied | Renter-occupied |
| Single Unit, Detached | 218 (81.3%) | 50 (18.7%) |
| Single Unit, Attached | 0 (0.0%) | 10 (100.0%) |
| 2 Unit Apartments | 2 (6.9%) | 27 (93.1%) |
| 3 or 4 Unit Apartments | 0 (0.0%) | 0 (0.0%) |
| 5 to 9 Unit Apartments | 3 (12.5%) | 21 (87.5%) |
| 10 or more Apartments | 0 (0.0%) | 0 (0.0%) |
| Mobile Home / Other | 0 (0.0%) | 8 (100.0%) |
| Total | 223 (65.8%) | 116 (34.2%) |
Housing Structures by Number of Rooms in Bayfield
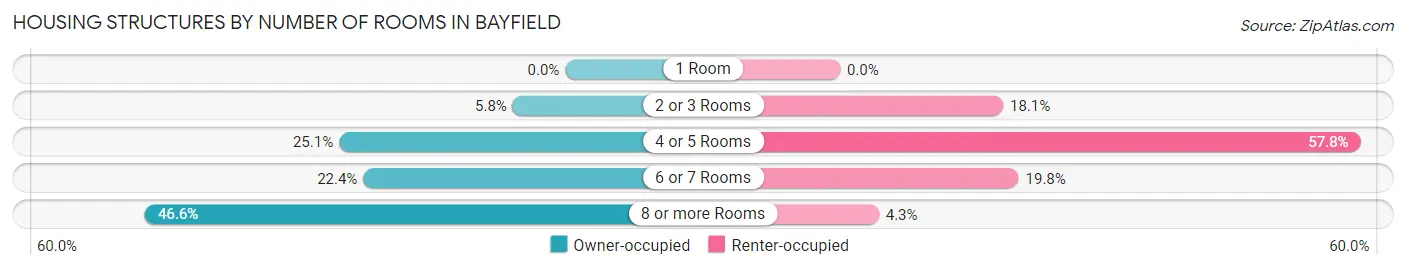
| Number of Rooms | Owner-occupied | Renter-occupied |
| 1 Room | 0 (0.0%) | 0 (0.0%) |
| 2 or 3 Rooms | 13 (5.8%) | 21 (18.1%) |
| 4 or 5 Rooms | 56 (25.1%) | 67 (57.8%) |
| 6 or 7 Rooms | 50 (22.4%) | 23 (19.8%) |
| 8 or more Rooms | 104 (46.6%) | 5 (4.3%) |
| Total | 223 (100.0%) | 116 (100.0%) |
Housing Structure by Heating Type in Bayfield
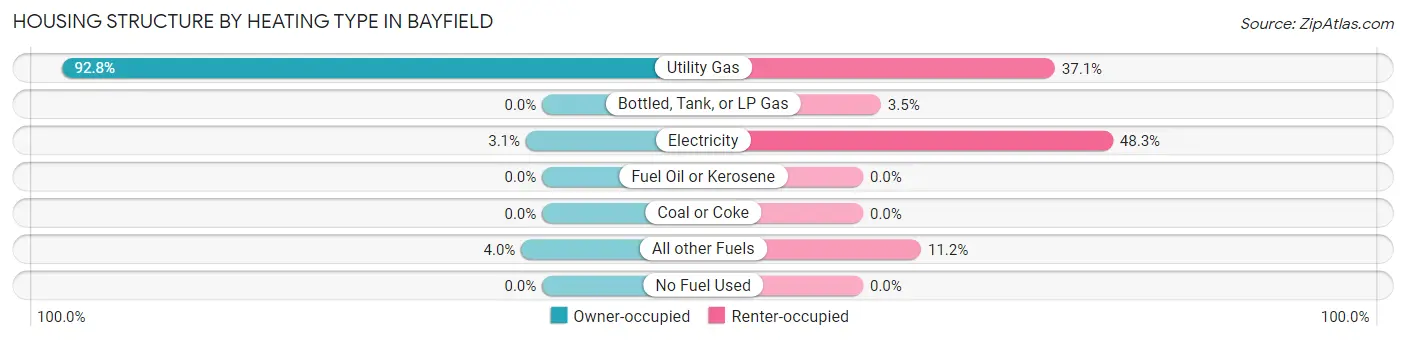
| Heating Type | Owner-occupied | Renter-occupied |
| Utility Gas | 207 (92.8%) | 43 (37.1%) |
| Bottled, Tank, or LP Gas | 0 (0.0%) | 4 (3.5%) |
| Electricity | 7 (3.1%) | 56 (48.3%) |
| Fuel Oil or Kerosene | 0 (0.0%) | 0 (0.0%) |
| Coal or Coke | 0 (0.0%) | 0 (0.0%) |
| All other Fuels | 9 (4.0%) | 13 (11.2%) |
| No Fuel Used | 0 (0.0%) | 0 (0.0%) |
| Total | 223 (100.0%) | 116 (100.0%) |
Household Vehicle Usage in Bayfield
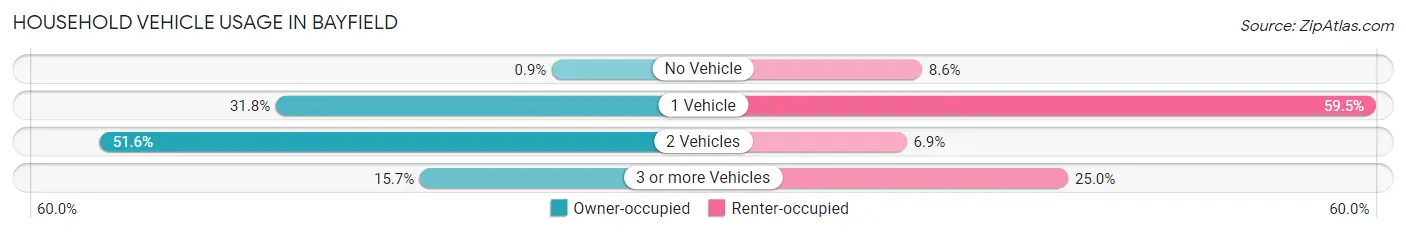
| Vehicles per Household | Owner-occupied | Renter-occupied |
| No Vehicle | 2 (0.9%) | 10 (8.6%) |
| 1 Vehicle | 71 (31.8%) | 69 (59.5%) |
| 2 Vehicles | 115 (51.6%) | 8 (6.9%) |
| 3 or more Vehicles | 35 (15.7%) | 29 (25.0%) |
| Total | 223 (100.0%) | 116 (100.0%) |
Real Estate & Mortgages in Bayfield
Real Estate and Mortgage Overview in Bayfield
| Characteristic | Without Mortgage | With Mortgage |
| Housing Units | 155 | 68 |
| Median Property Value | $282,300 | $260,700 |
| Median Household Income | $82,774 | $24 |
| Monthly Housing Costs | $598 | $5 |
| Real Estate Taxes | $3,903 | $3 |
Property Value by Mortgage Status in Bayfield
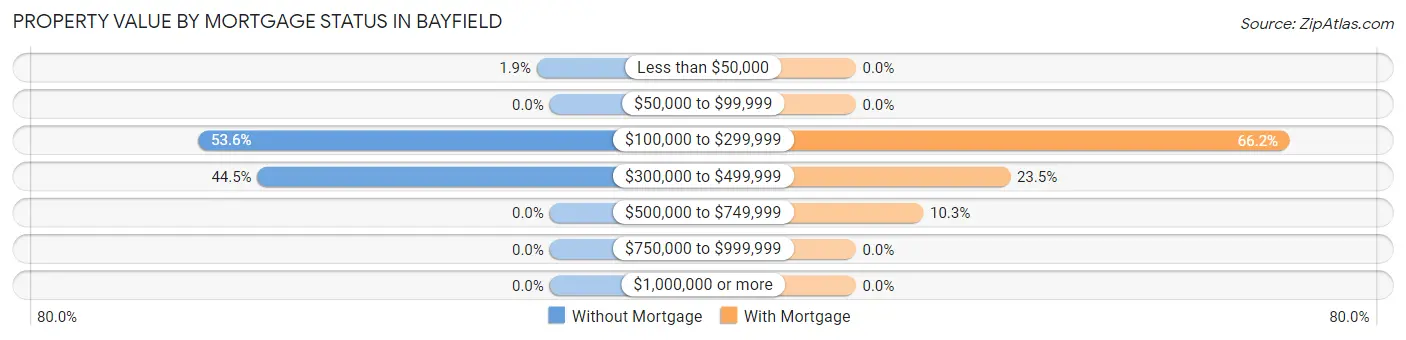
| Property Value | Without Mortgage | With Mortgage |
| Less than $50,000 | 3 (1.9%) | 0 (0.0%) |
| $50,000 to $99,999 | 0 (0.0%) | 0 (0.0%) |
| $100,000 to $299,999 | 83 (53.5%) | 45 (66.2%) |
| $300,000 to $499,999 | 69 (44.5%) | 16 (23.5%) |
| $500,000 to $749,999 | 0 (0.0%) | 7 (10.3%) |
| $750,000 to $999,999 | 0 (0.0%) | 0 (0.0%) |
| $1,000,000 or more | 0 (0.0%) | 0 (0.0%) |
| Total | 155 (100.0%) | 68 (100.0%) |
Household Income by Mortgage Status in Bayfield
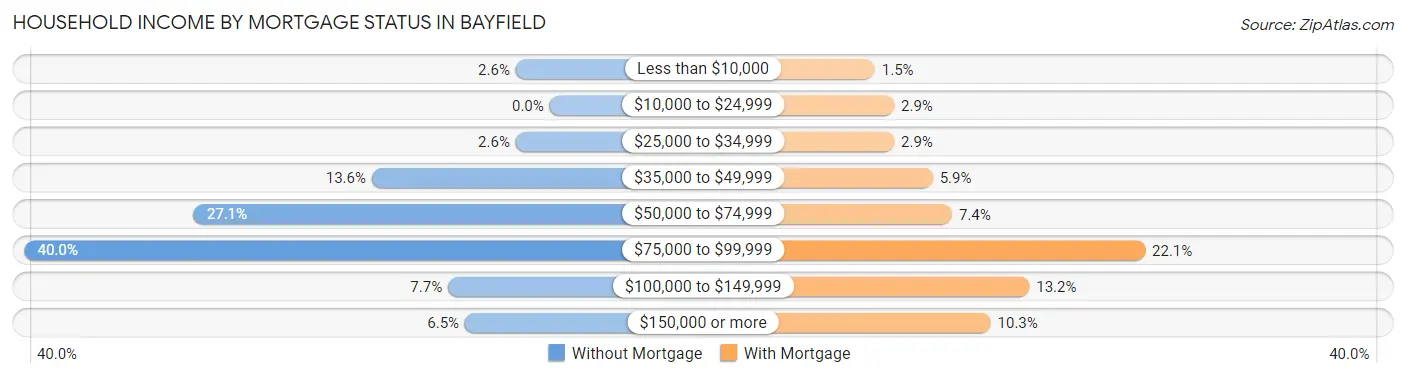
| Household Income | Without Mortgage | With Mortgage |
| Less than $10,000 | 4 (2.6%) | 1 (1.5%) |
| $10,000 to $24,999 | 0 (0.0%) | 2 (2.9%) |
| $25,000 to $34,999 | 4 (2.6%) | 2 (2.9%) |
| $35,000 to $49,999 | 21 (13.6%) | 4 (5.9%) |
| $50,000 to $74,999 | 42 (27.1%) | 5 (7.3%) |
| $75,000 to $99,999 | 62 (40.0%) | 15 (22.1%) |
| $100,000 to $149,999 | 12 (7.7%) | 9 (13.2%) |
| $150,000 or more | 10 (6.5%) | 7 (10.3%) |
| Total | 155 (100.0%) | 68 (100.0%) |
Property Value to Household Income Ratio in Bayfield
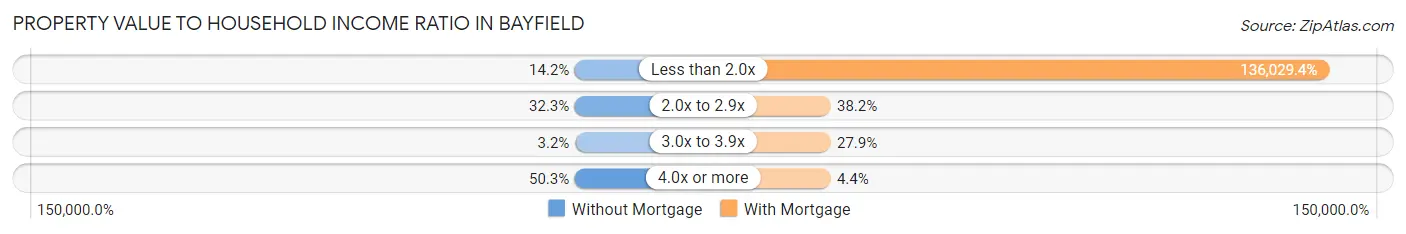
| Value-to-Income Ratio | Without Mortgage | With Mortgage |
| Less than 2.0x | 22 (14.2%) | 92,500 (136,029.4%) |
| 2.0x to 2.9x | 50 (32.3%) | 26 (38.2%) |
| 3.0x to 3.9x | 5 (3.2%) | 19 (27.9%) |
| 4.0x or more | 78 (50.3%) | 3 (4.4%) |
| Total | 155 (100.0%) | 68 (100.0%) |
Real Estate Taxes by Mortgage Status in Bayfield

| Property Taxes | Without Mortgage | With Mortgage |
| Less than $800 | 1 (0.6%) | 0 (0.0%) |
| $800 to $1,499 | 8 (5.2%) | 0 (0.0%) |
| $800 to $1,499 | 146 (94.2%) | 0 (0.0%) |
| Total | 155 (100.0%) | 68 (100.0%) |
Health & Disability in Bayfield
Health Insurance Coverage by Age in Bayfield
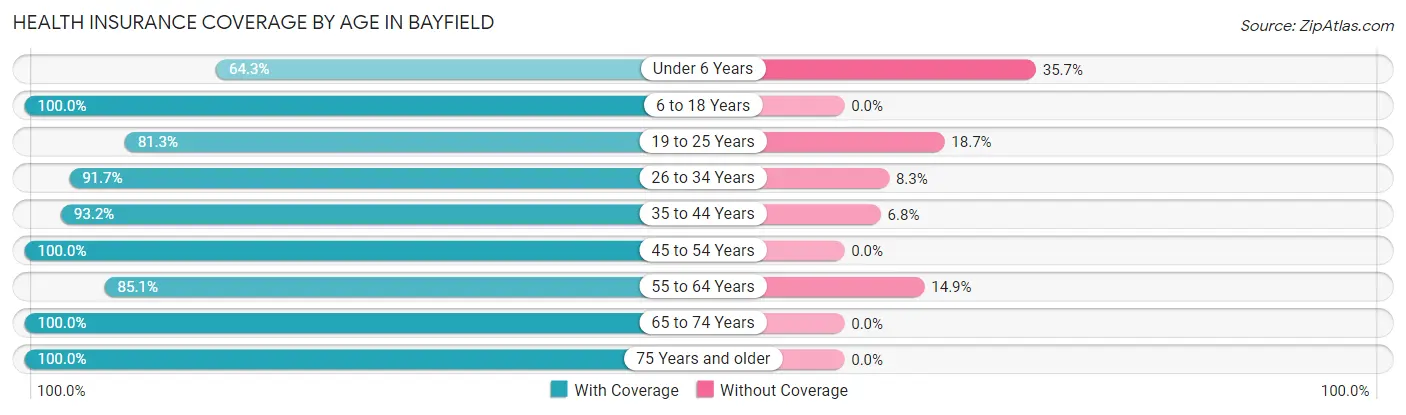
| Age Bracket | With Coverage | Without Coverage |
| Under 6 Years | 9 (64.3%) | 5 (35.7%) |
| 6 to 18 Years | 47 (100.0%) | 0 (0.0%) |
| 19 to 25 Years | 61 (81.3%) | 14 (18.7%) |
| 26 to 34 Years | 44 (91.7%) | 4 (8.3%) |
| 35 to 44 Years | 55 (93.2%) | 4 (6.8%) |
| 45 to 54 Years | 6 (100.0%) | 0 (0.0%) |
| 55 to 64 Years | 57 (85.1%) | 10 (14.9%) |
| 65 to 74 Years | 204 (100.0%) | 0 (0.0%) |
| 75 Years and older | 91 (100.0%) | 0 (0.0%) |
| Total | 574 (93.9%) | 37 (6.1%) |
Health Insurance Coverage by Citizenship Status in Bayfield
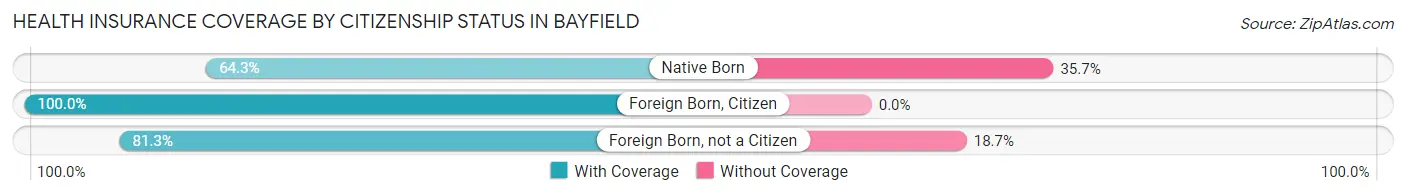
| Citizenship Status | With Coverage | Without Coverage |
| Native Born | 9 (64.3%) | 5 (35.7%) |
| Foreign Born, Citizen | 47 (100.0%) | 0 (0.0%) |
| Foreign Born, not a Citizen | 61 (81.3%) | 14 (18.7%) |
Health Insurance Coverage by Household Income in Bayfield
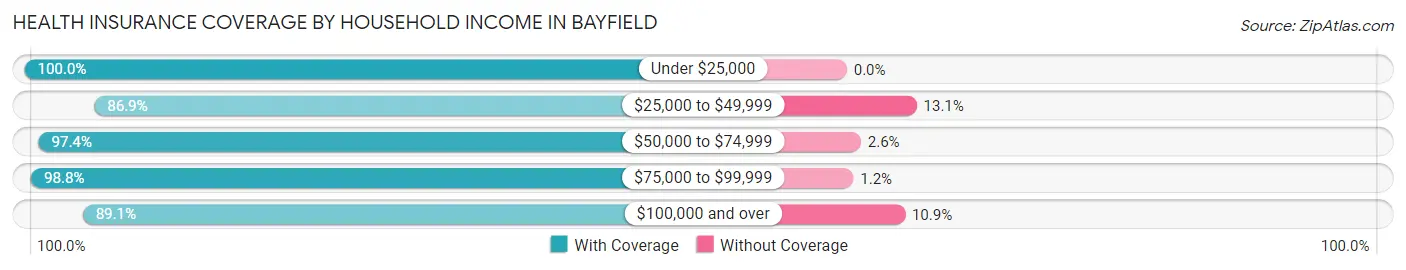
| Household Income | With Coverage | Without Coverage |
| Under $25,000 | 34 (100.0%) | 0 (0.0%) |
| $25,000 to $49,999 | 93 (86.9%) | 14 (13.1%) |
| $50,000 to $74,999 | 148 (97.4%) | 4 (2.6%) |
| $75,000 to $99,999 | 160 (98.8%) | 2 (1.2%) |
| $100,000 and over | 139 (89.1%) | 17 (10.9%) |
Public vs Private Health Insurance Coverage by Age in Bayfield
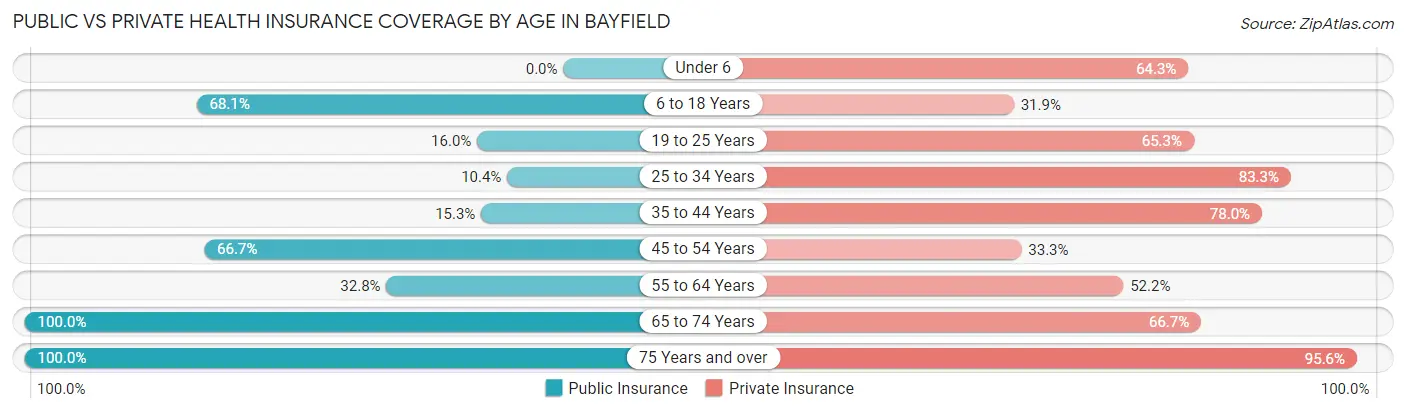
| Age Bracket | Public Insurance | Private Insurance |
| Under 6 | 0 (0.0%) | 9 (64.3%) |
| 6 to 18 Years | 32 (68.1%) | 15 (31.9%) |
| 19 to 25 Years | 12 (16.0%) | 49 (65.3%) |
| 25 to 34 Years | 5 (10.4%) | 40 (83.3%) |
| 35 to 44 Years | 9 (15.2%) | 46 (78.0%) |
| 45 to 54 Years | 4 (66.7%) | 2 (33.3%) |
| 55 to 64 Years | 22 (32.8%) | 35 (52.2%) |
| 65 to 74 Years | 204 (100.0%) | 136 (66.7%) |
| 75 Years and over | 91 (100.0%) | 87 (95.6%) |
| Total | 379 (62.0%) | 419 (68.6%) |
Disability Status by Sex by Age in Bayfield
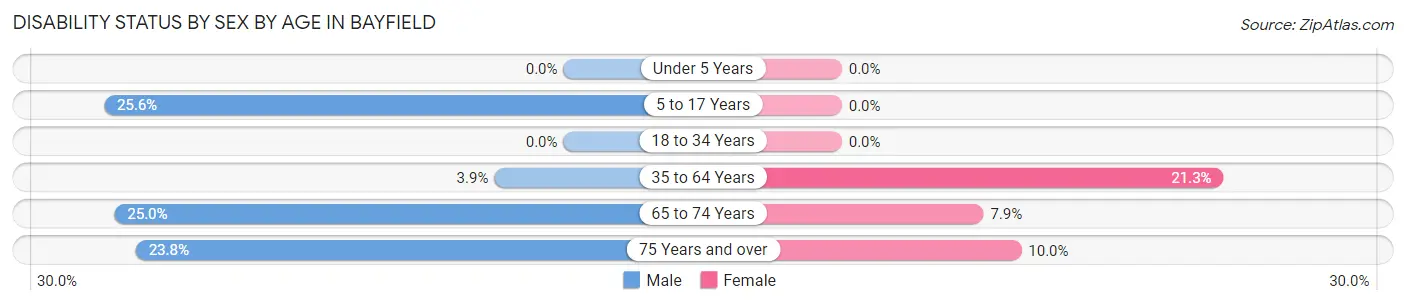
| Age Bracket | Male | Female |
| Under 5 Years | 0 (0.0%) | 0 (0.0%) |
| 5 to 17 Years | 11 (25.6%) | 0 (0.0%) |
| 18 to 34 Years | 0 (0.0%) | 0 (0.0%) |
| 35 to 64 Years | 2 (3.8%) | 17 (21.2%) |
| 65 to 74 Years | 32 (25.0%) | 6 (7.9%) |
| 75 Years and over | 5 (23.8%) | 7 (10.0%) |
Disability Class by Sex by Age in Bayfield
Disability Class: Hearing Difficulty
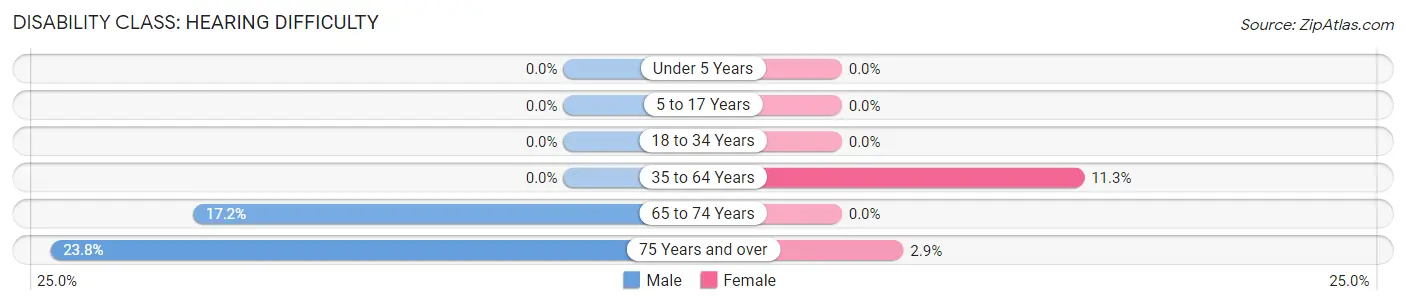
| Age Bracket | Male | Female |
| Under 5 Years | 0 (0.0%) | 0 (0.0%) |
| 5 to 17 Years | 0 (0.0%) | 0 (0.0%) |
| 18 to 34 Years | 0 (0.0%) | 0 (0.0%) |
| 35 to 64 Years | 0 (0.0%) | 9 (11.3%) |
| 65 to 74 Years | 22 (17.2%) | 0 (0.0%) |
| 75 Years and over | 5 (23.8%) | 2 (2.9%) |
Disability Class: Vision Difficulty
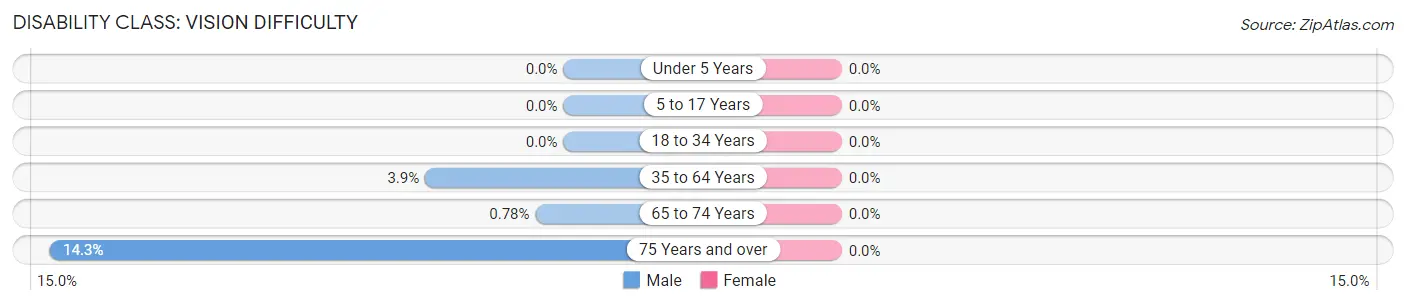
| Age Bracket | Male | Female |
| Under 5 Years | 0 (0.0%) | 0 (0.0%) |
| 5 to 17 Years | 0 (0.0%) | 0 (0.0%) |
| 18 to 34 Years | 0 (0.0%) | 0 (0.0%) |
| 35 to 64 Years | 2 (3.8%) | 0 (0.0%) |
| 65 to 74 Years | 1 (0.8%) | 0 (0.0%) |
| 75 Years and over | 3 (14.3%) | 0 (0.0%) |
Disability Class: Cognitive Difficulty
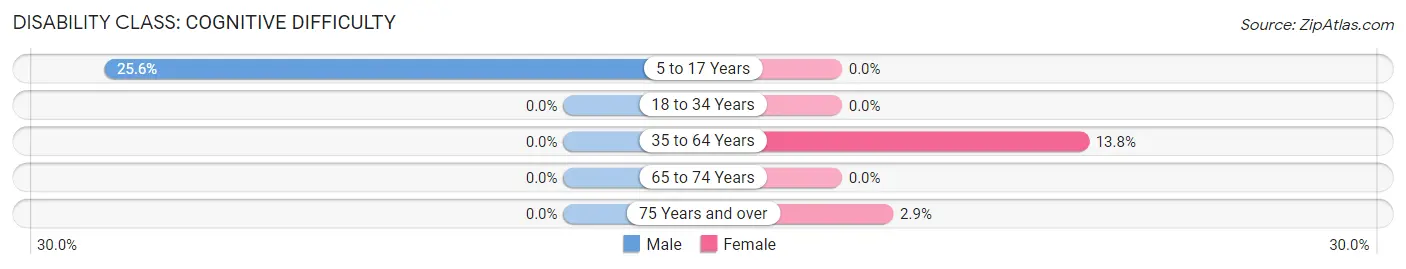
| Age Bracket | Male | Female |
| 5 to 17 Years | 11 (25.6%) | 0 (0.0%) |
| 18 to 34 Years | 0 (0.0%) | 0 (0.0%) |
| 35 to 64 Years | 0 (0.0%) | 11 (13.8%) |
| 65 to 74 Years | 0 (0.0%) | 0 (0.0%) |
| 75 Years and over | 0 (0.0%) | 2 (2.9%) |
Disability Class: Ambulatory Difficulty
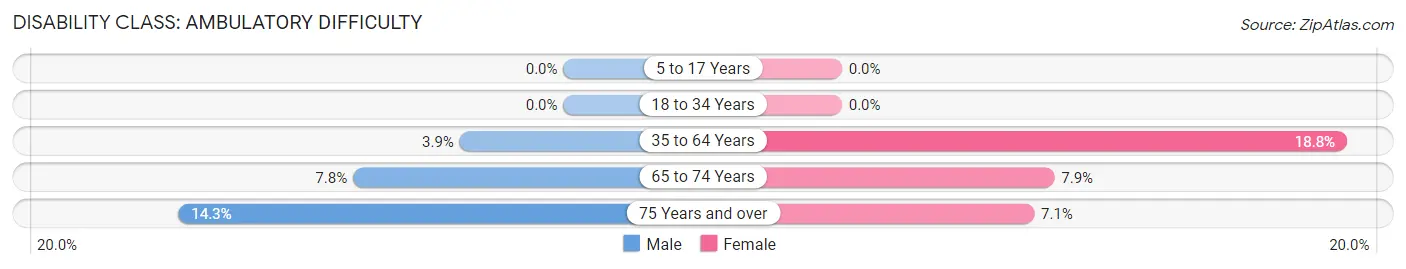
| Age Bracket | Male | Female |
| 5 to 17 Years | 0 (0.0%) | 0 (0.0%) |
| 18 to 34 Years | 0 (0.0%) | 0 (0.0%) |
| 35 to 64 Years | 2 (3.8%) | 15 (18.8%) |
| 65 to 74 Years | 10 (7.8%) | 6 (7.9%) |
| 75 Years and over | 3 (14.3%) | 5 (7.1%) |
Disability Class: Self-Care Difficulty
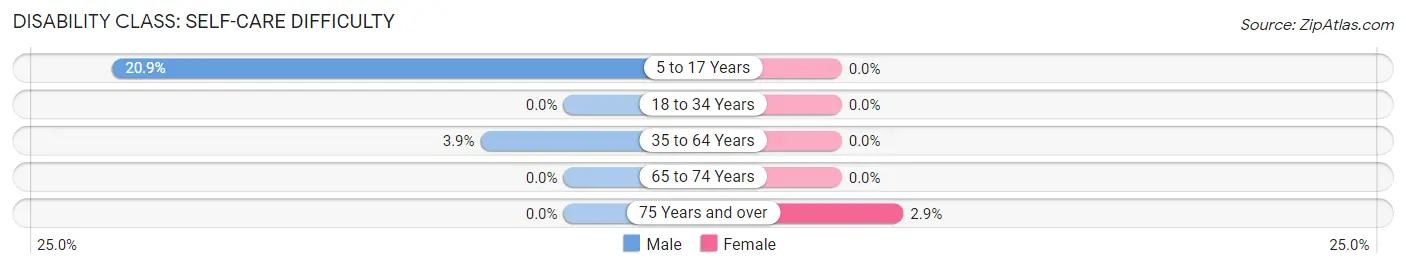
| Age Bracket | Male | Female |
| 5 to 17 Years | 9 (20.9%) | 0 (0.0%) |
| 18 to 34 Years | 0 (0.0%) | 0 (0.0%) |
| 35 to 64 Years | 2 (3.8%) | 0 (0.0%) |
| 65 to 74 Years | 0 (0.0%) | 0 (0.0%) |
| 75 Years and over | 0 (0.0%) | 2 (2.9%) |
Technology Access in Bayfield
Computing Device Access in Bayfield
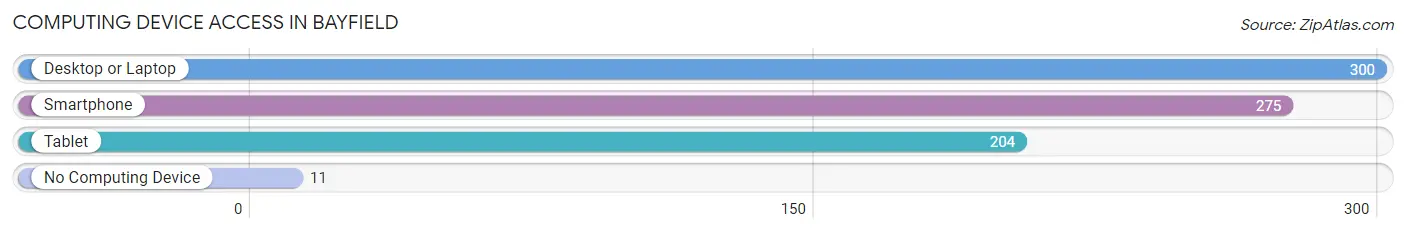
| Device Type | # Households | % Households |
| Desktop or Laptop | 300 | 88.5% |
| Smartphone | 275 | 81.1% |
| Tablet | 204 | 60.2% |
| No Computing Device | 11 | 3.2% |
| Total | 339 | 100.0% |
Internet Access in Bayfield
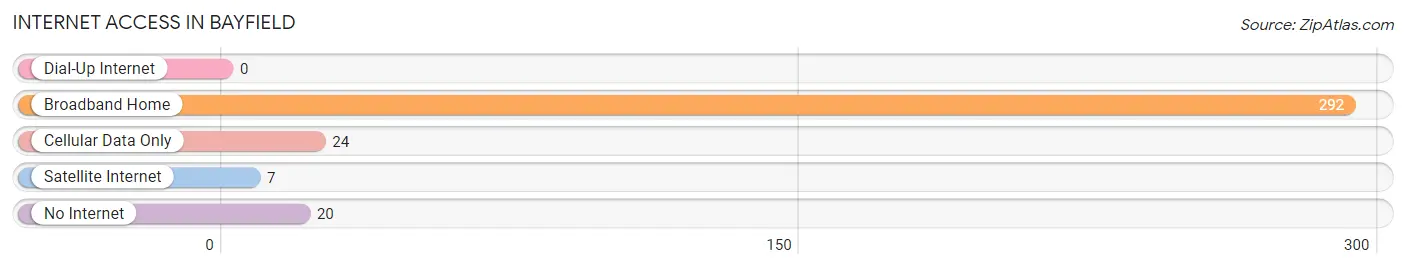
| Internet Type | # Households | % Households |
| Dial-Up Internet | 0 | 0.0% |
| Broadband Home | 292 | 86.1% |
| Cellular Data Only | 24 | 7.1% |
| Satellite Internet | 7 | 2.1% |
| No Internet | 20 | 5.9% |
| Total | 339 | 100.0% |
Bayfield Summary
Bayfield, Wisconsin is a small city located in Bayfield County in the northwestern part of the state. It is situated on the shore of Lake Superior, the largest of the Great Lakes. The city is known for its picturesque harbor, its historic downtown, and its proximity to the Apostle Islands National Lakeshore.
History
The area that is now Bayfield was first inhabited by the Ojibwe people, who called the area “Chequamegon”, meaning “place of the beaver”. The first European settlers arrived in the area in the early 1800s, and the town was officially founded in 1856. The city was named after Henry Bayfield, a British surveyor who mapped the area in the 1840s.
In the late 1800s, Bayfield became a popular tourist destination, with visitors coming to enjoy the scenery and the fishing. The city was also home to a thriving lumber industry, with several sawmills located in the area.
Geography
Bayfield is located in the northwest corner of Wisconsin, on the shore of Lake Superior. The city is situated at the mouth of the Chequamegon Bay, which is part of the Apostle Islands National Lakeshore. The city is surrounded by forests and lakes, and is known for its picturesque harbor.
The city has a total area of 4.2 square miles, of which 0.2 square miles is water. The city is located at an elevation of 602 feet above sea level.
Economy
The economy of Bayfield is largely based on tourism. The city is a popular destination for visitors who come to enjoy the scenery, the fishing, and the historic downtown. The city is also home to several businesses, including restaurants, shops, and lodging.
The city is also home to a thriving fishing industry, with several commercial fishing operations located in the area. The city is also home to several marinas, which provide services to recreational boaters.
Demographics
As of the 2010 census, the population of Bayfield was 517. The racial makeup of the city was 97.3% White, 0.4% African American, 0.4% Native American, 0.4% Asian, 0.2% from other races, and 1.3% from two or more races. Hispanic or Latino of any race were 1.2% of the population.
The median household income in Bayfield was $41,250, and the median family income was $50,000. The per capita income for the city was $20,945. About 11.2% of families and 14.2% of the population were below the poverty line, including 18.2% of those under age 18 and 8.3% of those age 65 or over.
Bayfield is a small city with a rich history and a vibrant economy. The city is known for its picturesque harbor, its historic downtown, and its proximity to the Apostle Islands National Lakeshore. The city is home to a diverse population, and is a popular destination for visitors who come to enjoy the scenery and the fishing.
Common Questions
What is Per Capita Income in Bayfield?
Per Capita income in Bayfield is $39,704.
What is the Median Family Income in Bayfield?
Median Family Income in Bayfield is $83,598.
What is the Median Household income in Bayfield?
Median Household Income in Bayfield is $69,792.
What is Income or Wage Gap in Bayfield?
Income or Wage Gap in Bayfield is 59.6%.
Women in Bayfield earn 40.4 cents for every dollar earned by a man.
What is Inequality or Gini Index in Bayfield?
Inequality or Gini Index in Bayfield is 0.34.
What is the Total Population of Bayfield?
Total Population of Bayfield is 617.
What is the Total Male Population of Bayfield?
Total Male Population of Bayfield is 311.
What is the Total Female Population of Bayfield?
Total Female Population of Bayfield is 306.
What is the Ratio of Males per 100 Females in Bayfield?
There are 101.63 Males per 100 Females in Bayfield.
What is the Ratio of Females per 100 Males in Bayfield?
There are 98.39 Females per 100 Males in Bayfield.
What is the Median Population Age in Bayfield?
Median Population Age in Bayfield is 63.4 Years.
What is the Average Family Size in Bayfield
Average Family Size in Bayfield is 2.2 People.
What is the Average Household Size in Bayfield
Average Household Size in Bayfield is 1.8 People.
How Large is the Labor Force in Bayfield?
There are 273 People in the Labor Forcein in Bayfield.
What is the Percentage of People in the Labor Force in Bayfield?
48.4% of People are in the Labor Force in Bayfield.
What is the Unemployment Rate in Bayfield?
Unemployment Rate in Bayfield is 3.0%.