Iron Belt, WI Map & Demographics
Iron Belt Map
Iron Belt Overview
$32,829
PER CAPITA INCOME
$54,792
AVG FAMILY INCOME
$55,625
AVG HOUSEHOLD INCOME
0.39
INEQUALITY / GINI INDEX
174
TOTAL POPULATION
97
MALE POPULATION
77
FEMALE POPULATION
125.97
MALES / 100 FEMALES
79.38
FEMALES / 100 MALES
47.5
MEDIAN AGE
3.3
AVG FAMILY SIZE
2.2
AVG HOUSEHOLD SIZE
76
LABOR FORCE [ PEOPLE ]
52.1%
PERCENT IN LABOR FORCE
2.6%
UNEMPLOYMENT RATE
Iron Belt Zip Codes
Iron Belt Area Codes
Income in Iron Belt
Income Overview in Iron Belt
Per Capita Income in Iron Belt is $32,829, while median incomes of families and households are $54,792 and $55,625 respectively.
| Characteristic | Number | Measure |
| Per Capita Income | 174 | $32,829 |
| Median Family Income | 41 | $54,792 |
| Mean Family Income | 41 | $79,815 |
| Median Household Income | 78 | $55,625 |
| Mean Household Income | 78 | $67,577 |
| Income Deficit | 41 | $0 |
| Wage / Income Gap (%) | 174 | 0.00% |
| Wage / Income Gap ($) | 174 | 100.00¢ per $1 |
| Gini / Inequality Index | 174 | 0.39 |
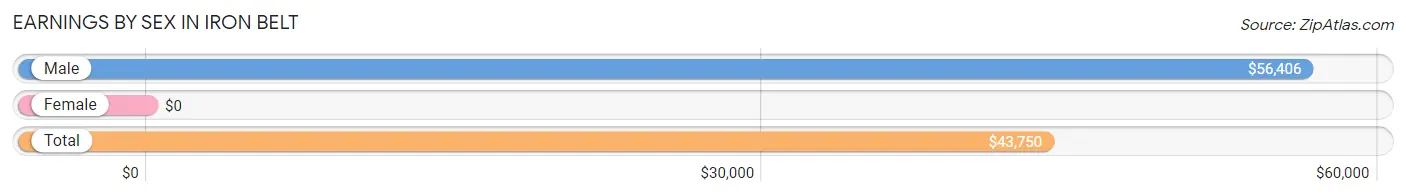
Earnings by Sex in Iron Belt
| Sex | Number | Average Earnings |
| Male | 48 (61.5%) | $56,406 |
| Female | 30 (38.5%) | $0 |
| Total | 78 (100.0%) | $43,750 |
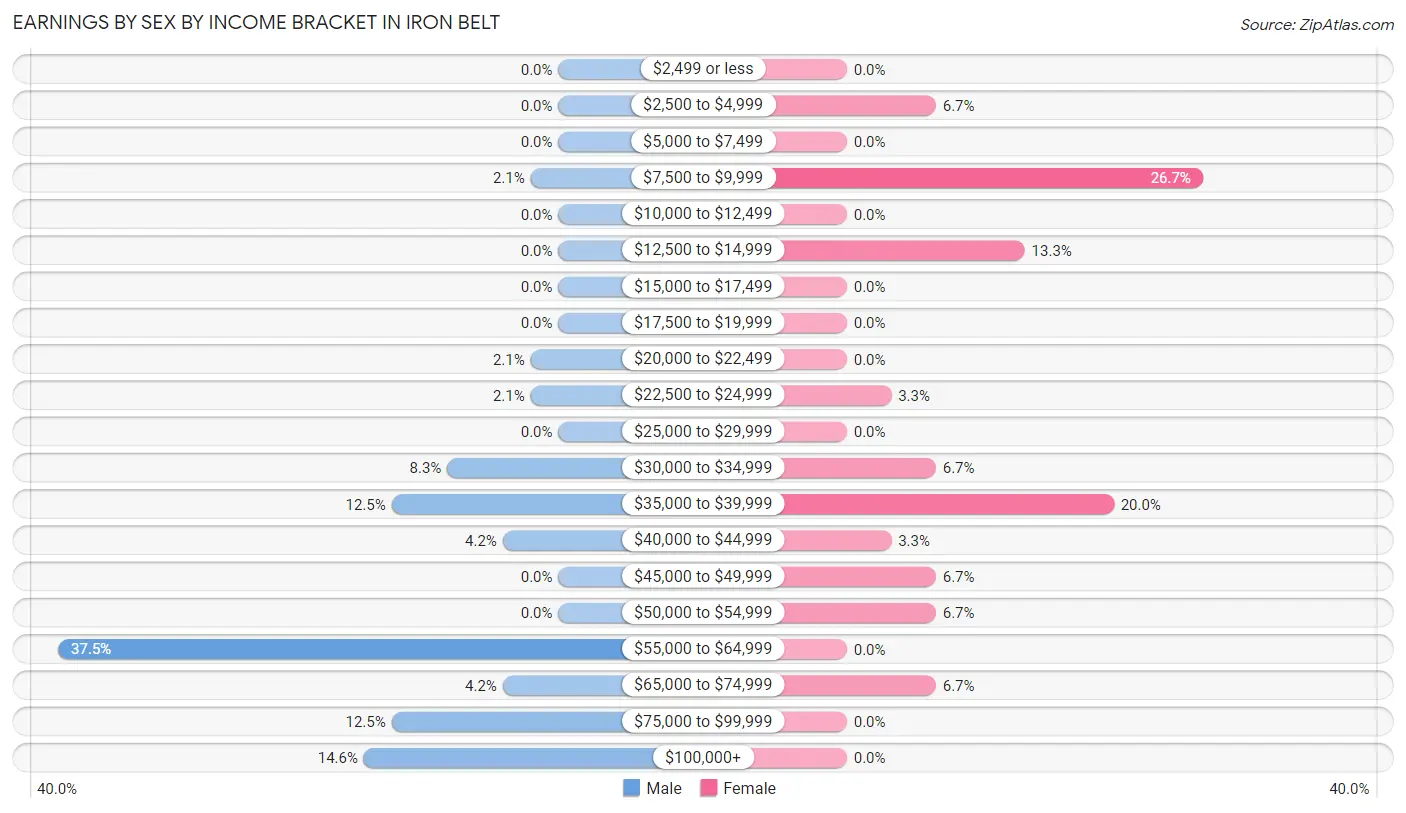
Earnings by Sex by Income Bracket in Iron Belt
The most common earnings brackets in Iron Belt are $55,000 to $64,999 for men (18 | 37.5%) and $7,500 to $9,999 for women (8 | 26.7%).
| Income | Male | Female |
| $2,499 or less | 0 (0.0%) | 0 (0.0%) |
| $2,500 to $4,999 | 0 (0.0%) | 2 (6.7%) |
| $5,000 to $7,499 | 0 (0.0%) | 0 (0.0%) |
| $7,500 to $9,999 | 1 (2.1%) | 8 (26.7%) |
| $10,000 to $12,499 | 0 (0.0%) | 0 (0.0%) |
| $12,500 to $14,999 | 0 (0.0%) | 4 (13.3%) |
| $15,000 to $17,499 | 0 (0.0%) | 0 (0.0%) |
| $17,500 to $19,999 | 0 (0.0%) | 0 (0.0%) |
| $20,000 to $22,499 | 1 (2.1%) | 0 (0.0%) |
| $22,500 to $24,999 | 1 (2.1%) | 1 (3.3%) |
| $25,000 to $29,999 | 0 (0.0%) | 0 (0.0%) |
| $30,000 to $34,999 | 4 (8.3%) | 2 (6.7%) |
| $35,000 to $39,999 | 6 (12.5%) | 6 (20.0%) |
| $40,000 to $44,999 | 2 (4.2%) | 1 (3.3%) |
| $45,000 to $49,999 | 0 (0.0%) | 2 (6.7%) |
| $50,000 to $54,999 | 0 (0.0%) | 2 (6.7%) |
| $55,000 to $64,999 | 18 (37.5%) | 0 (0.0%) |
| $65,000 to $74,999 | 2 (4.2%) | 2 (6.7%) |
| $75,000 to $99,999 | 6 (12.5%) | 0 (0.0%) |
| $100,000+ | 7 (14.6%) | 0 (0.0%) |
| Total | 48 (100.0%) | 30 (100.0%) |
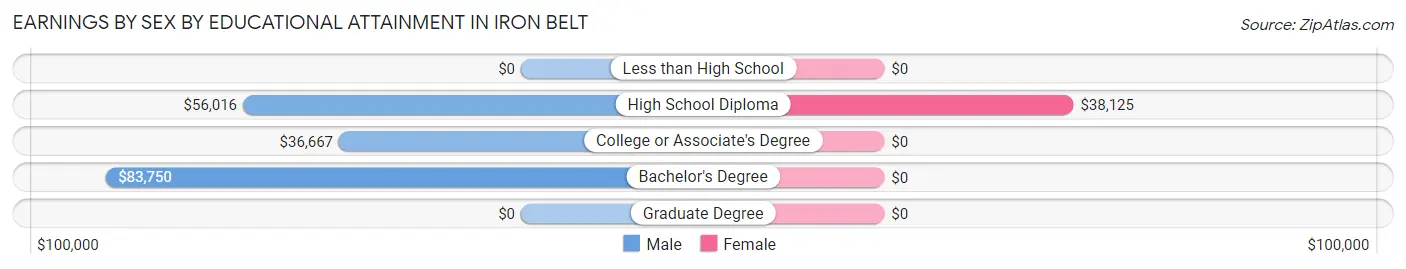
Earnings by Sex by Educational Attainment in Iron Belt
Average earnings in Iron Belt are $56,484 for men and $38,750 for women, a difference of 31.4%. Men with an educational attainment of bachelor's degree enjoy the highest average annual earnings of $83,750, while those with college or associate's degree education earn the least with $36,667. Women with an educational attainment of high school diploma earn the most with the average annual earnings of $38,125, while those with high school diploma education have the smallest earnings of $38,125.
| Educational Attainment | Male Income | Female Income |
| Less than High School | - | - |
| High School Diploma | $56,016 | $38,125 |
| College or Associate's Degree | $36,667 | $0 |
| Bachelor's Degree | $83,750 | $0 |
| Graduate Degree | - | - |
| Total | $56,484 | $38,750 |
Family Income in Iron Belt
Family Income Brackets in Iron Belt
According to the Iron Belt family income data, there are 11 families falling into the $50,000 to $74,999 income range, which is the most common income bracket and makes up 26.8% of all families.
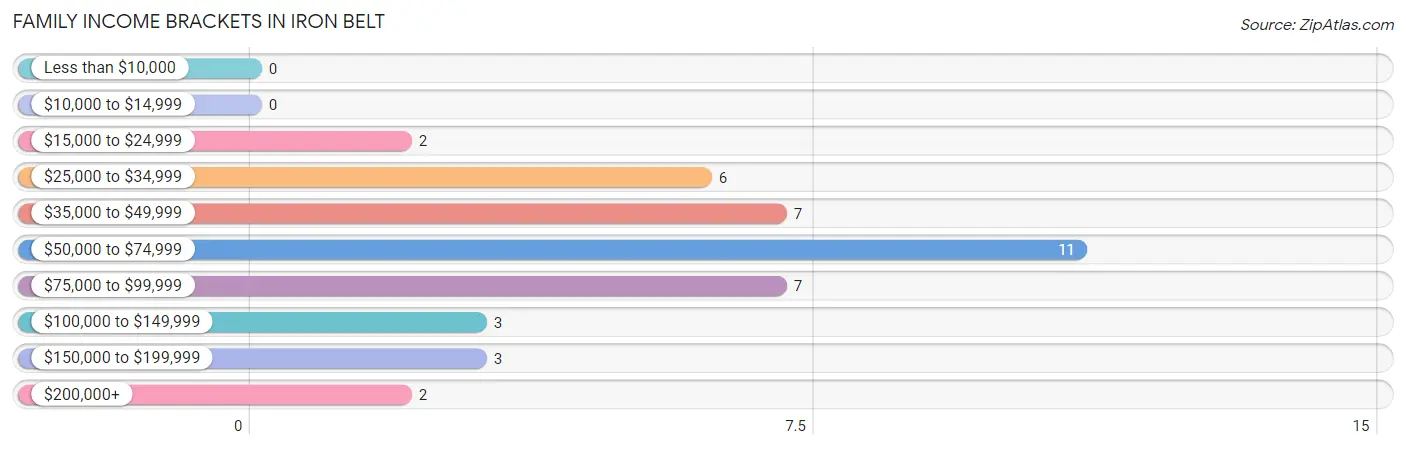
| Income Bracket | # Families | % Families |
| Less than $10,000 | 0 | 0.0% |
| $10,000 to $14,999 | 0 | 0.0% |
| $15,000 to $24,999 | 2 | 4.9% |
| $25,000 to $34,999 | 6 | 14.6% |
| $35,000 to $49,999 | 7 | 17.1% |
| $50,000 to $74,999 | 11 | 26.8% |
| $75,000 to $99,999 | 7 | 17.1% |
| $100,000 to $149,999 | 3 | 7.3% |
| $150,000 to $199,999 | 3 | 7.3% |
| $200,000+ | 2 | 4.9% |
Family Income by Famaliy Size in Iron Belt
3-person families (5 | 12.2%) account for the highest median family income in Iron Belt with $105,625 per family, while 3-person families (5 | 12.2%) have the highest median income of $35,208 per family member.
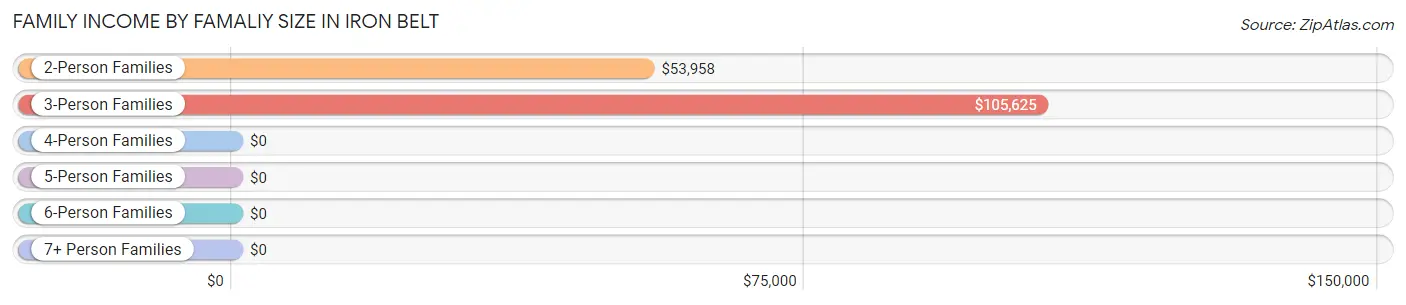
| Income Bracket | # Families | Median Income |
| 2-Person Families | 27 (65.8%) | $53,958 |
| 3-Person Families | 5 (12.2%) | $105,625 |
| 4-Person Families | 4 (9.8%) | $0 |
| 5-Person Families | 0 (0.0%) | $0 |
| 6-Person Families | 5 (12.2%) | $0 |
| 7+ Person Families | 0 (0.0%) | $0 |
| Total | 41 (100.0%) | $54,792 |
Family Income by Number of Earners in Iron Belt
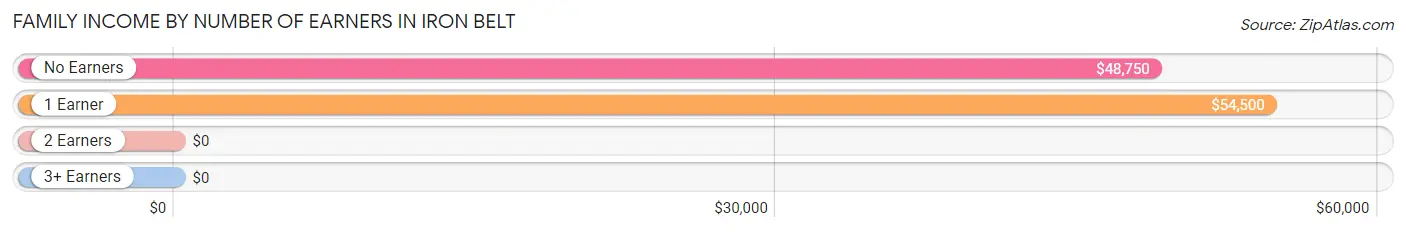
| Number of Earners | # Families | Median Income |
| No Earners | 12 (29.3%) | $48,750 |
| 1 Earner | 18 (43.9%) | $54,500 |
| 2 Earners | 10 (24.4%) | $0 |
| 3+ Earners | 1 (2.4%) | $0 |
| Total | 41 (100.0%) | $54,792 |
Household Income in Iron Belt
Household Income Brackets in Iron Belt
With 27 households falling in the category, the $50,000 to $74,999 income range is the most frequent in Iron Belt, accounting for 34.6% of all households. In contrast, only 2 households (2.6%) fall into the $15,000 to $24,999 income bracket, making it the least populous group.
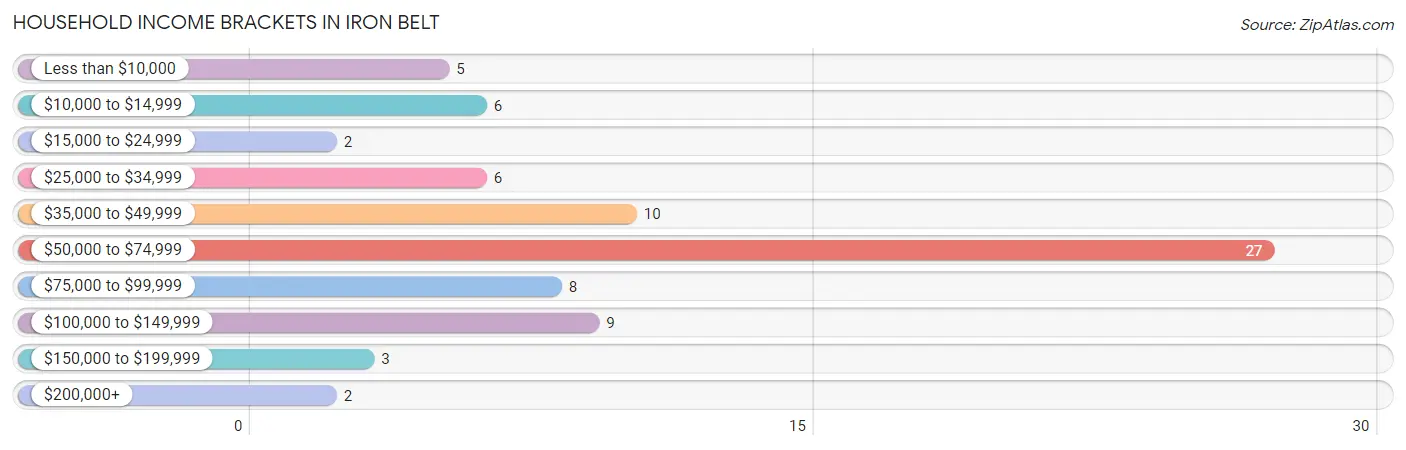
| Income Bracket | # Households | % Households |
| Less than $10,000 | 5 | 6.4% |
| $10,000 to $14,999 | 6 | 7.7% |
| $15,000 to $24,999 | 2 | 2.6% |
| $25,000 to $34,999 | 6 | 7.7% |
| $35,000 to $49,999 | 10 | 12.8% |
| $50,000 to $74,999 | 27 | 34.6% |
| $75,000 to $99,999 | 8 | 10.3% |
| $100,000 to $149,999 | 9 | 11.5% |
| $150,000 to $199,999 | 3 | 3.8% |
| $200,000+ | 2 | 2.6% |
Household Income by Householder Age in Iron Belt
The median household income in Iron Belt is $55,625, with the highest median household income of $60,000 found in the 65+ years age bracket for the primary householder. A total of 18 households (23.1%) fall into this category.
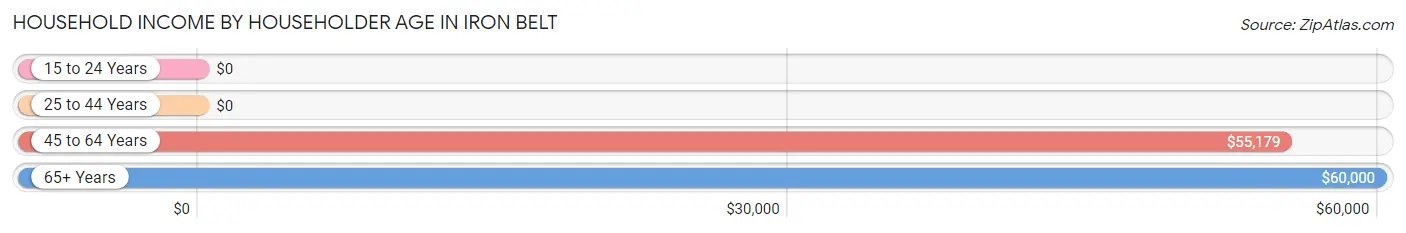
| Income Bracket | # Households | Median Income |
| 15 to 24 Years | 0 (0.0%) | $0 |
| 25 to 44 Years | 14 (17.9%) | $0 |
| 45 to 64 Years | 46 (59.0%) | $55,179 |
| 65+ Years | 18 (23.1%) | $60,000 |
| Total | 78 (100.0%) | $55,625 |
Poverty in Iron Belt
Income Below Poverty by Sex and Age in Iron Belt
With 3.1% poverty level for males and 10.4% for females among the residents of Iron Belt, 55 to 64 year old males and 65 to 74 year old females are the most vulnerable to poverty, with 1 males (33.3%) and 2 females (40.0%) in their respective age groups living below the poverty level.
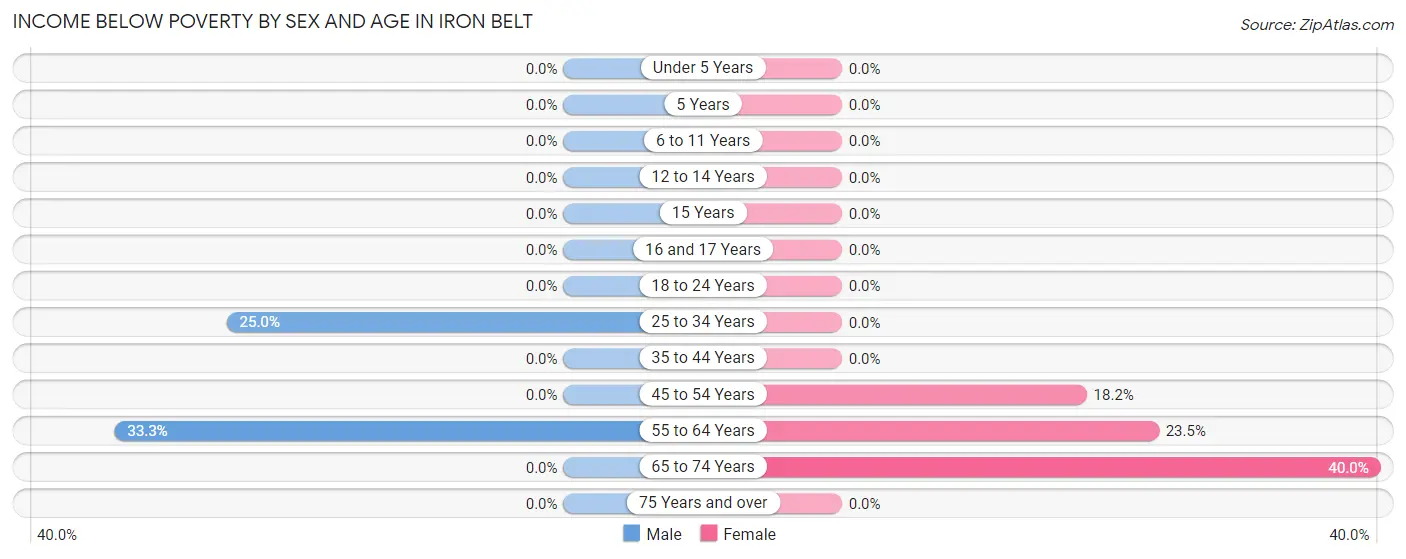
| Age Bracket | Male | Female |
| Under 5 Years | 0 (0.0%) | 0 (0.0%) |
| 5 Years | 0 (0.0%) | 0 (0.0%) |
| 6 to 11 Years | 0 (0.0%) | 0 (0.0%) |
| 12 to 14 Years | 0 (0.0%) | 0 (0.0%) |
| 15 Years | 0 (0.0%) | 0 (0.0%) |
| 16 and 17 Years | 0 (0.0%) | 0 (0.0%) |
| 18 to 24 Years | 0 (0.0%) | 0 (0.0%) |
| 25 to 34 Years | 2 (25.0%) | 0 (0.0%) |
| 35 to 44 Years | 0 (0.0%) | 0 (0.0%) |
| 45 to 54 Years | 0 (0.0%) | 2 (18.2%) |
| 55 to 64 Years | 1 (33.3%) | 4 (23.5%) |
| 65 to 74 Years | 0 (0.0%) | 2 (40.0%) |
| 75 Years and over | 0 (0.0%) | 0 (0.0%) |
| Total | 3 (3.1%) | 8 (10.4%) |
Income Above Poverty by Sex and Age in Iron Belt
According to the poverty statistics in Iron Belt, males aged under 5 years and females aged under 5 years are the age groups that are most secure financially, with 100.0% of males and 100.0% of females in these age groups living above the poverty line.
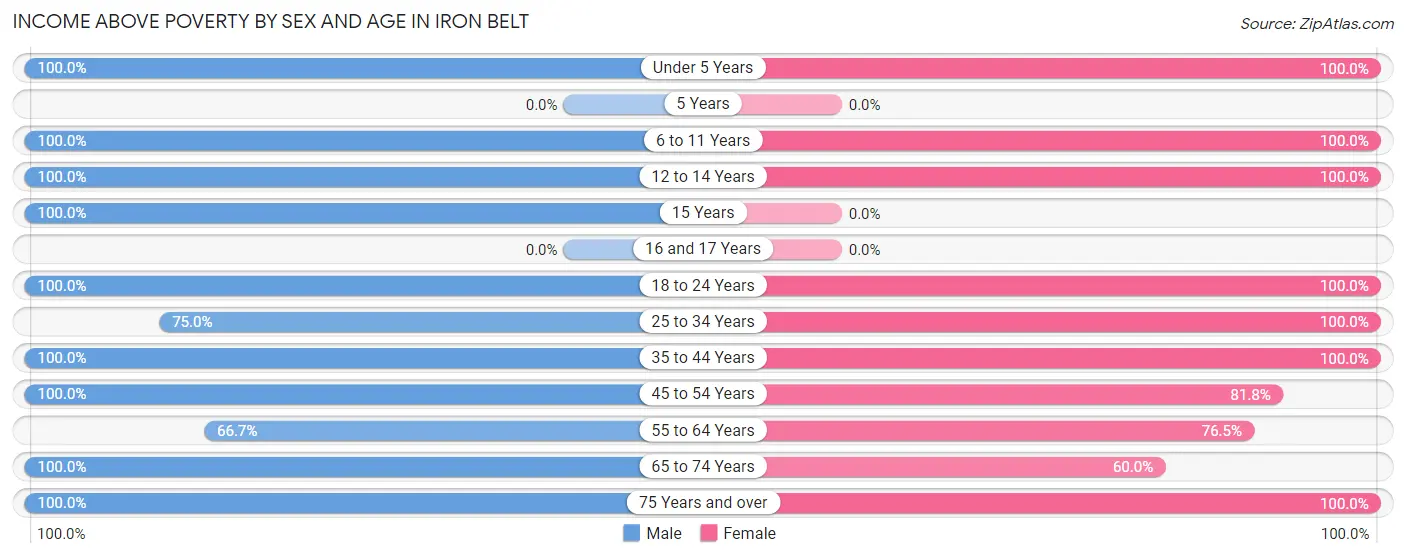
| Age Bracket | Male | Female |
| Under 5 Years | 6 (100.0%) | 4 (100.0%) |
| 5 Years | 0 (0.0%) | 0 (0.0%) |
| 6 to 11 Years | 5 (100.0%) | 2 (100.0%) |
| 12 to 14 Years | 5 (100.0%) | 2 (100.0%) |
| 15 Years | 4 (100.0%) | 0 (0.0%) |
| 16 and 17 Years | 0 (0.0%) | 0 (0.0%) |
| 18 to 24 Years | 1 (100.0%) | 19 (100.0%) |
| 25 to 34 Years | 6 (75.0%) | 7 (100.0%) |
| 35 to 44 Years | 6 (100.0%) | 1 (100.0%) |
| 45 to 54 Years | 31 (100.0%) | 9 (81.8%) |
| 55 to 64 Years | 2 (66.7%) | 13 (76.5%) |
| 65 to 74 Years | 11 (100.0%) | 3 (60.0%) |
| 75 Years and over | 17 (100.0%) | 9 (100.0%) |
| Total | 94 (96.9%) | 69 (89.6%) |
Income Below Poverty Among Married-Couple Families in Iron Belt
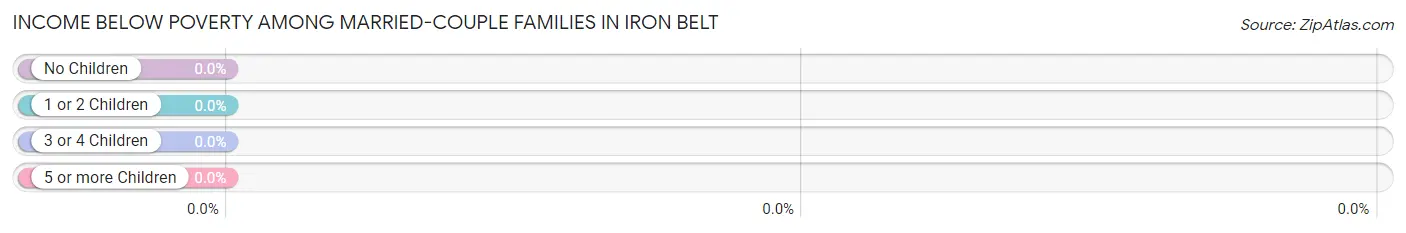
| Children | Above Poverty | Below Poverty |
| No Children | 23 (100.0%) | 0 (0.0%) |
| 1 or 2 Children | 2 (100.0%) | 0 (0.0%) |
| 3 or 4 Children | 5 (100.0%) | 0 (0.0%) |
| 5 or more Children | 0 (0.0%) | 0 (0.0%) |
| Total | 30 (100.0%) | 0 (0.0%) |
Income Below Poverty Among Single-Parent Households in Iron Belt
| Children | Single Father | Single Mother |
| No Children | 0 (0.0%) | 0 (0.0%) |
| 1 or 2 Children | 0 (0.0%) | 0 (0.0%) |
| 3 or 4 Children | 0 (0.0%) | 0 (0.0%) |
| 5 or more Children | 0 (0.0%) | 0 (0.0%) |
| Total | 0 (0.0%) | 0 (0.0%) |
Income Below Poverty Among Married-Couple vs Single-Parent Households in Iron Belt
| Children | Married-Couple Families | Single-Parent Households |
| No Children | 0 (0.0%) | 0 (0.0%) |
| 1 or 2 Children | 0 (0.0%) | 0 (0.0%) |
| 3 or 4 Children | 0 (0.0%) | 0 (0.0%) |
| 5 or more Children | 0 (0.0%) | 0 (0.0%) |
| Total | 0 (0.0%) | 0 (0.0%) |
Race in Iron Belt
The most populous races in Iron Belt are White / Caucasian (168 | 96.6%), and Two or more Races (6 | 3.5%).
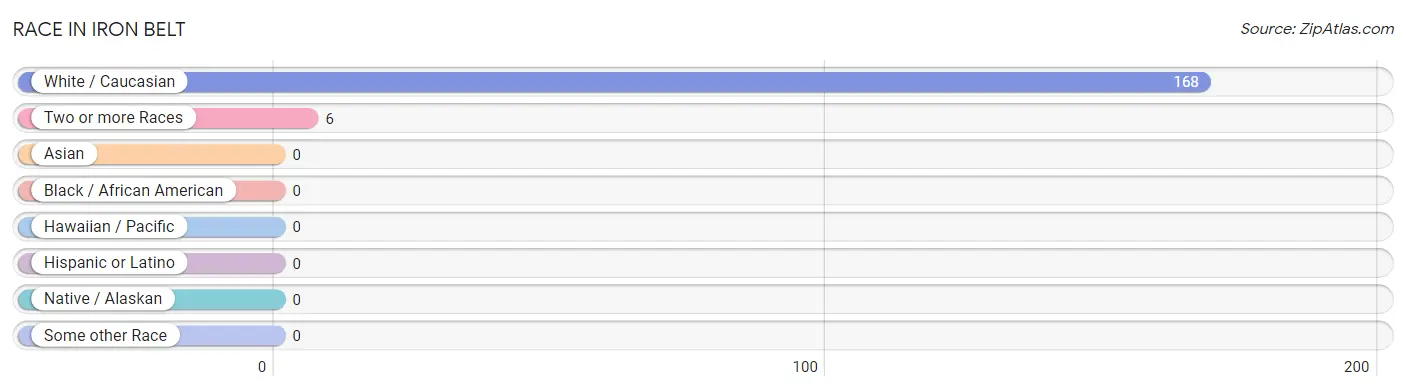
| Race | # Population | % Population |
| Asian | 0 | 0.0% |
| Black / African American | 0 | 0.0% |
| Hawaiian / Pacific | 0 | 0.0% |
| Hispanic or Latino | 0 | 0.0% |
| Native / Alaskan | 0 | 0.0% |
| White / Caucasian | 168 | 96.6% |
| Two or more Races | 6 | 3.5% |
| Some other Race | 0 | 0.0% |
| Total | 174 | 100.0% |
Ancestry in Iron Belt
The most populous ancestries reported in Iron Belt are Finnish (64 | 36.8%), German (42 | 24.1%), Italian (32 | 18.4%), Polish (18 | 10.3%), and Slovak (14 | 8.1%), together accounting for 97.7% of all Iron Belt residents.
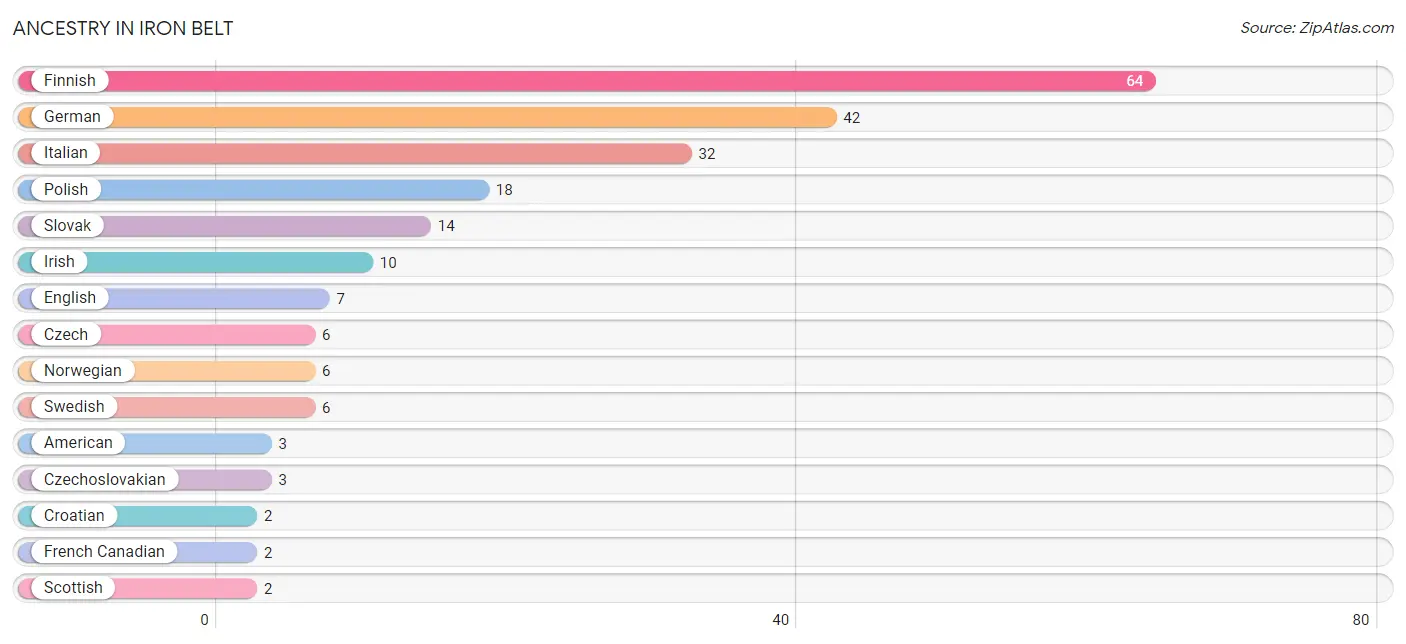
| Ancestry | # Population | % Population |
| American | 3 | 1.7% |
| Cherokee | 1 | 0.6% |
| Croatian | 2 | 1.1% |
| Czech | 6 | 3.5% |
| Czechoslovakian | 3 | 1.7% |
| Danish | 1 | 0.6% |
| English | 7 | 4.0% |
| Finnish | 64 | 36.8% |
| French | 1 | 0.6% |
| French Canadian | 2 | 1.1% |
| German | 42 | 24.1% |
| Irish | 10 | 5.8% |
| Italian | 32 | 18.4% |
| Norwegian | 6 | 3.5% |
| Polish | 18 | 10.3% |
| Scottish | 2 | 1.1% |
| Slovak | 14 | 8.1% |
| Swedish | 6 | 3.5% | View All 18 Rows |
Immigrants in Iron Belt

| Immigration Origin | # Population | % Population | View All 0 Rows |
Sex and Age in Iron Belt
Sex and Age in Iron Belt
The most populous age groups in Iron Belt are 45 to 49 Years (26 | 26.8%) for men and 60 to 64 Years (11 | 14.3%) for women.
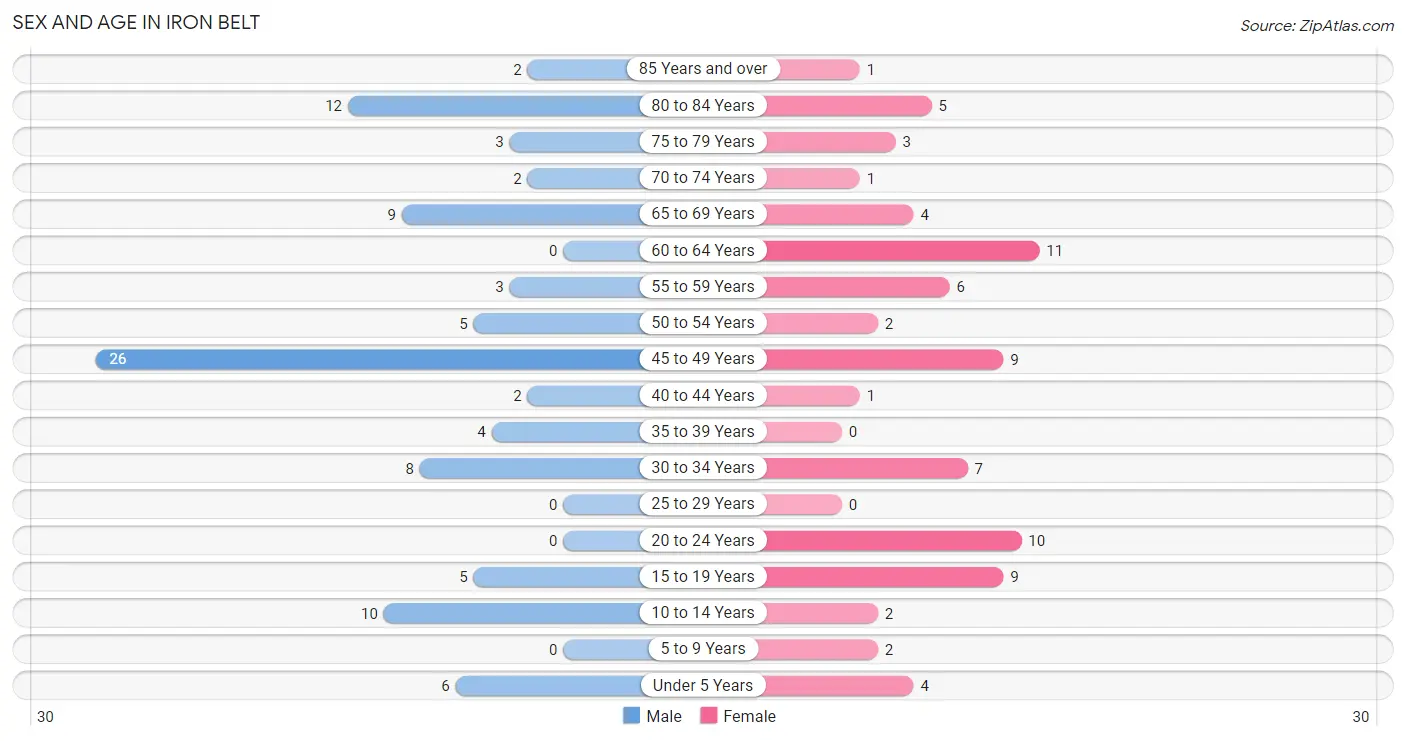
| Age Bracket | Male | Female |
| Under 5 Years | 6 (6.2%) | 4 (5.2%) |
| 5 to 9 Years | 0 (0.0%) | 2 (2.6%) |
| 10 to 14 Years | 10 (10.3%) | 2 (2.6%) |
| 15 to 19 Years | 5 (5.1%) | 9 (11.7%) |
| 20 to 24 Years | 0 (0.0%) | 10 (13.0%) |
| 25 to 29 Years | 0 (0.0%) | 0 (0.0%) |
| 30 to 34 Years | 8 (8.3%) | 7 (9.1%) |
| 35 to 39 Years | 4 (4.1%) | 0 (0.0%) |
| 40 to 44 Years | 2 (2.1%) | 1 (1.3%) |
| 45 to 49 Years | 26 (26.8%) | 9 (11.7%) |
| 50 to 54 Years | 5 (5.1%) | 2 (2.6%) |
| 55 to 59 Years | 3 (3.1%) | 6 (7.8%) |
| 60 to 64 Years | 0 (0.0%) | 11 (14.3%) |
| 65 to 69 Years | 9 (9.3%) | 4 (5.2%) |
| 70 to 74 Years | 2 (2.1%) | 1 (1.3%) |
| 75 to 79 Years | 3 (3.1%) | 3 (3.9%) |
| 80 to 84 Years | 12 (12.4%) | 5 (6.5%) |
| 85 Years and over | 2 (2.1%) | 1 (1.3%) |
| Total | 97 (100.0%) | 77 (100.0%) |
Families and Households in Iron Belt
Median Family Size in Iron Belt
The median family size in Iron Belt is 3.27 persons per family, with married-couple families (30 | 73.2%) accounting for the largest median family size of 3.73 persons per family. On the other hand, single male/father families (6 | 14.6%) represent the smallest median family size with 1.67 persons per family.
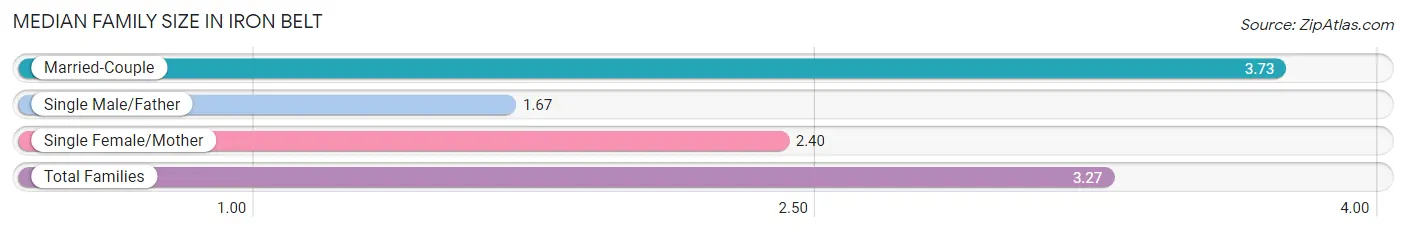
| Family Type | # Families | Family Size |
| Married-Couple | 30 (73.2%) | 3.73 |
| Single Male/Father | 6 (14.6%) | 1.67 |
| Single Female/Mother | 5 (12.2%) | 2.40 |
| Total Families | 41 (100.0%) | 3.27 |
Median Household Size in Iron Belt
The median household size in Iron Belt is 2.23 persons per household, with married-couple households (30 | 38.5%) accounting for the largest median household size of 3.73 persons per household. non-family households (37 | 47.4%) represent the smallest median household size with 1.08 persons per household.
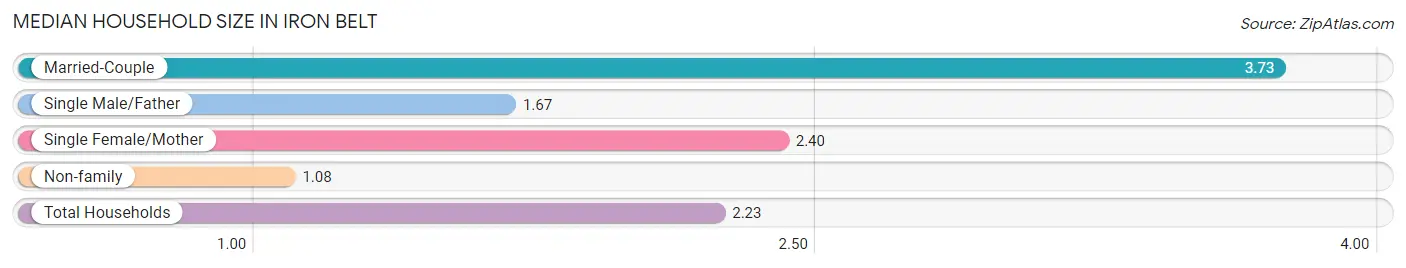
| Household Type | # Households | Household Size |
| Married-Couple | 30 (38.5%) | 3.73 |
| Single Male/Father | 6 (7.7%) | 1.67 |
| Single Female/Mother | 5 (6.4%) | 2.40 |
| Non-family | 37 (47.4%) | 1.08 |
| Total Households | 78 (100.0%) | 2.23 |
Household Size by Marriage Status in Iron Belt
Out of a total of 78 households in Iron Belt, 41 (52.6%) are family households, while 37 (47.4%) are nonfamily households. The most numerous type of family households are 2-person households, comprising 27, and the most common type of nonfamily households are 1-person households, comprising 33.
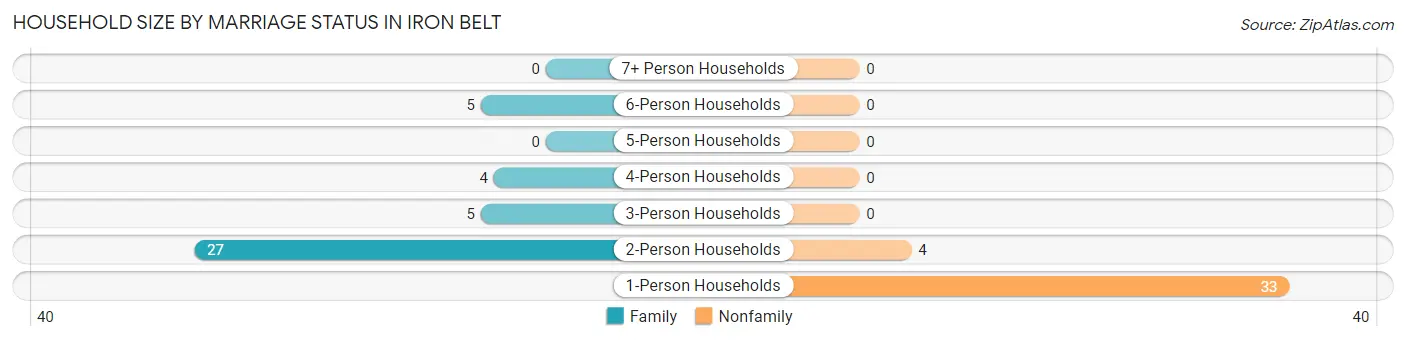
| Household Size | Family Households | Nonfamily Households |
| 1-Person Households | - | 33 (42.3%) |
| 2-Person Households | 27 (34.6%) | 4 (5.1%) |
| 3-Person Households | 5 (6.4%) | 0 (0.0%) |
| 4-Person Households | 4 (5.1%) | 0 (0.0%) |
| 5-Person Households | 0 (0.0%) | 0 (0.0%) |
| 6-Person Households | 5 (6.4%) | 0 (0.0%) |
| 7+ Person Households | 0 (0.0%) | 0 (0.0%) |
| Total | 41 (52.6%) | 37 (47.4%) |
Female Fertility in Iron Belt
Fertility by Age in Iron Belt
| Age Bracket | Women with Births | Births / 1,000 Women |
| 15 to 19 years | 0 (0.0%) | 0.0 |
| 20 to 34 years | 0 (0.0%) | 0.0 |
| 35 to 50 years | 0 (0.0%) | 0.0 |
| Total | 0 (0.0%) | 0.0 |
Fertility by Age by Marriage Status in Iron Belt
| Age Bracket | Married | Unmarried |
| 15 to 19 years | 0 (0.0%) | 0 (0.0%) |
| 20 to 34 years | 0 (0.0%) | 0 (0.0%) |
| 35 to 50 years | 0 (0.0%) | 0 (0.0%) |
| Total | 0 (0.0%) | 0 (0.0%) |
Fertility by Education in Iron Belt
| Educational Attainment | Women with Births | Births / 1,000 Women |
| Less than High School | 0 (0.0%) | 0.0 |
| High School Diploma | 0 (0.0%) | 0.0 |
| College or Associate's Degree | 0 (0.0%) | 0.0 |
| Bachelor's Degree | 0 (0.0%) | 0.0 |
| Graduate Degree | 0 (0.0%) | 0.0 |
| Total | 0 (0.0%) | 0.0 |
Fertility by Education by Marriage Status in Iron Belt
| Educational Attainment | Married | Unmarried |
| Less than High School | 0 (0.0%) | 0 (0.0%) |
| High School Diploma | 0 (0.0%) | 0 (0.0%) |
| College or Associate's Degree | 0 (0.0%) | 0 (0.0%) |
| Bachelor's Degree | 0 (0.0%) | 0 (0.0%) |
| Graduate Degree | 0 (0.0%) | 0 (0.0%) |
| Total | 0 (0.0%) | 0 (0.0%) |
Employment Characteristics in Iron Belt
Employment by Class of Employer in Iron Belt
Among the 72 employed individuals in Iron Belt, private company employees (47 | 65.3%), local government employees (8 | 11.1%), and not-for-profit organizations (6 | 8.3%) make up the most common classes of employment.
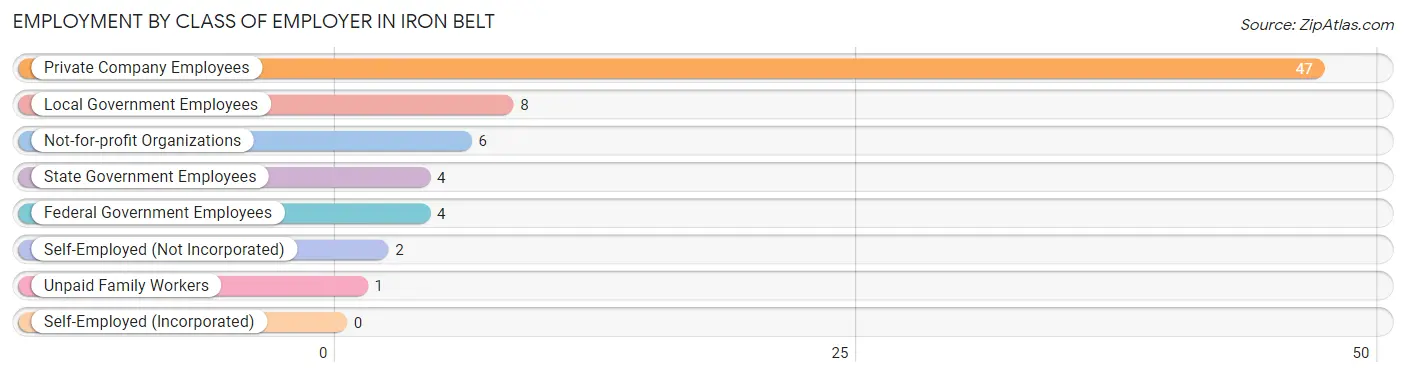
| Employer Class | # Employees | % Employees |
| Private Company Employees | 47 | 65.3% |
| Self-Employed (Incorporated) | 0 | 0.0% |
| Self-Employed (Not Incorporated) | 2 | 2.8% |
| Not-for-profit Organizations | 6 | 8.3% |
| Local Government Employees | 8 | 11.1% |
| State Government Employees | 4 | 5.6% |
| Federal Government Employees | 4 | 5.6% |
| Unpaid Family Workers | 1 | 1.4% |
| Total | 72 | 100.0% |
Employment Status by Age in Iron Belt
According to the labor force statistics for Iron Belt, out of the total population over 16 years of age (146), 52.1% or 76 individuals are in the labor force, with 2.6% or 2 of them unemployed. The age group with the highest labor force participation rate is 20 to 24 years, with 100.0% or 10 individuals in the labor force. Within the labor force, the 65 to 74 years age range has the highest percentage of unemployed individuals, with 20.0% or 1 of them being unemployed.
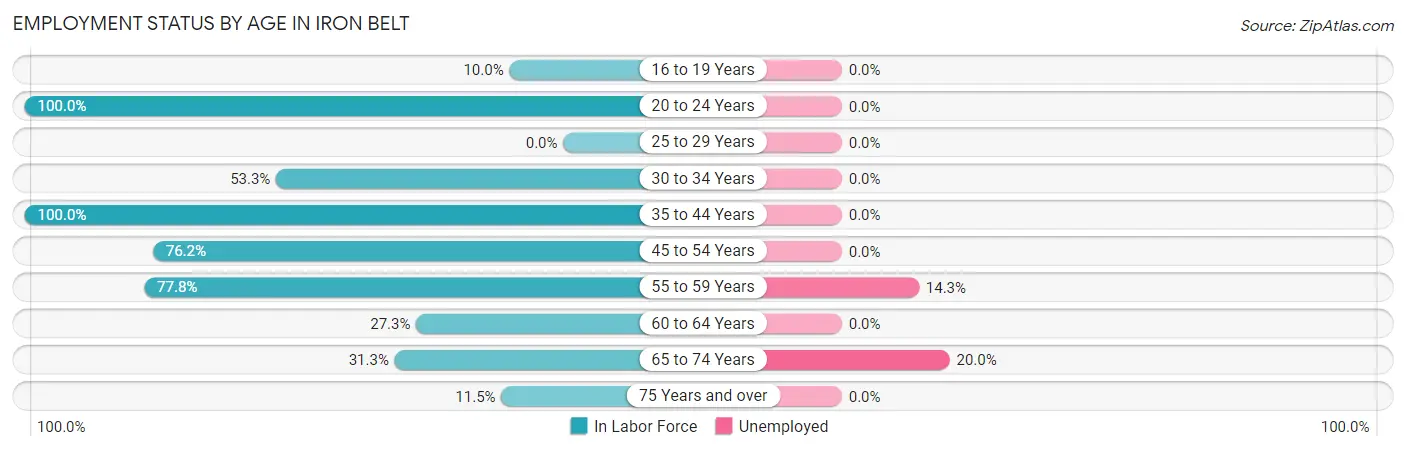
| Age Bracket | In Labor Force | Unemployed |
| 16 to 19 Years | 1 (10.0%) | 0 (0.0%) |
| 20 to 24 Years | 10 (100.0%) | 0 (0.0%) |
| 25 to 29 Years | 0 (0.0%) | 0 (0.0%) |
| 30 to 34 Years | 8 (53.3%) | 0 (0.0%) |
| 35 to 44 Years | 7 (100.0%) | 0 (0.0%) |
| 45 to 54 Years | 32 (76.2%) | 0 (0.0%) |
| 55 to 59 Years | 7 (77.8%) | 1 (14.3%) |
| 60 to 64 Years | 3 (27.3%) | 0 (0.0%) |
| 65 to 74 Years | 5 (31.3%) | 1 (20.0%) |
| 75 Years and over | 3 (11.5%) | 0 (0.0%) |
| Total | 76 (52.1%) | 2 (2.6%) |
Employment Status by Educational Attainment in Iron Belt
According to labor force statistics for Iron Belt, 67.9% of individuals (57) out of the total population between 25 and 64 years of age (84) are in the labor force, with 1.8% or 1 of them being unemployed. The group with the highest labor force participation rate are those with the educational attainment of bachelor's degree or higher, with 83.3% or 10 individuals in the labor force. Within the labor force, individuals with high school diploma education have the highest percentage of unemployment, with 3.3% or 1 of them being unemployed.
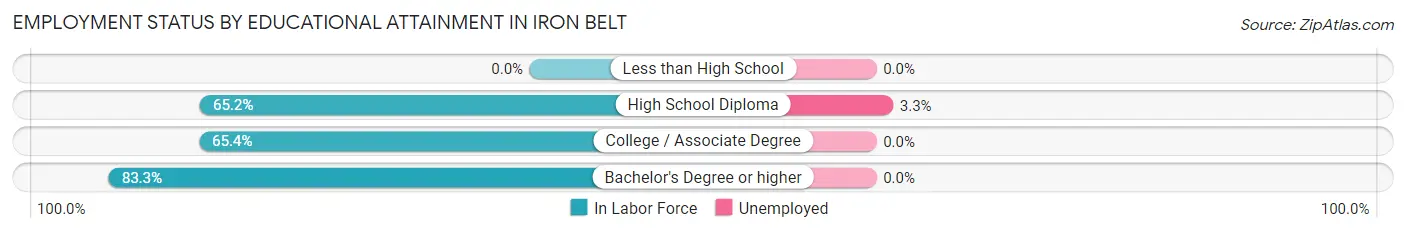
| Educational Attainment | In Labor Force | Unemployed |
| Less than High School | 0 (0.0%) | 0 (0.0%) |
| High School Diploma | 30 (65.2%) | 2 (3.3%) |
| College / Associate Degree | 17 (65.4%) | 0 (0.0%) |
| Bachelor's Degree or higher | 10 (83.3%) | 0 (0.0%) |
| Total | 57 (67.9%) | 2 (1.8%) |
Employment Occupations by Sex in Iron Belt
Management, Business, Science and Arts Occupations
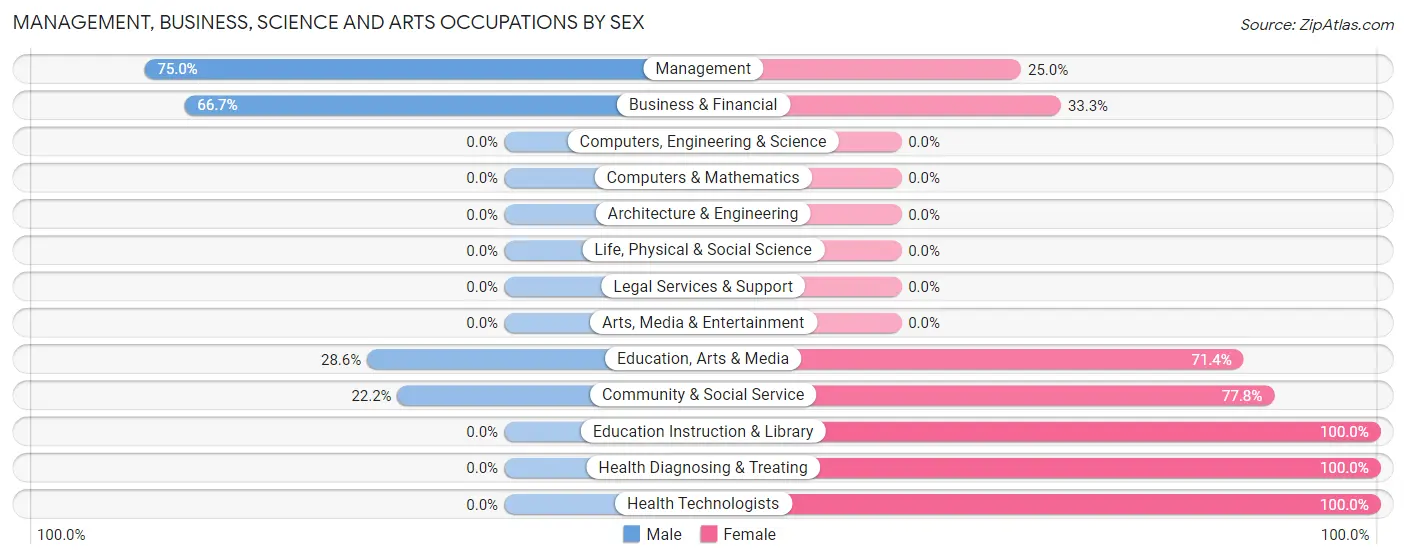
The most common Management, Business, Science and Arts occupations in Iron Belt are Community & Social Service (9 | 12.2%), Education, Arts & Media (7 | 9.5%), Management (4 | 5.4%), Business & Financial (3 | 4.1%), and Education Instruction & Library (2 | 2.7%).
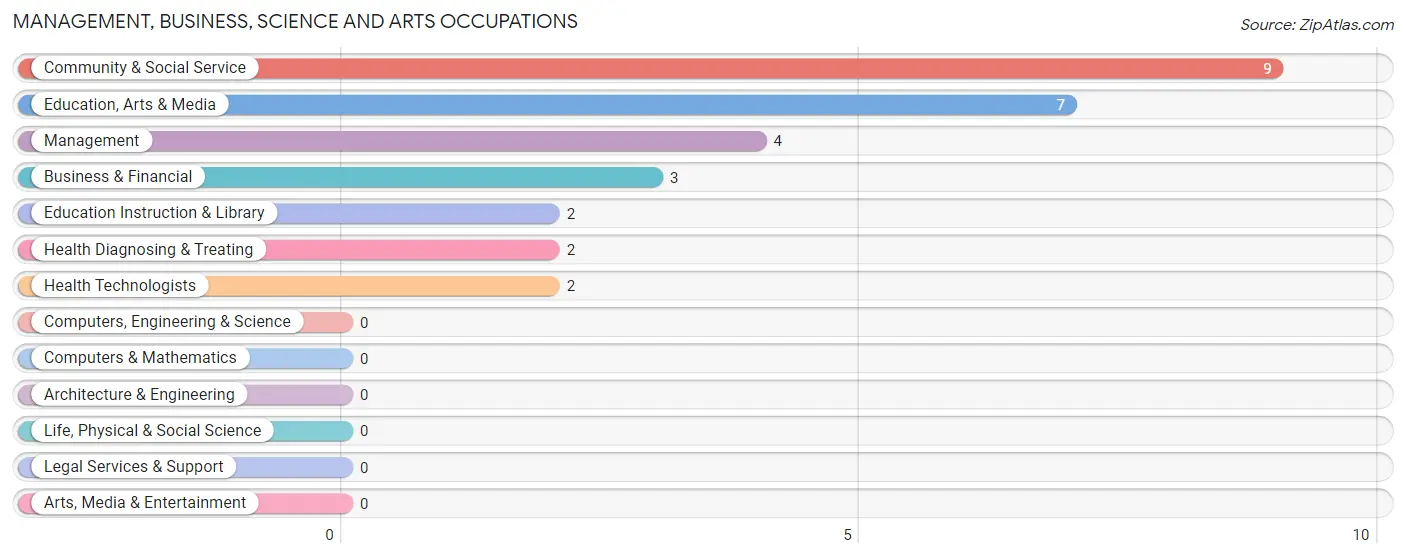
Management, Business, Science and Arts Occupations by Sex
Within the Management, Business, Science and Arts occupations in Iron Belt, the most male-oriented occupations are Management (75.0%), Business & Financial (66.7%), and Education, Arts & Media (28.6%), while the most female-oriented occupations are Education Instruction & Library (100.0%), Health Diagnosing & Treating (100.0%), and Health Technologists (100.0%).
| Occupation | Male | Female |
| Management | 3 (75.0%) | 1 (25.0%) |
| Business & Financial | 2 (66.7%) | 1 (33.3%) |
| Computers, Engineering & Science | 0 (0.0%) | 0 (0.0%) |
| Computers & Mathematics | 0 (0.0%) | 0 (0.0%) |
| Architecture & Engineering | 0 (0.0%) | 0 (0.0%) |
| Life, Physical & Social Science | 0 (0.0%) | 0 (0.0%) |
| Community & Social Service | 2 (22.2%) | 7 (77.8%) |
| Education, Arts & Media | 2 (28.6%) | 5 (71.4%) |
| Legal Services & Support | 0 (0.0%) | 0 (0.0%) |
| Education Instruction & Library | 0 (0.0%) | 2 (100.0%) |
| Arts, Media & Entertainment | 0 (0.0%) | 0 (0.0%) |
| Health Diagnosing & Treating | 0 (0.0%) | 2 (100.0%) |
| Health Technologists | 0 (0.0%) | 2 (100.0%) |
| Total (Category) | 7 (38.9%) | 11 (61.1%) |
| Total (Overall) | 45 (60.8%) | 29 (39.2%) |
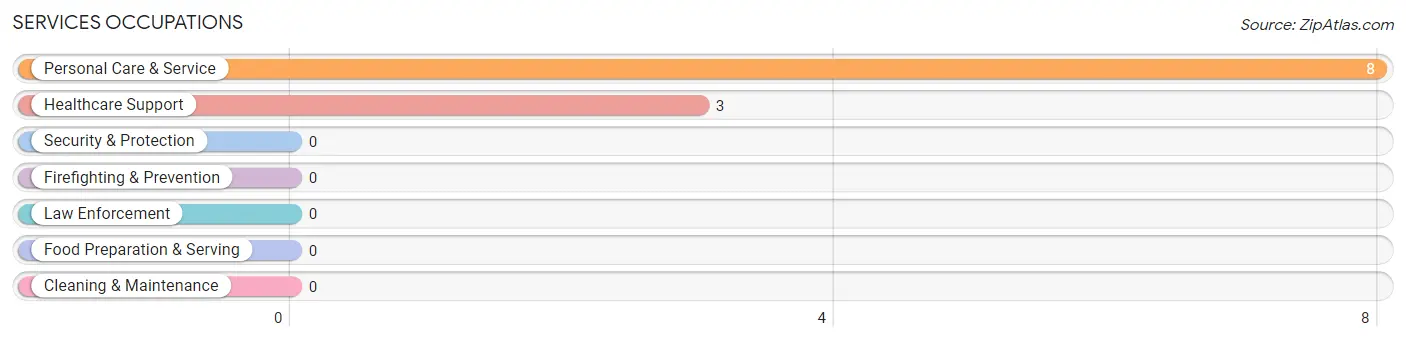
Services Occupations
The most common Services occupations in Iron Belt are Personal Care & Service (8 | 10.8%), and Healthcare Support (3 | 4.1%).
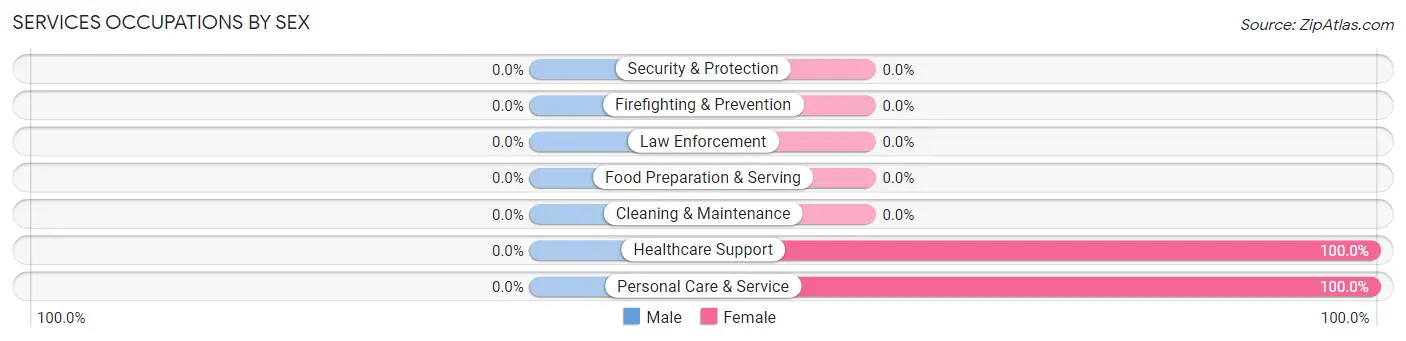
Services Occupations by Sex
| Occupation | Male | Female |
| Healthcare Support | 0 (0.0%) | 3 (100.0%) |
| Security & Protection | 0 (0.0%) | 0 (0.0%) |
| Firefighting & Prevention | 0 (0.0%) | 0 (0.0%) |
| Law Enforcement | 0 (0.0%) | 0 (0.0%) |
| Food Preparation & Serving | 0 (0.0%) | 0 (0.0%) |
| Cleaning & Maintenance | 0 (0.0%) | 0 (0.0%) |
| Personal Care & Service | 0 (0.0%) | 8 (100.0%) |
| Total (Category) | 0 (0.0%) | 11 (100.0%) |
| Total (Overall) | 45 (60.8%) | 29 (39.2%) |
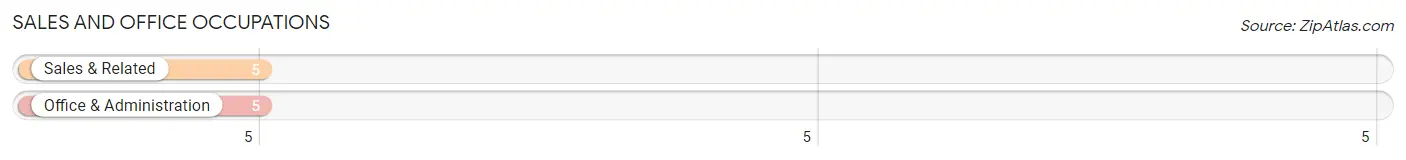
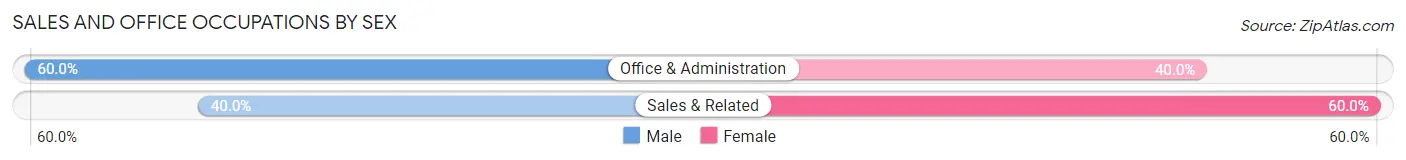
Sales and Office Occupations
The most common Sales and Office occupations in Iron Belt are Sales & Related (5 | 6.8%), and Office & Administration (5 | 6.8%).
Sales and Office Occupations by Sex
| Occupation | Male | Female |
| Sales & Related | 2 (40.0%) | 3 (60.0%) |
| Office & Administration | 3 (60.0%) | 2 (40.0%) |
| Total (Category) | 5 (50.0%) | 5 (50.0%) |
| Total (Overall) | 45 (60.8%) | 29 (39.2%) |
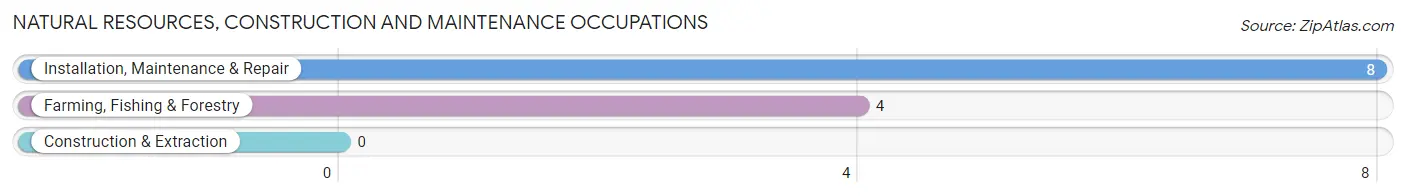
Natural Resources, Construction and Maintenance Occupations
The most common Natural Resources, Construction and Maintenance occupations in Iron Belt are Installation, Maintenance & Repair (8 | 10.8%), and Farming, Fishing & Forestry (4 | 5.4%).
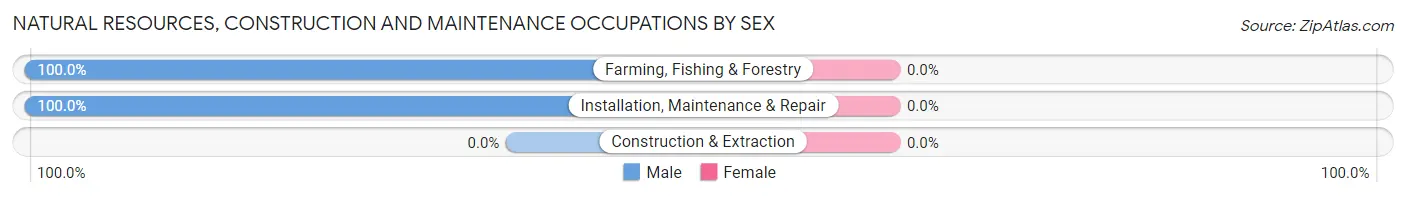
Natural Resources, Construction and Maintenance Occupations by Sex
| Occupation | Male | Female |
| Farming, Fishing & Forestry | 4 (100.0%) | 0 (0.0%) |
| Construction & Extraction | 0 (0.0%) | 0 (0.0%) |
| Installation, Maintenance & Repair | 8 (100.0%) | 0 (0.0%) |
| Total (Category) | 12 (100.0%) | 0 (0.0%) |
| Total (Overall) | 45 (60.8%) | 29 (39.2%) |
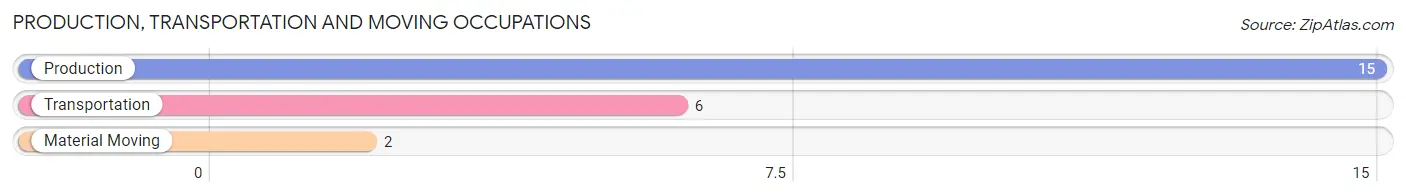
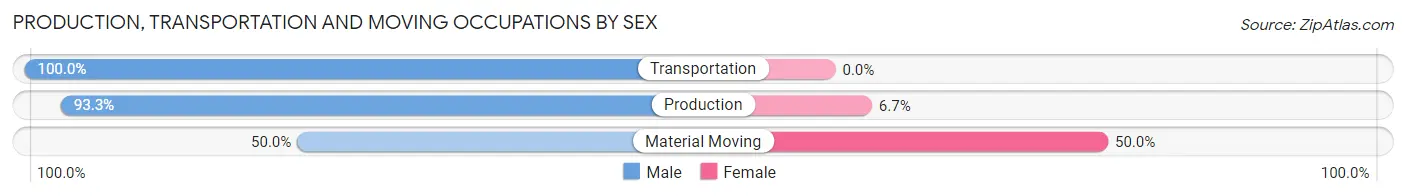
Production, Transportation and Moving Occupations
The most common Production, Transportation and Moving occupations in Iron Belt are Production (15 | 20.3%), Transportation (6 | 8.1%), and Material Moving (2 | 2.7%).
Production, Transportation and Moving Occupations by Sex
| Occupation | Male | Female |
| Production | 14 (93.3%) | 1 (6.7%) |
| Transportation | 6 (100.0%) | 0 (0.0%) |
| Material Moving | 1 (50.0%) | 1 (50.0%) |
| Total (Category) | 21 (91.3%) | 2 (8.7%) |
| Total (Overall) | 45 (60.8%) | 29 (39.2%) |
Employment Industries by Sex in Iron Belt
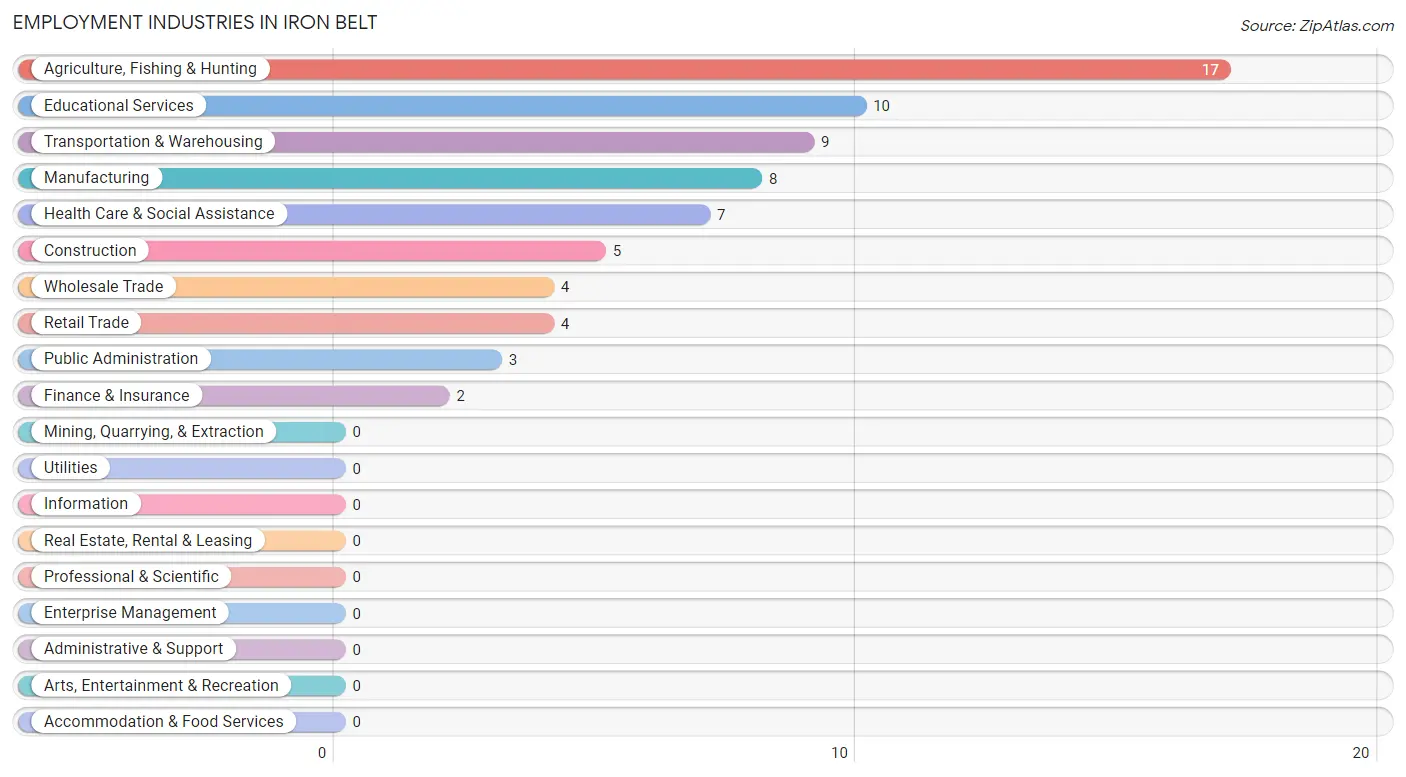
Employment Industries in Iron Belt
The major employment industries in Iron Belt include Agriculture, Fishing & Hunting (17 | 23.0%), Educational Services (10 | 13.5%), Transportation & Warehousing (9 | 12.2%), Manufacturing (8 | 10.8%), and Health Care & Social Assistance (7 | 9.5%).
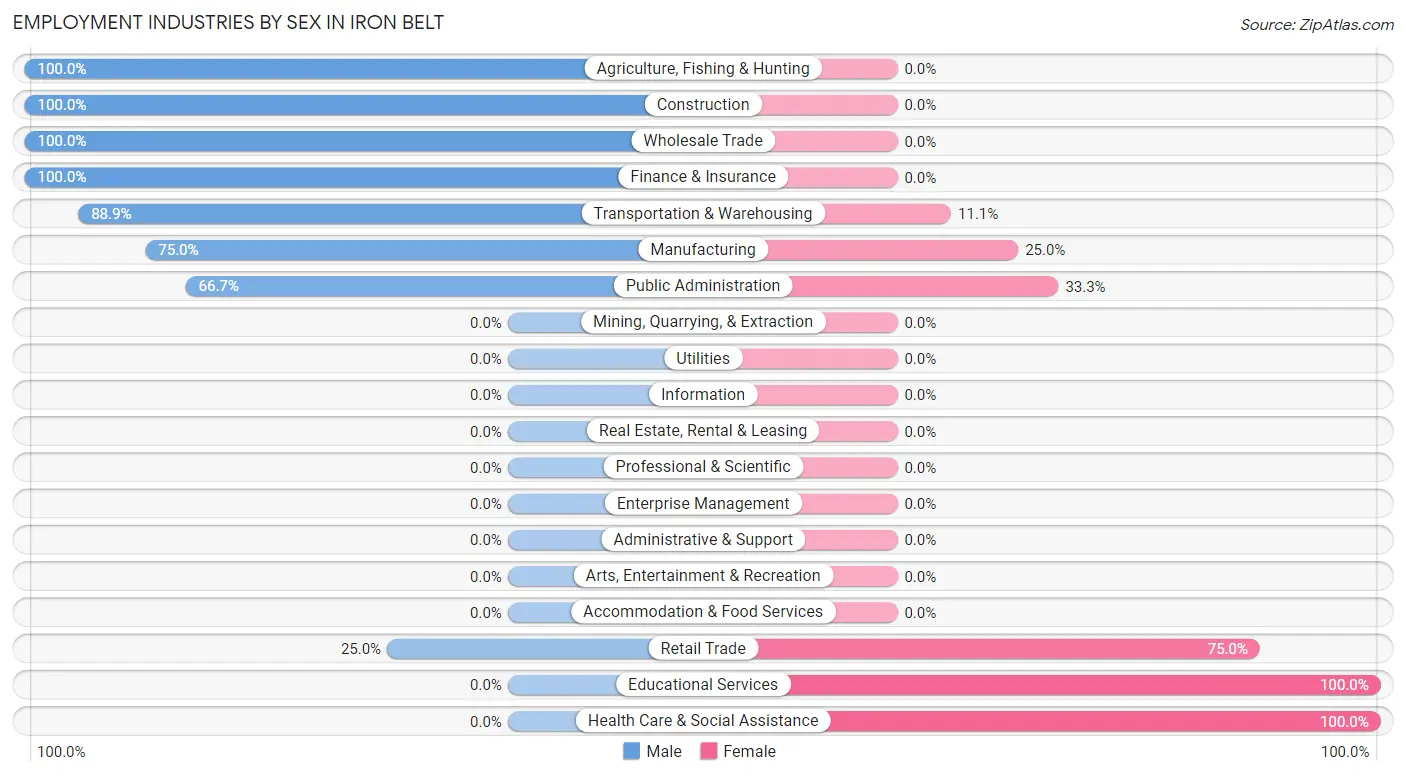
Employment Industries by Sex in Iron Belt
The Iron Belt industries that see more men than women are Agriculture, Fishing & Hunting (100.0%), Construction (100.0%), and Wholesale Trade (100.0%), whereas the industries that tend to have a higher number of women are Educational Services (100.0%), Health Care & Social Assistance (100.0%), and Retail Trade (75.0%).
| Industry | Male | Female |
| Agriculture, Fishing & Hunting | 17 (100.0%) | 0 (0.0%) |
| Mining, Quarrying, & Extraction | 0 (0.0%) | 0 (0.0%) |
| Construction | 5 (100.0%) | 0 (0.0%) |
| Manufacturing | 6 (75.0%) | 2 (25.0%) |
| Wholesale Trade | 4 (100.0%) | 0 (0.0%) |
| Retail Trade | 1 (25.0%) | 3 (75.0%) |
| Transportation & Warehousing | 8 (88.9%) | 1 (11.1%) |
| Utilities | 0 (0.0%) | 0 (0.0%) |
| Information | 0 (0.0%) | 0 (0.0%) |
| Finance & Insurance | 2 (100.0%) | 0 (0.0%) |
| Real Estate, Rental & Leasing | 0 (0.0%) | 0 (0.0%) |
| Professional & Scientific | 0 (0.0%) | 0 (0.0%) |
| Enterprise Management | 0 (0.0%) | 0 (0.0%) |
| Administrative & Support | 0 (0.0%) | 0 (0.0%) |
| Educational Services | 0 (0.0%) | 10 (100.0%) |
| Health Care & Social Assistance | 0 (0.0%) | 7 (100.0%) |
| Arts, Entertainment & Recreation | 0 (0.0%) | 0 (0.0%) |
| Accommodation & Food Services | 0 (0.0%) | 0 (0.0%) |
| Public Administration | 2 (66.7%) | 1 (33.3%) |
| Total | 45 (60.8%) | 29 (39.2%) |
Education in Iron Belt
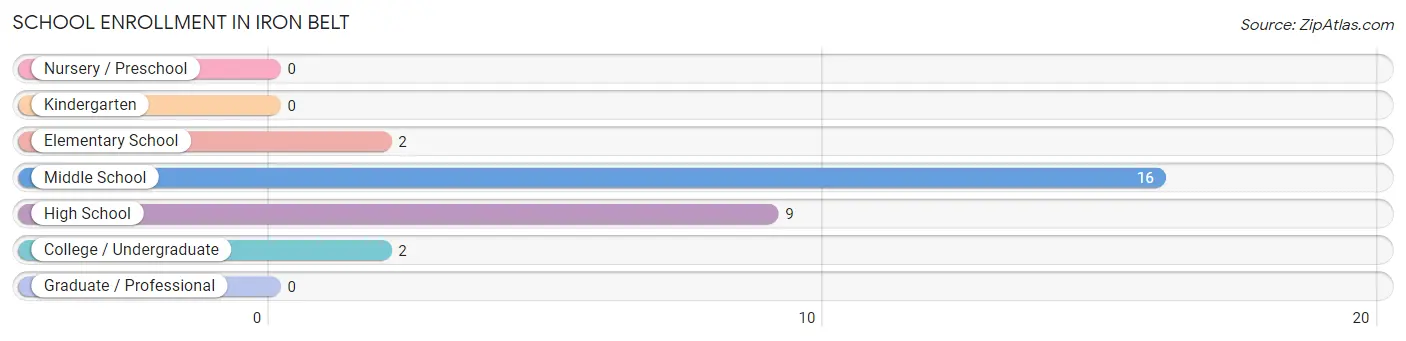
School Enrollment in Iron Belt
The most common levels of schooling among the 29 students in Iron Belt are middle school (16 | 55.2%), high school (9 | 31.0%), and elementary school (2 | 6.9%).
| School Level | # Students | % Students |
| Nursery / Preschool | 0 | 0.0% |
| Kindergarten | 0 | 0.0% |
| Elementary School | 2 | 6.9% |
| Middle School | 16 | 55.2% |
| High School | 9 | 31.0% |
| College / Undergraduate | 2 | 6.9% |
| Graduate / Professional | 0 | 0.0% |
| Total | 29 | 100.0% |
School Enrollment by Age by Funding Source in Iron Belt
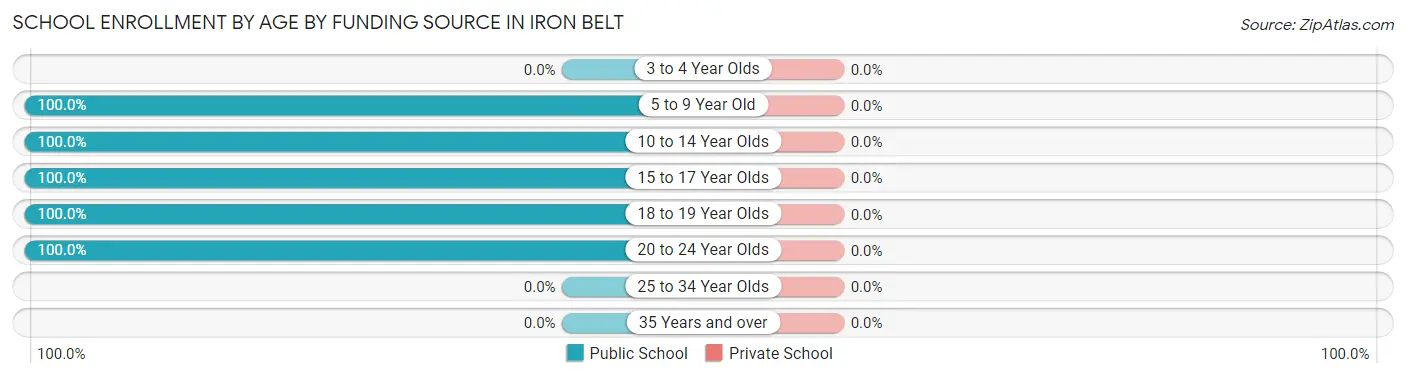
| Age Bracket | Public School | Private School |
| 3 to 4 Year Olds | 0 (0.0%) | 0 (0.0%) |
| 5 to 9 Year Old | 2 (100.0%) | 0 (0.0%) |
| 10 to 14 Year Olds | 12 (100.0%) | 0 (0.0%) |
| 15 to 17 Year Olds | 4 (100.0%) | 0 (0.0%) |
| 18 to 19 Year Olds | 9 (100.0%) | 0 (0.0%) |
| 20 to 24 Year Olds | 2 (100.0%) | 0 (0.0%) |
| 25 to 34 Year Olds | 0 (0.0%) | 0 (0.0%) |
| 35 Years and over | 0 (0.0%) | 0 (0.0%) |
| Total | 29 (100.0%) | 0 (0.0%) |
Educational Attainment by Field of Study in Iron Belt
Bio, nature & agricultural (4 | 26.7%), psychology (2 | 13.3%), social sciences (2 | 13.3%), science & technology (2 | 13.3%), and business (2 | 13.3%) are the most common fields of study among 15 individuals in Iron Belt who have obtained a bachelor's degree or higher.
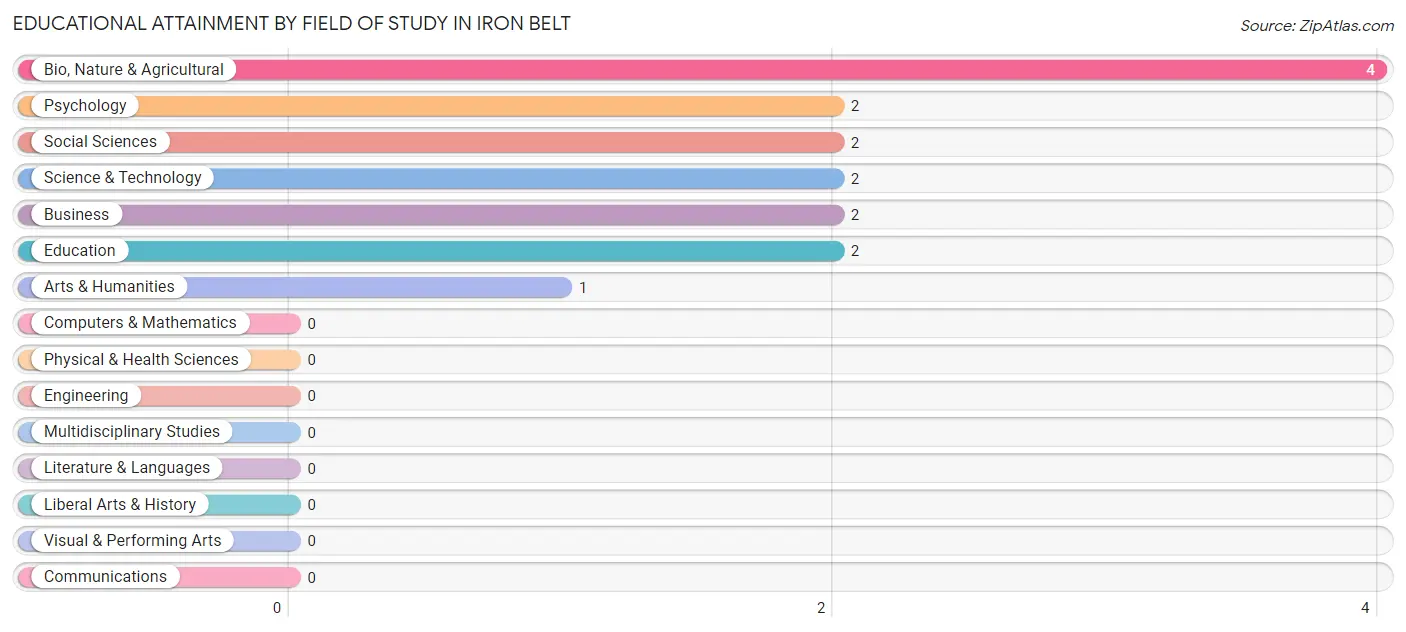
| Field of Study | # Graduates | % Graduates |
| Computers & Mathematics | 0 | 0.0% |
| Bio, Nature & Agricultural | 4 | 26.7% |
| Physical & Health Sciences | 0 | 0.0% |
| Psychology | 2 | 13.3% |
| Social Sciences | 2 | 13.3% |
| Engineering | 0 | 0.0% |
| Multidisciplinary Studies | 0 | 0.0% |
| Science & Technology | 2 | 13.3% |
| Business | 2 | 13.3% |
| Education | 2 | 13.3% |
| Literature & Languages | 0 | 0.0% |
| Liberal Arts & History | 0 | 0.0% |
| Visual & Performing Arts | 0 | 0.0% |
| Communications | 0 | 0.0% |
| Arts & Humanities | 1 | 6.7% |
| Total | 15 | 100.0% |
Transportation & Commute in Iron Belt
Vehicle Availability by Sex in Iron Belt
The most prevalent vehicle ownership categories in Iron Belt are males with 1 vehicle (25, accounting for 55.6%) and females with 1 vehicle (9, making up 92.6%).
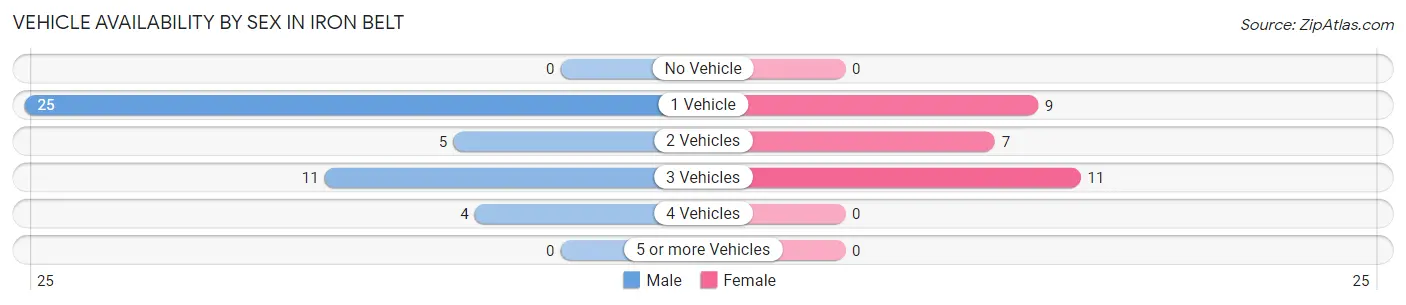
| Vehicles Available | Male | Female |
| No Vehicle | 0 (0.0%) | 0 (0.0%) |
| 1 Vehicle | 25 (55.6%) | 9 (33.3%) |
| 2 Vehicles | 5 (11.1%) | 7 (25.9%) |
| 3 Vehicles | 11 (24.4%) | 11 (40.7%) |
| 4 Vehicles | 4 (8.9%) | 0 (0.0%) |
| 5 or more Vehicles | 0 (0.0%) | 0 (0.0%) |
| Total | 45 (100.0%) | 27 (100.0%) |
Commute Time in Iron Belt
The most frequently occuring commute durations in Iron Belt are 10 to 14 minutes (23 commuters, 32.4%), 15 to 19 minutes (19 commuters, 26.8%), and 5 to 9 minutes (6 commuters, 8.5%).
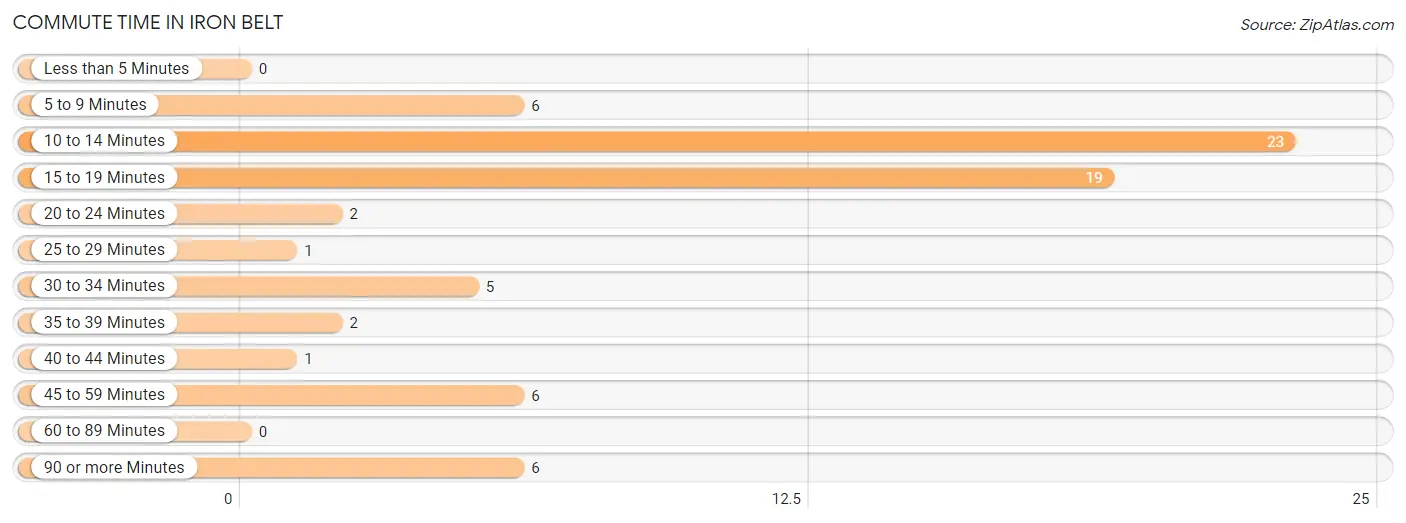
| Commute Time | # Commuters | % Commuters |
| Less than 5 Minutes | 0 | 0.0% |
| 5 to 9 Minutes | 6 | 8.5% |
| 10 to 14 Minutes | 23 | 32.4% |
| 15 to 19 Minutes | 19 | 26.8% |
| 20 to 24 Minutes | 2 | 2.8% |
| 25 to 29 Minutes | 1 | 1.4% |
| 30 to 34 Minutes | 5 | 7.0% |
| 35 to 39 Minutes | 2 | 2.8% |
| 40 to 44 Minutes | 1 | 1.4% |
| 45 to 59 Minutes | 6 | 8.5% |
| 60 to 89 Minutes | 0 | 0.0% |
| 90 or more Minutes | 6 | 8.5% |
Commute Time by Sex in Iron Belt
The most common commute times in Iron Belt are 10 to 14 minutes (22 commuters, 48.9%) for males and 15 to 19 minutes (16 commuters, 61.5%) for females.
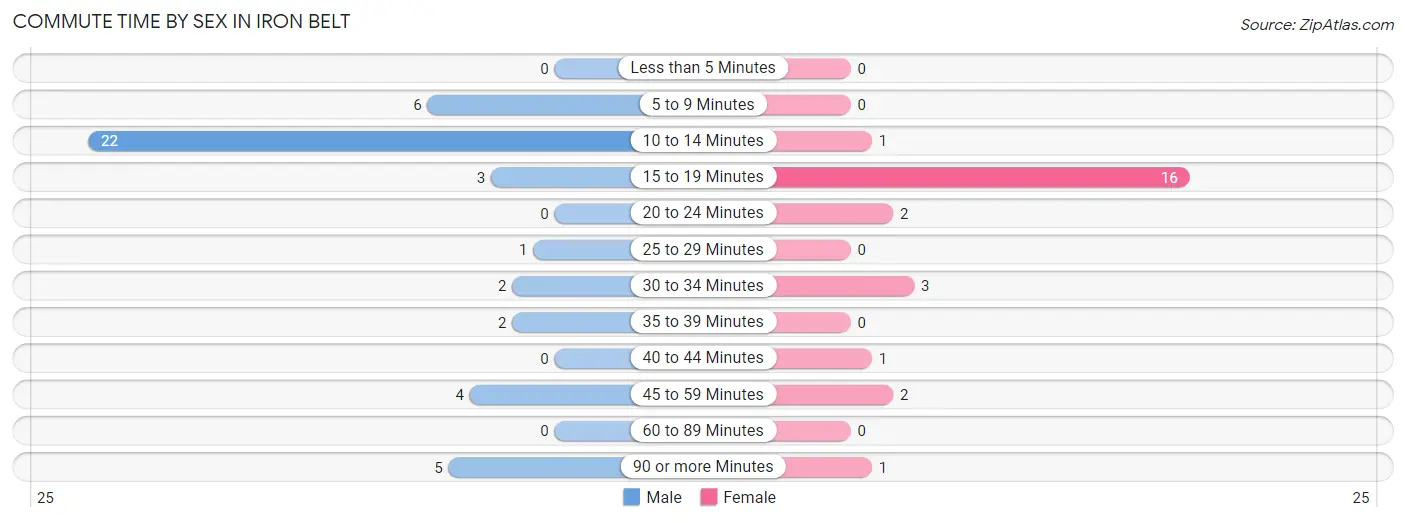
| Commute Time | Male | Female |
| Less than 5 Minutes | 0 (0.0%) | 0 (0.0%) |
| 5 to 9 Minutes | 6 (13.3%) | 0 (0.0%) |
| 10 to 14 Minutes | 22 (48.9%) | 1 (3.8%) |
| 15 to 19 Minutes | 3 (6.7%) | 16 (61.5%) |
| 20 to 24 Minutes | 0 (0.0%) | 2 (7.7%) |
| 25 to 29 Minutes | 1 (2.2%) | 0 (0.0%) |
| 30 to 34 Minutes | 2 (4.4%) | 3 (11.5%) |
| 35 to 39 Minutes | 2 (4.4%) | 0 (0.0%) |
| 40 to 44 Minutes | 0 (0.0%) | 1 (3.8%) |
| 45 to 59 Minutes | 4 (8.9%) | 2 (7.7%) |
| 60 to 89 Minutes | 0 (0.0%) | 0 (0.0%) |
| 90 or more Minutes | 5 (11.1%) | 1 (3.8%) |
Time of Departure to Work by Sex in Iron Belt
The most frequent times of departure to work in Iron Belt are 12:00 AM to 4:59 AM (20, 44.4%) for males and 7:00 AM to 7:29 AM (10, 38.5%) for females.
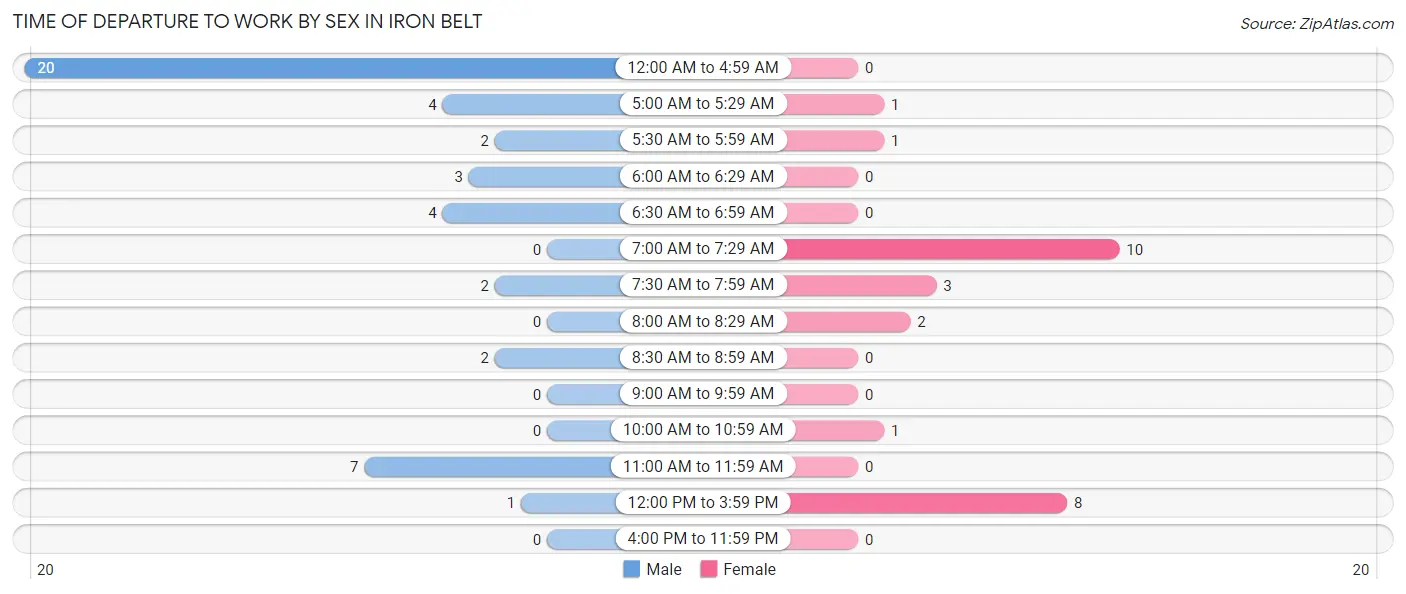
| Time of Departure | Male | Female |
| 12:00 AM to 4:59 AM | 20 (44.4%) | 0 (0.0%) |
| 5:00 AM to 5:29 AM | 4 (8.9%) | 1 (3.8%) |
| 5:30 AM to 5:59 AM | 2 (4.4%) | 1 (3.8%) |
| 6:00 AM to 6:29 AM | 3 (6.7%) | 0 (0.0%) |
| 6:30 AM to 6:59 AM | 4 (8.9%) | 0 (0.0%) |
| 7:00 AM to 7:29 AM | 0 (0.0%) | 10 (38.5%) |
| 7:30 AM to 7:59 AM | 2 (4.4%) | 3 (11.5%) |
| 8:00 AM to 8:29 AM | 0 (0.0%) | 2 (7.7%) |
| 8:30 AM to 8:59 AM | 2 (4.4%) | 0 (0.0%) |
| 9:00 AM to 9:59 AM | 0 (0.0%) | 0 (0.0%) |
| 10:00 AM to 10:59 AM | 0 (0.0%) | 1 (3.8%) |
| 11:00 AM to 11:59 AM | 7 (15.6%) | 0 (0.0%) |
| 12:00 PM to 3:59 PM | 1 (2.2%) | 8 (30.8%) |
| 4:00 PM to 11:59 PM | 0 (0.0%) | 0 (0.0%) |
| Total | 45 (100.0%) | 26 (100.0%) |
Housing Occupancy in Iron Belt
Occupancy by Ownership in Iron Belt
Of the total 78 dwellings in Iron Belt, owner-occupied units account for 66 (84.6%), while renter-occupied units make up 12 (15.4%).
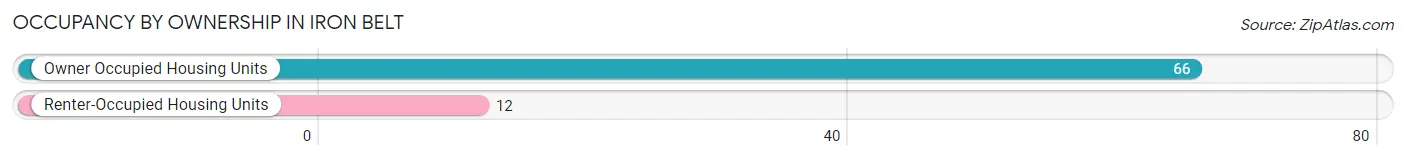
| Occupancy | # Housing Units | % Housing Units |
| Owner Occupied Housing Units | 66 | 84.6% |
| Renter-Occupied Housing Units | 12 | 15.4% |
| Total Occupied Housing Units | 78 | 100.0% |
Occupancy by Household Size in Iron Belt
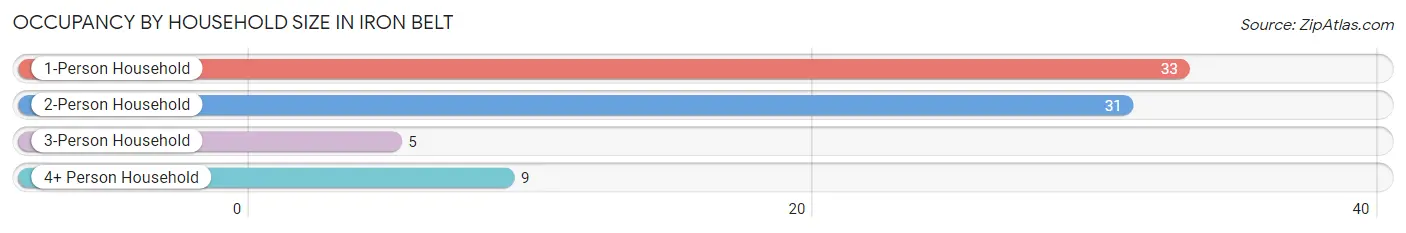
| Household Size | # Housing Units | % Housing Units |
| 1-Person Household | 33 | 42.3% |
| 2-Person Household | 31 | 39.7% |
| 3-Person Household | 5 | 6.4% |
| 4+ Person Household | 9 | 11.5% |
| Total Housing Units | 78 | 100.0% |
Occupancy by Ownership by Household Size in Iron Belt
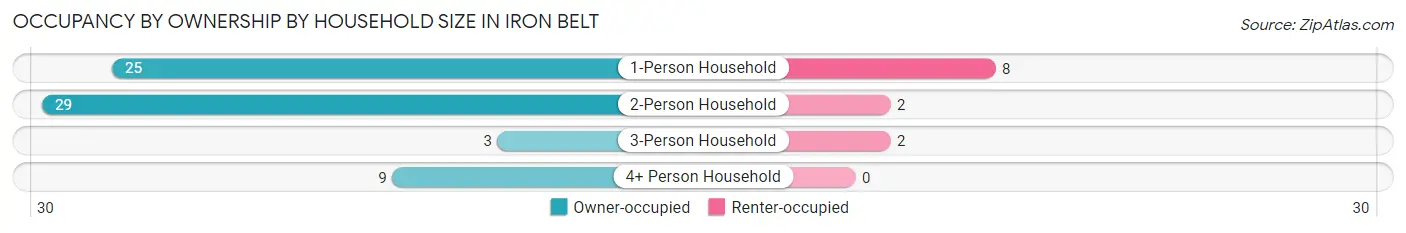
| Household Size | Owner-occupied | Renter-occupied |
| 1-Person Household | 25 (75.8%) | 8 (24.2%) |
| 2-Person Household | 29 (93.5%) | 2 (6.5%) |
| 3-Person Household | 3 (60.0%) | 2 (40.0%) |
| 4+ Person Household | 9 (100.0%) | 0 (0.0%) |
| Total Housing Units | 66 (84.6%) | 12 (15.4%) |
Occupancy by Educational Attainment in Iron Belt
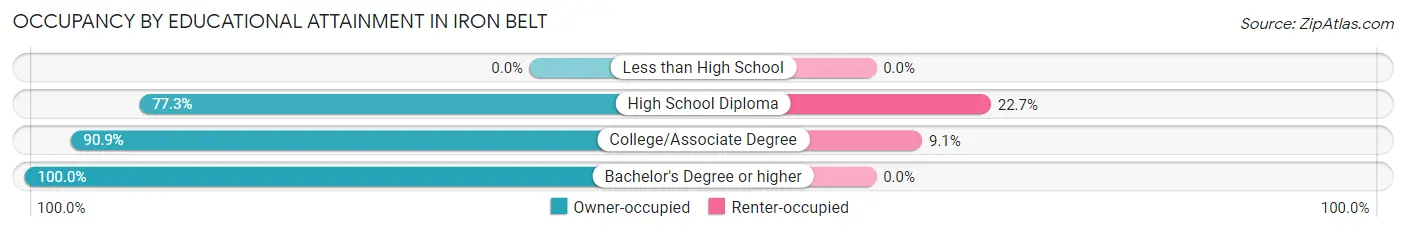
| Household Size | Owner-occupied | Renter-occupied |
| Less than High School | 0 (0.0%) | 0 (0.0%) |
| High School Diploma | 34 (77.3%) | 10 (22.7%) |
| College/Associate Degree | 20 (90.9%) | 2 (9.1%) |
| Bachelor's Degree or higher | 12 (100.0%) | 0 (0.0%) |
Occupancy by Age of Householder in Iron Belt
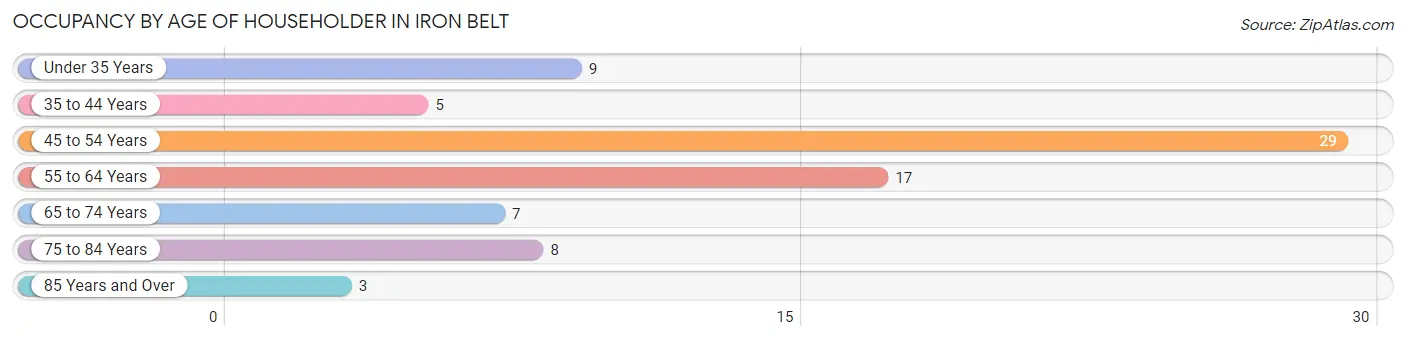
| Age Bracket | # Households | % Households |
| Under 35 Years | 9 | 11.5% |
| 35 to 44 Years | 5 | 6.4% |
| 45 to 54 Years | 29 | 37.2% |
| 55 to 64 Years | 17 | 21.8% |
| 65 to 74 Years | 7 | 9.0% |
| 75 to 84 Years | 8 | 10.3% |
| 85 Years and Over | 3 | 3.8% |
| Total | 78 | 100.0% |
Housing Finances in Iron Belt
Median Income by Occupancy in Iron Belt
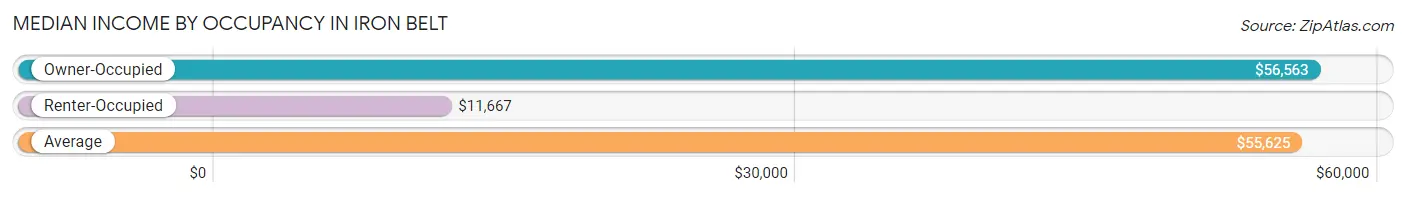
| Occupancy Type | # Households | Median Income |
| Owner-Occupied | 66 (84.6%) | $56,563 |
| Renter-Occupied | 12 (15.4%) | $11,667 |
| Average | 78 (100.0%) | $55,625 |
Occupancy by Householder Income Bracket in Iron Belt
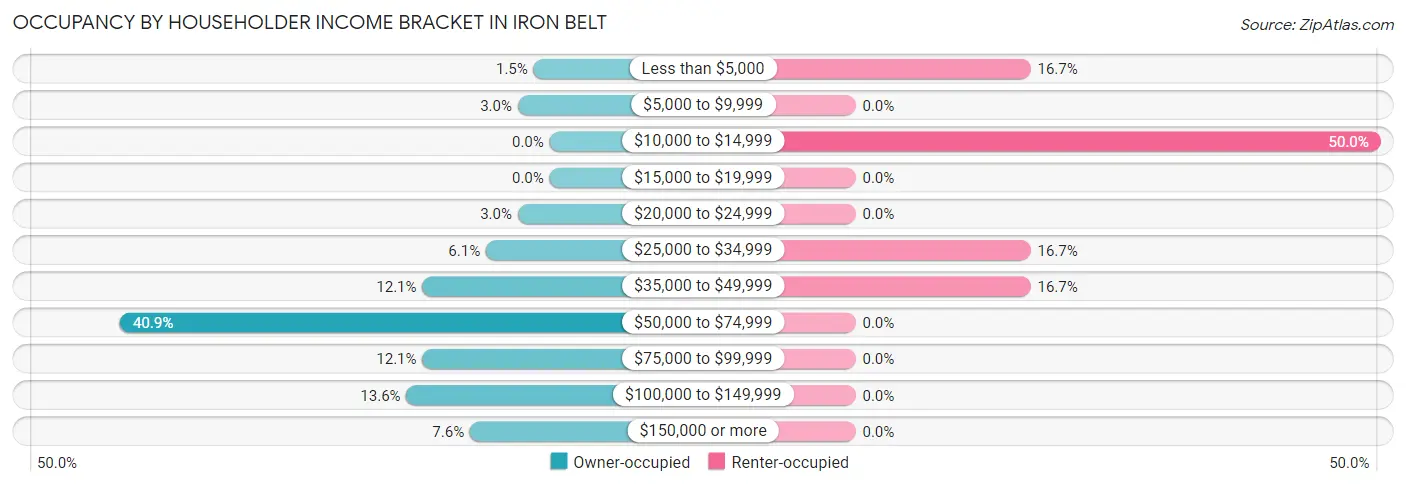
| Income Bracket | Owner-occupied | Renter-occupied |
| Less than $5,000 | 1 (1.5%) | 2 (16.7%) |
| $5,000 to $9,999 | 2 (3.0%) | 0 (0.0%) |
| $10,000 to $14,999 | 0 (0.0%) | 6 (50.0%) |
| $15,000 to $19,999 | 0 (0.0%) | 0 (0.0%) |
| $20,000 to $24,999 | 2 (3.0%) | 0 (0.0%) |
| $25,000 to $34,999 | 4 (6.1%) | 2 (16.7%) |
| $35,000 to $49,999 | 8 (12.1%) | 2 (16.7%) |
| $50,000 to $74,999 | 27 (40.9%) | 0 (0.0%) |
| $75,000 to $99,999 | 8 (12.1%) | 0 (0.0%) |
| $100,000 to $149,999 | 9 (13.6%) | 0 (0.0%) |
| $150,000 or more | 5 (7.6%) | 0 (0.0%) |
| Total | 66 (100.0%) | 12 (100.0%) |
Monthly Housing Cost Tiers in Iron Belt
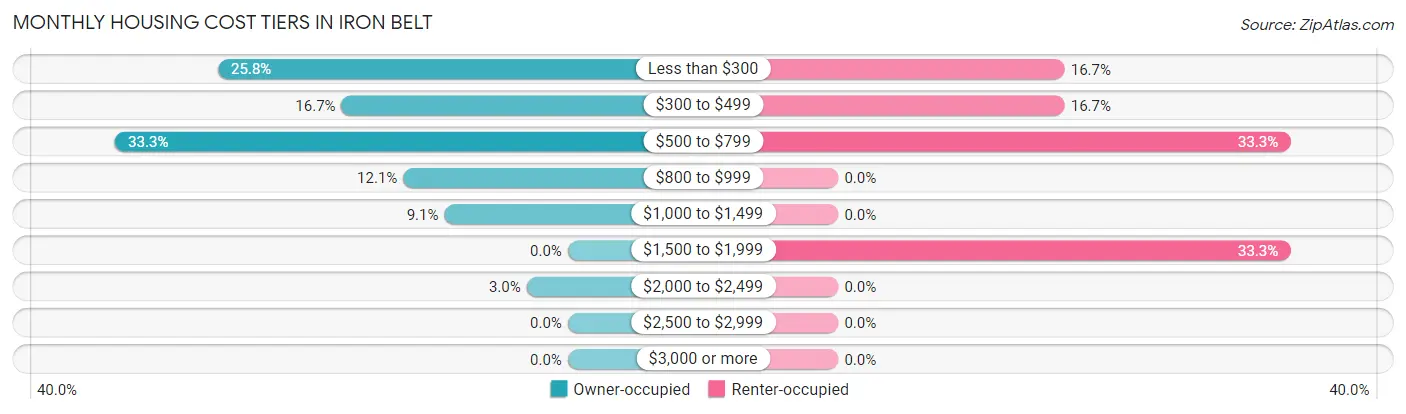
| Monthly Cost | Owner-occupied | Renter-occupied |
| Less than $300 | 17 (25.8%) | 2 (16.7%) |
| $300 to $499 | 11 (16.7%) | 2 (16.7%) |
| $500 to $799 | 22 (33.3%) | 4 (33.3%) |
| $800 to $999 | 8 (12.1%) | 0 (0.0%) |
| $1,000 to $1,499 | 6 (9.1%) | 0 (0.0%) |
| $1,500 to $1,999 | 0 (0.0%) | 4 (33.3%) |
| $2,000 to $2,499 | 2 (3.0%) | 0 (0.0%) |
| $2,500 to $2,999 | 0 (0.0%) | 0 (0.0%) |
| $3,000 or more | 0 (0.0%) | 0 (0.0%) |
| Total | 66 (100.0%) | 12 (100.0%) |
Physical Housing Characteristics in Iron Belt
Housing Structures in Iron Belt
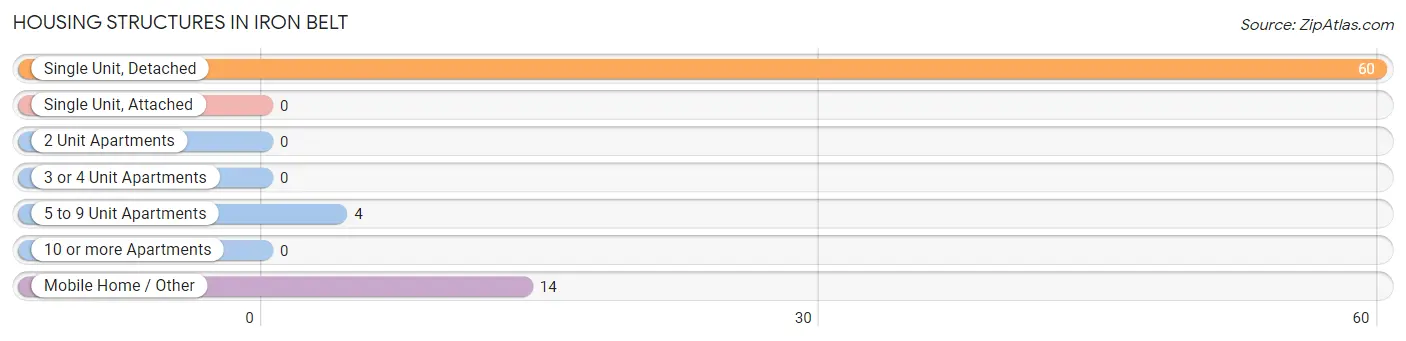
| Structure Type | # Housing Units | % Housing Units |
| Single Unit, Detached | 60 | 76.9% |
| Single Unit, Attached | 0 | 0.0% |
| 2 Unit Apartments | 0 | 0.0% |
| 3 or 4 Unit Apartments | 0 | 0.0% |
| 5 to 9 Unit Apartments | 4 | 5.1% |
| 10 or more Apartments | 0 | 0.0% |
| Mobile Home / Other | 14 | 17.9% |
| Total | 78 | 100.0% |
Housing Structures by Occupancy in Iron Belt
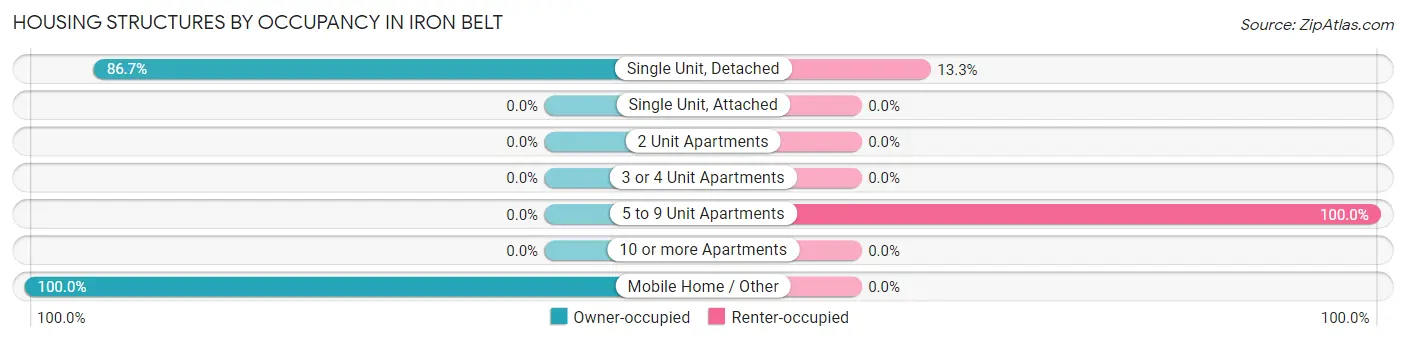
| Structure Type | Owner-occupied | Renter-occupied |
| Single Unit, Detached | 52 (86.7%) | 8 (13.3%) |
| Single Unit, Attached | 0 (0.0%) | 0 (0.0%) |
| 2 Unit Apartments | 0 (0.0%) | 0 (0.0%) |
| 3 or 4 Unit Apartments | 0 (0.0%) | 0 (0.0%) |
| 5 to 9 Unit Apartments | 0 (0.0%) | 4 (100.0%) |
| 10 or more Apartments | 0 (0.0%) | 0 (0.0%) |
| Mobile Home / Other | 14 (100.0%) | 0 (0.0%) |
| Total | 66 (84.6%) | 12 (15.4%) |
Housing Structures by Number of Rooms in Iron Belt
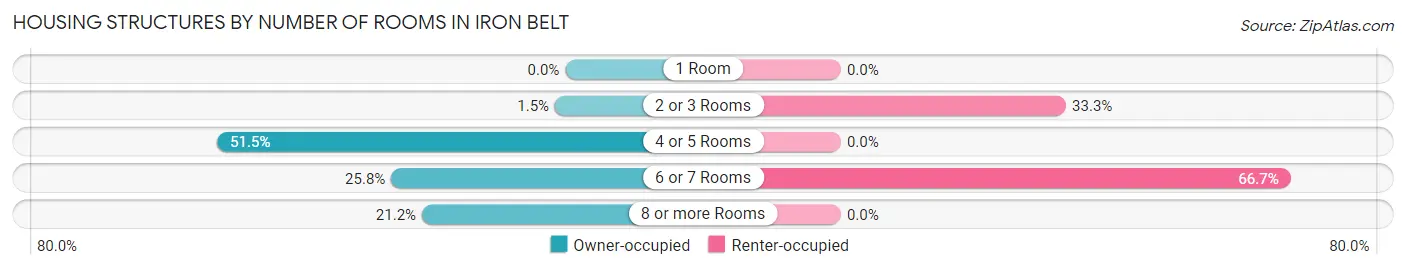
| Number of Rooms | Owner-occupied | Renter-occupied |
| 1 Room | 0 (0.0%) | 0 (0.0%) |
| 2 or 3 Rooms | 1 (1.5%) | 4 (33.3%) |
| 4 or 5 Rooms | 34 (51.5%) | 0 (0.0%) |
| 6 or 7 Rooms | 17 (25.8%) | 8 (66.7%) |
| 8 or more Rooms | 14 (21.2%) | 0 (0.0%) |
| Total | 66 (100.0%) | 12 (100.0%) |
Housing Structure by Heating Type in Iron Belt
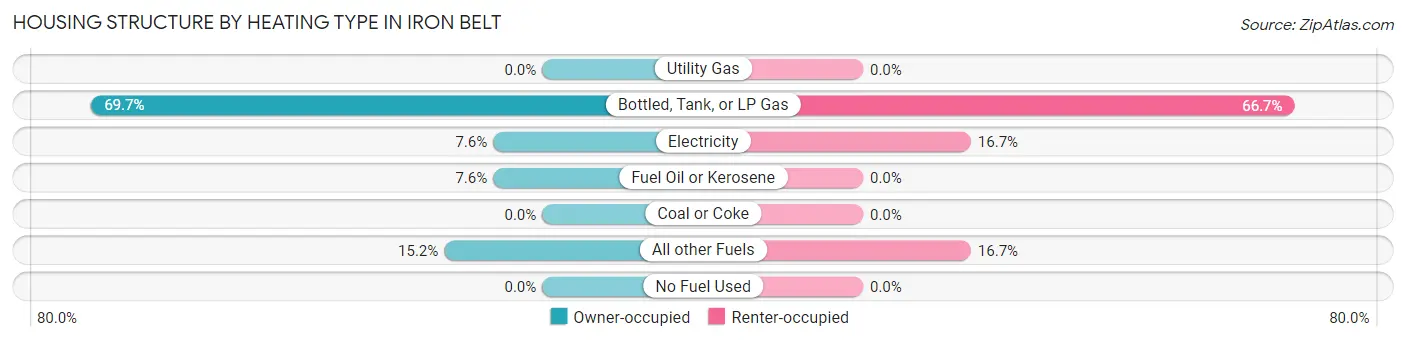
| Heating Type | Owner-occupied | Renter-occupied |
| Utility Gas | 0 (0.0%) | 0 (0.0%) |
| Bottled, Tank, or LP Gas | 46 (69.7%) | 8 (66.7%) |
| Electricity | 5 (7.6%) | 2 (16.7%) |
| Fuel Oil or Kerosene | 5 (7.6%) | 0 (0.0%) |
| Coal or Coke | 0 (0.0%) | 0 (0.0%) |
| All other Fuels | 10 (15.1%) | 2 (16.7%) |
| No Fuel Used | 0 (0.0%) | 0 (0.0%) |
| Total | 66 (100.0%) | 12 (100.0%) |
Household Vehicle Usage in Iron Belt
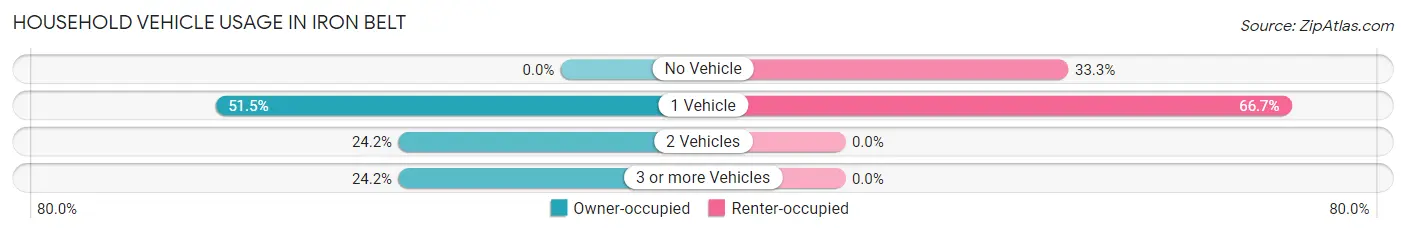
| Vehicles per Household | Owner-occupied | Renter-occupied |
| No Vehicle | 0 (0.0%) | 4 (33.3%) |
| 1 Vehicle | 34 (51.5%) | 8 (66.7%) |
| 2 Vehicles | 16 (24.2%) | 0 (0.0%) |
| 3 or more Vehicles | 16 (24.2%) | 0 (0.0%) |
| Total | 66 (100.0%) | 12 (100.0%) |
Real Estate & Mortgages in Iron Belt
Real Estate and Mortgage Overview in Iron Belt
| Characteristic | Without Mortgage | With Mortgage |
| Housing Units | 41 | 25 |
| Median Property Value | - | - |
| Median Household Income | $56,484 | $3 |
| Monthly Housing Costs | $406 | $0 |
| Real Estate Taxes | - | - |
Property Value by Mortgage Status in Iron Belt
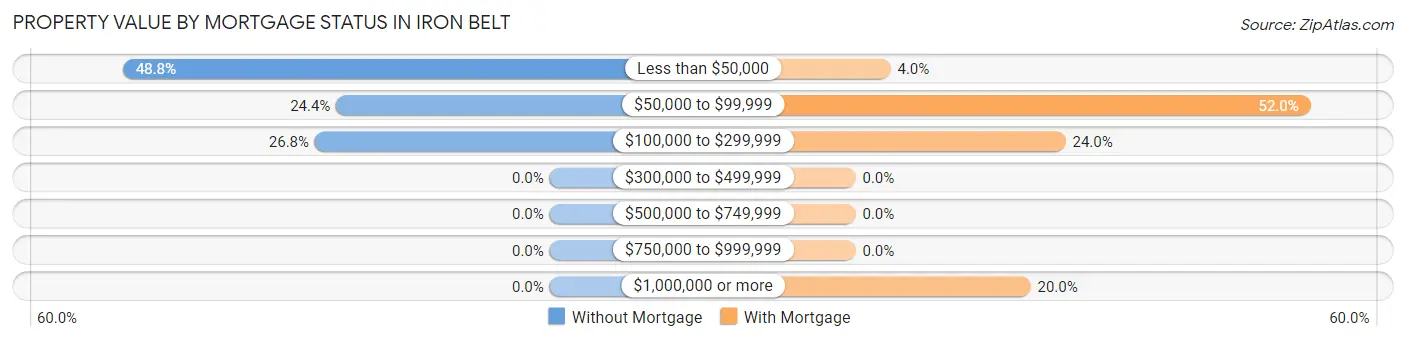
| Property Value | Without Mortgage | With Mortgage |
| Less than $50,000 | 20 (48.8%) | 1 (4.0%) |
| $50,000 to $99,999 | 10 (24.4%) | 13 (52.0%) |
| $100,000 to $299,999 | 11 (26.8%) | 6 (24.0%) |
| $300,000 to $499,999 | 0 (0.0%) | 0 (0.0%) |
| $500,000 to $749,999 | 0 (0.0%) | 0 (0.0%) |
| $750,000 to $999,999 | 0 (0.0%) | 0 (0.0%) |
| $1,000,000 or more | 0 (0.0%) | 5 (20.0%) |
| Total | 41 (100.0%) | 25 (100.0%) |
Household Income by Mortgage Status in Iron Belt
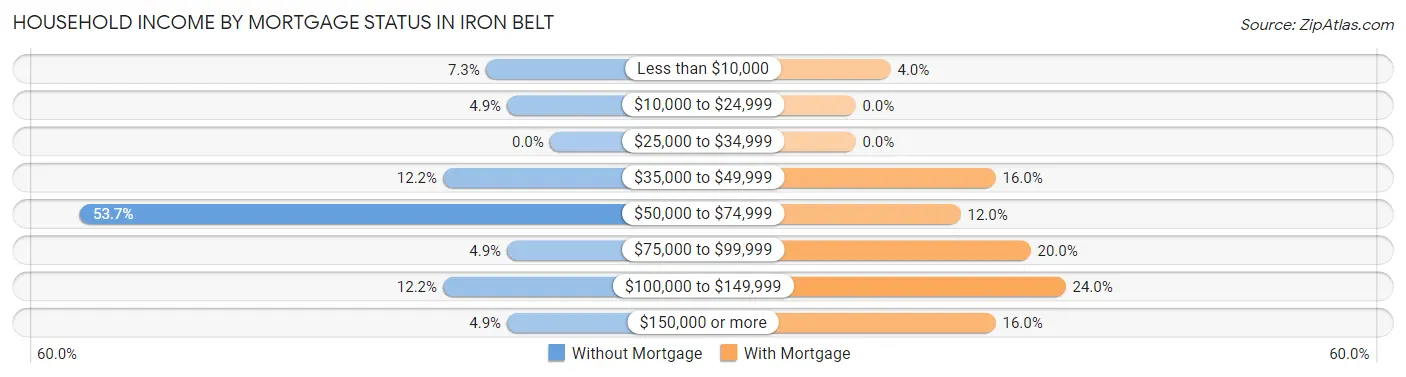
| Household Income | Without Mortgage | With Mortgage |
| Less than $10,000 | 3 (7.3%) | 1 (4.0%) |
| $10,000 to $24,999 | 2 (4.9%) | 0 (0.0%) |
| $25,000 to $34,999 | 0 (0.0%) | 0 (0.0%) |
| $35,000 to $49,999 | 5 (12.2%) | 4 (16.0%) |
| $50,000 to $74,999 | 22 (53.7%) | 3 (12.0%) |
| $75,000 to $99,999 | 2 (4.9%) | 5 (20.0%) |
| $100,000 to $149,999 | 5 (12.2%) | 6 (24.0%) |
| $150,000 or more | 2 (4.9%) | 4 (16.0%) |
| Total | 41 (100.0%) | 25 (100.0%) |
Property Value to Household Income Ratio in Iron Belt
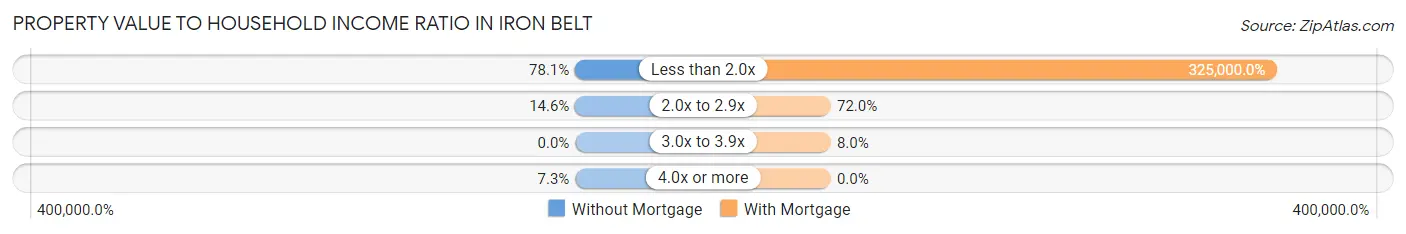
| Value-to-Income Ratio | Without Mortgage | With Mortgage |
| Less than 2.0x | 32 (78.0%) | 81,250 (325,000.0%) |
| 2.0x to 2.9x | 6 (14.6%) | 18 (72.0%) |
| 3.0x to 3.9x | 0 (0.0%) | 2 (8.0%) |
| 4.0x or more | 3 (7.3%) | 0 (0.0%) |
| Total | 41 (100.0%) | 25 (100.0%) |
Real Estate Taxes by Mortgage Status in Iron Belt
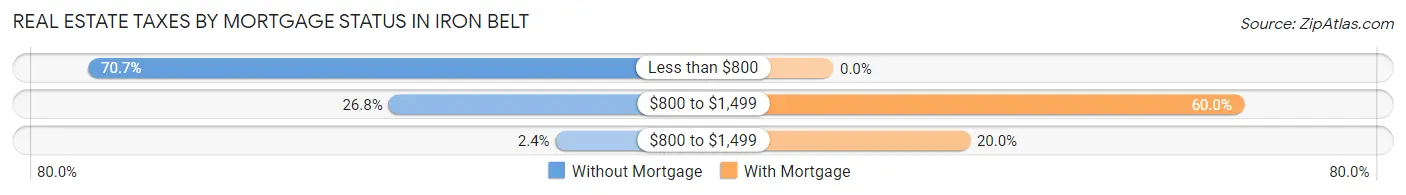
| Property Taxes | Without Mortgage | With Mortgage |
| Less than $800 | 29 (70.7%) | 0 (0.0%) |
| $800 to $1,499 | 11 (26.8%) | 15 (60.0%) |
| $800 to $1,499 | 1 (2.4%) | 5 (20.0%) |
| Total | 41 (100.0%) | 25 (100.0%) |
Health & Disability in Iron Belt
Health Insurance Coverage by Age in Iron Belt
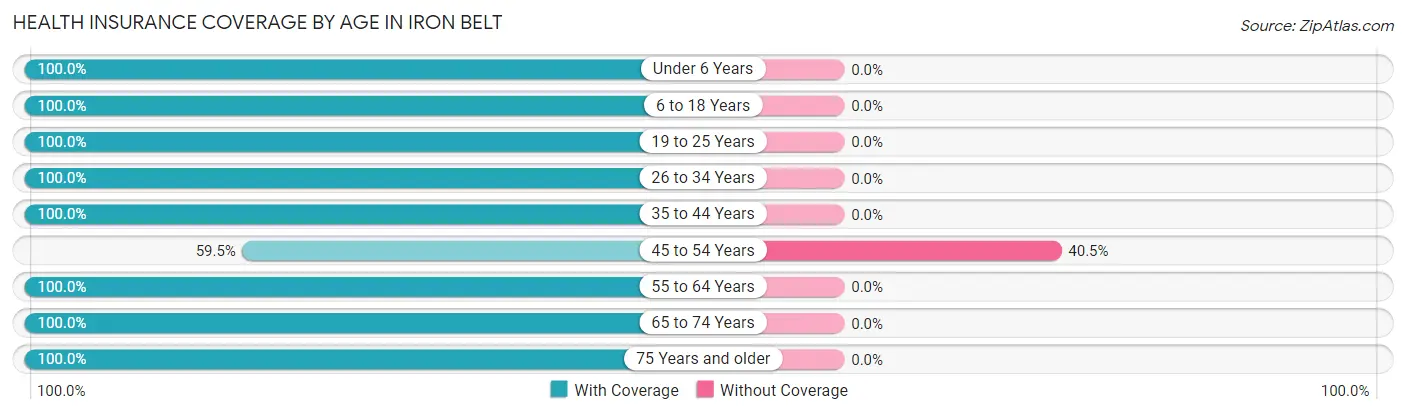
| Age Bracket | With Coverage | Without Coverage |
| Under 6 Years | 10 (100.0%) | 0 (0.0%) |
| 6 to 18 Years | 27 (100.0%) | 0 (0.0%) |
| 19 to 25 Years | 11 (100.0%) | 0 (0.0%) |
| 26 to 34 Years | 15 (100.0%) | 0 (0.0%) |
| 35 to 44 Years | 7 (100.0%) | 0 (0.0%) |
| 45 to 54 Years | 25 (59.5%) | 17 (40.5%) |
| 55 to 64 Years | 20 (100.0%) | 0 (0.0%) |
| 65 to 74 Years | 16 (100.0%) | 0 (0.0%) |
| 75 Years and older | 26 (100.0%) | 0 (0.0%) |
| Total | 157 (90.2%) | 17 (9.8%) |
Health Insurance Coverage by Citizenship Status in Iron Belt
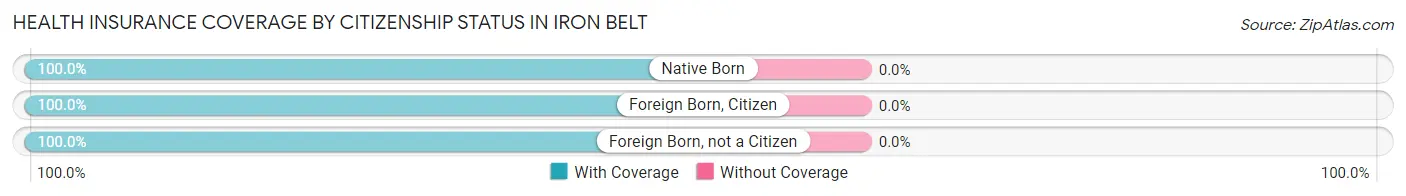
| Citizenship Status | With Coverage | Without Coverage |
| Native Born | 10 (100.0%) | 0 (0.0%) |
| Foreign Born, Citizen | 27 (100.0%) | 0 (0.0%) |
| Foreign Born, not a Citizen | 11 (100.0%) | 0 (0.0%) |
Health Insurance Coverage by Household Income in Iron Belt
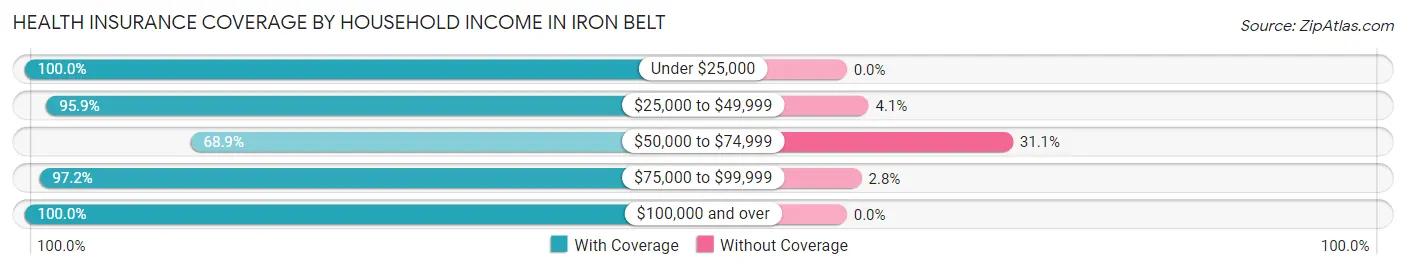
| Household Income | With Coverage | Without Coverage |
| Under $25,000 | 14 (100.0%) | 0 (0.0%) |
| $25,000 to $49,999 | 47 (95.9%) | 2 (4.1%) |
| $50,000 to $74,999 | 31 (68.9%) | 14 (31.1%) |
| $75,000 to $99,999 | 35 (97.2%) | 1 (2.8%) |
| $100,000 and over | 30 (100.0%) | 0 (0.0%) |
Public vs Private Health Insurance Coverage by Age in Iron Belt
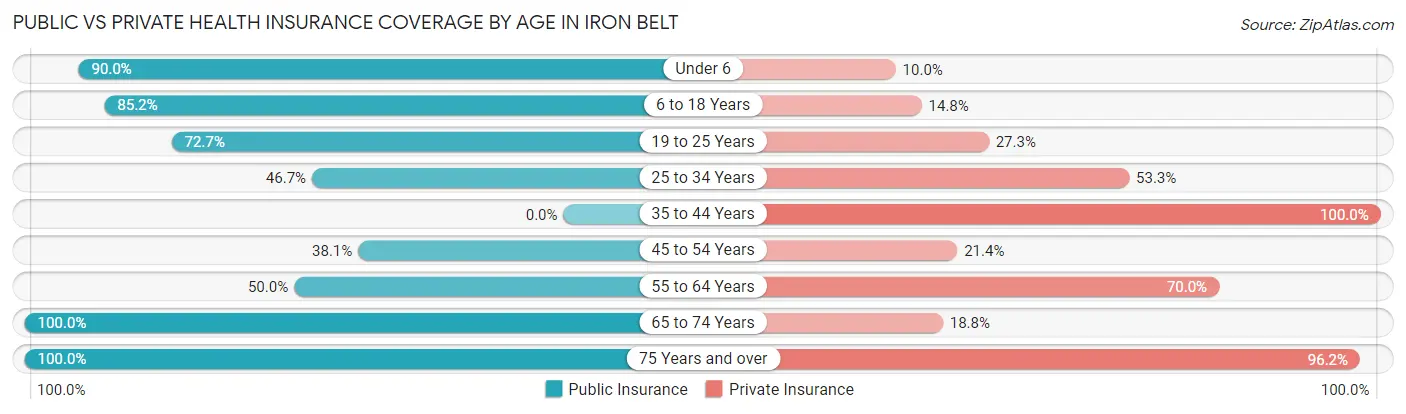
| Age Bracket | Public Insurance | Private Insurance |
| Under 6 | 9 (90.0%) | 1 (10.0%) |
| 6 to 18 Years | 23 (85.2%) | 4 (14.8%) |
| 19 to 25 Years | 8 (72.7%) | 3 (27.3%) |
| 25 to 34 Years | 7 (46.7%) | 8 (53.3%) |
| 35 to 44 Years | 0 (0.0%) | 7 (100.0%) |
| 45 to 54 Years | 16 (38.1%) | 9 (21.4%) |
| 55 to 64 Years | 10 (50.0%) | 14 (70.0%) |
| 65 to 74 Years | 16 (100.0%) | 3 (18.8%) |
| 75 Years and over | 26 (100.0%) | 25 (96.2%) |
| Total | 115 (66.1%) | 74 (42.5%) |
Disability Status by Sex by Age in Iron Belt
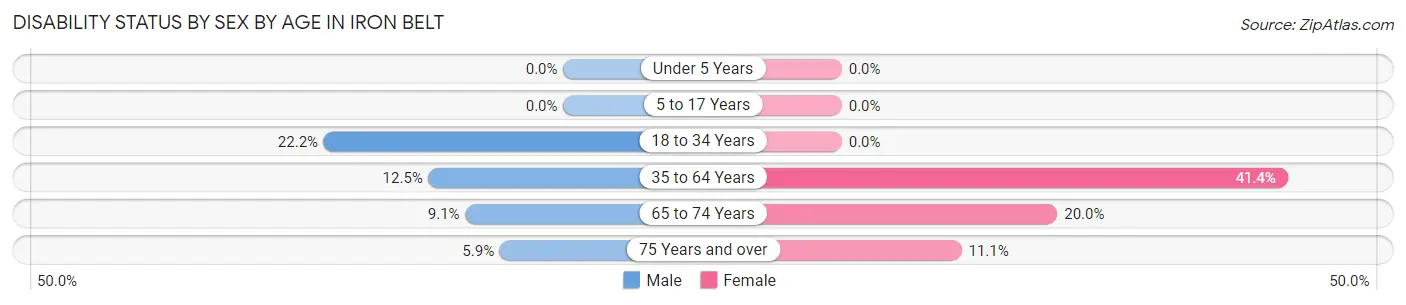
| Age Bracket | Male | Female |
| Under 5 Years | 0 (0.0%) | 0 (0.0%) |
| 5 to 17 Years | 0 (0.0%) | 0 (0.0%) |
| 18 to 34 Years | 2 (22.2%) | 0 (0.0%) |
| 35 to 64 Years | 5 (12.5%) | 12 (41.4%) |
| 65 to 74 Years | 1 (9.1%) | 1 (20.0%) |
| 75 Years and over | 1 (5.9%) | 1 (11.1%) |
Disability Class by Sex by Age in Iron Belt
Disability Class: Hearing Difficulty
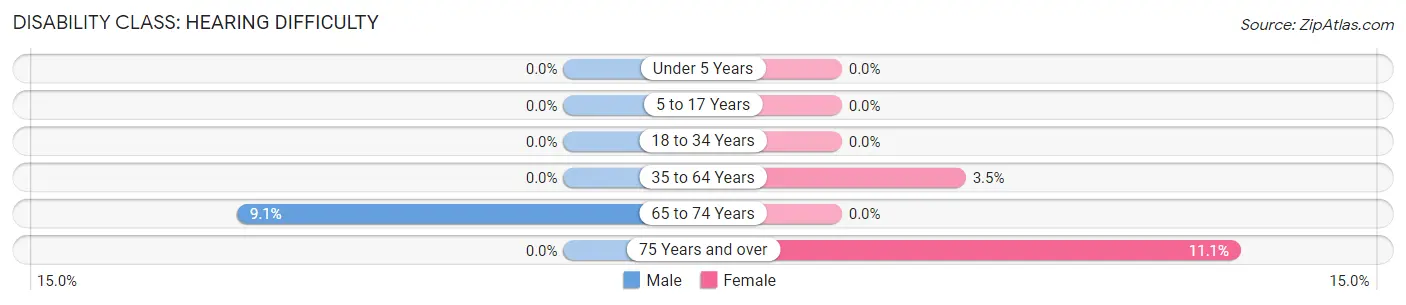
| Age Bracket | Male | Female |
| Under 5 Years | 0 (0.0%) | 0 (0.0%) |
| 5 to 17 Years | 0 (0.0%) | 0 (0.0%) |
| 18 to 34 Years | 0 (0.0%) | 0 (0.0%) |
| 35 to 64 Years | 0 (0.0%) | 1 (3.5%) |
| 65 to 74 Years | 1 (9.1%) | 0 (0.0%) |
| 75 Years and over | 0 (0.0%) | 1 (11.1%) |
Disability Class: Vision Difficulty
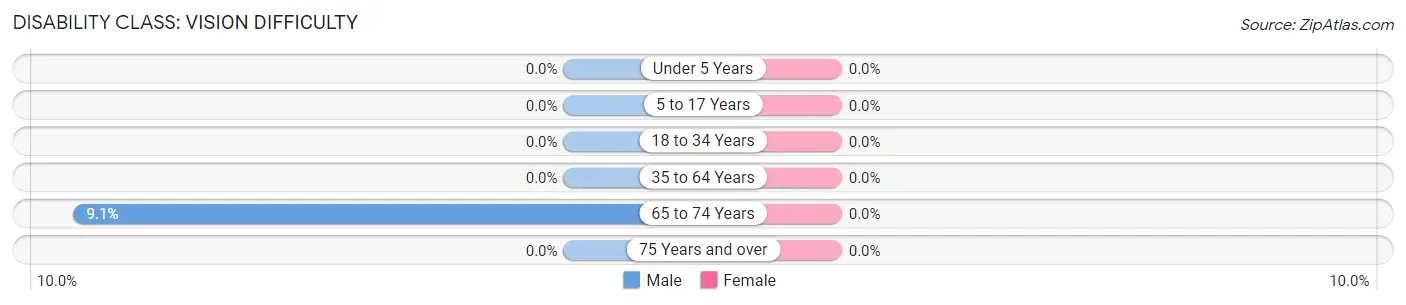
| Age Bracket | Male | Female |
| Under 5 Years | 0 (0.0%) | 0 (0.0%) |
| 5 to 17 Years | 0 (0.0%) | 0 (0.0%) |
| 18 to 34 Years | 0 (0.0%) | 0 (0.0%) |
| 35 to 64 Years | 0 (0.0%) | 0 (0.0%) |
| 65 to 74 Years | 1 (9.1%) | 0 (0.0%) |
| 75 Years and over | 0 (0.0%) | 0 (0.0%) |
Disability Class: Cognitive Difficulty
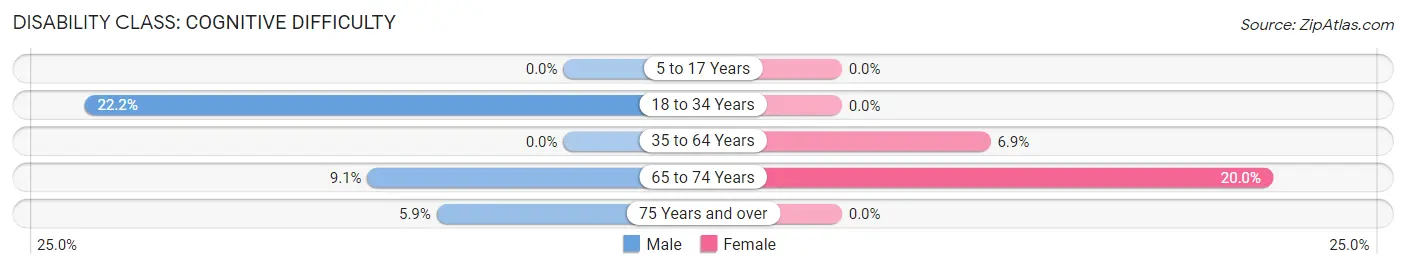
| Age Bracket | Male | Female |
| 5 to 17 Years | 0 (0.0%) | 0 (0.0%) |
| 18 to 34 Years | 2 (22.2%) | 0 (0.0%) |
| 35 to 64 Years | 0 (0.0%) | 2 (6.9%) |
| 65 to 74 Years | 1 (9.1%) | 1 (20.0%) |
| 75 Years and over | 1 (5.9%) | 0 (0.0%) |
Disability Class: Ambulatory Difficulty
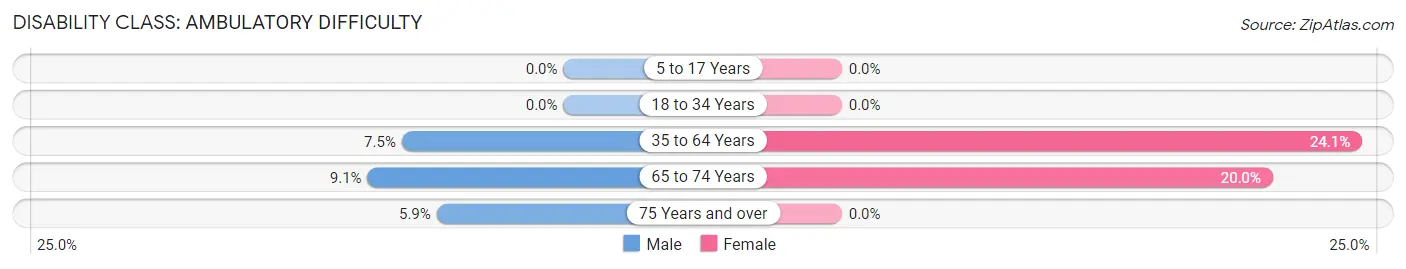
| Age Bracket | Male | Female |
| 5 to 17 Years | 0 (0.0%) | 0 (0.0%) |
| 18 to 34 Years | 0 (0.0%) | 0 (0.0%) |
| 35 to 64 Years | 3 (7.5%) | 7 (24.1%) |
| 65 to 74 Years | 1 (9.1%) | 1 (20.0%) |
| 75 Years and over | 1 (5.9%) | 0 (0.0%) |
Disability Class: Self-Care Difficulty
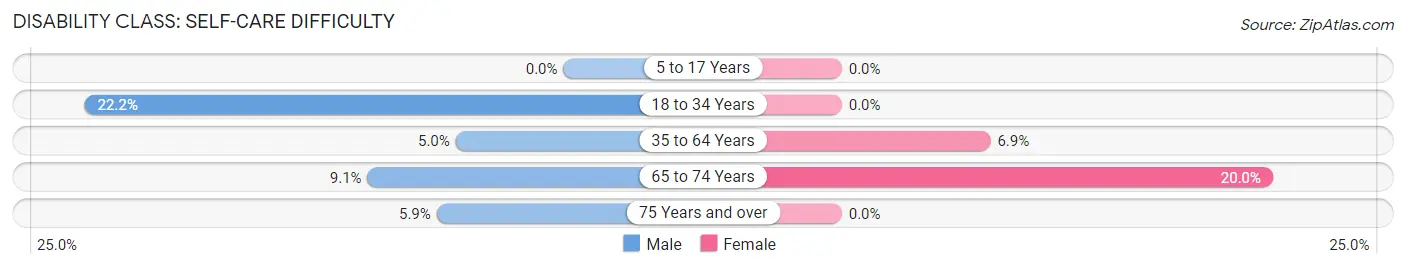
| Age Bracket | Male | Female |
| 5 to 17 Years | 0 (0.0%) | 0 (0.0%) |
| 18 to 34 Years | 2 (22.2%) | 0 (0.0%) |
| 35 to 64 Years | 2 (5.0%) | 2 (6.9%) |
| 65 to 74 Years | 1 (9.1%) | 1 (20.0%) |
| 75 Years and over | 1 (5.9%) | 0 (0.0%) |
Technology Access in Iron Belt
Computing Device Access in Iron Belt
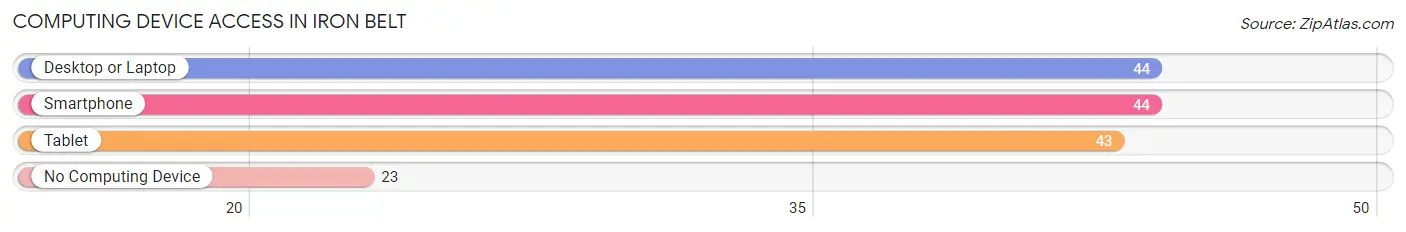
| Device Type | # Households | % Households |
| Desktop or Laptop | 44 | 56.4% |
| Smartphone | 44 | 56.4% |
| Tablet | 43 | 55.1% |
| No Computing Device | 23 | 29.5% |
| Total | 78 | 100.0% |
Internet Access in Iron Belt
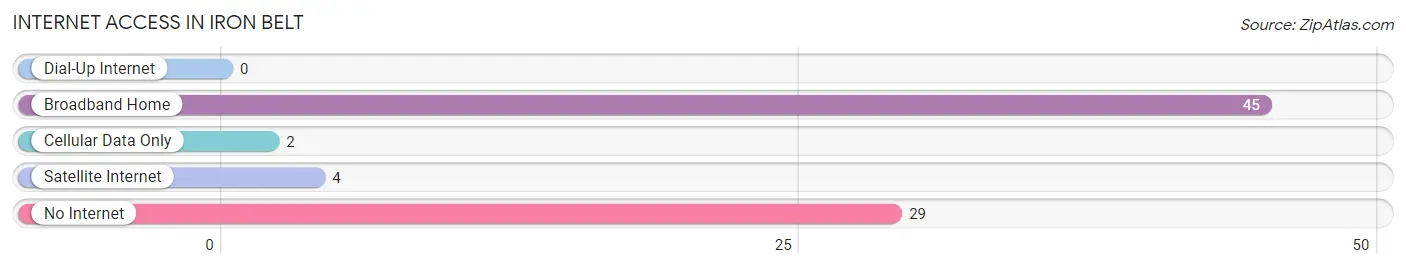
| Internet Type | # Households | % Households |
| Dial-Up Internet | 0 | 0.0% |
| Broadband Home | 45 | 57.7% |
| Cellular Data Only | 2 | 2.6% |
| Satellite Internet | 4 | 5.1% |
| No Internet | 29 | 37.2% |
| Total | 78 | 100.0% |
Iron Belt Summary
Iron Belt is a small unincorporated community located in Iron County, Wisconsin, United States. It is situated in the northern part of the state, near the border with Michigan's Upper Peninsula. The population of Iron Belt was estimated to be around 200 people in 2020.
Geography
Iron Belt is located in the northern part of Wisconsin, near the border with Michigan's Upper Peninsula. It is situated in Iron County, which is part of the larger Gogebic Range region. The community is located on the Iron River, which is a tributary of the Montreal River. The Iron River is a popular destination for fishing, canoeing, and kayaking. The Iron Belt area is also home to several lakes, including Iron Lake, which is the largest lake in the county.
The Iron Belt area is characterized by its rugged terrain, with steep hills and deep valleys. The area is heavily forested, with a mix of coniferous and deciduous trees. The climate in Iron Belt is generally cold and snowy in the winter, with temperatures often dropping below zero. Summers are mild and pleasant, with temperatures typically in the mid-70s.
History
Iron Belt was first settled in the late 19th century by Finnish immigrants. The area was originally known as "Finn Town" and was home to a large Finnish-American population. The community was officially incorporated in 1891 and was named after the Iron River, which runs through the area.
The Iron Belt area was an important mining center in the early 20th century. Iron ore was mined in the area, and the Iron Belt Mining Company was established in the early 1900s. The company operated several mines in the area, and the town of Iron Belt grew up around the mining operations.
The Iron Belt Mining Company closed in the 1950s, and the town's population began to decline. The area has since become a popular tourist destination, with many visitors coming to enjoy the area's natural beauty and outdoor activities.
Economy
The economy of Iron Belt is largely based on tourism. The area is a popular destination for outdoor activities such as fishing, hunting, and camping. The Iron River is a popular destination for canoeing and kayaking, and the area is also home to several lakes, including Iron Lake.
The Iron Belt area is also home to several small businesses, including a general store, a gas station, and a few restaurants. The Iron Belt Mining Company also operated a small sawmill in the area, which is now closed.
Demographics
The population of Iron Belt was estimated to be around 200 people in 2020. The majority of the population is of Finnish descent, and the town is home to a large Finnish-American community. The town is also home to a small Native American population, as well as a few other ethnic groups.
The median household income in Iron Belt is around $35,000, and the median home value is around $100,000. The town has a high rate of poverty, with around 25% of the population living below the poverty line. The unemployment rate in Iron Belt is also higher than the national average.
Common Questions
What is Per Capita Income in Iron Belt?
Per Capita income in Iron Belt is $32,829.
What is the Median Family Income in Iron Belt?
Median Family Income in Iron Belt is $54,792.
What is the Median Household income in Iron Belt?
Median Household Income in Iron Belt is $55,625.
What is Inequality or Gini Index in Iron Belt?
Inequality or Gini Index in Iron Belt is 0.39.
What is the Total Population of Iron Belt?
Total Population of Iron Belt is 174.
What is the Total Male Population of Iron Belt?
Total Male Population of Iron Belt is 97.
What is the Total Female Population of Iron Belt?
Total Female Population of Iron Belt is 77.
What is the Ratio of Males per 100 Females in Iron Belt?
There are 125.97 Males per 100 Females in Iron Belt.
What is the Ratio of Females per 100 Males in Iron Belt?
There are 79.38 Females per 100 Males in Iron Belt.
What is the Median Population Age in Iron Belt?
Median Population Age in Iron Belt is 47.5 Years.
What is the Average Family Size in Iron Belt
Average Family Size in Iron Belt is 3.3 People.
What is the Average Household Size in Iron Belt
Average Household Size in Iron Belt is 2.2 People.
How Large is the Labor Force in Iron Belt?
There are 76 People in the Labor Forcein in Iron Belt.
What is the Percentage of People in the Labor Force in Iron Belt?
52.1% of People are in the Labor Force in Iron Belt.
What is the Unemployment Rate in Iron Belt?
Unemployment Rate in Iron Belt is 2.6%.