Middle Village, WI Map & Demographics
Middle Village Map
Middle Village Overview
$14,176
PER CAPITA INCOME
$57,857
AVG FAMILY INCOME
$49,688
AVG HOUSEHOLD INCOME
70.0%
WAGE / INCOME GAP [ % ]
30.0¢/ $1
WAGE / INCOME GAP [ $ ]
0.20
INEQUALITY / GINI INDEX
173
TOTAL POPULATION
80
MALE POPULATION
93
FEMALE POPULATION
86.02
MALES / 100 FEMALES
116.25
FEMALES / 100 MALES
58.8
MEDIAN AGE
3.7
AVG FAMILY SIZE
3.4
AVG HOUSEHOLD SIZE
64
LABOR FORCE [ PEOPLE ]
49.2%
PERCENT IN LABOR FORCE
6.3%
UNEMPLOYMENT RATE
Income in Middle Village
Income Overview in Middle Village
Per Capita Income in Middle Village is $14,176, while median incomes of families and households are $57,857 and $49,688 respectively.
| Characteristic | Number | Measure |
| Per Capita Income | 173 | $14,176 |
| Median Family Income | 40 | $57,857 |
| Mean Family Income | 40 | $47,500 |
| Median Household Income | 49 | $49,688 |
| Mean Household Income | 49 | $46,678 |
| Income Deficit | 40 | $0 |
| Wage / Income Gap (%) | 173 | 69.95% |
| Wage / Income Gap ($) | 173 | 30.05¢ per $1 |
| Gini / Inequality Index | 173 | 0.20 |
Earnings by Sex in Middle Village
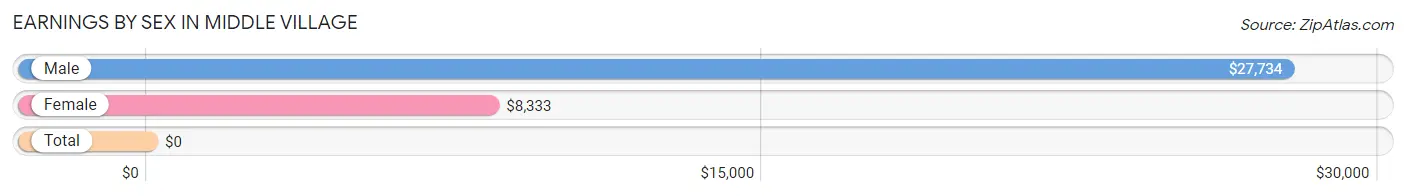
| Sex | Number | Average Earnings |
| Male | 33 (47.8%) | $27,734 |
| Female | 36 (52.2%) | $8,333 |
| Total | 69 (100.0%) | $0 |
Earnings by Sex by Income Bracket in Middle Village
The most common earnings brackets in Middle Village are $25,000 to $29,999 for men (16 | 48.5%) and $5,000 to $7,499 for women (9 | 25.0%).
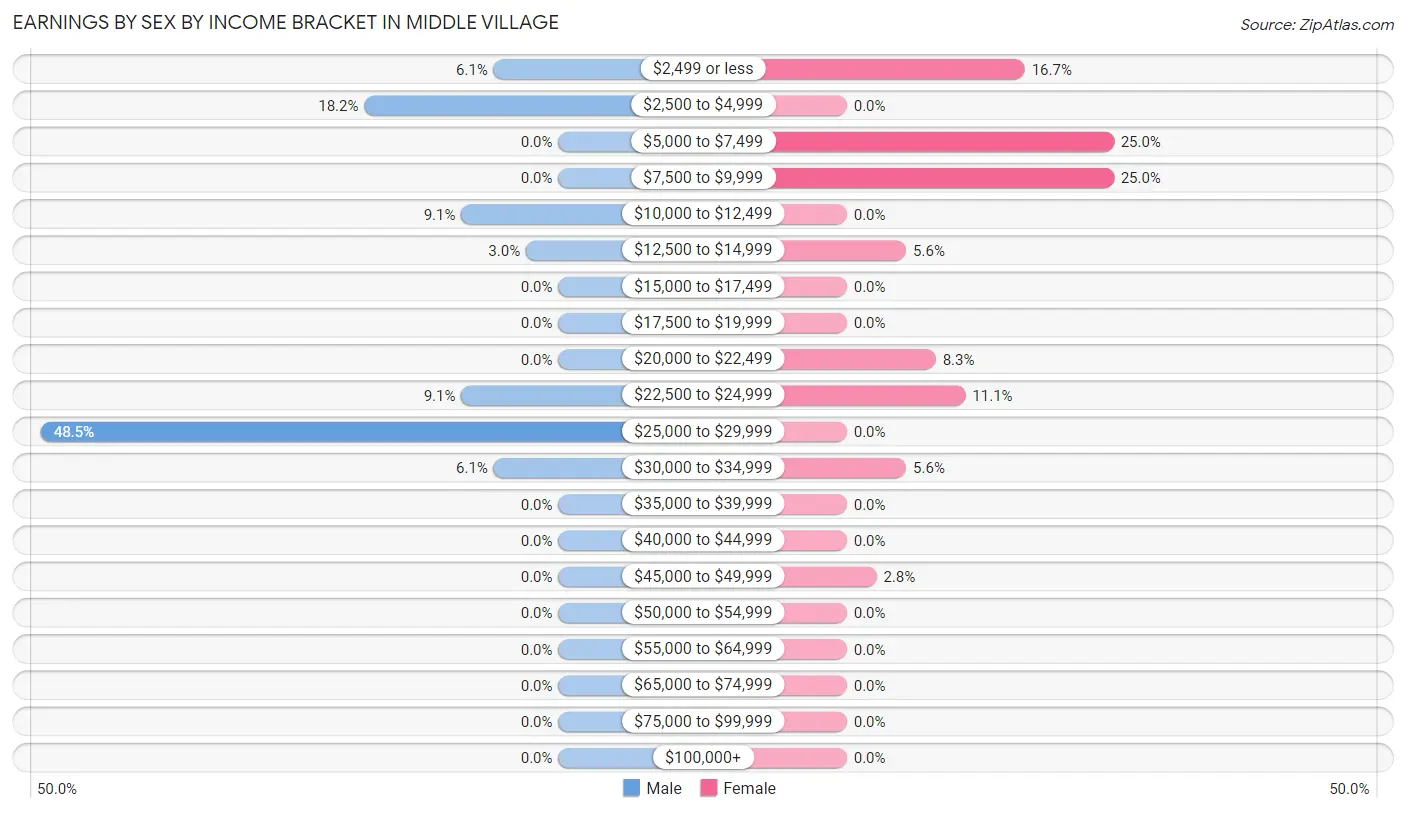
| Income | Male | Female |
| $2,499 or less | 2 (6.1%) | 6 (16.7%) |
| $2,500 to $4,999 | 6 (18.2%) | 0 (0.0%) |
| $5,000 to $7,499 | 0 (0.0%) | 9 (25.0%) |
| $7,500 to $9,999 | 0 (0.0%) | 9 (25.0%) |
| $10,000 to $12,499 | 3 (9.1%) | 0 (0.0%) |
| $12,500 to $14,999 | 1 (3.0%) | 2 (5.6%) |
| $15,000 to $17,499 | 0 (0.0%) | 0 (0.0%) |
| $17,500 to $19,999 | 0 (0.0%) | 0 (0.0%) |
| $20,000 to $22,499 | 0 (0.0%) | 3 (8.3%) |
| $22,500 to $24,999 | 3 (9.1%) | 4 (11.1%) |
| $25,000 to $29,999 | 16 (48.5%) | 0 (0.0%) |
| $30,000 to $34,999 | 2 (6.1%) | 2 (5.6%) |
| $35,000 to $39,999 | 0 (0.0%) | 0 (0.0%) |
| $40,000 to $44,999 | 0 (0.0%) | 0 (0.0%) |
| $45,000 to $49,999 | 0 (0.0%) | 1 (2.8%) |
| $50,000 to $54,999 | 0 (0.0%) | 0 (0.0%) |
| $55,000 to $64,999 | 0 (0.0%) | 0 (0.0%) |
| $65,000 to $74,999 | 0 (0.0%) | 0 (0.0%) |
| $75,000 to $99,999 | 0 (0.0%) | 0 (0.0%) |
| $100,000+ | 0 (0.0%) | 0 (0.0%) |
| Total | 33 (100.0%) | 36 (100.0%) |
Earnings by Sex by Educational Attainment in Middle Village
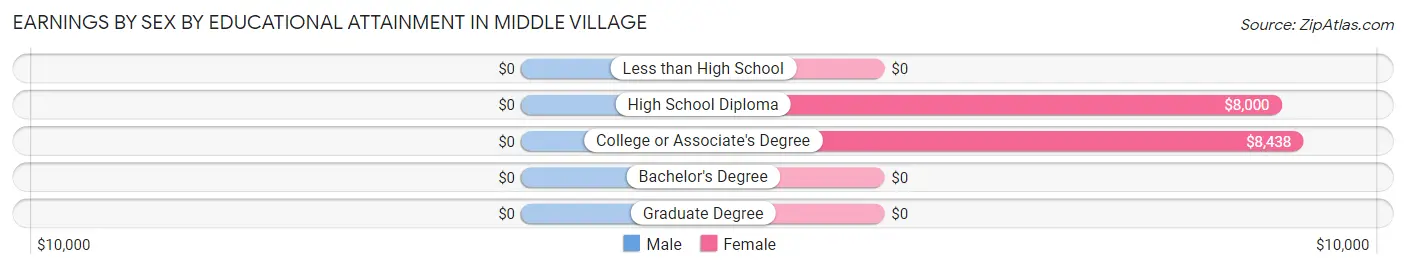
| Educational Attainment | Male Income | Female Income |
| Less than High School | - | - |
| High School Diploma | - | - |
| College or Associate's Degree | - | - |
| Bachelor's Degree | - | - |
| Graduate Degree | - | - |
| Total | $27,969 | $8,333 |
Family Income in Middle Village
Family Income Brackets in Middle Village
According to the Middle Village family income data, there are 24 families falling into the $50,000 to $74,999 income range, which is the most common income bracket and makes up 60.0% of all families.
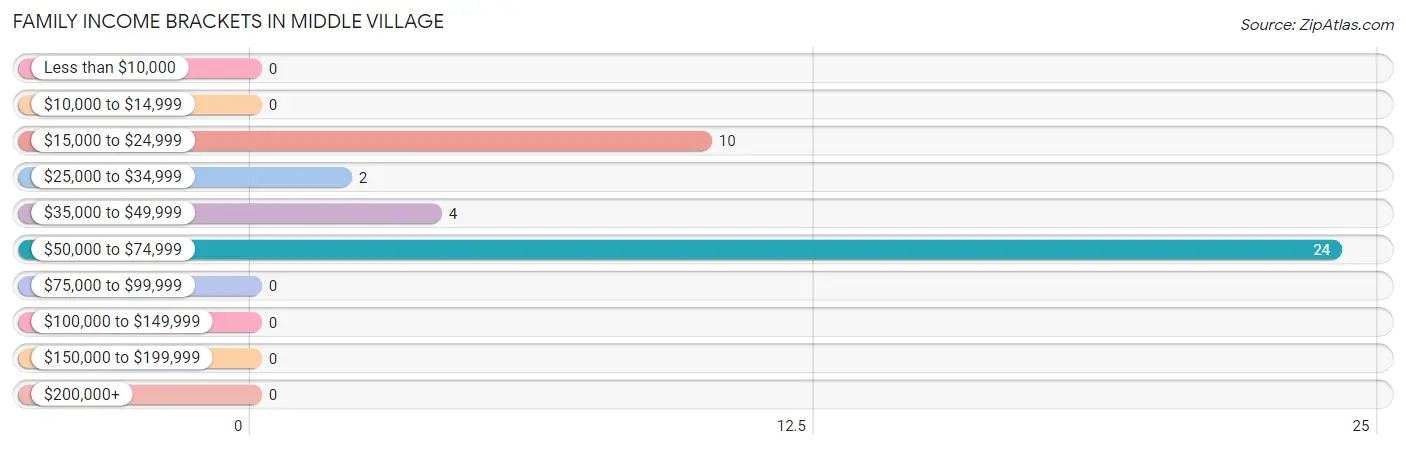
| Income Bracket | # Families | % Families |
| Less than $10,000 | 0 | 0.0% |
| $10,000 to $14,999 | 0 | 0.0% |
| $15,000 to $24,999 | 10 | 25.0% |
| $25,000 to $34,999 | 2 | 5.0% |
| $35,000 to $49,999 | 4 | 10.0% |
| $50,000 to $74,999 | 24 | 60.0% |
| $75,000 to $99,999 | 0 | 0.0% |
| $100,000 to $149,999 | 0 | 0.0% |
| $150,000 to $199,999 | 0 | 0.0% |
| $200,000+ | 0 | 0.0% |
Family Income by Famaliy Size in Middle Village
2-person families (26 | 65.0%) account for the highest median family income in Middle Village with $57,679 per family, while 2-person families (26 | 65.0%) have the highest median income of $28,840 per family member.
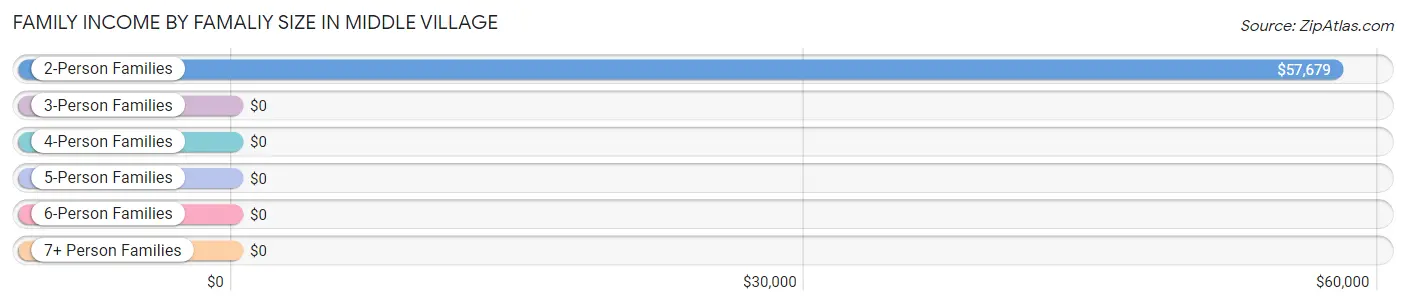
| Income Bracket | # Families | Median Income |
| 2-Person Families | 26 (65.0%) | $57,679 |
| 3-Person Families | 6 (15.0%) | $0 |
| 4-Person Families | 5 (12.5%) | $0 |
| 5-Person Families | 0 (0.0%) | $0 |
| 6-Person Families | 1 (2.5%) | $0 |
| 7+ Person Families | 2 (5.0%) | $0 |
| Total | 40 (100.0%) | $57,857 |
Family Income by Number of Earners in Middle Village
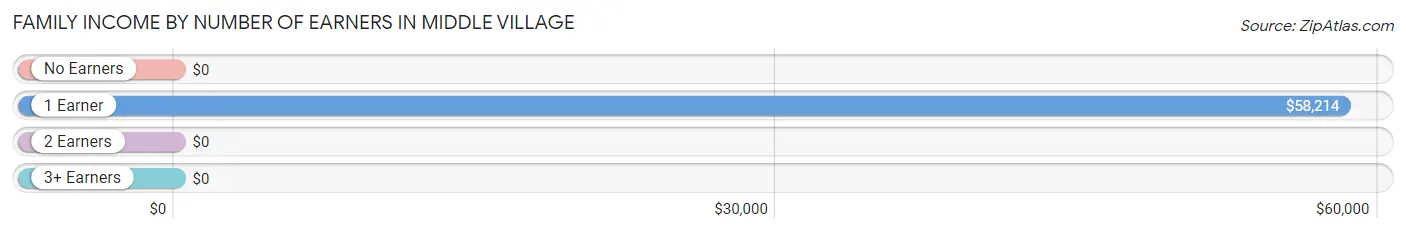
| Number of Earners | # Families | Median Income |
| No Earners | 11 (27.5%) | $0 |
| 1 Earner | 20 (50.0%) | $58,214 |
| 2 Earners | 4 (10.0%) | $0 |
| 3+ Earners | 5 (12.5%) | $0 |
| Total | 40 (100.0%) | $57,857 |
Household Income in Middle Village
Household Income Brackets in Middle Village
With 24 households falling in the category, the $50,000 to $74,999 income range is the most frequent in Middle Village, accounting for 49.0% of all households.
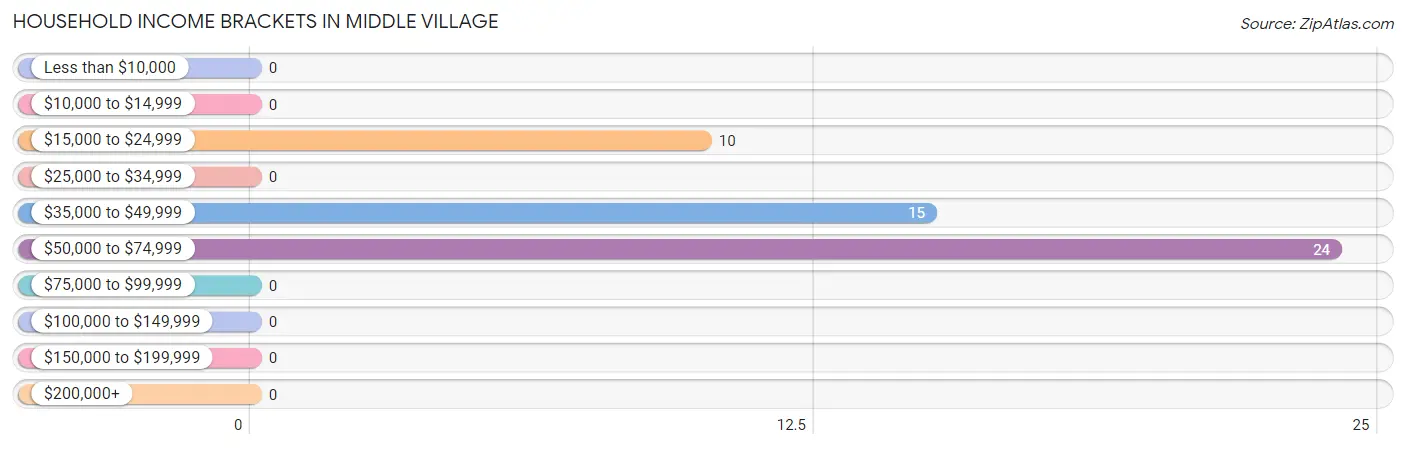
| Income Bracket | # Households | % Households |
| Less than $10,000 | 0 | 0.0% |
| $10,000 to $14,999 | 0 | 0.0% |
| $15,000 to $24,999 | 10 | 20.4% |
| $25,000 to $34,999 | 0 | 0.0% |
| $35,000 to $49,999 | 15 | 30.6% |
| $50,000 to $74,999 | 24 | 49.0% |
| $75,000 to $99,999 | 0 | 0.0% |
| $100,000 to $149,999 | 0 | 0.0% |
| $150,000 to $199,999 | 0 | 0.0% |
| $200,000+ | 0 | 0.0% |
Household Income by Householder Age in Middle Village
The median household income in Middle Village is $49,688, with the highest median household income of $57,857 found in the 65+ years age bracket for the primary householder. A total of 32 households (65.3%) fall into this category.
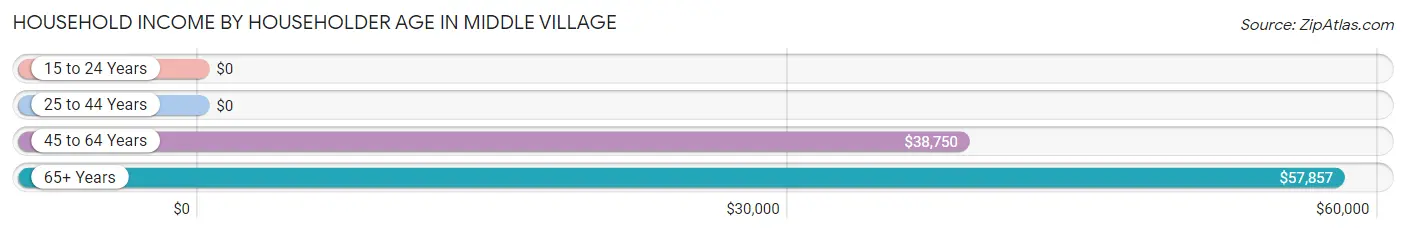
| Income Bracket | # Households | Median Income |
| 15 to 24 Years | 0 (0.0%) | $0 |
| 25 to 44 Years | 3 (6.1%) | $0 |
| 45 to 64 Years | 14 (28.6%) | $38,750 |
| 65+ Years | 32 (65.3%) | $57,857 |
| Total | 49 (100.0%) | $49,688 |
Poverty in Middle Village
Income Below Poverty by Sex and Age in Middle Village
With 36.0% poverty level for males and 49.5% for females among the residents of Middle Village, 15 year old males and under 5 year old females are the most vulnerable to poverty, with 1 males (100.0%) and 8 females (100.0%) in their respective age groups living below the poverty level.
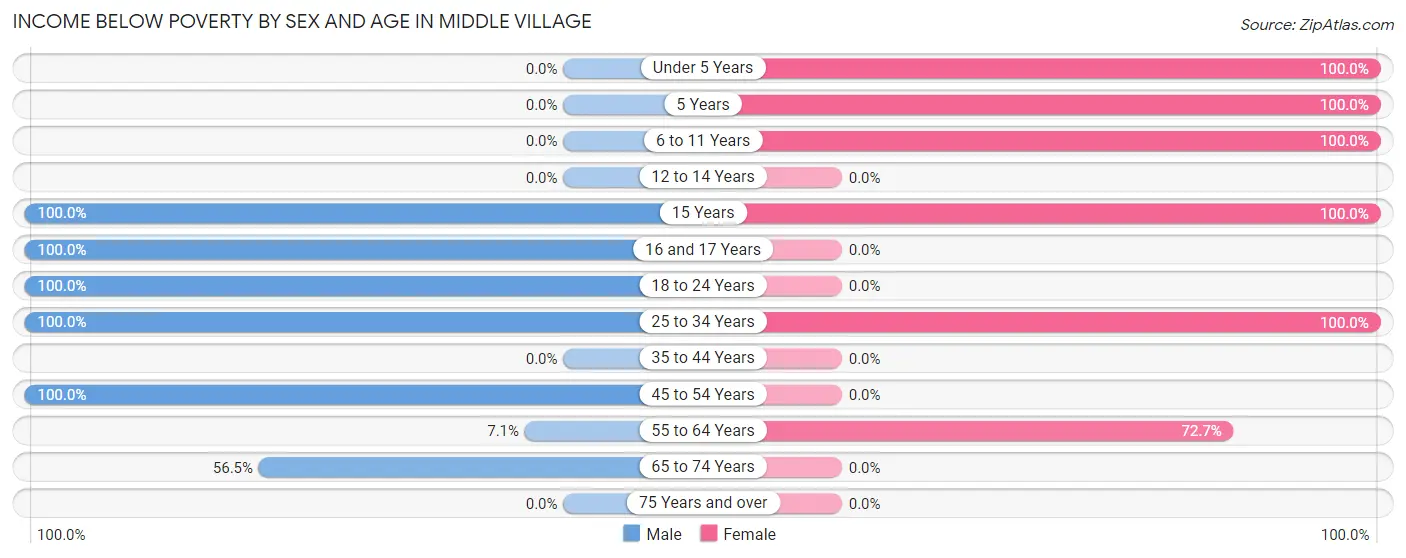
| Age Bracket | Male | Female |
| Under 5 Years | 0 (0.0%) | 8 (100.0%) |
| 5 Years | 0 (0.0%) | 3 (100.0%) |
| 6 to 11 Years | 0 (0.0%) | 13 (100.0%) |
| 12 to 14 Years | 0 (0.0%) | 0 (0.0%) |
| 15 Years | 1 (100.0%) | 4 (100.0%) |
| 16 and 17 Years | 1 (100.0%) | 0 (0.0%) |
| 18 to 24 Years | 3 (100.0%) | 0 (0.0%) |
| 25 to 34 Years | 6 (100.0%) | 10 (100.0%) |
| 35 to 44 Years | 0 (0.0%) | 0 (0.0%) |
| 45 to 54 Years | 1 (100.0%) | 0 (0.0%) |
| 55 to 64 Years | 2 (7.1%) | 8 (72.7%) |
| 65 to 74 Years | 13 (56.5%) | 0 (0.0%) |
| 75 Years and over | 0 (0.0%) | 0 (0.0%) |
| Total | 27 (36.0%) | 46 (49.5%) |
Income Above Poverty by Sex and Age in Middle Village
According to the poverty statistics in Middle Village, males aged under 5 years and females aged 12 to 14 years are the age groups that are most secure financially, with 100.0% of males and 100.0% of females in these age groups living above the poverty line.
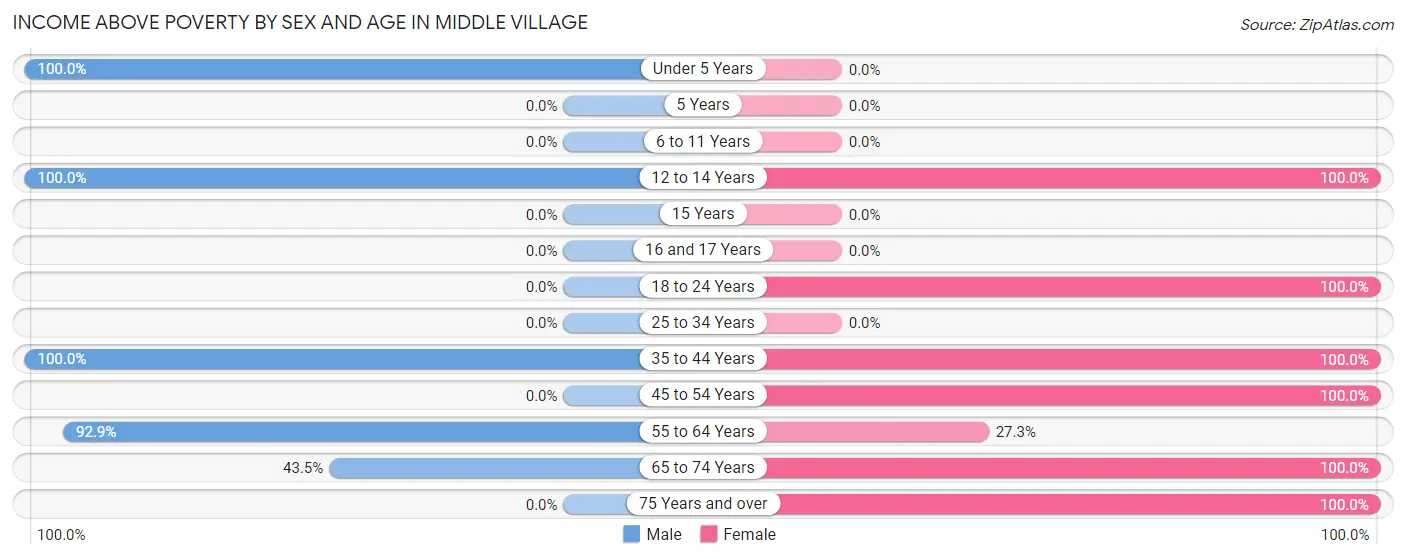
| Age Bracket | Male | Female |
| Under 5 Years | 6 (100.0%) | 0 (0.0%) |
| 5 Years | 0 (0.0%) | 0 (0.0%) |
| 6 to 11 Years | 0 (0.0%) | 0 (0.0%) |
| 12 to 14 Years | 4 (100.0%) | 4 (100.0%) |
| 15 Years | 0 (0.0%) | 0 (0.0%) |
| 16 and 17 Years | 0 (0.0%) | 0 (0.0%) |
| 18 to 24 Years | 0 (0.0%) | 4 (100.0%) |
| 25 to 34 Years | 0 (0.0%) | 0 (0.0%) |
| 35 to 44 Years | 2 (100.0%) | 1 (100.0%) |
| 45 to 54 Years | 0 (0.0%) | 6 (100.0%) |
| 55 to 64 Years | 26 (92.9%) | 3 (27.3%) |
| 65 to 74 Years | 10 (43.5%) | 15 (100.0%) |
| 75 Years and over | 0 (0.0%) | 14 (100.0%) |
| Total | 48 (64.0%) | 47 (50.5%) |
Income Below Poverty Among Married-Couple Families in Middle Village
The poverty statistics for married-couple families in Middle Village show that 20.0% or 3 of the total 15 families live below the poverty line. Families with 3 or 4 children have the highest poverty rate of 100.0%, comprising of 1 families. On the other hand, families with no children have the lowest poverty rate of 0.0%, which includes 0 families.
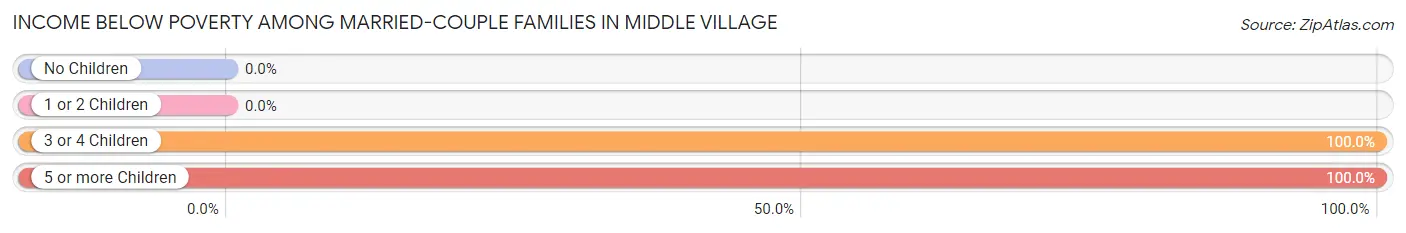
| Children | Above Poverty | Below Poverty |
| No Children | 8 (100.0%) | 0 (0.0%) |
| 1 or 2 Children | 4 (100.0%) | 0 (0.0%) |
| 3 or 4 Children | 0 (0.0%) | 1 (100.0%) |
| 5 or more Children | 0 (0.0%) | 2 (100.0%) |
| Total | 12 (80.0%) | 3 (20.0%) |
Income Below Poverty Among Single-Parent Households in Middle Village
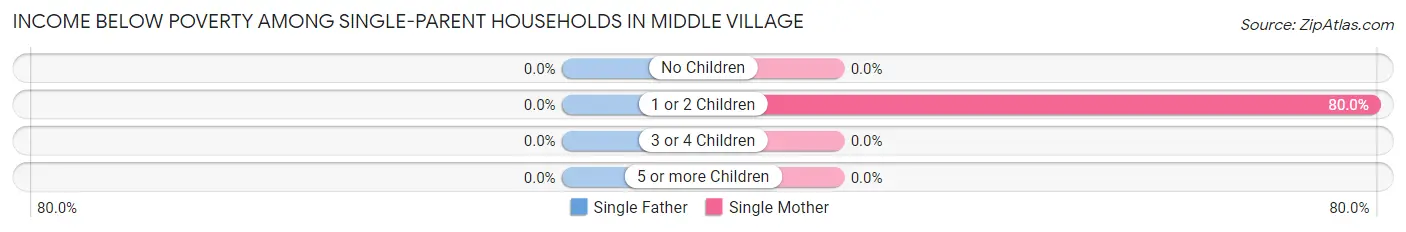
| Children | Single Father | Single Mother |
| No Children | 0 (0.0%) | 0 (0.0%) |
| 1 or 2 Children | 0 (0.0%) | 4 (80.0%) |
| 3 or 4 Children | 0 (0.0%) | 0 (0.0%) |
| 5 or more Children | 0 (0.0%) | 0 (0.0%) |
| Total | 0 (0.0%) | 4 (17.4%) |
Income Below Poverty Among Married-Couple vs Single-Parent Households in Middle Village
The poverty data for Middle Village shows that 3 of the married-couple family households (20.0%) and 4 of the single-parent households (16.0%) are living below the poverty level. Within the married-couple family households, those with 3 or 4 children have the highest poverty rate, with 1 households (100.0%) falling below the poverty line. Among the single-parent households, those with 1 or 2 children have the highest poverty rate, with 4 household (57.1%) living below poverty.
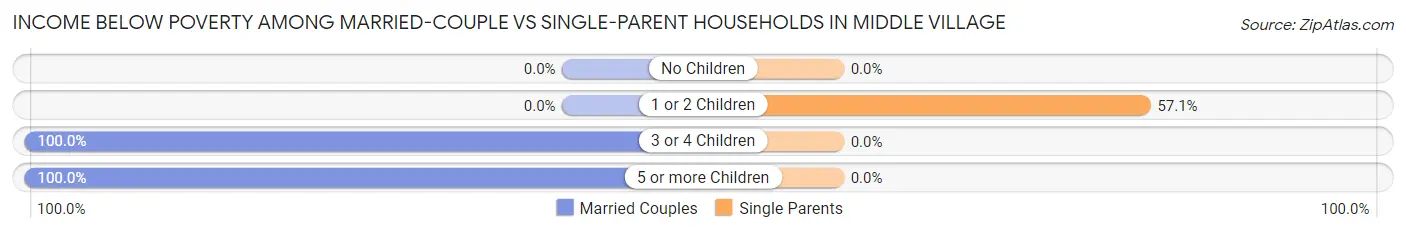
| Children | Married-Couple Families | Single-Parent Households |
| No Children | 0 (0.0%) | 0 (0.0%) |
| 1 or 2 Children | 0 (0.0%) | 4 (57.1%) |
| 3 or 4 Children | 1 (100.0%) | 0 (0.0%) |
| 5 or more Children | 2 (100.0%) | 0 (0.0%) |
| Total | 3 (20.0%) | 4 (16.0%) |
Race in Middle Village
The most populous races in Middle Village are Native / Alaskan (164 | 94.8%), White / Caucasian (7 | 4.1%), and Black / African American (1 | 0.6%).
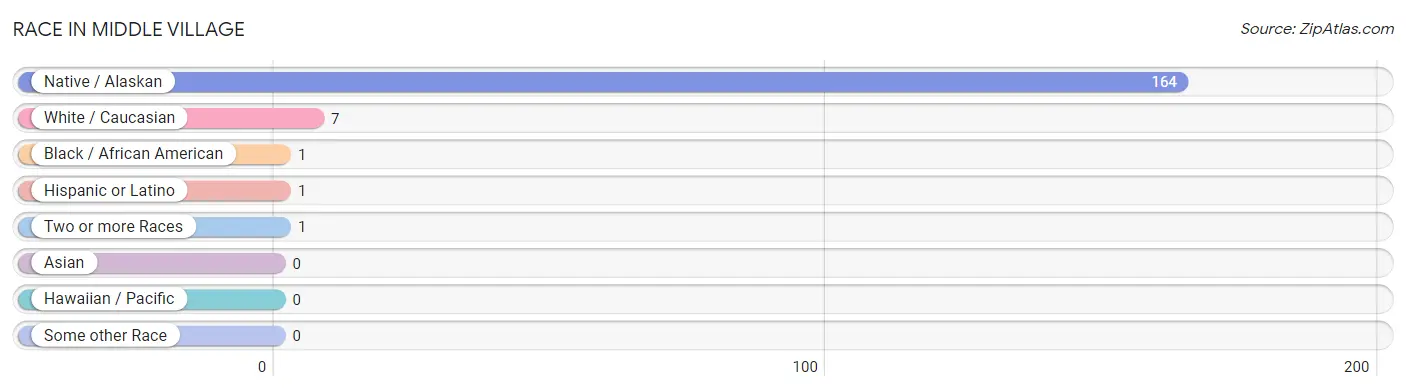
| Race | # Population | % Population |
| Asian | 0 | 0.0% |
| Black / African American | 1 | 0.6% |
| Hawaiian / Pacific | 0 | 0.0% |
| Hispanic or Latino | 1 | 0.6% |
| Native / Alaskan | 164 | 94.8% |
| White / Caucasian | 7 | 4.1% |
| Two or more Races | 1 | 0.6% |
| Some other Race | 0 | 0.0% |
| Total | 173 | 100.0% |
Ancestry in Middle Village
The most populous ancestries reported in Middle Village are Menominee (123 | 71.1%), Luxembourger (1 | 0.6%), and Mexican (1 | 0.6%), together accounting for 72.3% of all Middle Village residents.
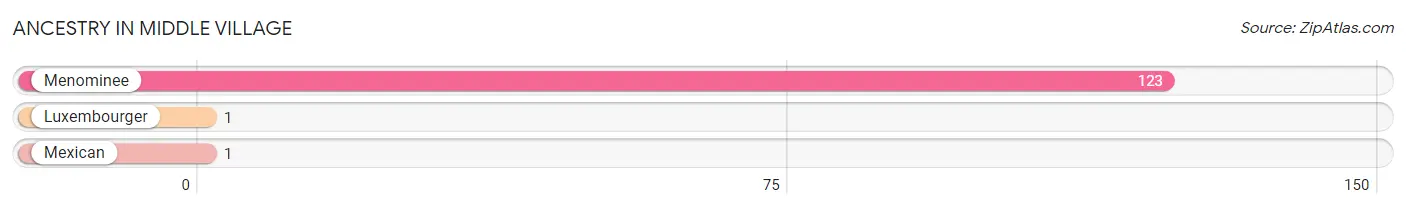
| Ancestry | # Population | % Population |
| Luxembourger | 1 | 0.6% |
| Menominee | 123 | 71.1% |
| Mexican | 1 | 0.6% | View All 3 Rows |
Immigrants in Middle Village

| Immigration Origin | # Population | % Population | View All 0 Rows |
Sex and Age in Middle Village
Sex and Age in Middle Village
The most populous age groups in Middle Village are 60 to 64 Years (23 | 28.7%) for men and 65 to 69 Years (15 | 16.1%) for women.
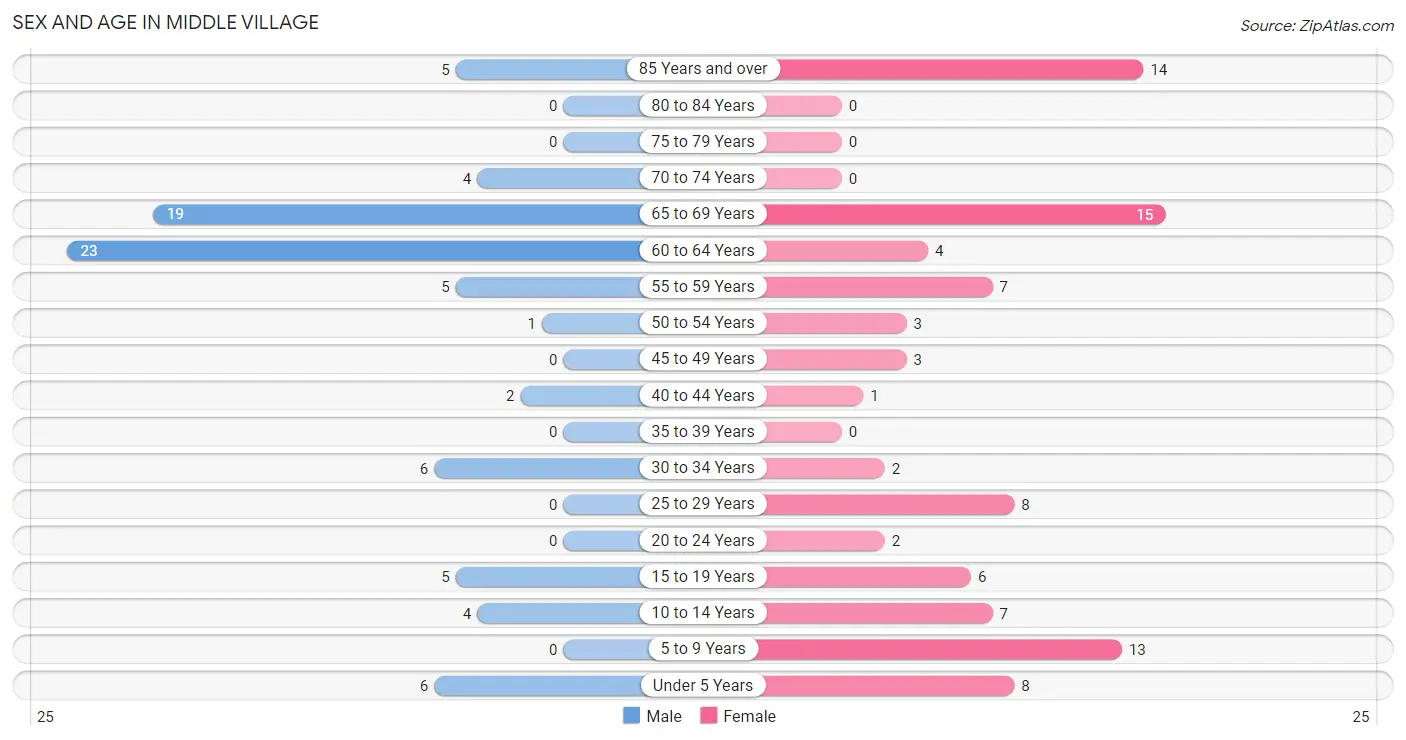
| Age Bracket | Male | Female |
| Under 5 Years | 6 (7.5%) | 8 (8.6%) |
| 5 to 9 Years | 0 (0.0%) | 13 (14.0%) |
| 10 to 14 Years | 4 (5.0%) | 7 (7.5%) |
| 15 to 19 Years | 5 (6.2%) | 6 (6.5%) |
| 20 to 24 Years | 0 (0.0%) | 2 (2.1%) |
| 25 to 29 Years | 0 (0.0%) | 8 (8.6%) |
| 30 to 34 Years | 6 (7.5%) | 2 (2.1%) |
| 35 to 39 Years | 0 (0.0%) | 0 (0.0%) |
| 40 to 44 Years | 2 (2.5%) | 1 (1.1%) |
| 45 to 49 Years | 0 (0.0%) | 3 (3.2%) |
| 50 to 54 Years | 1 (1.3%) | 3 (3.2%) |
| 55 to 59 Years | 5 (6.2%) | 7 (7.5%) |
| 60 to 64 Years | 23 (28.7%) | 4 (4.3%) |
| 65 to 69 Years | 19 (23.7%) | 15 (16.1%) |
| 70 to 74 Years | 4 (5.0%) | 0 (0.0%) |
| 75 to 79 Years | 0 (0.0%) | 0 (0.0%) |
| 80 to 84 Years | 0 (0.0%) | 0 (0.0%) |
| 85 Years and over | 5 (6.2%) | 14 (15.0%) |
| Total | 80 (100.0%) | 93 (100.0%) |
Families and Households in Middle Village
Median Family Size in Middle Village
The median family size in Middle Village is 3.73 persons per family, with married-couple families (15 | 37.5%) accounting for the largest median family size of 5.67 persons per family. On the other hand, single male/father families (2 | 5.0%) represent the smallest median family size with 2.00 persons per family.
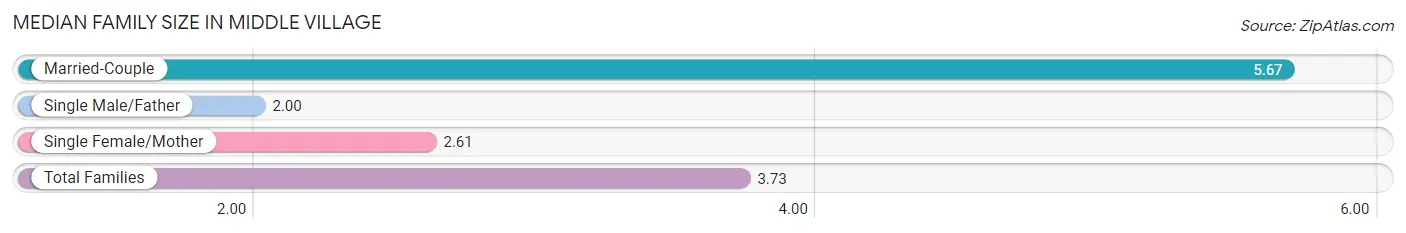
| Family Type | # Families | Family Size |
| Married-Couple | 15 (37.5%) | 5.67 |
| Single Male/Father | 2 (5.0%) | 2.00 |
| Single Female/Mother | 23 (57.5%) | 2.61 |
| Total Families | 40 (100.0%) | 3.73 |
Median Household Size in Middle Village
The median household size in Middle Village is 3.37 persons per household, with married-couple households (15 | 30.6%) accounting for the largest median household size of 5.93 persons per household. non-family households (9 | 18.4%) represent the smallest median household size with 1.33 persons per household.
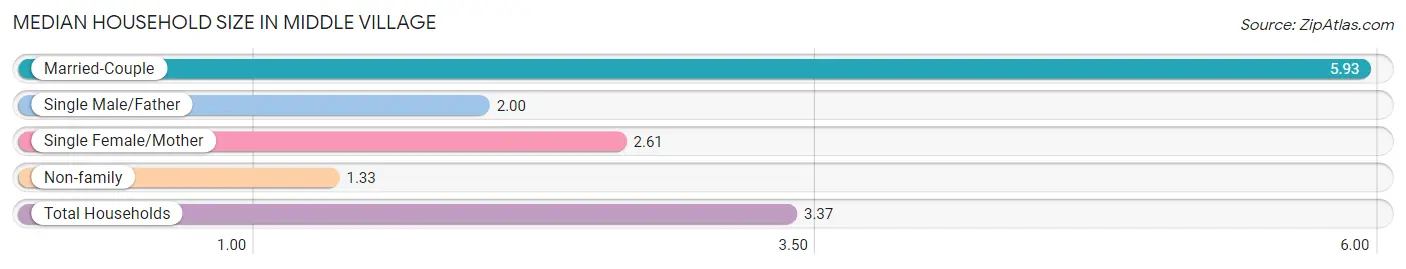
| Household Type | # Households | Household Size |
| Married-Couple | 15 (30.6%) | 5.93 |
| Single Male/Father | 2 (4.1%) | 2.00 |
| Single Female/Mother | 23 (46.9%) | 2.61 |
| Non-family | 9 (18.4%) | 1.33 |
| Total Households | 49 (100.0%) | 3.37 |
Household Size by Marriage Status in Middle Village
Out of a total of 49 households in Middle Village, 40 (81.6%) are family households, while 9 (18.4%) are nonfamily households. The most numerous type of family households are 2-person households, comprising 26, and the most common type of nonfamily households are 1-person households, comprising 5.
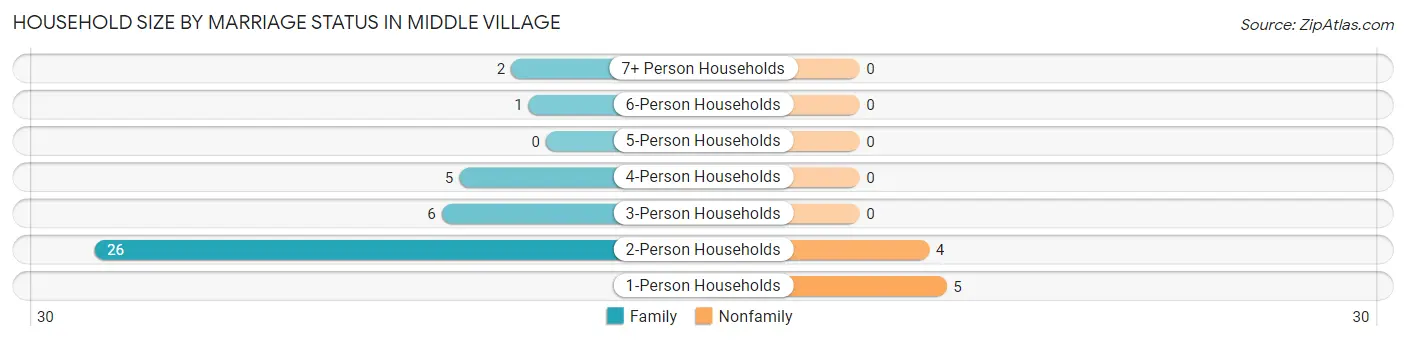
| Household Size | Family Households | Nonfamily Households |
| 1-Person Households | - | 5 (10.2%) |
| 2-Person Households | 26 (53.1%) | 4 (8.2%) |
| 3-Person Households | 6 (12.2%) | 0 (0.0%) |
| 4-Person Households | 5 (10.2%) | 0 (0.0%) |
| 5-Person Households | 0 (0.0%) | 0 (0.0%) |
| 6-Person Households | 1 (2.0%) | 0 (0.0%) |
| 7+ Person Households | 2 (4.1%) | 0 (0.0%) |
| Total | 40 (81.6%) | 9 (18.4%) |
Female Fertility in Middle Village
Fertility by Age in Middle Village
| Age Bracket | Women with Births | Births / 1,000 Women |
| 15 to 19 years | 0 (0.0%) | 0.0 |
| 20 to 34 years | 0 (0.0%) | 0.0 |
| 35 to 50 years | 0 (0.0%) | 0.0 |
| Total | 0 (0.0%) | 0.0 |
Fertility by Age by Marriage Status in Middle Village
| Age Bracket | Married | Unmarried |
| 15 to 19 years | 0 (0.0%) | 0 (0.0%) |
| 20 to 34 years | 0 (0.0%) | 0 (0.0%) |
| 35 to 50 years | 0 (0.0%) | 0 (0.0%) |
| Total | 0 (0.0%) | 0 (0.0%) |
Fertility by Education in Middle Village
| Educational Attainment | Women with Births | Births / 1,000 Women |
| Less than High School | 0 (0.0%) | 0.0 |
| High School Diploma | 0 (0.0%) | 0.0 |
| College or Associate's Degree | 0 (0.0%) | 0.0 |
| Bachelor's Degree | 0 (0.0%) | 0.0 |
| Graduate Degree | 0 (0.0%) | 0.0 |
| Total | 0 (0.0%) | 0.0 |
Fertility by Education by Marriage Status in Middle Village
| Educational Attainment | Married | Unmarried |
| Less than High School | 0 (0.0%) | 0 (0.0%) |
| High School Diploma | 0 (0.0%) | 0 (0.0%) |
| College or Associate's Degree | 0 (0.0%) | 0 (0.0%) |
| Bachelor's Degree | 0 (0.0%) | 0 (0.0%) |
| Graduate Degree | 0 (0.0%) | 0 (0.0%) |
| Total | 0 (0.0%) | 0 (0.0%) |
Employment Characteristics in Middle Village
Employment by Class of Employer in Middle Village
Among the 60 employed individuals in Middle Village, private company employees (33 | 55.0%), local government employees (22 | 36.7%), and state government employees (4 | 6.7%) make up the most common classes of employment.
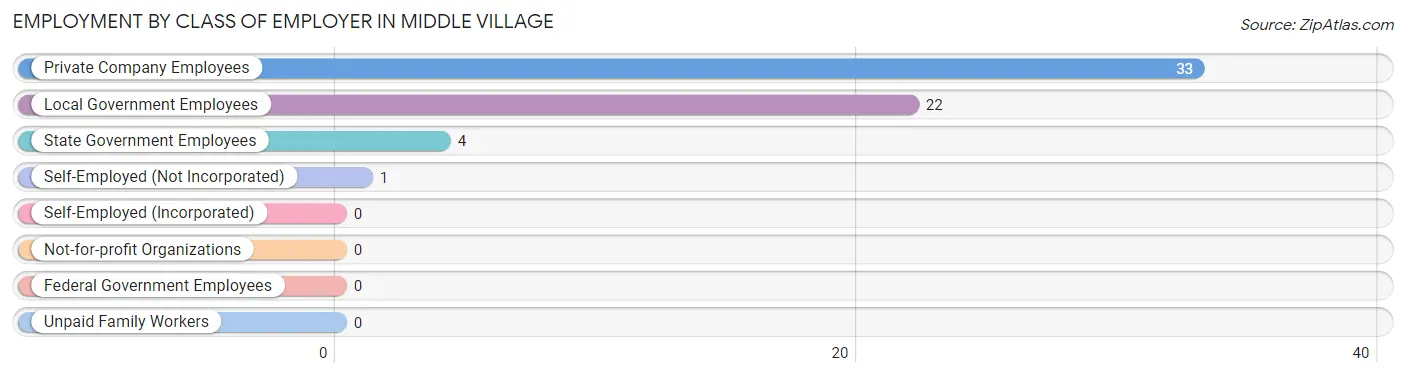
| Employer Class | # Employees | % Employees |
| Private Company Employees | 33 | 55.0% |
| Self-Employed (Incorporated) | 0 | 0.0% |
| Self-Employed (Not Incorporated) | 1 | 1.7% |
| Not-for-profit Organizations | 0 | 0.0% |
| Local Government Employees | 22 | 36.7% |
| State Government Employees | 4 | 6.7% |
| Federal Government Employees | 0 | 0.0% |
| Unpaid Family Workers | 0 | 0.0% |
| Total | 60 | 100.0% |
Employment Status by Age in Middle Village
According to the labor force statistics for Middle Village, out of the total population over 16 years of age (130), 49.2% or 64 individuals are in the labor force, with 6.3% or 4 of them unemployed. The age group with the highest labor force participation rate is 20 to 24 years, with 100.0% or 2 individuals in the labor force. Within the labor force, the 25 to 29 years age range has the highest percentage of unemployed individuals, with 50.0% or 4 of them being unemployed.
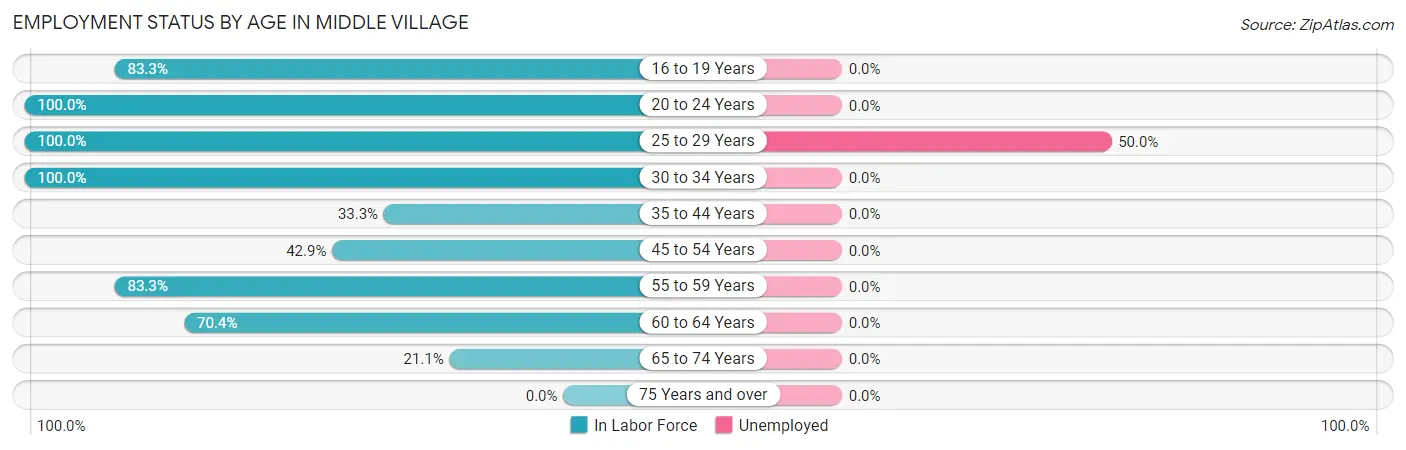
| Age Bracket | In Labor Force | Unemployed |
| 16 to 19 Years | 5 (83.3%) | 0 (0.0%) |
| 20 to 24 Years | 2 (100.0%) | 0 (0.0%) |
| 25 to 29 Years | 8 (100.0%) | 4 (50.0%) |
| 30 to 34 Years | 8 (100.0%) | 0 (0.0%) |
| 35 to 44 Years | 1 (33.3%) | 0 (0.0%) |
| 45 to 54 Years | 3 (42.9%) | 0 (0.0%) |
| 55 to 59 Years | 10 (83.3%) | 0 (0.0%) |
| 60 to 64 Years | 19 (70.4%) | 0 (0.0%) |
| 65 to 74 Years | 8 (21.1%) | 0 (0.0%) |
| 75 Years and over | 0 (0.0%) | 0 (0.0%) |
| Total | 64 (49.2%) | 4 (6.3%) |
Employment Status by Educational Attainment in Middle Village
According to labor force statistics for Middle Village, 75.4% of individuals (49) out of the total population between 25 and 64 years of age (65) are in the labor force, with 8.2% or 4 of them being unemployed. The group with the highest labor force participation rate are those with the educational attainment of bachelor's degree or higher, with 100.0% or 1 individuals in the labor force. Within the labor force, individuals with high school diploma education have the highest percentage of unemployment, with 12.9% or 4 of them being unemployed.
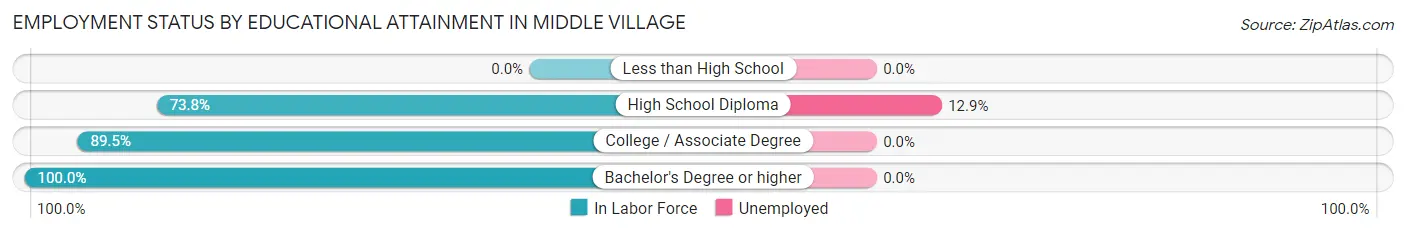
| Educational Attainment | In Labor Force | Unemployed |
| Less than High School | 0 (0.0%) | 0 (0.0%) |
| High School Diploma | 31 (73.8%) | 5 (12.9%) |
| College / Associate Degree | 17 (89.5%) | 0 (0.0%) |
| Bachelor's Degree or higher | 1 (100.0%) | 0 (0.0%) |
| Total | 49 (75.4%) | 5 (8.2%) |
Employment Occupations by Sex in Middle Village
Management, Business, Science and Arts Occupations
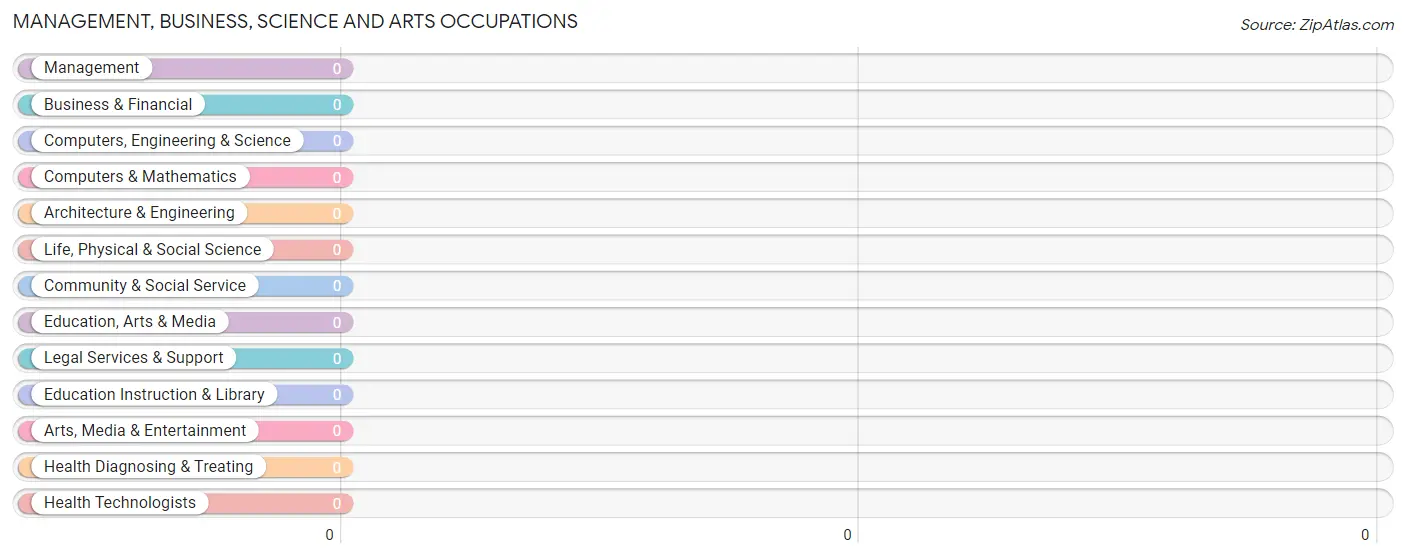
Management, Business, Science and Arts Occupations by Sex
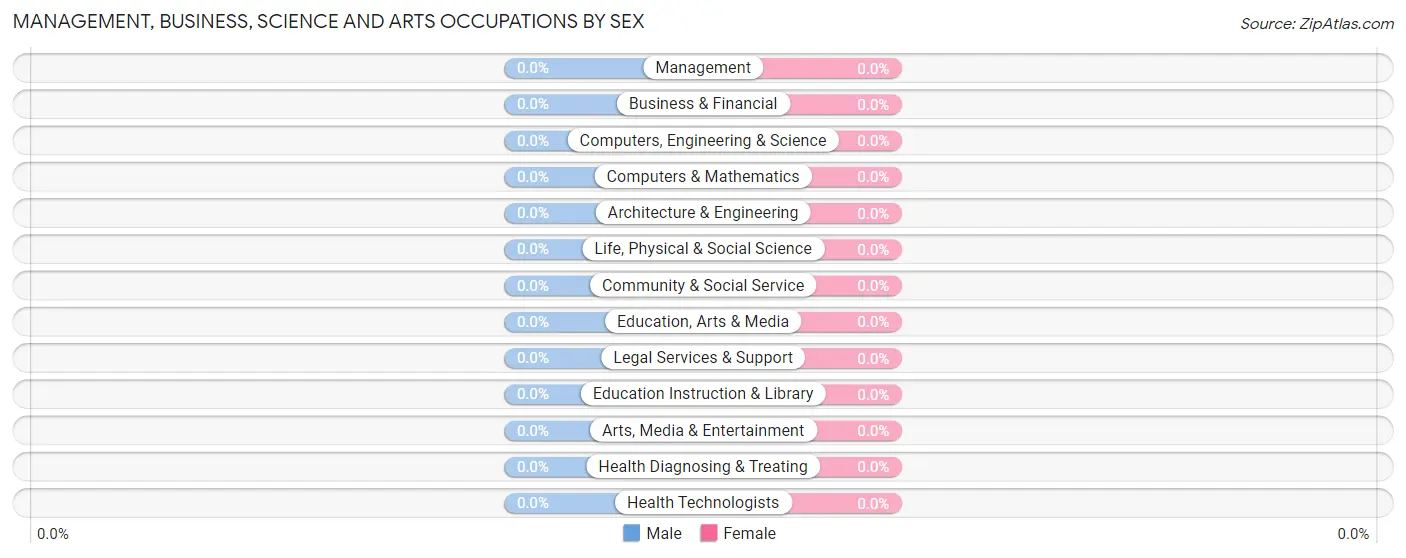
| Occupation | Male | Female |
| Management | 0 (0.0%) | 0 (0.0%) |
| Business & Financial | 0 (0.0%) | 0 (0.0%) |
| Computers, Engineering & Science | 0 (0.0%) | 0 (0.0%) |
| Computers & Mathematics | 0 (0.0%) | 0 (0.0%) |
| Architecture & Engineering | 0 (0.0%) | 0 (0.0%) |
| Life, Physical & Social Science | 0 (0.0%) | 0 (0.0%) |
| Community & Social Service | 0 (0.0%) | 0 (0.0%) |
| Education, Arts & Media | 0 (0.0%) | 0 (0.0%) |
| Legal Services & Support | 0 (0.0%) | 0 (0.0%) |
| Education Instruction & Library | 0 (0.0%) | 0 (0.0%) |
| Arts, Media & Entertainment | 0 (0.0%) | 0 (0.0%) |
| Health Diagnosing & Treating | 0 (0.0%) | 0 (0.0%) |
| Health Technologists | 0 (0.0%) | 0 (0.0%) |
| Total (Category) | 0 (0.0%) | 0 (0.0%) |
| Total (Overall) | 33 (55.0%) | 27 (45.0%) |
Services Occupations
The most common Services occupations in Middle Village are Healthcare Support (27 | 45.0%), Cleaning & Maintenance (10 | 16.7%), and Food Preparation & Serving (4 | 6.7%).
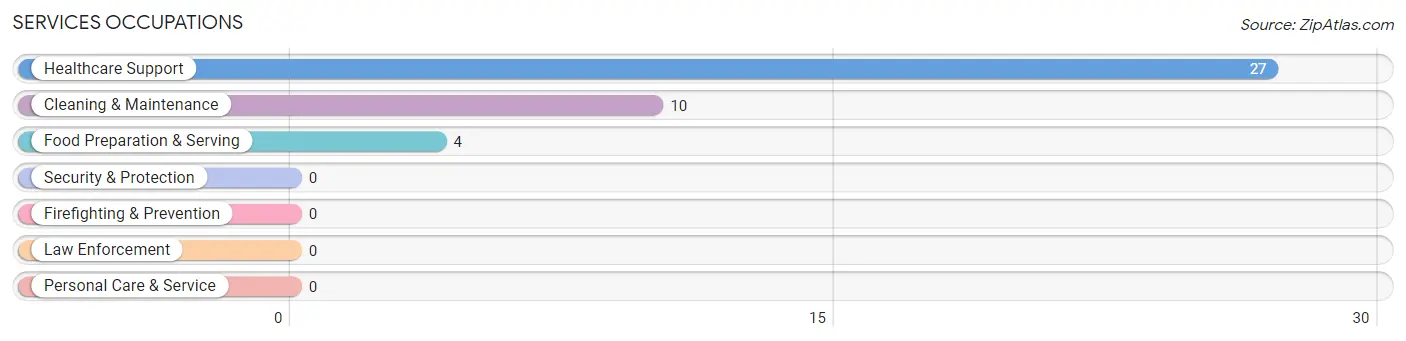
Services Occupations by Sex
Within the Services occupations in Middle Village, the most male-oriented occupations are Healthcare Support (59.3%), and Cleaning & Maintenance (50.0%), while the most female-oriented occupations are Food Preparation & Serving (100.0%), Cleaning & Maintenance (50.0%), and Healthcare Support (40.7%).
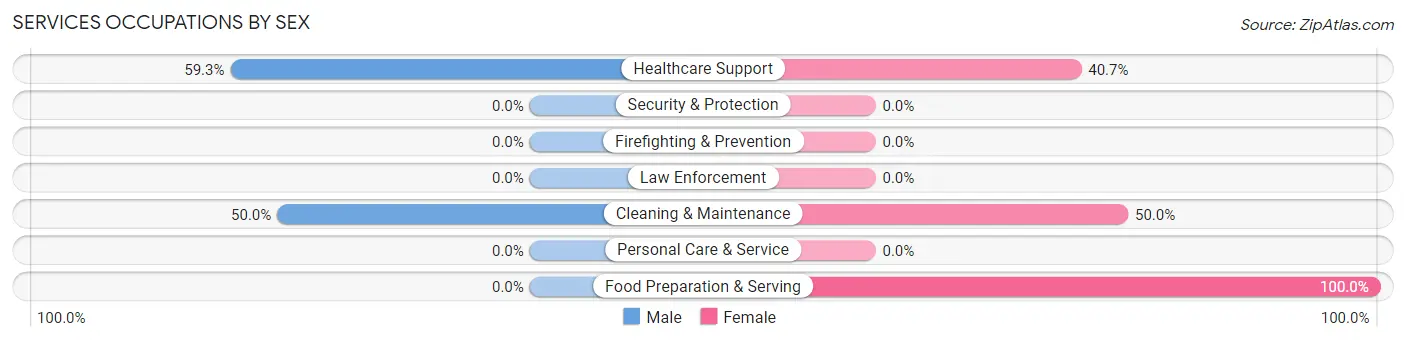
| Occupation | Male | Female |
| Healthcare Support | 16 (59.3%) | 11 (40.7%) |
| Security & Protection | 0 (0.0%) | 0 (0.0%) |
| Firefighting & Prevention | 0 (0.0%) | 0 (0.0%) |
| Law Enforcement | 0 (0.0%) | 0 (0.0%) |
| Food Preparation & Serving | 0 (0.0%) | 4 (100.0%) |
| Cleaning & Maintenance | 5 (50.0%) | 5 (50.0%) |
| Personal Care & Service | 0 (0.0%) | 0 (0.0%) |
| Total (Category) | 21 (51.2%) | 20 (48.8%) |
| Total (Overall) | 33 (55.0%) | 27 (45.0%) |
Sales and Office Occupations
The most common Sales and Office occupations in Middle Village are Office & Administration (5 | 8.3%), and Sales & Related (2 | 3.3%).
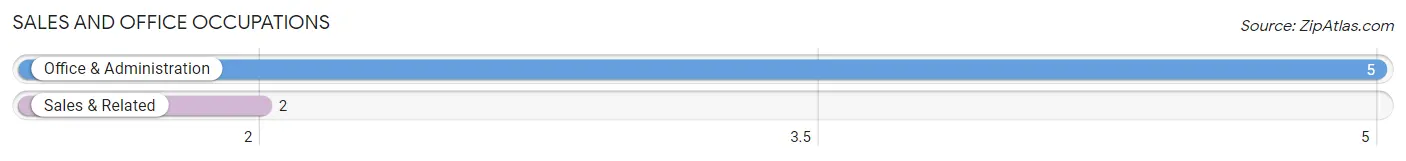
Sales and Office Occupations by Sex
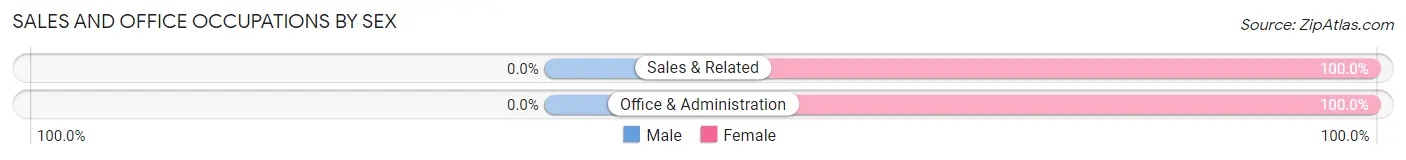
| Occupation | Male | Female |
| Sales & Related | 0 (0.0%) | 2 (100.0%) |
| Office & Administration | 0 (0.0%) | 5 (100.0%) |
| Total (Category) | 0 (0.0%) | 7 (100.0%) |
| Total (Overall) | 33 (55.0%) | 27 (45.0%) |
Natural Resources, Construction and Maintenance Occupations
The most common Natural Resources, Construction and Maintenance occupations in Middle Village are Farming, Fishing & Forestry (6 | 10.0%), and Installation, Maintenance & Repair (3 | 5.0%).
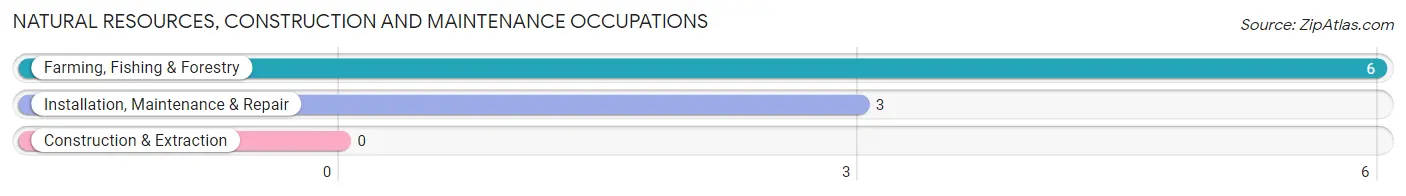
Natural Resources, Construction and Maintenance Occupations by Sex
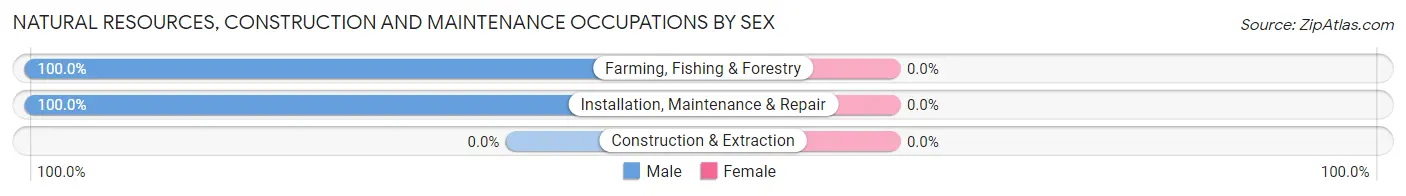
| Occupation | Male | Female |
| Farming, Fishing & Forestry | 6 (100.0%) | 0 (0.0%) |
| Construction & Extraction | 0 (0.0%) | 0 (0.0%) |
| Installation, Maintenance & Repair | 3 (100.0%) | 0 (0.0%) |
| Total (Category) | 9 (100.0%) | 0 (0.0%) |
| Total (Overall) | 33 (55.0%) | 27 (45.0%) |
Production, Transportation and Moving Occupations
The most common Production, Transportation and Moving occupations in Middle Village are Transportation (2 | 3.3%), and Material Moving (1 | 1.7%).
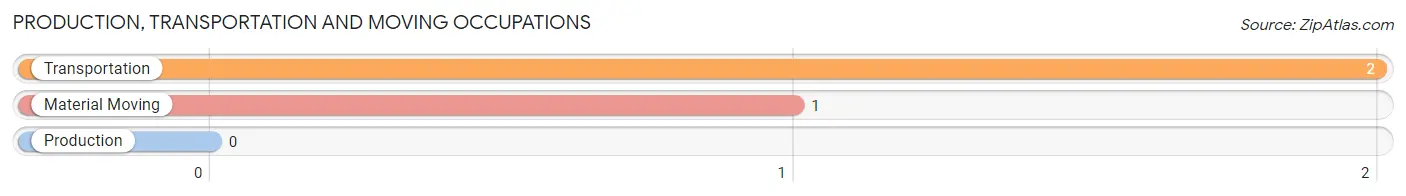
Production, Transportation and Moving Occupations by Sex
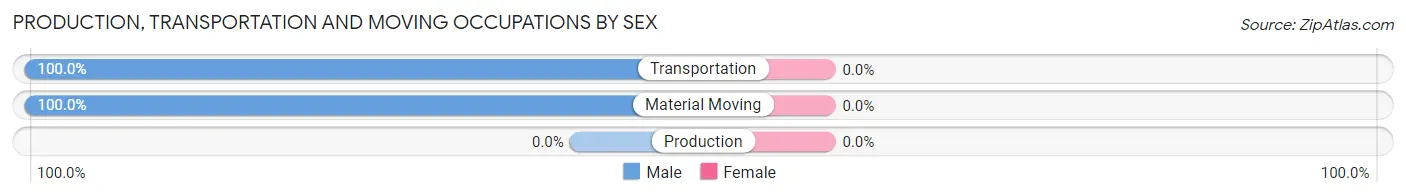
| Occupation | Male | Female |
| Production | 0 (0.0%) | 0 (0.0%) |
| Transportation | 2 (100.0%) | 0 (0.0%) |
| Material Moving | 1 (100.0%) | 0 (0.0%) |
| Total (Category) | 3 (100.0%) | 0 (0.0%) |
| Total (Overall) | 33 (55.0%) | 27 (45.0%) |
Employment Industries by Sex in Middle Village
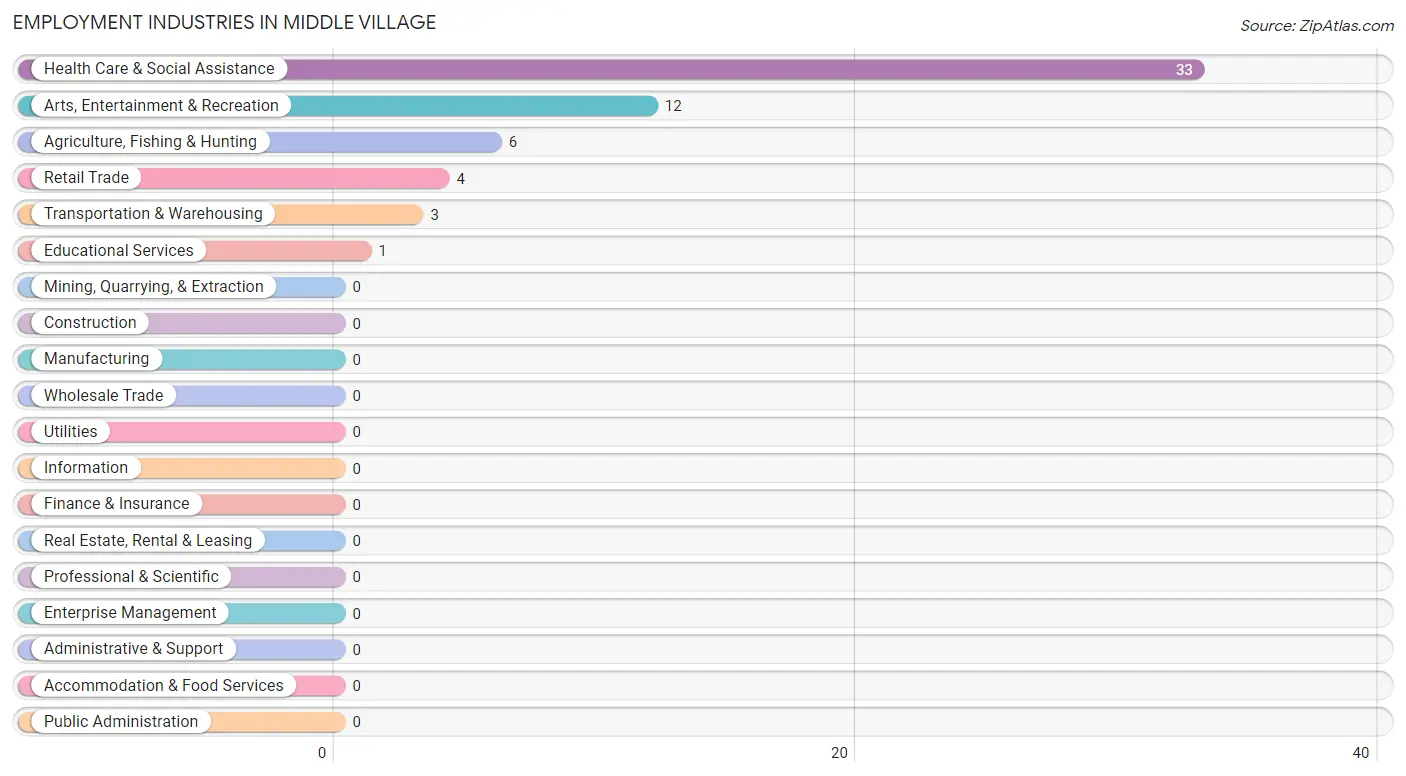
Employment Industries in Middle Village
The major employment industries in Middle Village include Health Care & Social Assistance (33 | 55.0%), Arts, Entertainment & Recreation (12 | 20.0%), Agriculture, Fishing & Hunting (6 | 10.0%), Retail Trade (4 | 6.7%), and Transportation & Warehousing (3 | 5.0%).
Employment Industries by Sex in Middle Village
The Middle Village industries that see more men than women are Agriculture, Fishing & Hunting (100.0%), Transportation & Warehousing (100.0%), and Health Care & Social Assistance (57.6%), whereas the industries that tend to have a higher number of women are Educational Services (100.0%), Arts, Entertainment & Recreation (75.0%), and Retail Trade (50.0%).
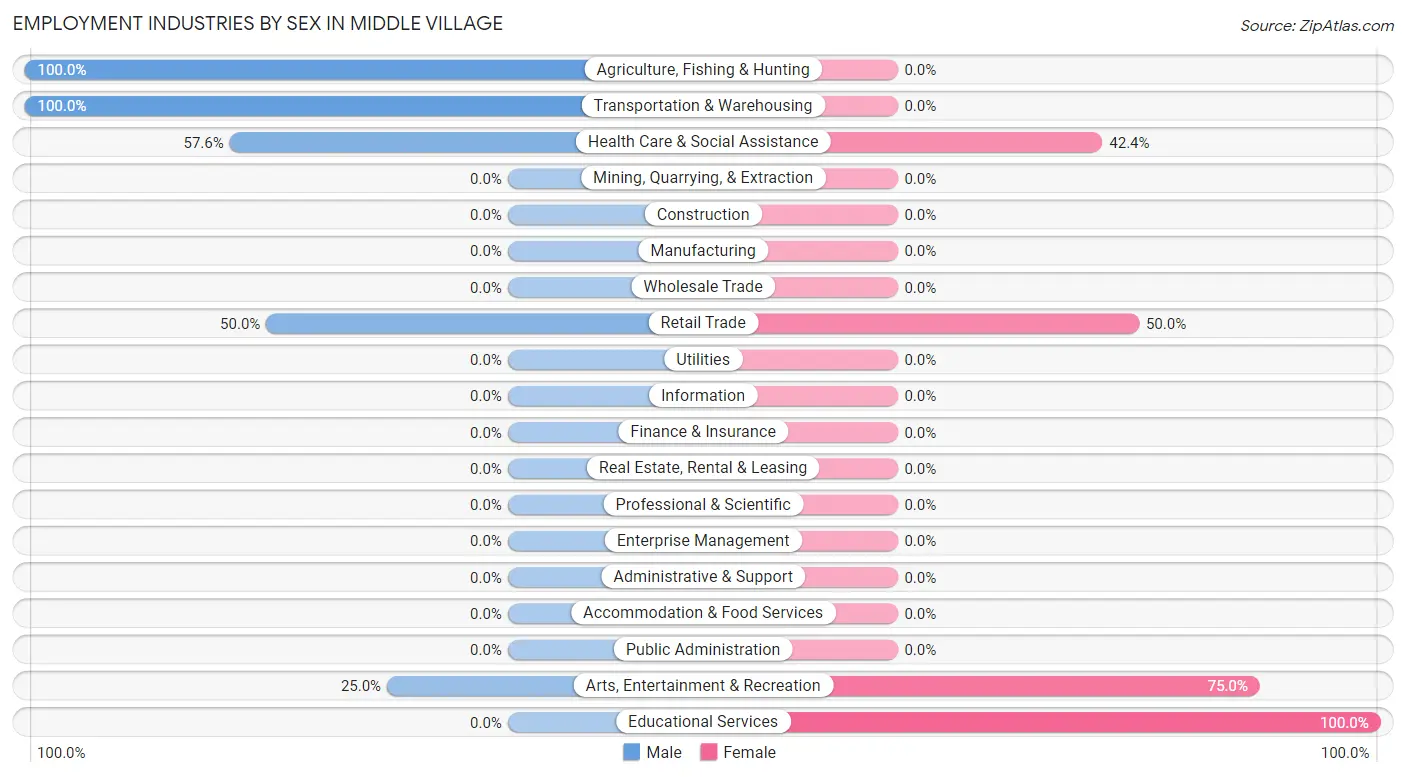
| Industry | Male | Female |
| Agriculture, Fishing & Hunting | 6 (100.0%) | 0 (0.0%) |
| Mining, Quarrying, & Extraction | 0 (0.0%) | 0 (0.0%) |
| Construction | 0 (0.0%) | 0 (0.0%) |
| Manufacturing | 0 (0.0%) | 0 (0.0%) |
| Wholesale Trade | 0 (0.0%) | 0 (0.0%) |
| Retail Trade | 2 (50.0%) | 2 (50.0%) |
| Transportation & Warehousing | 3 (100.0%) | 0 (0.0%) |
| Utilities | 0 (0.0%) | 0 (0.0%) |
| Information | 0 (0.0%) | 0 (0.0%) |
| Finance & Insurance | 0 (0.0%) | 0 (0.0%) |
| Real Estate, Rental & Leasing | 0 (0.0%) | 0 (0.0%) |
| Professional & Scientific | 0 (0.0%) | 0 (0.0%) |
| Enterprise Management | 0 (0.0%) | 0 (0.0%) |
| Administrative & Support | 0 (0.0%) | 0 (0.0%) |
| Educational Services | 0 (0.0%) | 1 (100.0%) |
| Health Care & Social Assistance | 19 (57.6%) | 14 (42.4%) |
| Arts, Entertainment & Recreation | 3 (25.0%) | 9 (75.0%) |
| Accommodation & Food Services | 0 (0.0%) | 0 (0.0%) |
| Public Administration | 0 (0.0%) | 0 (0.0%) |
| Total | 33 (55.0%) | 27 (45.0%) |
Education in Middle Village
School Enrollment in Middle Village
The most common levels of schooling among the 35 students in Middle Village are elementary school (12 | 34.3%), middle school (9 | 25.7%), and nursery / preschool (6 | 17.1%).
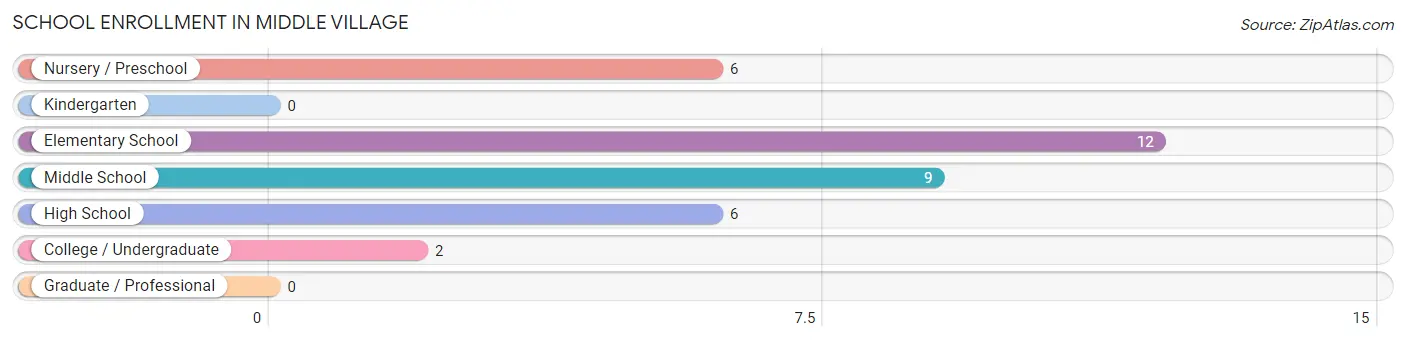
| School Level | # Students | % Students |
| Nursery / Preschool | 6 | 17.1% |
| Kindergarten | 0 | 0.0% |
| Elementary School | 12 | 34.3% |
| Middle School | 9 | 25.7% |
| High School | 6 | 17.1% |
| College / Undergraduate | 2 | 5.7% |
| Graduate / Professional | 0 | 0.0% |
| Total | 35 | 100.0% |
School Enrollment by Age by Funding Source in Middle Village
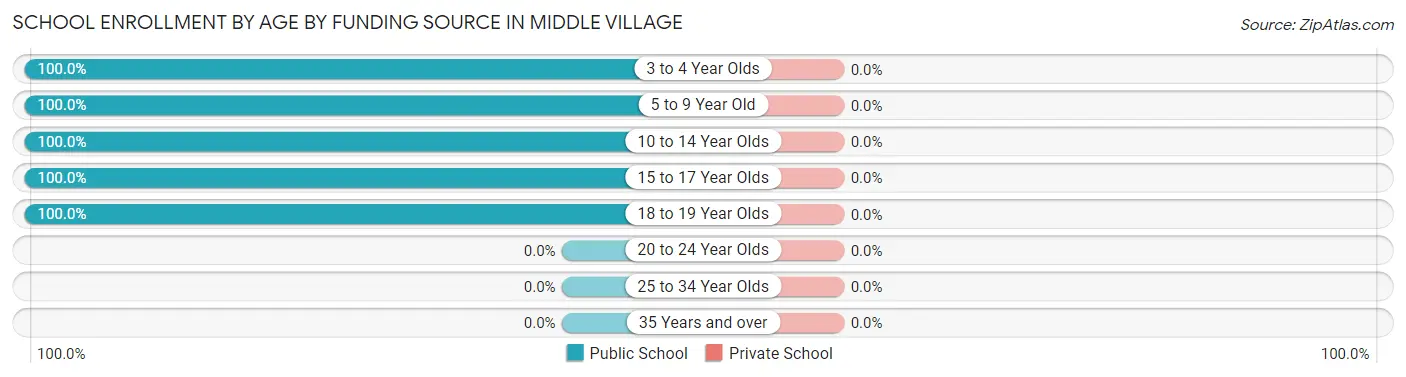
| Age Bracket | Public School | Private School |
| 3 to 4 Year Olds | 3 (100.0%) | 0 (0.0%) |
| 5 to 9 Year Old | 13 (100.0%) | 0 (0.0%) |
| 10 to 14 Year Olds | 11 (100.0%) | 0 (0.0%) |
| 15 to 17 Year Olds | 6 (100.0%) | 0 (0.0%) |
| 18 to 19 Year Olds | 2 (100.0%) | 0 (0.0%) |
| 20 to 24 Year Olds | 0 (0.0%) | 0 (0.0%) |
| 25 to 34 Year Olds | 0 (0.0%) | 0 (0.0%) |
| 35 Years and over | 0 (0.0%) | 0 (0.0%) |
| Total | 35 (100.0%) | 0 (0.0%) |
Educational Attainment by Field of Study in Middle Village
, and social sciences (1 | 100.0%) are the most common fields of study among 1 individuals in Middle Village who have obtained a bachelor's degree or higher.
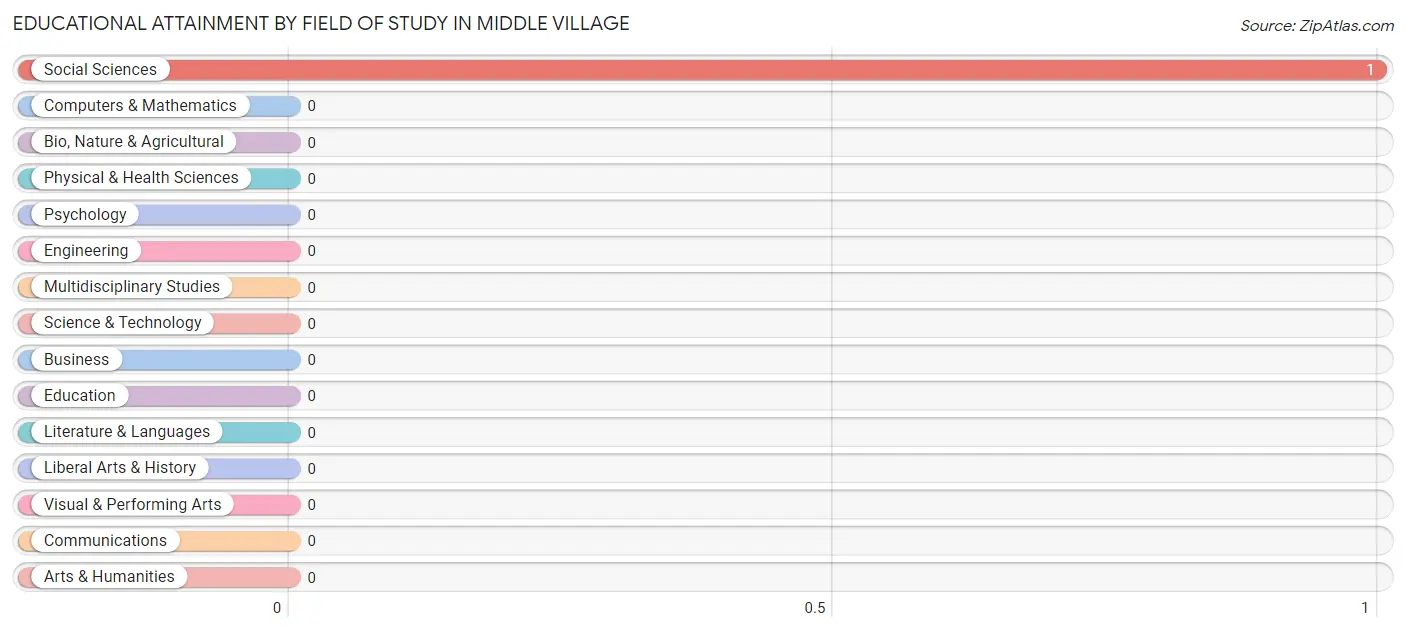
| Field of Study | # Graduates | % Graduates |
| Computers & Mathematics | 0 | 0.0% |
| Bio, Nature & Agricultural | 0 | 0.0% |
| Physical & Health Sciences | 0 | 0.0% |
| Psychology | 0 | 0.0% |
| Social Sciences | 1 | 100.0% |
| Engineering | 0 | 0.0% |
| Multidisciplinary Studies | 0 | 0.0% |
| Science & Technology | 0 | 0.0% |
| Business | 0 | 0.0% |
| Education | 0 | 0.0% |
| Literature & Languages | 0 | 0.0% |
| Liberal Arts & History | 0 | 0.0% |
| Visual & Performing Arts | 0 | 0.0% |
| Communications | 0 | 0.0% |
| Arts & Humanities | 0 | 0.0% |
| Total | 1 | 100.0% |
Transportation & Commute in Middle Village
Vehicle Availability by Sex in Middle Village
The most prevalent vehicle ownership categories in Middle Village are males with 1 vehicle (23, accounting for 69.7%) and females with 1 vehicle (14, making up 85.2%).
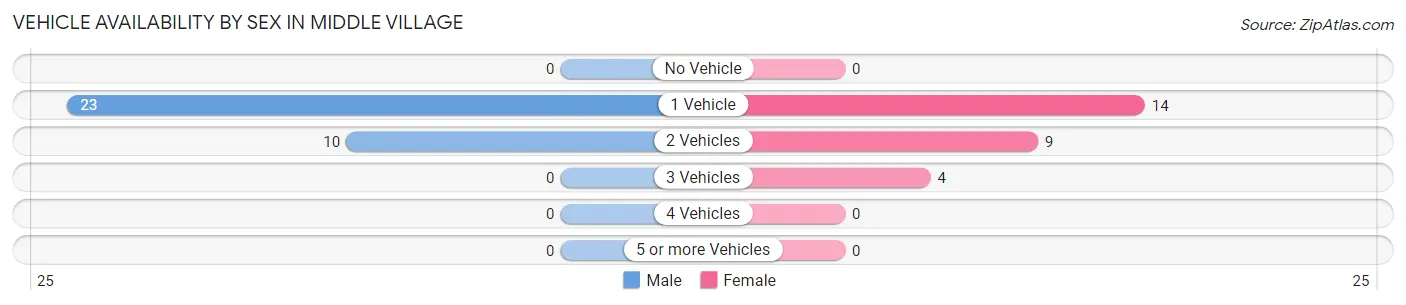
| Vehicles Available | Male | Female |
| No Vehicle | 0 (0.0%) | 0 (0.0%) |
| 1 Vehicle | 23 (69.7%) | 14 (51.8%) |
| 2 Vehicles | 10 (30.3%) | 9 (33.3%) |
| 3 Vehicles | 0 (0.0%) | 4 (14.8%) |
| 4 Vehicles | 0 (0.0%) | 0 (0.0%) |
| 5 or more Vehicles | 0 (0.0%) | 0 (0.0%) |
| Total | 33 (100.0%) | 27 (100.0%) |
Commute Time in Middle Village
The most frequently occuring commute durations in Middle Village are 20 to 24 minutes (31 commuters, 58.5%), 10 to 14 minutes (10 commuters, 18.9%), and 15 to 19 minutes (8 commuters, 15.1%).
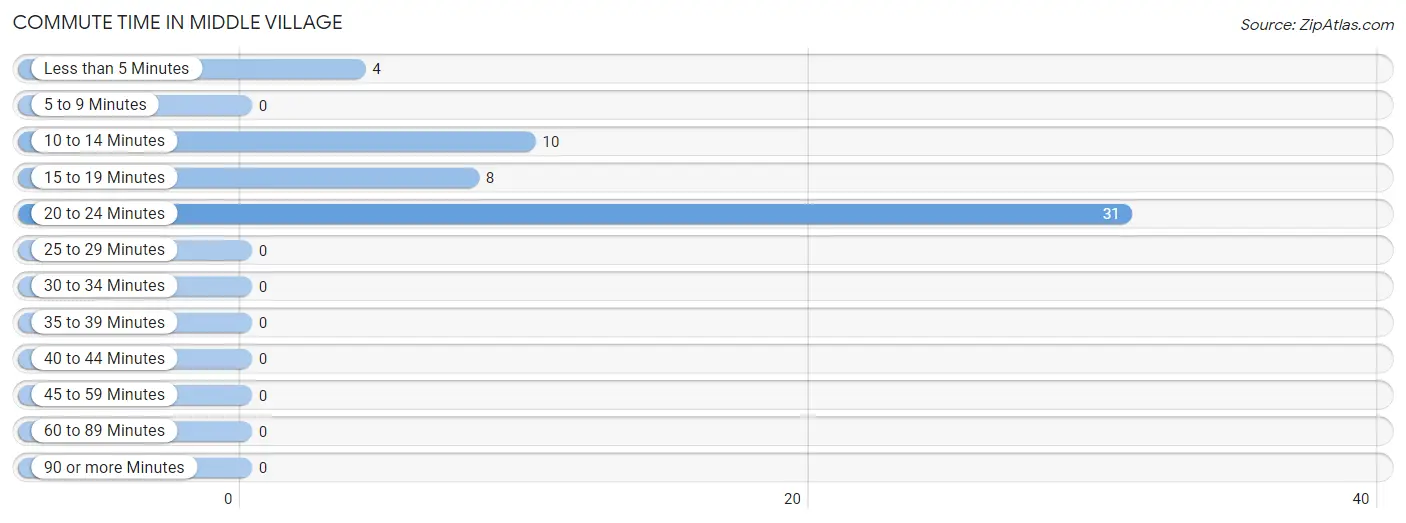
| Commute Time | # Commuters | % Commuters |
| Less than 5 Minutes | 4 | 7.5% |
| 5 to 9 Minutes | 0 | 0.0% |
| 10 to 14 Minutes | 10 | 18.9% |
| 15 to 19 Minutes | 8 | 15.1% |
| 20 to 24 Minutes | 31 | 58.5% |
| 25 to 29 Minutes | 0 | 0.0% |
| 30 to 34 Minutes | 0 | 0.0% |
| 35 to 39 Minutes | 0 | 0.0% |
| 40 to 44 Minutes | 0 | 0.0% |
| 45 to 59 Minutes | 0 | 0.0% |
| 60 to 89 Minutes | 0 | 0.0% |
| 90 or more Minutes | 0 | 0.0% |
Commute Time by Sex in Middle Village
The most common commute times in Middle Village are 20 to 24 minutes (26 commuters, 78.8%) for males and 10 to 14 minutes (7 commuters, 35.0%) for females.
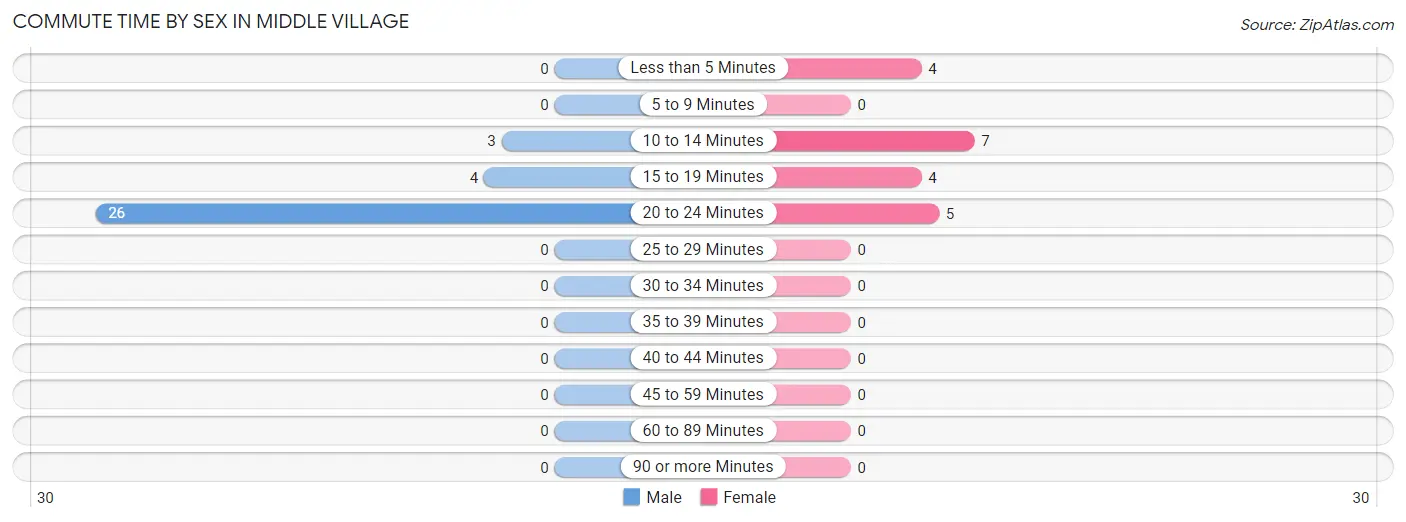
| Commute Time | Male | Female |
| Less than 5 Minutes | 0 (0.0%) | 4 (20.0%) |
| 5 to 9 Minutes | 0 (0.0%) | 0 (0.0%) |
| 10 to 14 Minutes | 3 (9.1%) | 7 (35.0%) |
| 15 to 19 Minutes | 4 (12.1%) | 4 (20.0%) |
| 20 to 24 Minutes | 26 (78.8%) | 5 (25.0%) |
| 25 to 29 Minutes | 0 (0.0%) | 0 (0.0%) |
| 30 to 34 Minutes | 0 (0.0%) | 0 (0.0%) |
| 35 to 39 Minutes | 0 (0.0%) | 0 (0.0%) |
| 40 to 44 Minutes | 0 (0.0%) | 0 (0.0%) |
| 45 to 59 Minutes | 0 (0.0%) | 0 (0.0%) |
| 60 to 89 Minutes | 0 (0.0%) | 0 (0.0%) |
| 90 or more Minutes | 0 (0.0%) | 0 (0.0%) |
Time of Departure to Work by Sex in Middle Village
The most frequent times of departure to work in Middle Village are 7:00 AM to 7:29 AM (16, 48.5%) for males and 7:00 AM to 7:29 AM (5, 25.0%) for females.
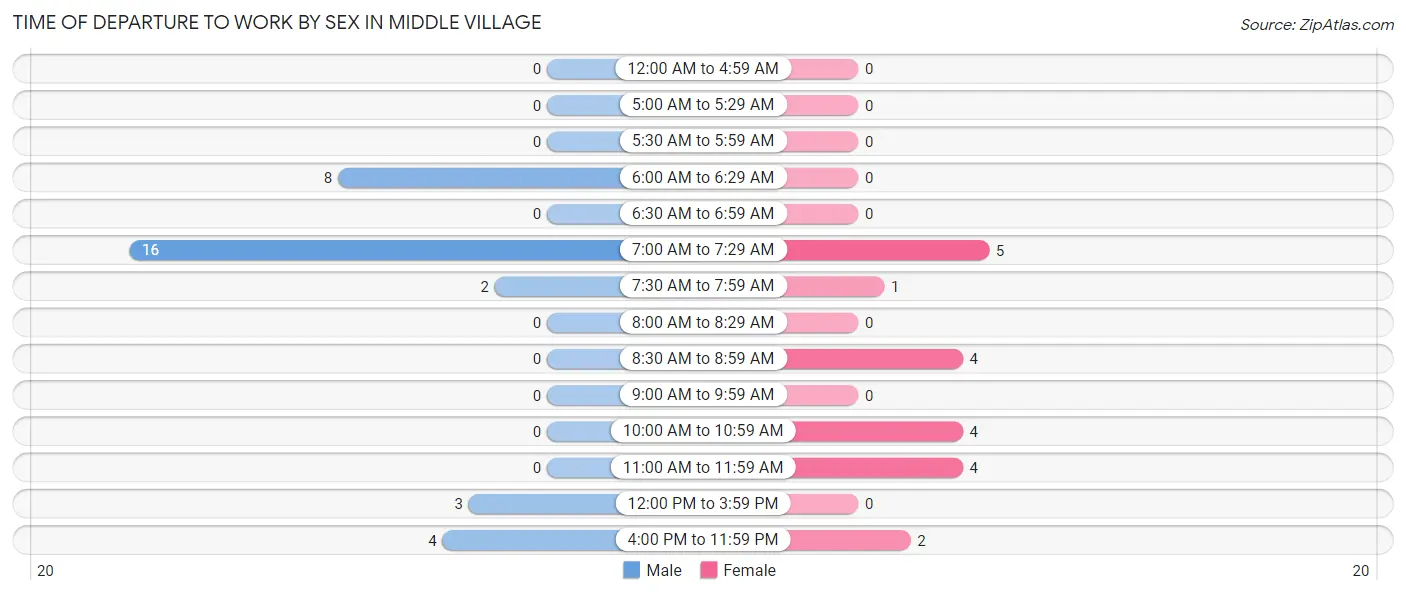
| Time of Departure | Male | Female |
| 12:00 AM to 4:59 AM | 0 (0.0%) | 0 (0.0%) |
| 5:00 AM to 5:29 AM | 0 (0.0%) | 0 (0.0%) |
| 5:30 AM to 5:59 AM | 0 (0.0%) | 0 (0.0%) |
| 6:00 AM to 6:29 AM | 8 (24.2%) | 0 (0.0%) |
| 6:30 AM to 6:59 AM | 0 (0.0%) | 0 (0.0%) |
| 7:00 AM to 7:29 AM | 16 (48.5%) | 5 (25.0%) |
| 7:30 AM to 7:59 AM | 2 (6.1%) | 1 (5.0%) |
| 8:00 AM to 8:29 AM | 0 (0.0%) | 0 (0.0%) |
| 8:30 AM to 8:59 AM | 0 (0.0%) | 4 (20.0%) |
| 9:00 AM to 9:59 AM | 0 (0.0%) | 0 (0.0%) |
| 10:00 AM to 10:59 AM | 0 (0.0%) | 4 (20.0%) |
| 11:00 AM to 11:59 AM | 0 (0.0%) | 4 (20.0%) |
| 12:00 PM to 3:59 PM | 3 (9.1%) | 0 (0.0%) |
| 4:00 PM to 11:59 PM | 4 (12.1%) | 2 (10.0%) |
| Total | 33 (100.0%) | 20 (100.0%) |
Housing Occupancy in Middle Village
Occupancy by Ownership in Middle Village
Of the total 49 dwellings in Middle Village, owner-occupied units account for 35 (71.4%), while renter-occupied units make up 14 (28.6%).
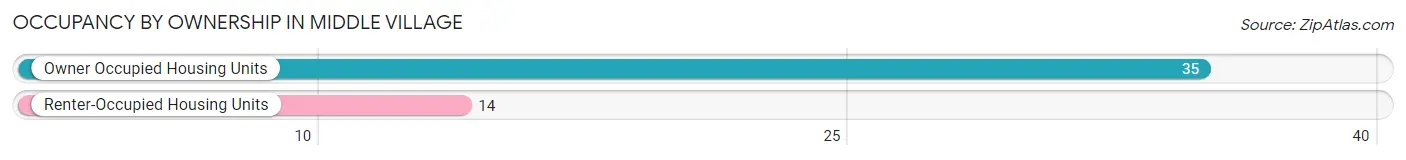
| Occupancy | # Housing Units | % Housing Units |
| Owner Occupied Housing Units | 35 | 71.4% |
| Renter-Occupied Housing Units | 14 | 28.6% |
| Total Occupied Housing Units | 49 | 100.0% |
Occupancy by Household Size in Middle Village
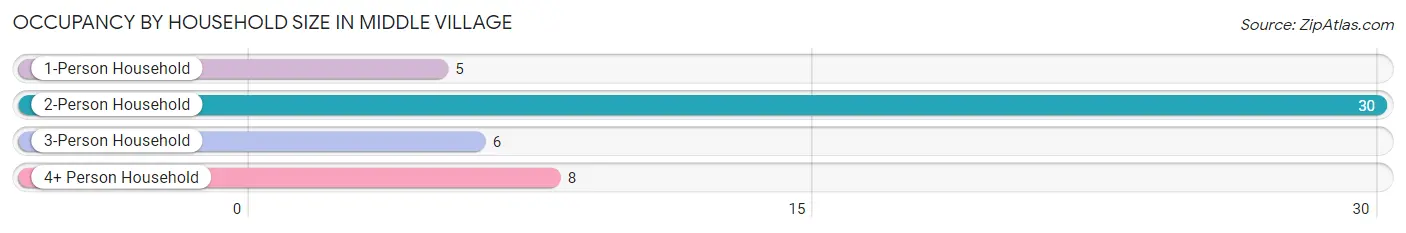
| Household Size | # Housing Units | % Housing Units |
| 1-Person Household | 5 | 10.2% |
| 2-Person Household | 30 | 61.2% |
| 3-Person Household | 6 | 12.2% |
| 4+ Person Household | 8 | 16.3% |
| Total Housing Units | 49 | 100.0% |
Occupancy by Ownership by Household Size in Middle Village
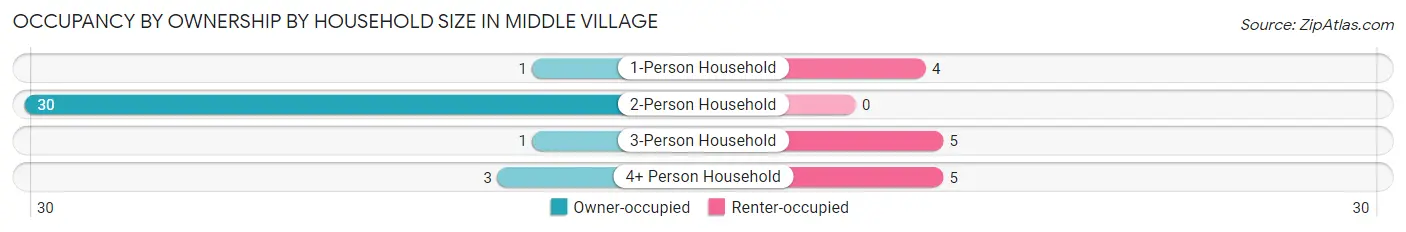
| Household Size | Owner-occupied | Renter-occupied |
| 1-Person Household | 1 (20.0%) | 4 (80.0%) |
| 2-Person Household | 30 (100.0%) | 0 (0.0%) |
| 3-Person Household | 1 (16.7%) | 5 (83.3%) |
| 4+ Person Household | 3 (37.5%) | 5 (62.5%) |
| Total Housing Units | 35 (71.4%) | 14 (28.6%) |
Occupancy by Educational Attainment in Middle Village
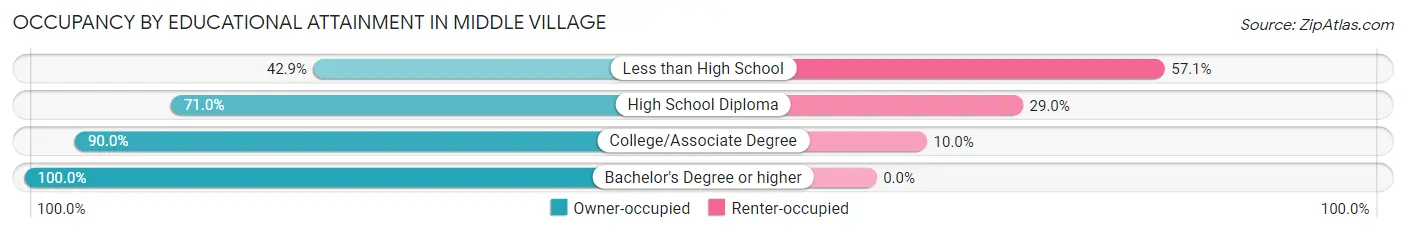
| Household Size | Owner-occupied | Renter-occupied |
| Less than High School | 3 (42.9%) | 4 (57.1%) |
| High School Diploma | 22 (71.0%) | 9 (29.0%) |
| College/Associate Degree | 9 (90.0%) | 1 (10.0%) |
| Bachelor's Degree or higher | 1 (100.0%) | 0 (0.0%) |
Occupancy by Age of Householder in Middle Village
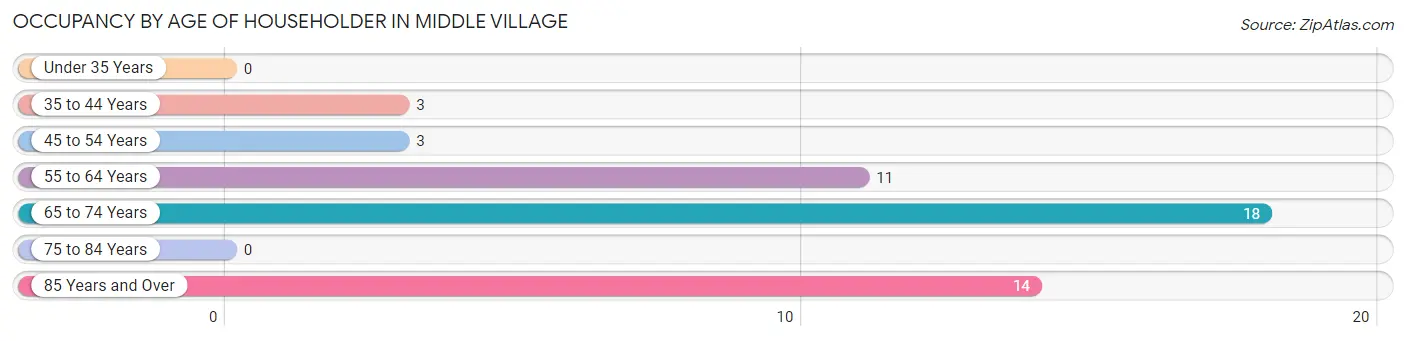
| Age Bracket | # Households | % Households |
| Under 35 Years | 0 | 0.0% |
| 35 to 44 Years | 3 | 6.1% |
| 45 to 54 Years | 3 | 6.1% |
| 55 to 64 Years | 11 | 22.5% |
| 65 to 74 Years | 18 | 36.7% |
| 75 to 84 Years | 0 | 0.0% |
| 85 Years and Over | 14 | 28.6% |
| Total | 49 | 100.0% |
Housing Finances in Middle Village
Median Income by Occupancy in Middle Village
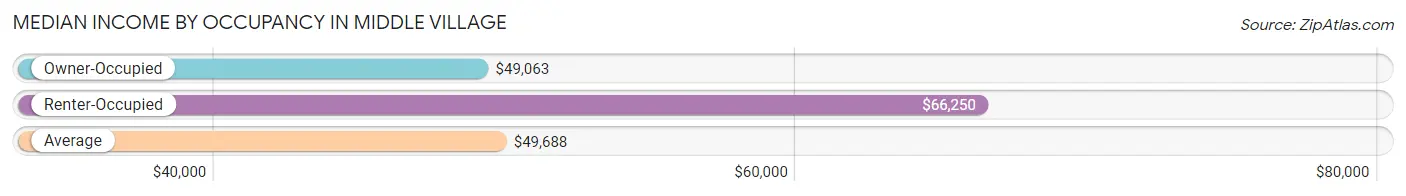
| Occupancy Type | # Households | Median Income |
| Owner-Occupied | 35 (71.4%) | $49,063 |
| Renter-Occupied | 14 (28.6%) | $66,250 |
| Average | 49 (100.0%) | $49,688 |
Occupancy by Householder Income Bracket in Middle Village
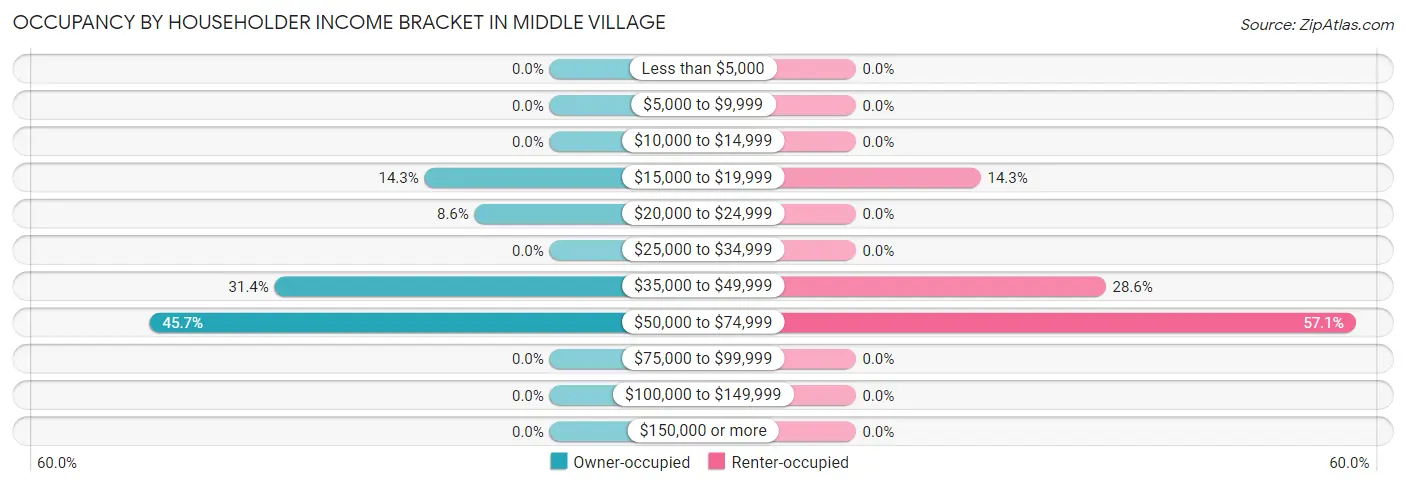
| Income Bracket | Owner-occupied | Renter-occupied |
| Less than $5,000 | 0 (0.0%) | 0 (0.0%) |
| $5,000 to $9,999 | 0 (0.0%) | 0 (0.0%) |
| $10,000 to $14,999 | 0 (0.0%) | 0 (0.0%) |
| $15,000 to $19,999 | 5 (14.3%) | 2 (14.3%) |
| $20,000 to $24,999 | 3 (8.6%) | 0 (0.0%) |
| $25,000 to $34,999 | 0 (0.0%) | 0 (0.0%) |
| $35,000 to $49,999 | 11 (31.4%) | 4 (28.6%) |
| $50,000 to $74,999 | 16 (45.7%) | 8 (57.1%) |
| $75,000 to $99,999 | 0 (0.0%) | 0 (0.0%) |
| $100,000 to $149,999 | 0 (0.0%) | 0 (0.0%) |
| $150,000 or more | 0 (0.0%) | 0 (0.0%) |
| Total | 35 (100.0%) | 14 (100.0%) |
Monthly Housing Cost Tiers in Middle Village
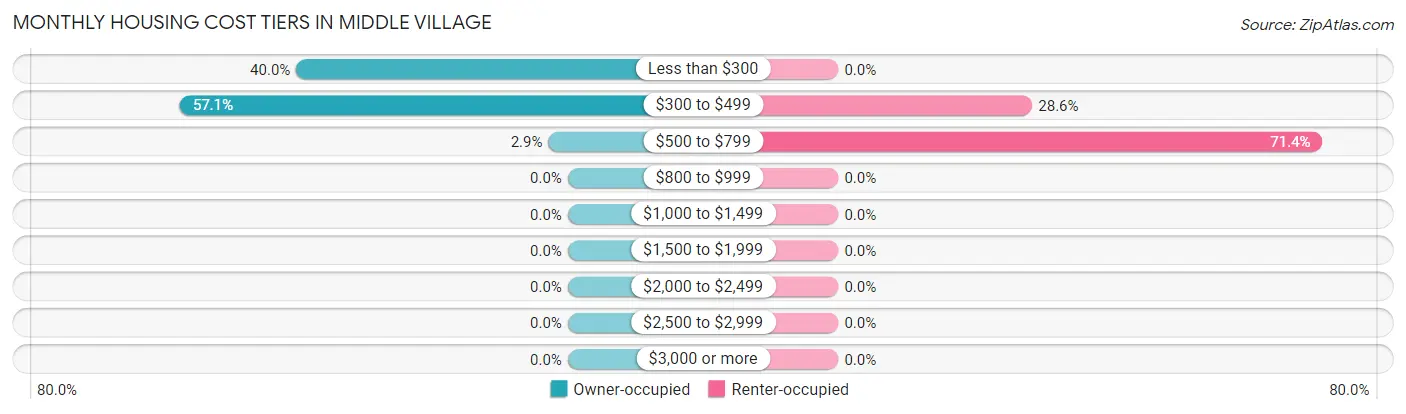
| Monthly Cost | Owner-occupied | Renter-occupied |
| Less than $300 | 14 (40.0%) | 0 (0.0%) |
| $300 to $499 | 20 (57.1%) | 4 (28.6%) |
| $500 to $799 | 1 (2.9%) | 10 (71.4%) |
| $800 to $999 | 0 (0.0%) | 0 (0.0%) |
| $1,000 to $1,499 | 0 (0.0%) | 0 (0.0%) |
| $1,500 to $1,999 | 0 (0.0%) | 0 (0.0%) |
| $2,000 to $2,499 | 0 (0.0%) | 0 (0.0%) |
| $2,500 to $2,999 | 0 (0.0%) | 0 (0.0%) |
| $3,000 or more | 0 (0.0%) | 0 (0.0%) |
| Total | 35 (100.0%) | 14 (100.0%) |
Physical Housing Characteristics in Middle Village
Housing Structures in Middle Village
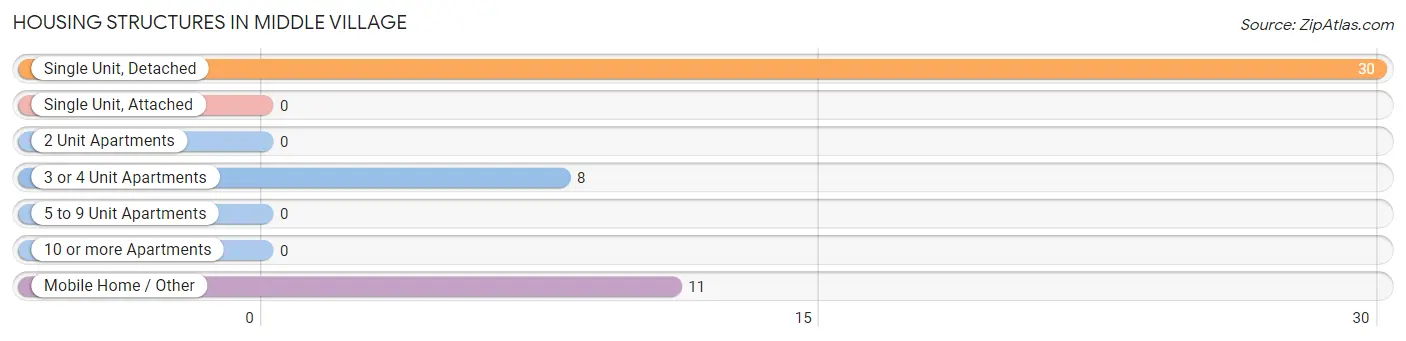
| Structure Type | # Housing Units | % Housing Units |
| Single Unit, Detached | 30 | 61.2% |
| Single Unit, Attached | 0 | 0.0% |
| 2 Unit Apartments | 0 | 0.0% |
| 3 or 4 Unit Apartments | 8 | 16.3% |
| 5 to 9 Unit Apartments | 0 | 0.0% |
| 10 or more Apartments | 0 | 0.0% |
| Mobile Home / Other | 11 | 22.5% |
| Total | 49 | 100.0% |
Housing Structures by Occupancy in Middle Village
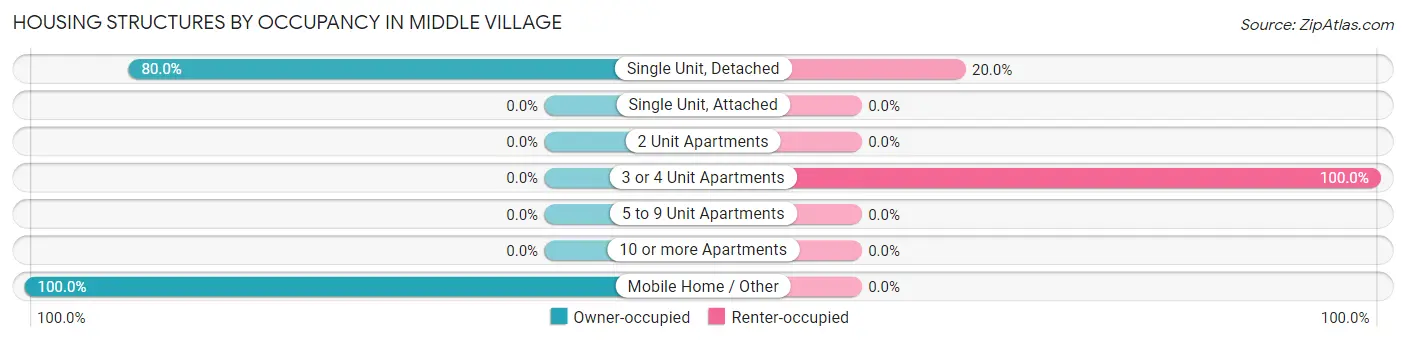
| Structure Type | Owner-occupied | Renter-occupied |
| Single Unit, Detached | 24 (80.0%) | 6 (20.0%) |
| Single Unit, Attached | 0 (0.0%) | 0 (0.0%) |
| 2 Unit Apartments | 0 (0.0%) | 0 (0.0%) |
| 3 or 4 Unit Apartments | 0 (0.0%) | 8 (100.0%) |
| 5 to 9 Unit Apartments | 0 (0.0%) | 0 (0.0%) |
| 10 or more Apartments | 0 (0.0%) | 0 (0.0%) |
| Mobile Home / Other | 11 (100.0%) | 0 (0.0%) |
| Total | 35 (71.4%) | 14 (28.6%) |
Housing Structures by Number of Rooms in Middle Village
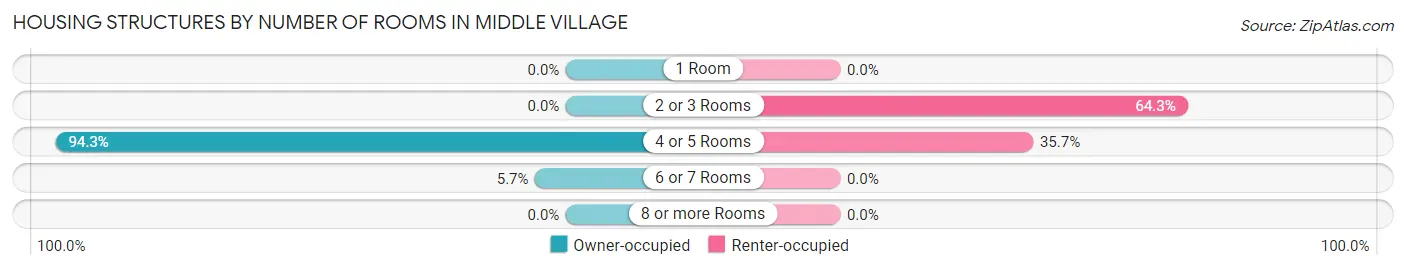
| Number of Rooms | Owner-occupied | Renter-occupied |
| 1 Room | 0 (0.0%) | 0 (0.0%) |
| 2 or 3 Rooms | 0 (0.0%) | 9 (64.3%) |
| 4 or 5 Rooms | 33 (94.3%) | 5 (35.7%) |
| 6 or 7 Rooms | 2 (5.7%) | 0 (0.0%) |
| 8 or more Rooms | 0 (0.0%) | 0 (0.0%) |
| Total | 35 (100.0%) | 14 (100.0%) |
Housing Structure by Heating Type in Middle Village
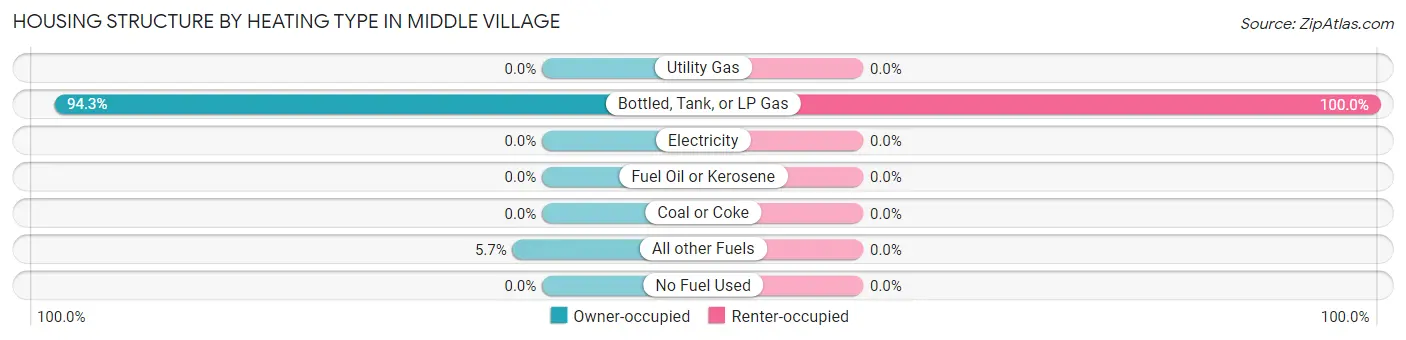
| Heating Type | Owner-occupied | Renter-occupied |
| Utility Gas | 0 (0.0%) | 0 (0.0%) |
| Bottled, Tank, or LP Gas | 33 (94.3%) | 14 (100.0%) |
| Electricity | 0 (0.0%) | 0 (0.0%) |
| Fuel Oil or Kerosene | 0 (0.0%) | 0 (0.0%) |
| Coal or Coke | 0 (0.0%) | 0 (0.0%) |
| All other Fuels | 2 (5.7%) | 0 (0.0%) |
| No Fuel Used | 0 (0.0%) | 0 (0.0%) |
| Total | 35 (100.0%) | 14 (100.0%) |
Household Vehicle Usage in Middle Village
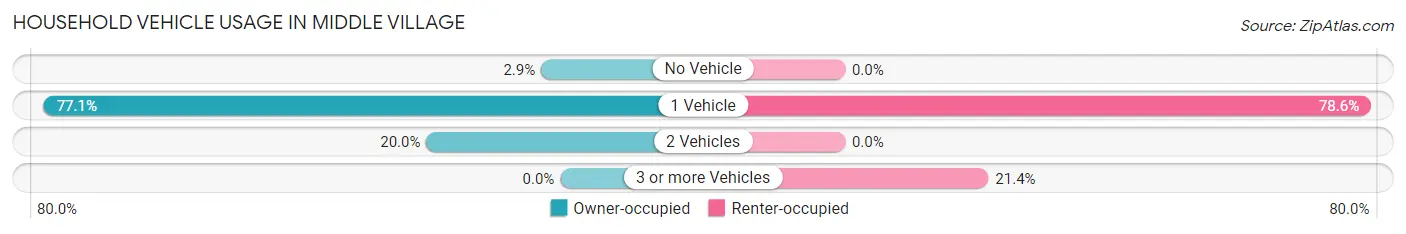
| Vehicles per Household | Owner-occupied | Renter-occupied |
| No Vehicle | 1 (2.9%) | 0 (0.0%) |
| 1 Vehicle | 27 (77.1%) | 11 (78.6%) |
| 2 Vehicles | 7 (20.0%) | 0 (0.0%) |
| 3 or more Vehicles | 0 (0.0%) | 3 (21.4%) |
| Total | 35 (100.0%) | 14 (100.0%) |
Real Estate & Mortgages in Middle Village
Real Estate and Mortgage Overview in Middle Village
| Characteristic | Without Mortgage | With Mortgage |
| Housing Units | 34 | 1 |
| Median Property Value | - | - |
| Median Household Income | $49,375 | $0 |
| Monthly Housing Costs | $400 | $0 |
| Real Estate Taxes | - | - |
Property Value by Mortgage Status in Middle Village
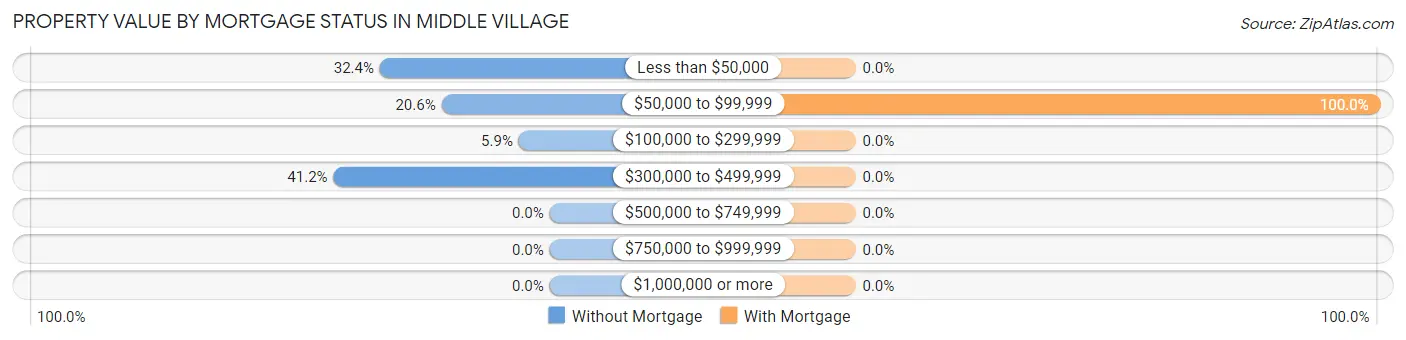
| Property Value | Without Mortgage | With Mortgage |
| Less than $50,000 | 11 (32.4%) | 0 (0.0%) |
| $50,000 to $99,999 | 7 (20.6%) | 1 (100.0%) |
| $100,000 to $299,999 | 2 (5.9%) | 0 (0.0%) |
| $300,000 to $499,999 | 14 (41.2%) | 0 (0.0%) |
| $500,000 to $749,999 | 0 (0.0%) | 0 (0.0%) |
| $750,000 to $999,999 | 0 (0.0%) | 0 (0.0%) |
| $1,000,000 or more | 0 (0.0%) | 0 (0.0%) |
| Total | 34 (100.0%) | 1 (100.0%) |
Household Income by Mortgage Status in Middle Village
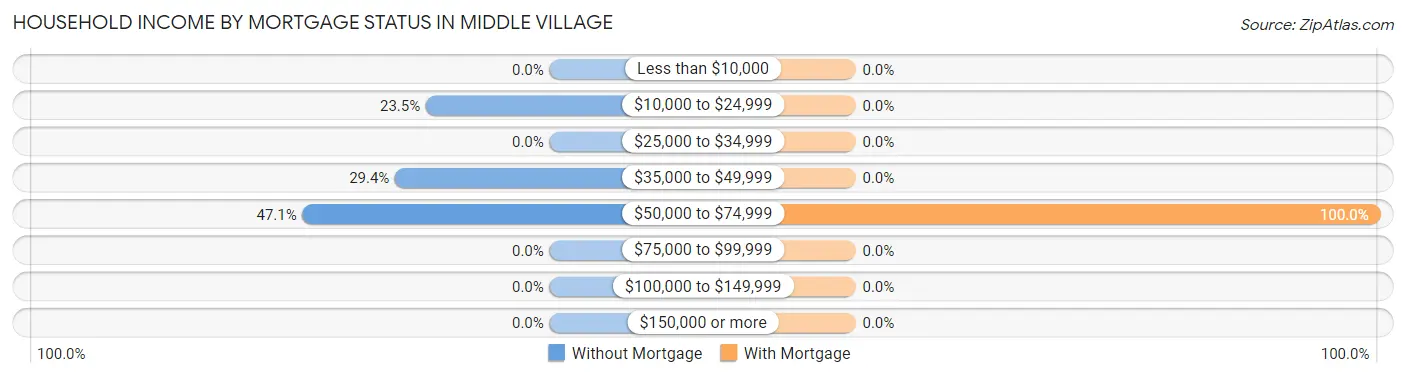
| Household Income | Without Mortgage | With Mortgage |
| Less than $10,000 | 0 (0.0%) | 0 (0.0%) |
| $10,000 to $24,999 | 8 (23.5%) | 0 (0.0%) |
| $25,000 to $34,999 | 0 (0.0%) | 0 (0.0%) |
| $35,000 to $49,999 | 10 (29.4%) | 0 (0.0%) |
| $50,000 to $74,999 | 16 (47.1%) | 1 (100.0%) |
| $75,000 to $99,999 | 0 (0.0%) | 0 (0.0%) |
| $100,000 to $149,999 | 0 (0.0%) | 0 (0.0%) |
| $150,000 or more | 0 (0.0%) | 0 (0.0%) |
| Total | 34 (100.0%) | 1 (100.0%) |
Property Value to Household Income Ratio in Middle Village
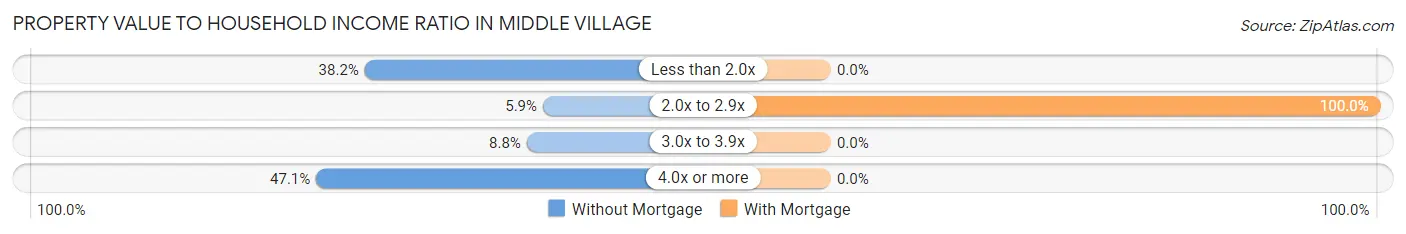
| Value-to-Income Ratio | Without Mortgage | With Mortgage |
| Less than 2.0x | 13 (38.2%) | 0 (0.0%) |
| 2.0x to 2.9x | 2 (5.9%) | 1 (100.0%) |
| 3.0x to 3.9x | 3 (8.8%) | 0 (0.0%) |
| 4.0x or more | 16 (47.1%) | 0 (0.0%) |
| Total | 34 (100.0%) | 1 (100.0%) |
Real Estate Taxes by Mortgage Status in Middle Village
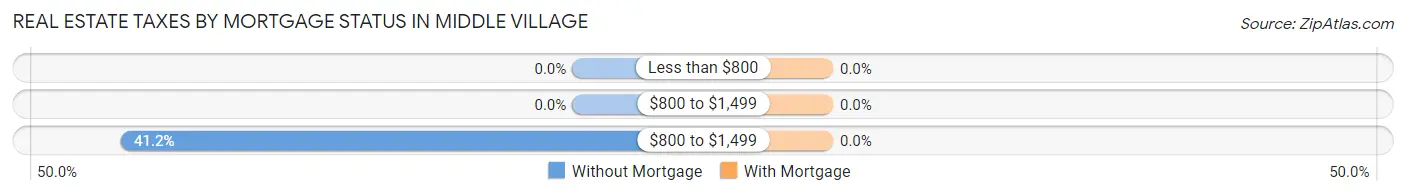
| Property Taxes | Without Mortgage | With Mortgage |
| Less than $800 | 0 (0.0%) | 0 (0.0%) |
| $800 to $1,499 | 0 (0.0%) | 0 (0.0%) |
| $800 to $1,499 | 14 (41.2%) | 0 (0.0%) |
| Total | 34 (100.0%) | 1 (100.0%) |
Health & Disability in Middle Village
Health Insurance Coverage by Age in Middle Village
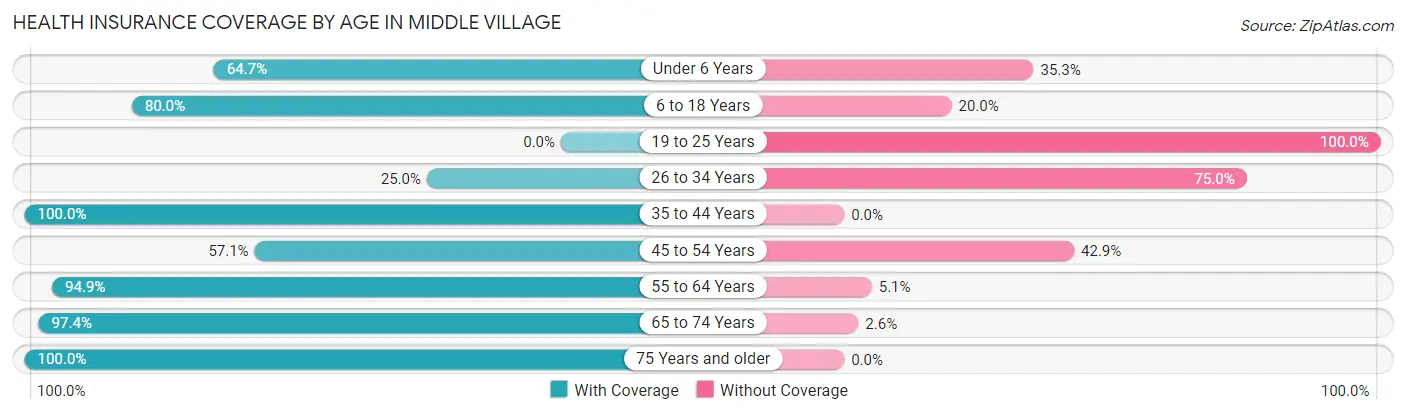
| Age Bracket | With Coverage | Without Coverage |
| Under 6 Years | 11 (64.7%) | 6 (35.3%) |
| 6 to 18 Years | 24 (80.0%) | 6 (20.0%) |
| 19 to 25 Years | 0 (0.0%) | 4 (100.0%) |
| 26 to 34 Years | 4 (25.0%) | 12 (75.0%) |
| 35 to 44 Years | 3 (100.0%) | 0 (0.0%) |
| 45 to 54 Years | 4 (57.1%) | 3 (42.9%) |
| 55 to 64 Years | 37 (94.9%) | 2 (5.1%) |
| 65 to 74 Years | 37 (97.4%) | 1 (2.6%) |
| 75 Years and older | 14 (100.0%) | 0 (0.0%) |
| Total | 134 (79.8%) | 34 (20.2%) |
Health Insurance Coverage by Citizenship Status in Middle Village
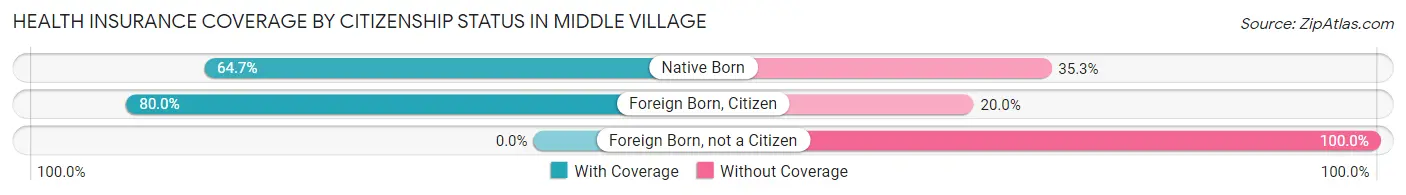
| Citizenship Status | With Coverage | Without Coverage |
| Native Born | 11 (64.7%) | 6 (35.3%) |
| Foreign Born, Citizen | 24 (80.0%) | 6 (20.0%) |
| Foreign Born, not a Citizen | 0 (0.0%) | 4 (100.0%) |
Health Insurance Coverage by Household Income in Middle Village
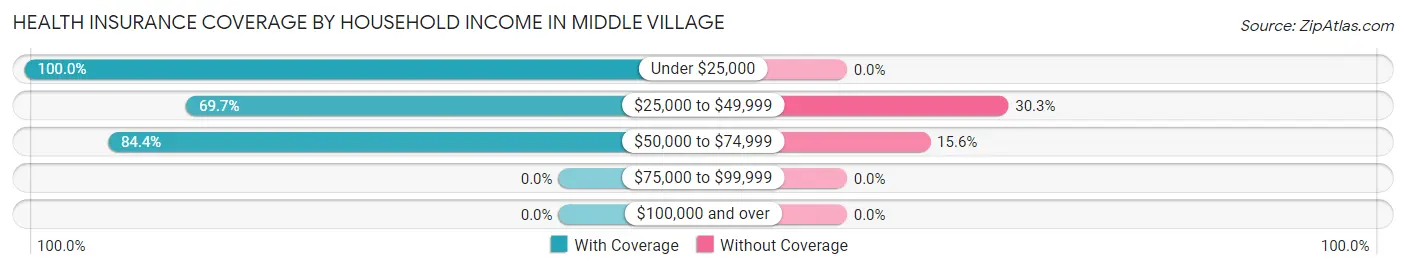
| Household Income | With Coverage | Without Coverage |
| Under $25,000 | 25 (100.0%) | 0 (0.0%) |
| $25,000 to $49,999 | 53 (69.7%) | 23 (30.3%) |
| $50,000 to $74,999 | 54 (84.4%) | 10 (15.6%) |
| $75,000 to $99,999 | 0 (0.0%) | 0 (0.0%) |
| $100,000 and over | 0 (0.0%) | 0 (0.0%) |
Public vs Private Health Insurance Coverage by Age in Middle Village
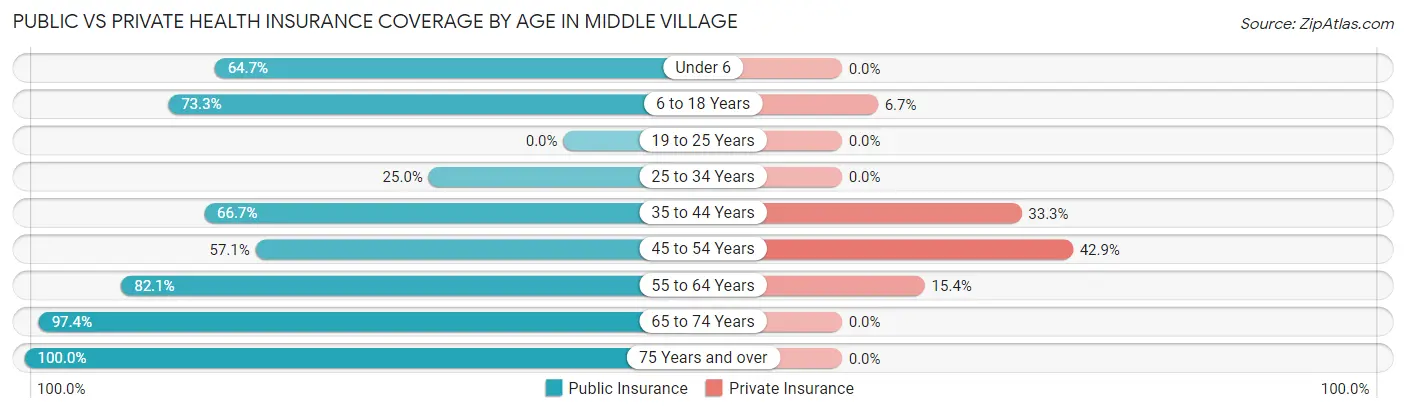
| Age Bracket | Public Insurance | Private Insurance |
| Under 6 | 11 (64.7%) | 0 (0.0%) |
| 6 to 18 Years | 22 (73.3%) | 2 (6.7%) |
| 19 to 25 Years | 0 (0.0%) | 0 (0.0%) |
| 25 to 34 Years | 4 (25.0%) | 0 (0.0%) |
| 35 to 44 Years | 2 (66.7%) | 1 (33.3%) |
| 45 to 54 Years | 4 (57.1%) | 3 (42.9%) |
| 55 to 64 Years | 32 (82.1%) | 6 (15.4%) |
| 65 to 74 Years | 37 (97.4%) | 0 (0.0%) |
| 75 Years and over | 14 (100.0%) | 0 (0.0%) |
| Total | 126 (75.0%) | 12 (7.1%) |
Disability Status by Sex by Age in Middle Village
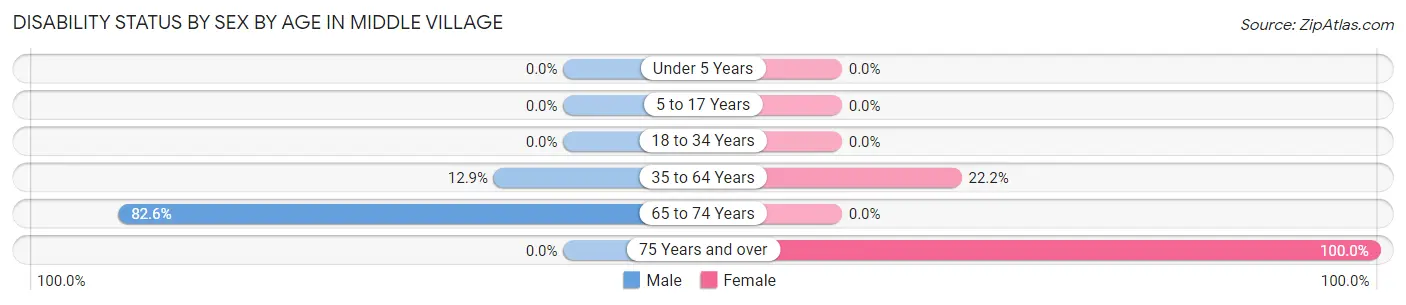
| Age Bracket | Male | Female |
| Under 5 Years | 0 (0.0%) | 0 (0.0%) |
| 5 to 17 Years | 0 (0.0%) | 0 (0.0%) |
| 18 to 34 Years | 0 (0.0%) | 0 (0.0%) |
| 35 to 64 Years | 4 (12.9%) | 4 (22.2%) |
| 65 to 74 Years | 19 (82.6%) | 0 (0.0%) |
| 75 Years and over | 0 (0.0%) | 14 (100.0%) |
Disability Class by Sex by Age in Middle Village
Disability Class: Hearing Difficulty
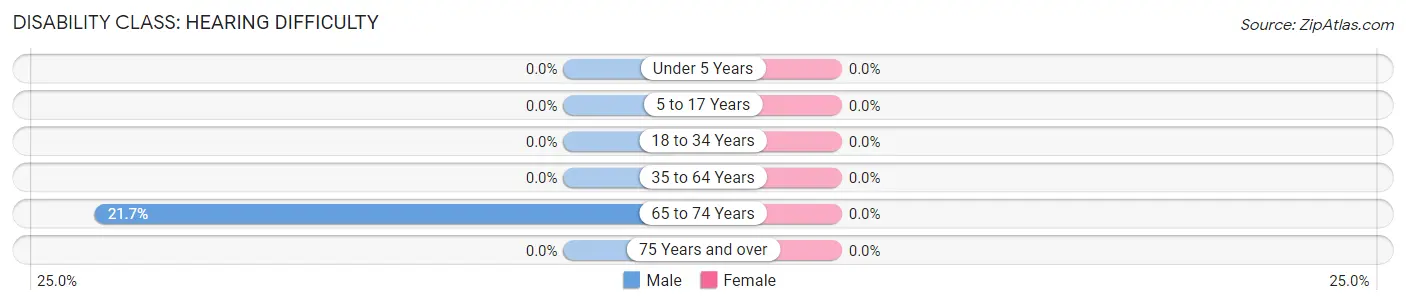
| Age Bracket | Male | Female |
| Under 5 Years | 0 (0.0%) | 0 (0.0%) |
| 5 to 17 Years | 0 (0.0%) | 0 (0.0%) |
| 18 to 34 Years | 0 (0.0%) | 0 (0.0%) |
| 35 to 64 Years | 0 (0.0%) | 0 (0.0%) |
| 65 to 74 Years | 5 (21.7%) | 0 (0.0%) |
| 75 Years and over | 0 (0.0%) | 0 (0.0%) |
Disability Class: Vision Difficulty
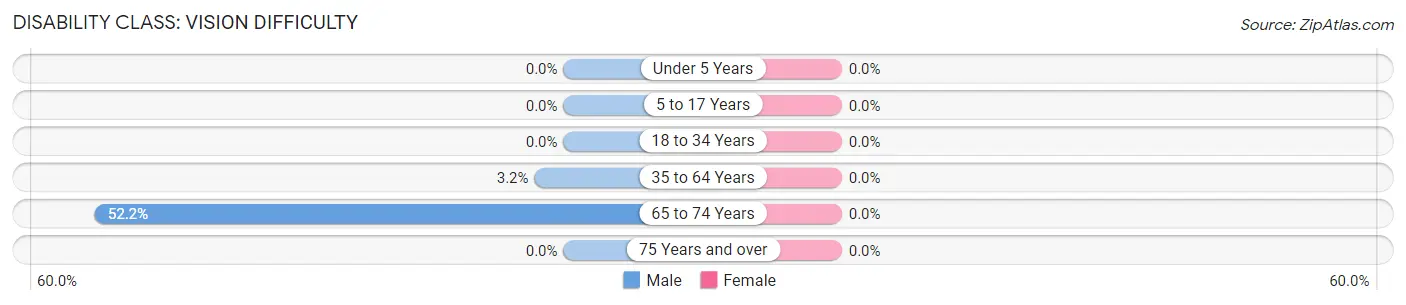
| Age Bracket | Male | Female |
| Under 5 Years | 0 (0.0%) | 0 (0.0%) |
| 5 to 17 Years | 0 (0.0%) | 0 (0.0%) |
| 18 to 34 Years | 0 (0.0%) | 0 (0.0%) |
| 35 to 64 Years | 1 (3.2%) | 0 (0.0%) |
| 65 to 74 Years | 12 (52.2%) | 0 (0.0%) |
| 75 Years and over | 0 (0.0%) | 0 (0.0%) |
Disability Class: Cognitive Difficulty
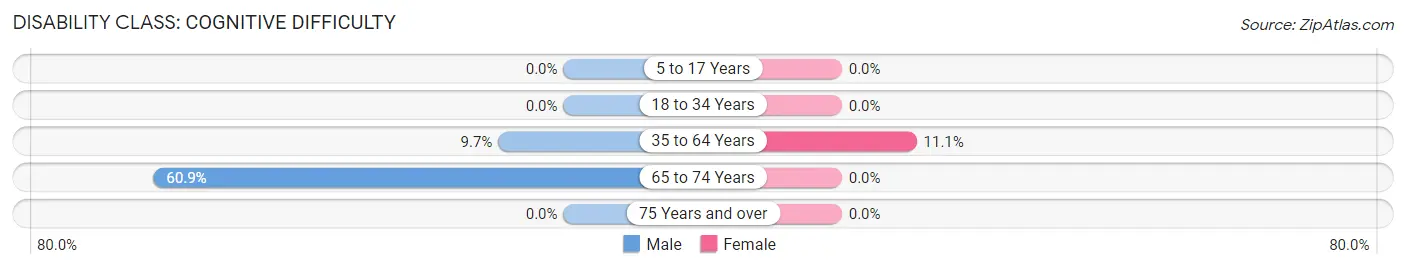
| Age Bracket | Male | Female |
| 5 to 17 Years | 0 (0.0%) | 0 (0.0%) |
| 18 to 34 Years | 0 (0.0%) | 0 (0.0%) |
| 35 to 64 Years | 3 (9.7%) | 2 (11.1%) |
| 65 to 74 Years | 14 (60.9%) | 0 (0.0%) |
| 75 Years and over | 0 (0.0%) | 0 (0.0%) |
Disability Class: Ambulatory Difficulty
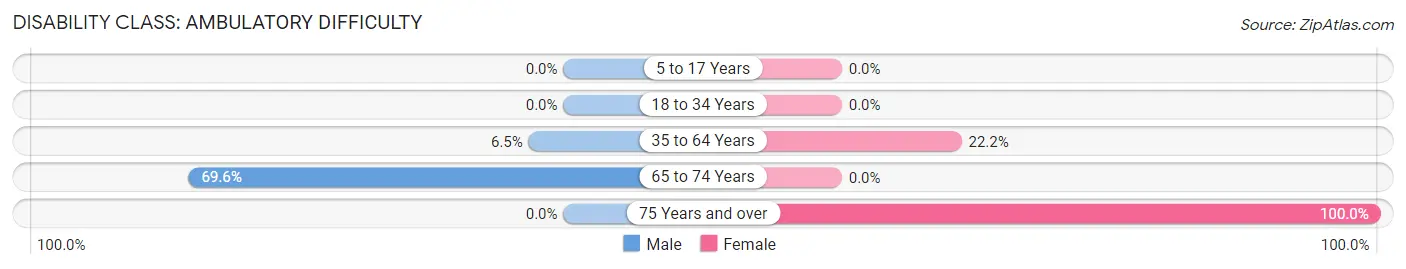
| Age Bracket | Male | Female |
| 5 to 17 Years | 0 (0.0%) | 0 (0.0%) |
| 18 to 34 Years | 0 (0.0%) | 0 (0.0%) |
| 35 to 64 Years | 2 (6.5%) | 4 (22.2%) |
| 65 to 74 Years | 16 (69.6%) | 0 (0.0%) |
| 75 Years and over | 0 (0.0%) | 14 (100.0%) |
Disability Class: Self-Care Difficulty
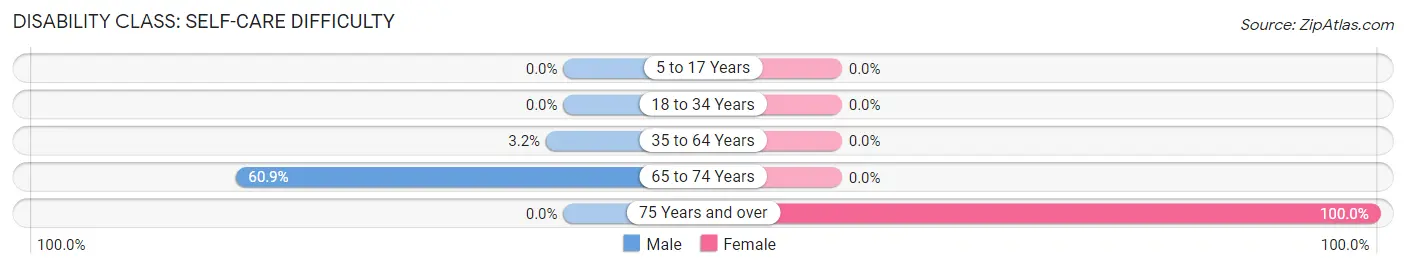
| Age Bracket | Male | Female |
| 5 to 17 Years | 0 (0.0%) | 0 (0.0%) |
| 18 to 34 Years | 0 (0.0%) | 0 (0.0%) |
| 35 to 64 Years | 1 (3.2%) | 0 (0.0%) |
| 65 to 74 Years | 14 (60.9%) | 0 (0.0%) |
| 75 Years and over | 0 (0.0%) | 14 (100.0%) |
Technology Access in Middle Village
Computing Device Access in Middle Village
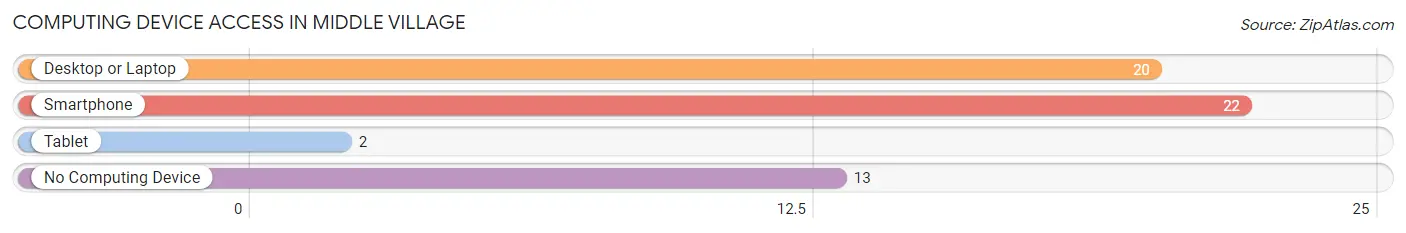
| Device Type | # Households | % Households |
| Desktop or Laptop | 20 | 40.8% |
| Smartphone | 22 | 44.9% |
| Tablet | 2 | 4.1% |
| No Computing Device | 13 | 26.5% |
| Total | 49 | 100.0% |
Internet Access in Middle Village
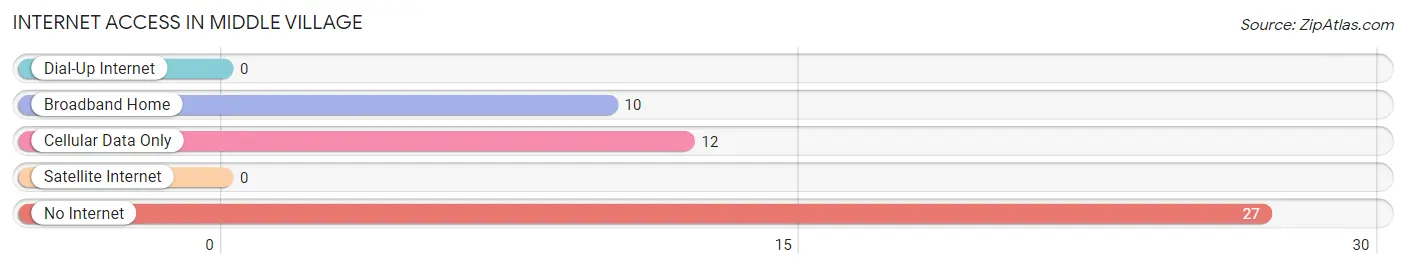
| Internet Type | # Households | % Households |
| Dial-Up Internet | 0 | 0.0% |
| Broadband Home | 10 | 20.4% |
| Cellular Data Only | 12 | 24.5% |
| Satellite Internet | 0 | 0.0% |
| No Internet | 27 | 55.1% |
| Total | 49 | 100.0% |
Middle Village Summary
Introduction
Middle Village is a small unincorporated community located in the Town of Caledonia in Racine County, Wisconsin. It is situated on the banks of the Fox River, about 20 miles south of Milwaukee. The village is home to a population of about 1,000 people and is known for its rural charm and small-town atmosphere.
History
Middle Village was first settled in the early 1800s by German immigrants who were attracted to the area by its fertile soil and abundant natural resources. The village was originally known as “Mittel Dorf”, which translates to “Middle Village” in English. The village was officially incorporated in 1856 and was home to a variety of businesses, including a sawmill, a grist mill, a blacksmith shop, and a general store.
In the late 1800s, the village began to experience a period of growth and prosperity. The Fox River was used to transport goods and services to and from the village, and the railroad was extended to the village in 1887. This allowed for the transportation of goods and services to and from Milwaukee and other nearby cities.
The village continued to grow and prosper until the Great Depression, when the economy of the village began to decline. The village was hit hard by the economic downturn and many of the businesses in the village closed. The village was able to recover from the depression, however, and by the 1950s the village was once again thriving.
Geography
Middle Village is located in the Town of Caledonia in Racine County, Wisconsin. The village is situated on the banks of the Fox River, about 20 miles south of Milwaukee. The village is surrounded by rolling hills and farmland, and is home to a variety of wildlife, including deer, foxes, and other small animals.
The village is located in a temperate climate, with hot summers and cold winters. The average temperature in the summer is around 75 degrees Fahrenheit, and the average temperature in the winter is around 25 degrees Fahrenheit. The village receives an average of 40 inches of precipitation per year, with most of the precipitation occurring in the spring and summer months.
Economy
The economy of Middle Village is largely based on agriculture and tourism. The village is home to a variety of farms, which produce a variety of crops, including corn, soybeans, and wheat. The village is also home to a number of small businesses, including restaurants, shops, and other services.
The village is also a popular tourist destination, as it is home to a variety of attractions, including the Fox River State Park, the Racine Zoo, and the Racine County Historical Society. The village is also home to a number of festivals and events throughout the year, including the Middle Village Summer Festival and the Middle Village Fall Festival.
Demographics
As of the 2010 census, the population of Middle Village was 1,000 people. The racial makeup of the village was 97.7% White, 0.7% African American, 0.3% Native American, 0.3% Asian, and 0.9% from other races. The median household income in the village was $50,000, and the median age was 40 years.
Conclusion
Middle Village is a small unincorporated community located in the Town of Caledonia in Racine County, Wisconsin. It is situated on the banks of the Fox River, about 20 miles south of Milwaukee. The village is home to a population of about 1,000 people and is known for its rural charm and small-town atmosphere. The economy of the village is largely based on agriculture and tourism, and the village is home to a variety of attractions, including the Fox River State Park, the Racine Zoo, and the Racine County Historical Society. The village is also home to a diverse population, with a median household income of $50,000 and a median age of 40 years.
Common Questions
What is Per Capita Income in Middle Village?
Per Capita income in Middle Village is $14,176.
What is the Median Family Income in Middle Village?
Median Family Income in Middle Village is $57,857.
What is the Median Household income in Middle Village?
Median Household Income in Middle Village is $49,688.
What is Income or Wage Gap in Middle Village?
Income or Wage Gap in Middle Village is 70.0%.
Women in Middle Village earn 30.0 cents for every dollar earned by a man.
What is Inequality or Gini Index in Middle Village?
Inequality or Gini Index in Middle Village is 0.20.
What is the Total Population of Middle Village?
Total Population of Middle Village is 173.
What is the Total Male Population of Middle Village?
Total Male Population of Middle Village is 80.
What is the Total Female Population of Middle Village?
Total Female Population of Middle Village is 93.
What is the Ratio of Males per 100 Females in Middle Village?
There are 86.02 Males per 100 Females in Middle Village.
What is the Ratio of Females per 100 Males in Middle Village?
There are 116.25 Females per 100 Males in Middle Village.
What is the Median Population Age in Middle Village?
Median Population Age in Middle Village is 58.8 Years.
What is the Average Family Size in Middle Village
Average Family Size in Middle Village is 3.7 People.
What is the Average Household Size in Middle Village
Average Household Size in Middle Village is 3.4 People.
How Large is the Labor Force in Middle Village?
There are 64 People in the Labor Forcein in Middle Village.
What is the Percentage of People in the Labor Force in Middle Village?
49.2% of People are in the Labor Force in Middle Village.
What is the Unemployment Rate in Middle Village?
Unemployment Rate in Middle Village is 6.3%.