Wabeno, WI Map & Demographics
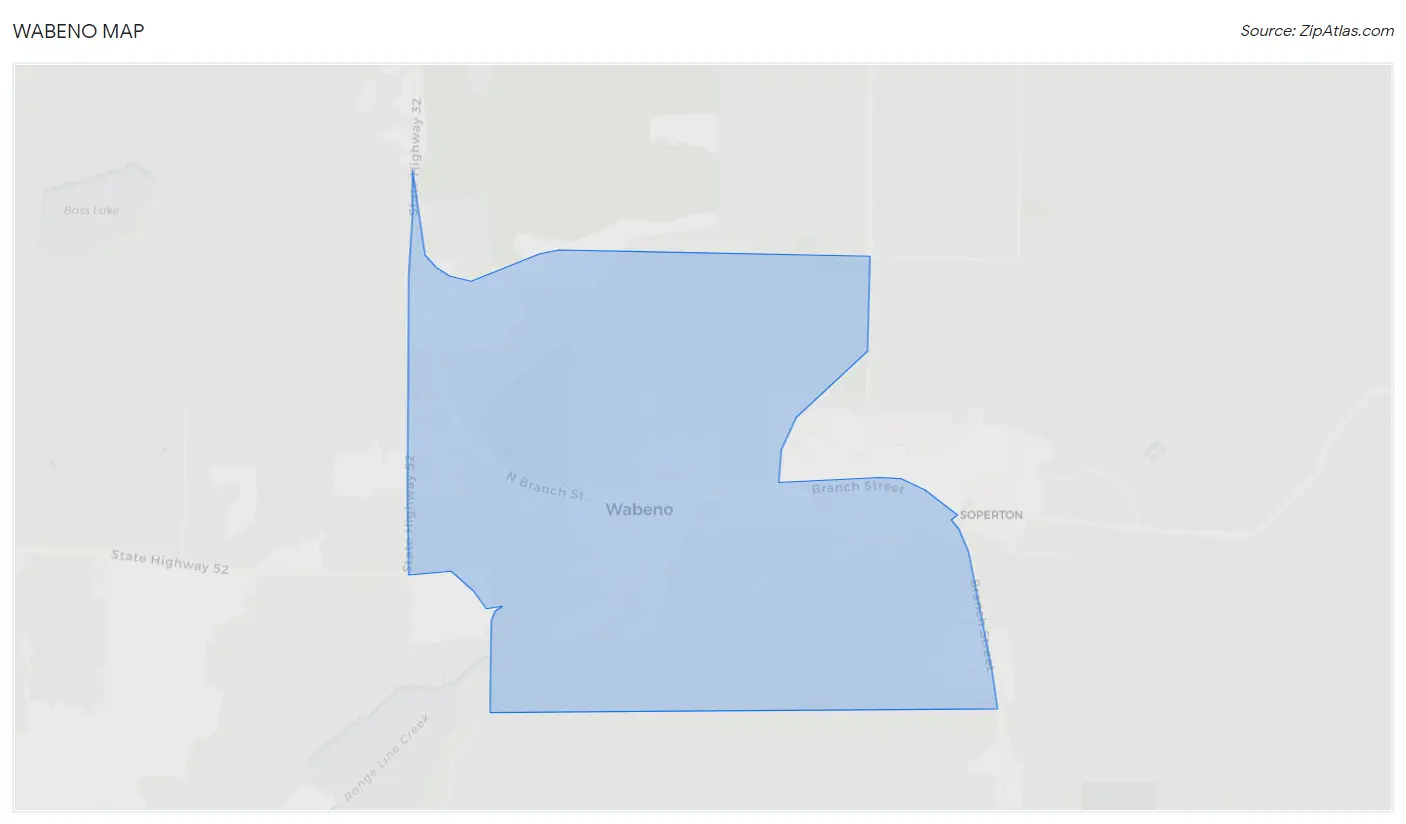
Wabeno Map
Wabeno Overview
$26,650
PER CAPITA INCOME
$31,000
AVG HOUSEHOLD INCOME
0.43
INEQUALITY / GINI INDEX
243
TOTAL POPULATION
125
MALE POPULATION
118
FEMALE POPULATION
105.93
MALES / 100 FEMALES
94.40
FEMALES / 100 MALES
50.6
MEDIAN AGE
2.5
AVG FAMILY SIZE
1.6
AVG HOUSEHOLD SIZE
85
LABOR FORCE [ PEOPLE ]
39.4%
PERCENT IN LABOR FORCE
4.7%
UNEMPLOYMENT RATE
Wabeno Zip Codes
Wabeno Area Codes
Income in Wabeno
Income Overview in Wabeno
| Characteristic | Number | Measure |
| Per Capita Income | 243 | $26,650 |
| Median Family Income | 42 | $0 |
| Mean Family Income | 42 | $38,838 |
| Median Household Income | 156 | $31,000 |
| Mean Household Income | 156 | $39,978 |
| Income Deficit | 42 | $0 |
| Wage / Income Gap (%) | 243 | 0.00% |
| Wage / Income Gap ($) | 243 | 100.00¢ per $1 |
| Gini / Inequality Index | 243 | 0.43 |
Earnings by Sex in Wabeno
| Sex | Number | Average Earnings |
| Male | 57 (59.4%) | $0 |
| Female | 39 (40.6%) | $0 |
| Total | 96 (100.0%) | $0 |
Earnings by Sex by Income Bracket in Wabeno
The most common earnings brackets in Wabeno are $12,500 to $14,999 for men (12 | 21.0%) and $2,500 to $4,999 for women (11 | 28.2%).
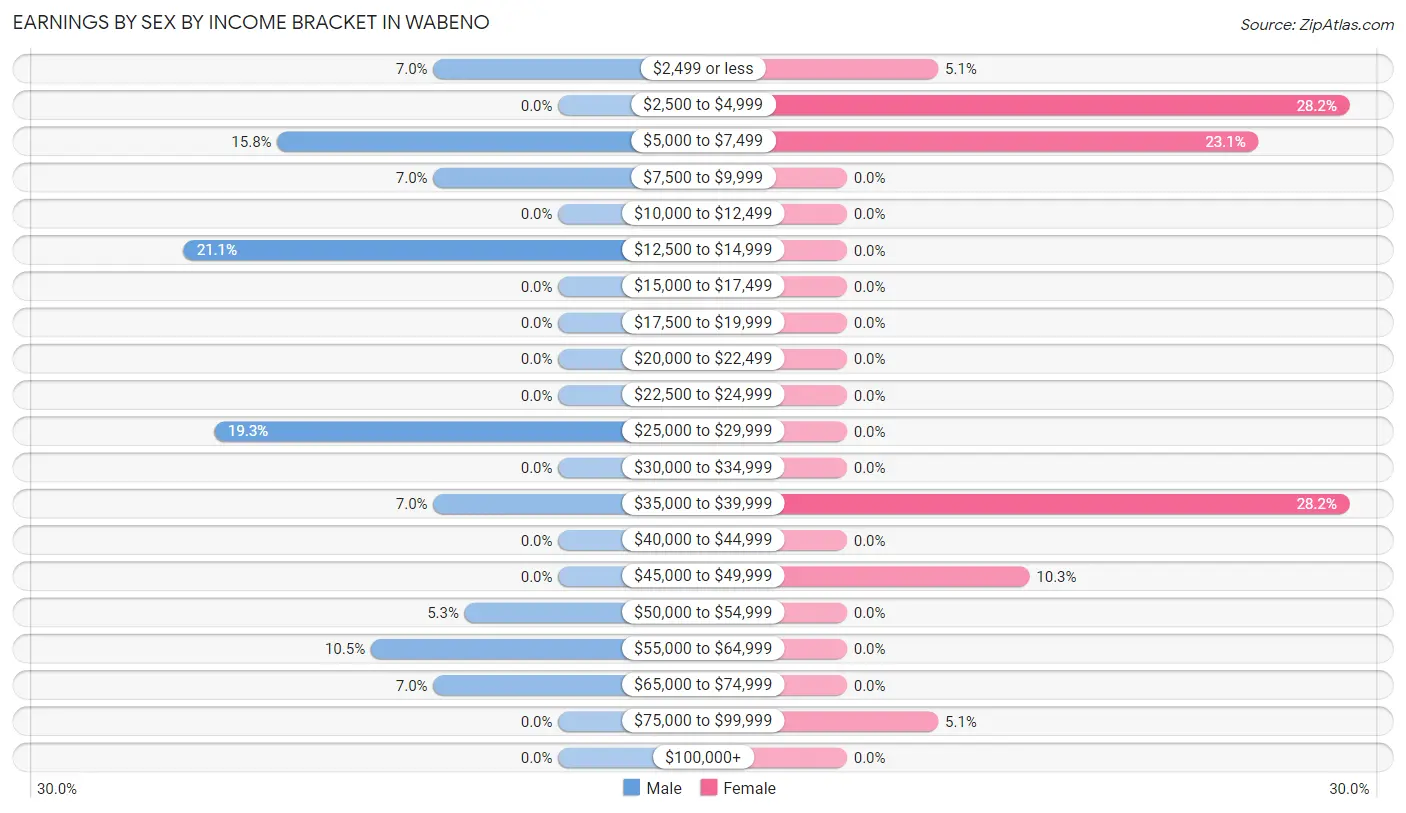
| Income | Male | Female |
| $2,499 or less | 4 (7.0%) | 2 (5.1%) |
| $2,500 to $4,999 | 0 (0.0%) | 11 (28.2%) |
| $5,000 to $7,499 | 9 (15.8%) | 9 (23.1%) |
| $7,500 to $9,999 | 4 (7.0%) | 0 (0.0%) |
| $10,000 to $12,499 | 0 (0.0%) | 0 (0.0%) |
| $12,500 to $14,999 | 12 (21.0%) | 0 (0.0%) |
| $15,000 to $17,499 | 0 (0.0%) | 0 (0.0%) |
| $17,500 to $19,999 | 0 (0.0%) | 0 (0.0%) |
| $20,000 to $22,499 | 0 (0.0%) | 0 (0.0%) |
| $22,500 to $24,999 | 0 (0.0%) | 0 (0.0%) |
| $25,000 to $29,999 | 11 (19.3%) | 0 (0.0%) |
| $30,000 to $34,999 | 0 (0.0%) | 0 (0.0%) |
| $35,000 to $39,999 | 4 (7.0%) | 11 (28.2%) |
| $40,000 to $44,999 | 0 (0.0%) | 0 (0.0%) |
| $45,000 to $49,999 | 0 (0.0%) | 4 (10.3%) |
| $50,000 to $54,999 | 3 (5.3%) | 0 (0.0%) |
| $55,000 to $64,999 | 6 (10.5%) | 0 (0.0%) |
| $65,000 to $74,999 | 4 (7.0%) | 0 (0.0%) |
| $75,000 to $99,999 | 0 (0.0%) | 2 (5.1%) |
| $100,000+ | 0 (0.0%) | 0 (0.0%) |
| Total | 57 (100.0%) | 39 (100.0%) |
Earnings by Sex by Educational Attainment in Wabeno
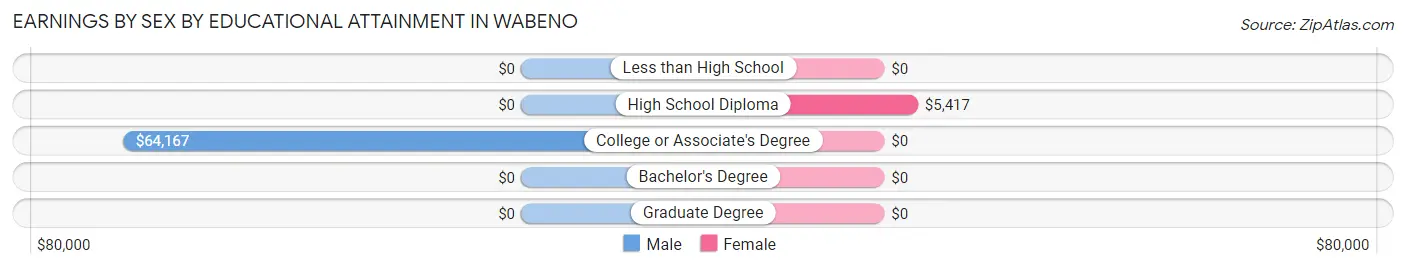
| Educational Attainment | Male Income | Female Income |
| Less than High School | - | - |
| High School Diploma | - | - |
| College or Associate's Degree | $64,167 | $0 |
| Bachelor's Degree | - | - |
| Graduate Degree | - | - |
| Total | - | - |
Family Income in Wabeno
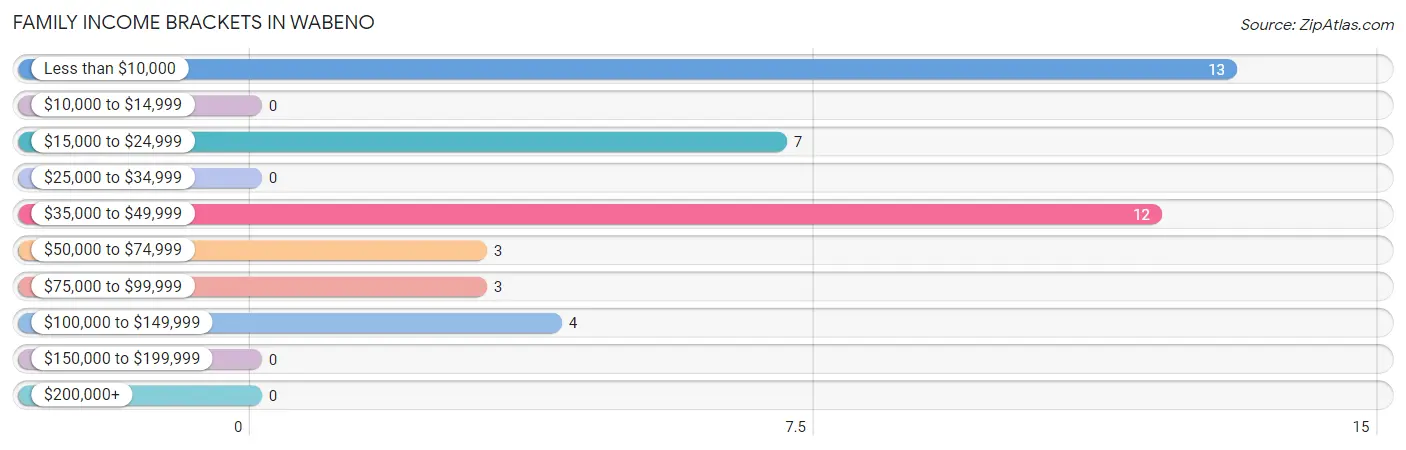
Family Income Brackets in Wabeno
According to the Wabeno family income data, there are 13 families falling into the less than $10,000 income range, which is the most common income bracket and makes up 30.9% of all families.
| Income Bracket | # Families | % Families |
| Less than $10,000 | 13 | 31.0% |
| $10,000 to $14,999 | 0 | 0.0% |
| $15,000 to $24,999 | 7 | 16.7% |
| $25,000 to $34,999 | 0 | 0.0% |
| $35,000 to $49,999 | 12 | 28.6% |
| $50,000 to $74,999 | 3 | 7.1% |
| $75,000 to $99,999 | 3 | 7.1% |
| $100,000 to $149,999 | 4 | 9.5% |
| $150,000 to $199,999 | 0 | 0.0% |
| $200,000+ | 0 | 0.0% |
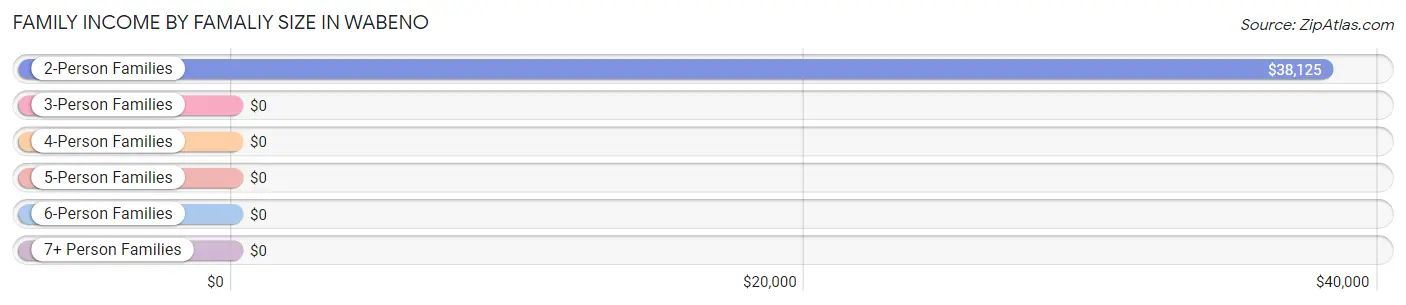
Family Income by Famaliy Size in Wabeno
2-person families (34 | 80.9%) account for the highest median family income in Wabeno with $38,125 per family, while 2-person families (34 | 80.9%) have the highest median income of $19,062 per family member.
| Income Bracket | # Families | Median Income |
| 2-Person Families | 34 (80.9%) | $38,125 |
| 3-Person Families | 4 (9.5%) | $0 |
| 4-Person Families | 4 (9.5%) | $0 |
| 5-Person Families | 0 (0.0%) | $0 |
| 6-Person Families | 0 (0.0%) | $0 |
| 7+ Person Families | 0 (0.0%) | $0 |
| Total | 42 (100.0%) | $0 |
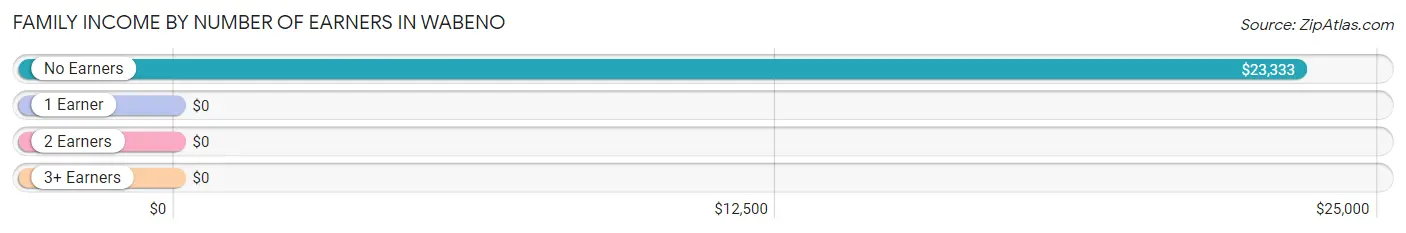
Family Income by Number of Earners in Wabeno
| Number of Earners | # Families | Median Income |
| No Earners | 14 (33.3%) | $23,333 |
| 1 Earner | 24 (57.1%) | $0 |
| 2 Earners | 4 (9.5%) | $0 |
| 3+ Earners | 0 (0.0%) | $0 |
| Total | 42 (100.0%) | $0 |
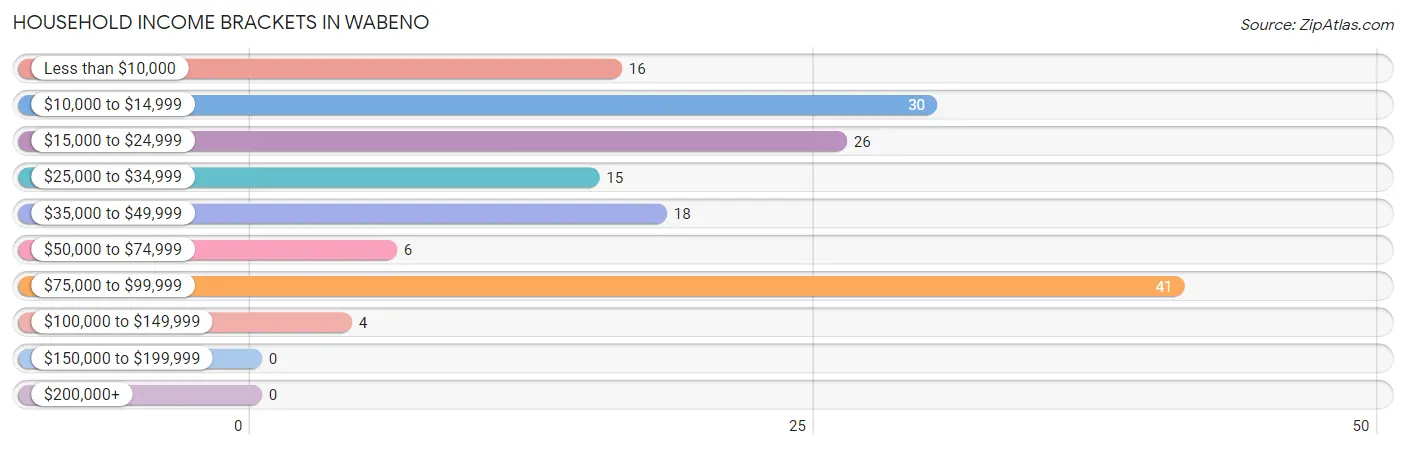
Household Income in Wabeno
Household Income Brackets in Wabeno
With 41 households falling in the category, the $75,000 to $99,999 income range is the most frequent in Wabeno, accounting for 26.3% of all households.
| Income Bracket | # Households | % Households |
| Less than $10,000 | 16 | 10.3% |
| $10,000 to $14,999 | 30 | 19.2% |
| $15,000 to $24,999 | 26 | 16.7% |
| $25,000 to $34,999 | 15 | 9.6% |
| $35,000 to $49,999 | 18 | 11.5% |
| $50,000 to $74,999 | 6 | 3.8% |
| $75,000 to $99,999 | 41 | 26.3% |
| $100,000 to $149,999 | 4 | 2.6% |
| $150,000 to $199,999 | 0 | 0.0% |
| $200,000+ | 0 | 0.0% |
Household Income by Householder Age in Wabeno
The median household income in Wabeno is $31,000, with the highest median household income of $75,769 found in the 45 to 64 years age bracket for the primary householder. A total of 44 households (28.2%) fall into this category. Meanwhile, the 15 to 24 years age bracket for the primary householder has the lowest median household income of $0, with 12 households (7.7%) in this group.
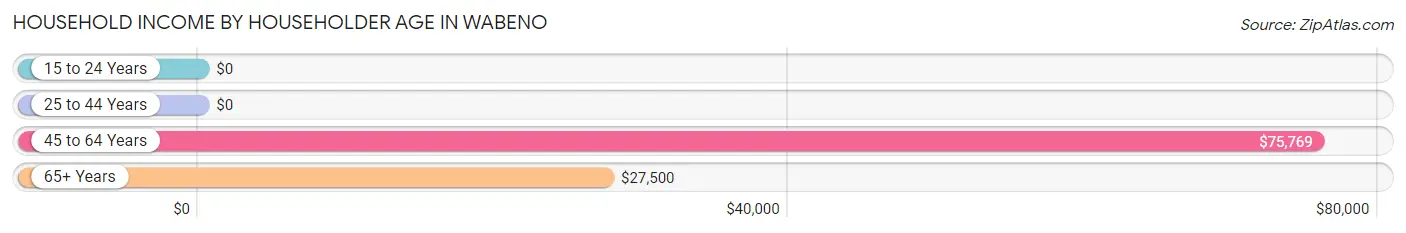
| Income Bracket | # Households | Median Income |
| 15 to 24 Years | 12 (7.7%) | $0 |
| 25 to 44 Years | 30 (19.2%) | $0 |
| 45 to 64 Years | 44 (28.2%) | $75,769 |
| 65+ Years | 70 (44.9%) | $27,500 |
| Total | 156 (100.0%) | $31,000 |
Poverty in Wabeno
Income Below Poverty by Sex and Age in Wabeno
With 35.2% poverty level for males and 35.6% for females among the residents of Wabeno, under 5 year old males and 25 to 34 year old females are the most vulnerable to poverty, with 3 males (100.0%) and 22 females (88.0%) in their respective age groups living below the poverty level.
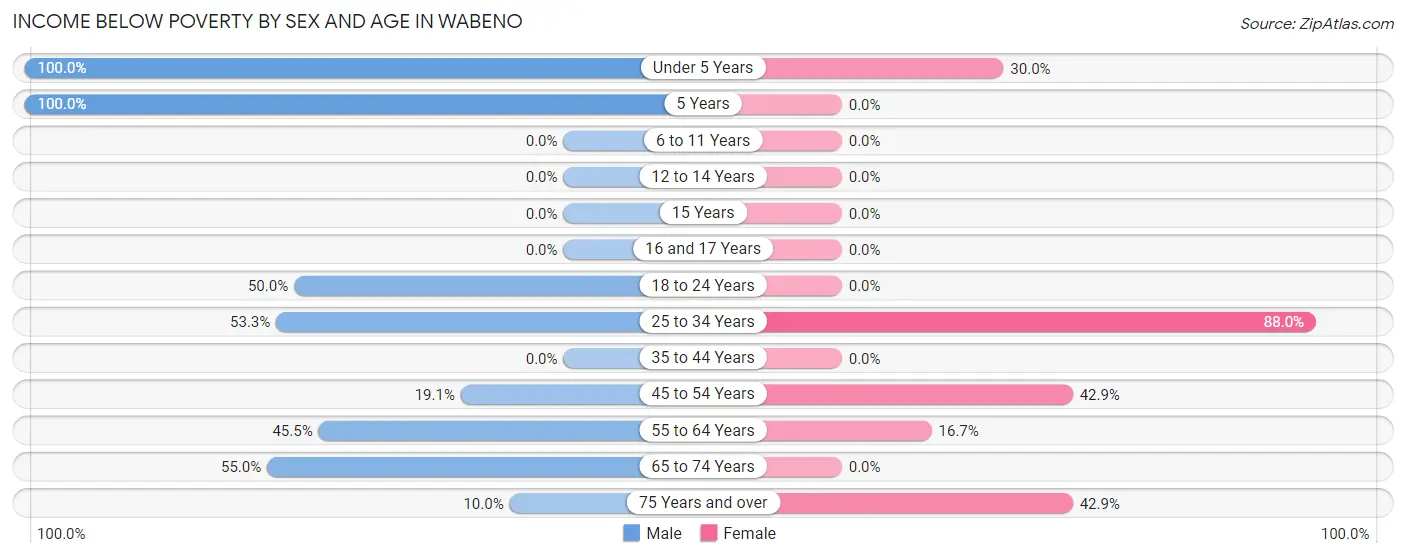
| Age Bracket | Male | Female |
| Under 5 Years | 3 (100.0%) | 3 (30.0%) |
| 5 Years | 2 (100.0%) | 0 (0.0%) |
| 6 to 11 Years | 0 (0.0%) | 0 (0.0%) |
| 12 to 14 Years | 0 (0.0%) | 0 (0.0%) |
| 15 Years | 0 (0.0%) | 0 (0.0%) |
| 16 and 17 Years | 0 (0.0%) | 0 (0.0%) |
| 18 to 24 Years | 8 (50.0%) | 0 (0.0%) |
| 25 to 34 Years | 8 (53.3%) | 22 (88.0%) |
| 35 to 44 Years | 0 (0.0%) | 0 (0.0%) |
| 45 to 54 Years | 4 (19.1%) | 6 (42.9%) |
| 55 to 64 Years | 5 (45.5%) | 2 (16.7%) |
| 65 to 74 Years | 11 (55.0%) | 0 (0.0%) |
| 75 Years and over | 3 (10.0%) | 9 (42.9%) |
| Total | 44 (35.2%) | 42 (35.6%) |
Income Above Poverty by Sex and Age in Wabeno
According to the poverty statistics in Wabeno, males aged 35 to 44 years and females aged 5 years are the age groups that are most secure financially, with 100.0% of males and 100.0% of females in these age groups living above the poverty line.
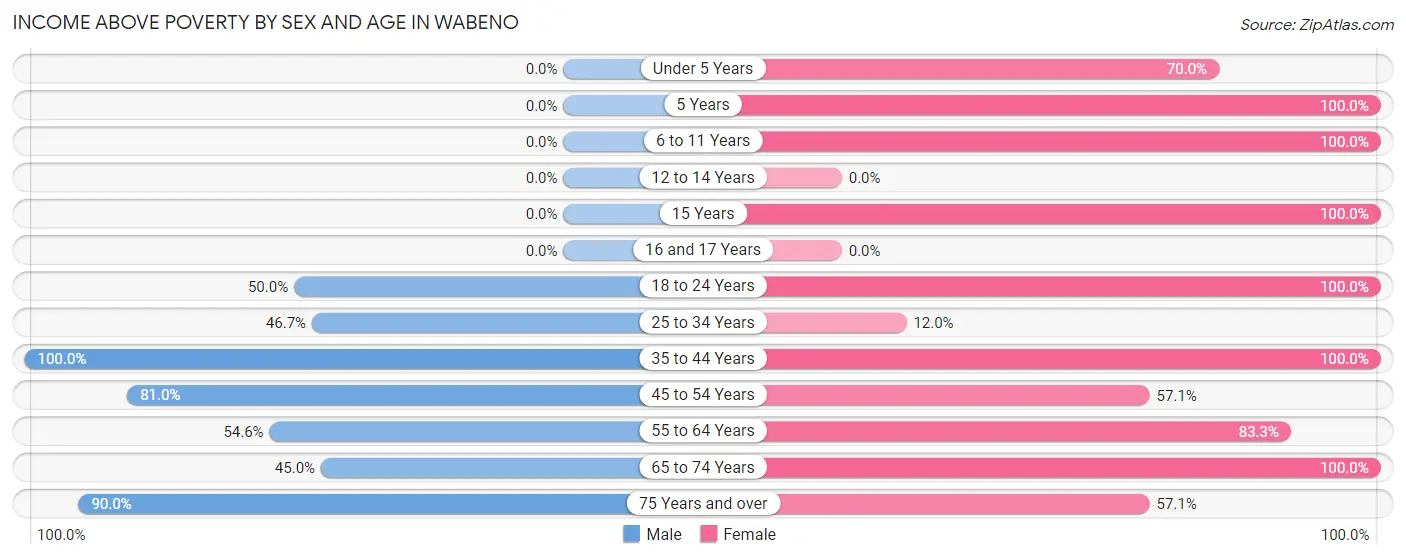
| Age Bracket | Male | Female |
| Under 5 Years | 0 (0.0%) | 7 (70.0%) |
| 5 Years | 0 (0.0%) | 2 (100.0%) |
| 6 to 11 Years | 0 (0.0%) | 7 (100.0%) |
| 12 to 14 Years | 0 (0.0%) | 0 (0.0%) |
| 15 Years | 0 (0.0%) | 3 (100.0%) |
| 16 and 17 Years | 0 (0.0%) | 0 (0.0%) |
| 18 to 24 Years | 8 (50.0%) | 4 (100.0%) |
| 25 to 34 Years | 7 (46.7%) | 3 (12.0%) |
| 35 to 44 Years | 7 (100.0%) | 8 (100.0%) |
| 45 to 54 Years | 17 (80.9%) | 8 (57.1%) |
| 55 to 64 Years | 6 (54.5%) | 10 (83.3%) |
| 65 to 74 Years | 9 (45.0%) | 12 (100.0%) |
| 75 Years and over | 27 (90.0%) | 12 (57.1%) |
| Total | 81 (64.8%) | 76 (64.4%) |
Income Below Poverty Among Married-Couple Families in Wabeno
The poverty statistics for married-couple families in Wabeno show that 33.3% or 6 of the total 18 families live below the poverty line. Families with no children have the highest poverty rate of 33.3%, comprising of 4 families. On the other hand, families with no children have the lowest poverty rate of 33.3%, which includes 4 families.
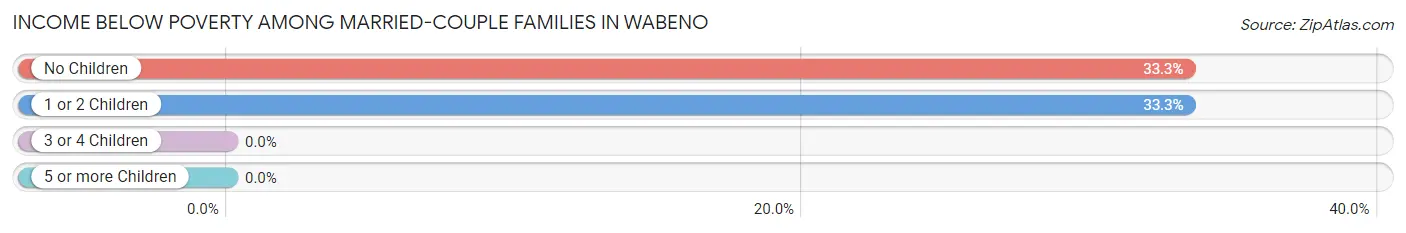
| Children | Above Poverty | Below Poverty |
| No Children | 8 (66.7%) | 4 (33.3%) |
| 1 or 2 Children | 4 (66.7%) | 2 (33.3%) |
| 3 or 4 Children | 0 (0.0%) | 0 (0.0%) |
| 5 or more Children | 0 (0.0%) | 0 (0.0%) |
| Total | 12 (66.7%) | 6 (33.3%) |
Income Below Poverty Among Single-Parent Households in Wabeno
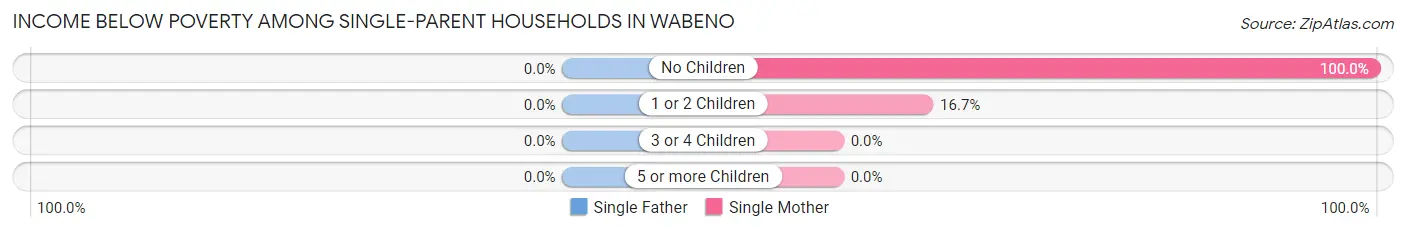
| Children | Single Father | Single Mother |
| No Children | 0 (0.0%) | 9 (100.0%) |
| 1 or 2 Children | 0 (0.0%) | 2 (16.7%) |
| 3 or 4 Children | 0 (0.0%) | 0 (0.0%) |
| 5 or more Children | 0 (0.0%) | 0 (0.0%) |
| Total | 0 (0.0%) | 11 (52.4%) |
Income Below Poverty Among Married-Couple vs Single-Parent Households in Wabeno
The poverty data for Wabeno shows that 6 of the married-couple family households (33.3%) and 11 of the single-parent households (45.8%) are living below the poverty level. Within the married-couple family households, those with no children have the highest poverty rate, with 4 households (33.3%) falling below the poverty line. Among the single-parent households, those with no children have the highest poverty rate, with 9 household (75.0%) living below poverty.
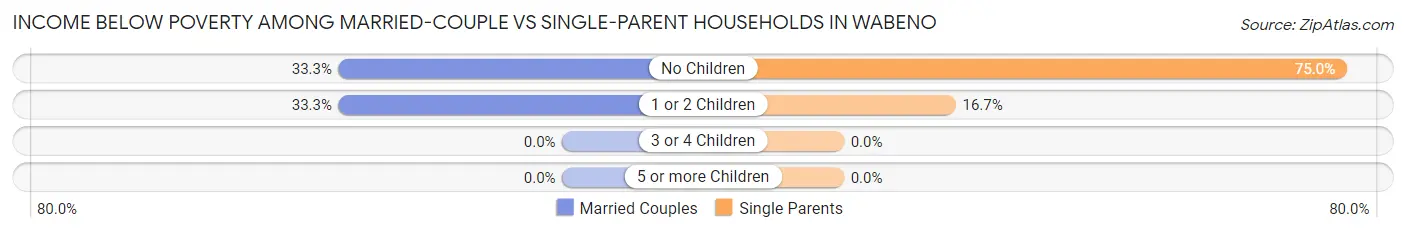
| Children | Married-Couple Families | Single-Parent Households |
| No Children | 4 (33.3%) | 9 (75.0%) |
| 1 or 2 Children | 2 (33.3%) | 2 (16.7%) |
| 3 or 4 Children | 0 (0.0%) | 0 (0.0%) |
| 5 or more Children | 0 (0.0%) | 0 (0.0%) |
| Total | 6 (33.3%) | 11 (45.8%) |
Race in Wabeno
The most populous races in Wabeno are White / Caucasian (219 | 90.1%), Native / Alaskan (16 | 6.6%), and Two or more Races (8 | 3.3%).
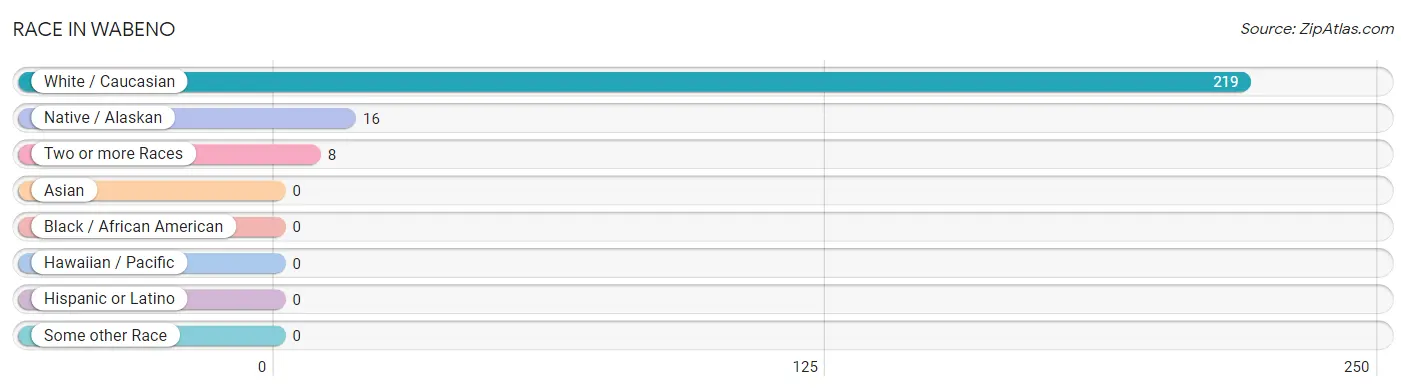
| Race | # Population | % Population |
| Asian | 0 | 0.0% |
| Black / African American | 0 | 0.0% |
| Hawaiian / Pacific | 0 | 0.0% |
| Hispanic or Latino | 0 | 0.0% |
| Native / Alaskan | 16 | 6.6% |
| White / Caucasian | 219 | 90.1% |
| Two or more Races | 8 | 3.3% |
| Some other Race | 0 | 0.0% |
| Total | 243 | 100.0% |
Ancestry in Wabeno
The most populous ancestries reported in Wabeno are German (90 | 37.0%), Irish (56 | 23.1%), English (37 | 15.2%), Potawatomi (24 | 9.9%), and French (10 | 4.1%), together accounting for 89.3% of all Wabeno residents.
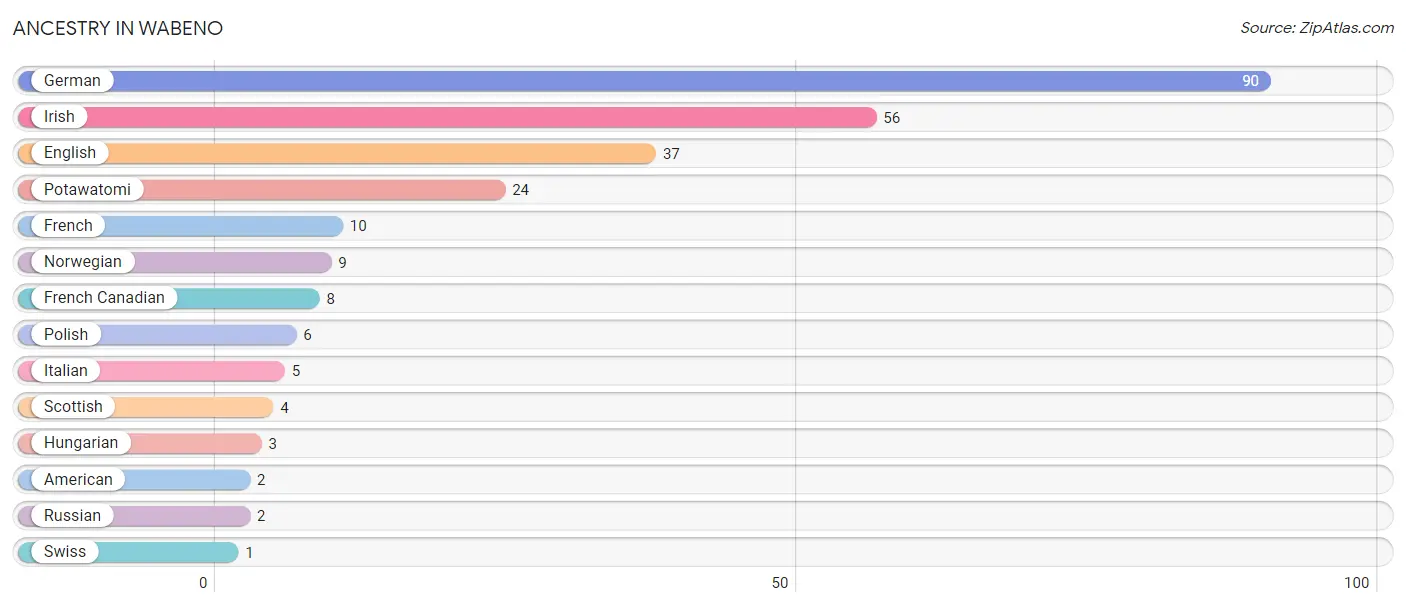
| Ancestry | # Population | % Population |
| American | 2 | 0.8% |
| English | 37 | 15.2% |
| French | 10 | 4.1% |
| French Canadian | 8 | 3.3% |
| German | 90 | 37.0% |
| Hungarian | 3 | 1.2% |
| Irish | 56 | 23.1% |
| Italian | 5 | 2.1% |
| Norwegian | 9 | 3.7% |
| Polish | 6 | 2.5% |
| Potawatomi | 24 | 9.9% |
| Russian | 2 | 0.8% |
| Scottish | 4 | 1.7% |
| Swiss | 1 | 0.4% | View All 14 Rows |
Immigrants in Wabeno

| Immigration Origin | # Population | % Population | View All 0 Rows |
Sex and Age in Wabeno
Sex and Age in Wabeno
The most populous age groups in Wabeno are 65 to 69 Years (18 | 14.4%) for men and 30 to 34 Years (20 | 17.0%) for women.
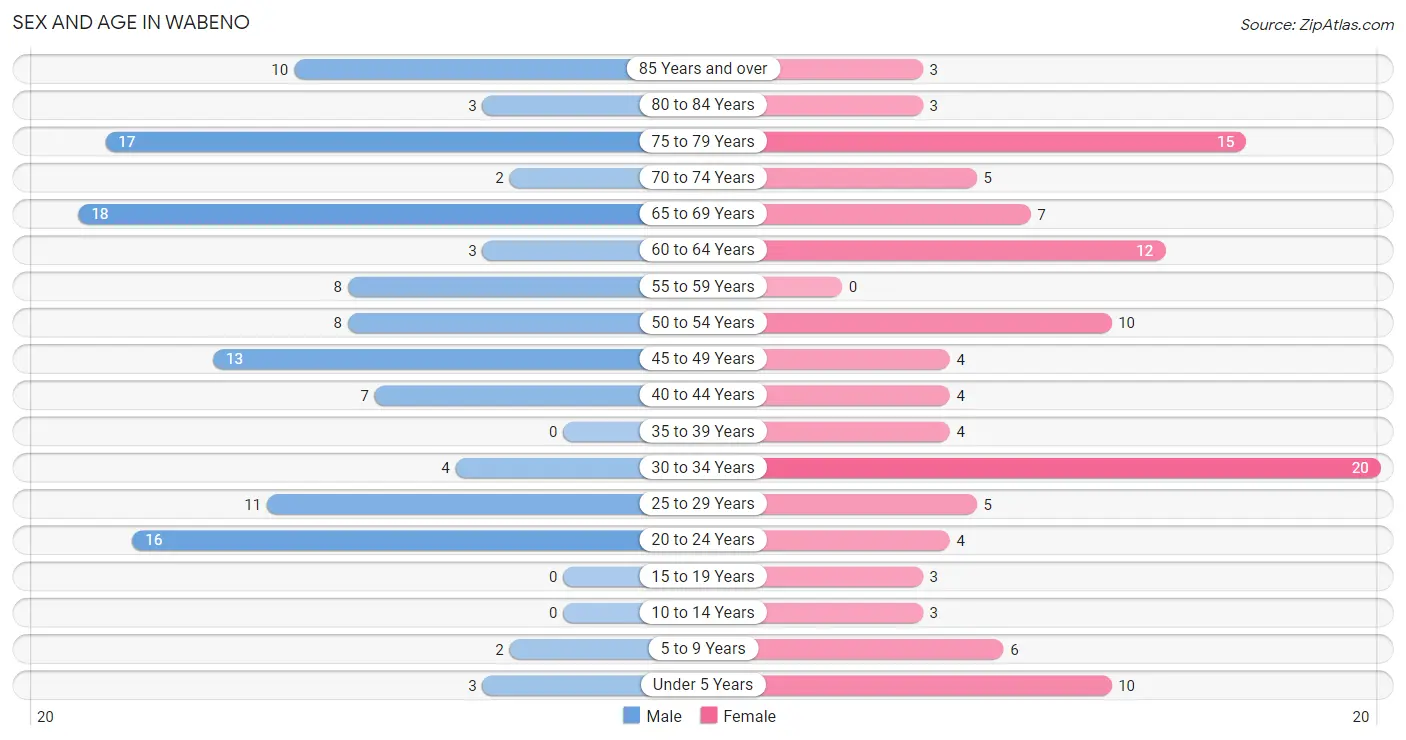
| Age Bracket | Male | Female |
| Under 5 Years | 3 (2.4%) | 10 (8.5%) |
| 5 to 9 Years | 2 (1.6%) | 6 (5.1%) |
| 10 to 14 Years | 0 (0.0%) | 3 (2.5%) |
| 15 to 19 Years | 0 (0.0%) | 3 (2.5%) |
| 20 to 24 Years | 16 (12.8%) | 4 (3.4%) |
| 25 to 29 Years | 11 (8.8%) | 5 (4.2%) |
| 30 to 34 Years | 4 (3.2%) | 20 (17.0%) |
| 35 to 39 Years | 0 (0.0%) | 4 (3.4%) |
| 40 to 44 Years | 7 (5.6%) | 4 (3.4%) |
| 45 to 49 Years | 13 (10.4%) | 4 (3.4%) |
| 50 to 54 Years | 8 (6.4%) | 10 (8.5%) |
| 55 to 59 Years | 8 (6.4%) | 0 (0.0%) |
| 60 to 64 Years | 3 (2.4%) | 12 (10.2%) |
| 65 to 69 Years | 18 (14.4%) | 7 (5.9%) |
| 70 to 74 Years | 2 (1.6%) | 5 (4.2%) |
| 75 to 79 Years | 17 (13.6%) | 15 (12.7%) |
| 80 to 84 Years | 3 (2.4%) | 3 (2.5%) |
| 85 Years and over | 10 (8.0%) | 3 (2.5%) |
| Total | 125 (100.0%) | 118 (100.0%) |
Families and Households in Wabeno
Median Family Size in Wabeno
The median family size in Wabeno is 2.48 persons per family, with single male/father families (3 | 7.1%) accounting for the largest median family size of 3.67 persons per family. On the other hand, single female/mother families (21 | 50.0%) represent the smallest median family size with 2.10 persons per family.
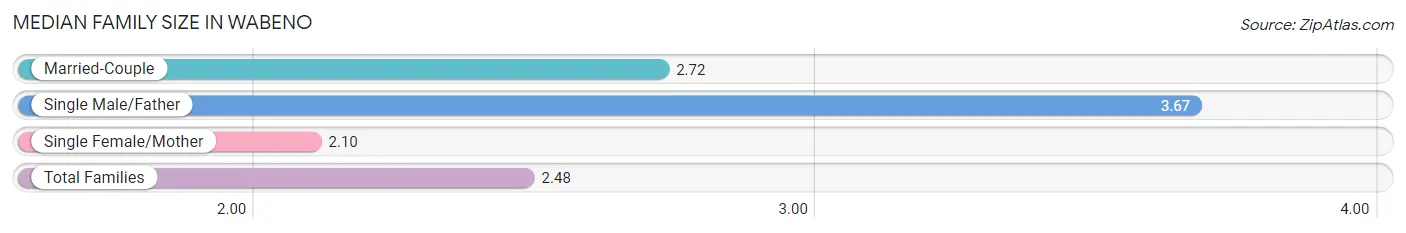
| Family Type | # Families | Family Size |
| Married-Couple | 18 (42.9%) | 2.72 |
| Single Male/Father | 3 (7.1%) | 3.67 |
| Single Female/Mother | 21 (50.0%) | 2.10 |
| Total Families | 42 (100.0%) | 2.48 |
Median Household Size in Wabeno
The median household size in Wabeno is 1.56 persons per household, with single male/father households (3 | 1.9%) accounting for the largest median household size of 3.67 persons per household. non-family households (114 | 73.1%) represent the smallest median household size with 1.03 persons per household.
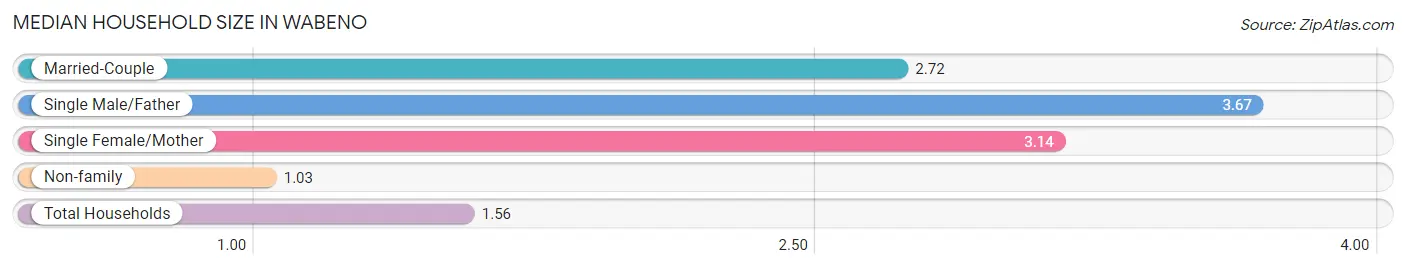
| Household Type | # Households | Household Size |
| Married-Couple | 18 (11.5%) | 2.72 |
| Single Male/Father | 3 (1.9%) | 3.67 |
| Single Female/Mother | 21 (13.5%) | 3.14 |
| Non-family | 114 (73.1%) | 1.03 |
| Total Households | 156 (100.0%) | 1.56 |
Household Size by Marriage Status in Wabeno
Out of a total of 156 households in Wabeno, 42 (26.9%) are family households, while 114 (73.1%) are nonfamily households. The most numerous type of family households are 2-person households, comprising 18, and the most common type of nonfamily households are 1-person households, comprising 112.
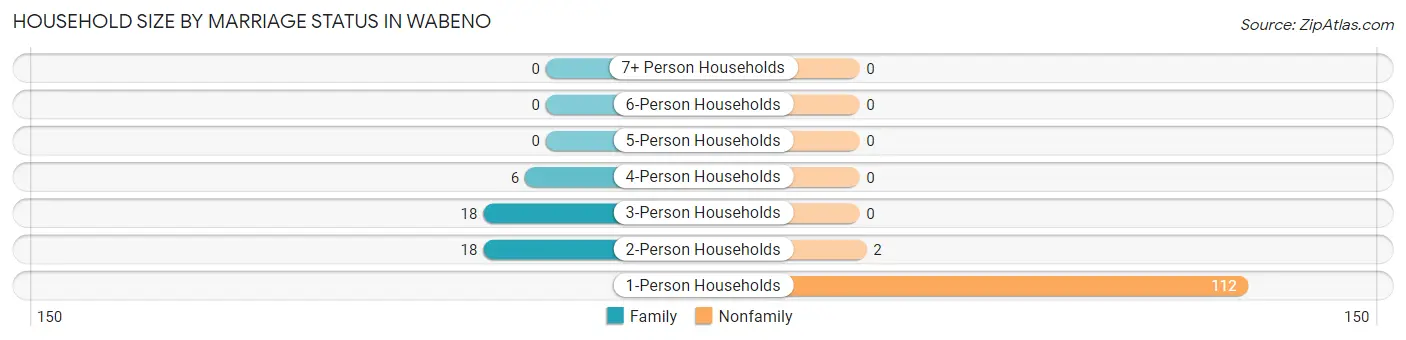
| Household Size | Family Households | Nonfamily Households |
| 1-Person Households | - | 112 (71.8%) |
| 2-Person Households | 18 (11.5%) | 2 (1.3%) |
| 3-Person Households | 18 (11.5%) | 0 (0.0%) |
| 4-Person Households | 6 (3.8%) | 0 (0.0%) |
| 5-Person Households | 0 (0.0%) | 0 (0.0%) |
| 6-Person Households | 0 (0.0%) | 0 (0.0%) |
| 7+ Person Households | 0 (0.0%) | 0 (0.0%) |
| Total | 42 (26.9%) | 114 (73.1%) |
Female Fertility in Wabeno
Fertility by Age in Wabeno
| Age Bracket | Women with Births | Births / 1,000 Women |
| 15 to 19 years | 0 (0.0%) | 0.0 |
| 20 to 34 years | 0 (0.0%) | 0.0 |
| 35 to 50 years | 0 (0.0%) | 0.0 |
| Total | 0 (0.0%) | 0.0 |
Fertility by Age by Marriage Status in Wabeno
| Age Bracket | Married | Unmarried |
| 15 to 19 years | 0 (0.0%) | 0 (0.0%) |
| 20 to 34 years | 0 (0.0%) | 0 (0.0%) |
| 35 to 50 years | 0 (0.0%) | 0 (0.0%) |
| Total | 0 (0.0%) | 0 (0.0%) |
Fertility by Education in Wabeno
| Educational Attainment | Women with Births | Births / 1,000 Women |
| Less than High School | 0 (0.0%) | 0.0 |
| High School Diploma | 0 (0.0%) | 0.0 |
| College or Associate's Degree | 0 (0.0%) | 0.0 |
| Bachelor's Degree | 0 (0.0%) | 0.0 |
| Graduate Degree | 0 (0.0%) | 0.0 |
| Total | 0 (0.0%) | 0.0 |
Fertility by Education by Marriage Status in Wabeno
| Educational Attainment | Married | Unmarried |
| Less than High School | 0 (0.0%) | 0 (0.0%) |
| High School Diploma | 0 (0.0%) | 0 (0.0%) |
| College or Associate's Degree | 0 (0.0%) | 0 (0.0%) |
| Bachelor's Degree | 0 (0.0%) | 0 (0.0%) |
| Graduate Degree | 0 (0.0%) | 0 (0.0%) |
| Total | 0 (0.0%) | 0 (0.0%) |
Employment Characteristics in Wabeno
Employment by Class of Employer in Wabeno
Among the 81 employed individuals in Wabeno, private company employees (74 | 91.4%), and local government employees (7 | 8.6%) make up the most common classes of employment.
| Employer Class | # Employees | % Employees |
| Private Company Employees | 74 | 91.4% |
| Self-Employed (Incorporated) | 0 | 0.0% |
| Self-Employed (Not Incorporated) | 0 | 0.0% |
| Not-for-profit Organizations | 0 | 0.0% |
| Local Government Employees | 7 | 8.6% |
| State Government Employees | 0 | 0.0% |
| Federal Government Employees | 0 | 0.0% |
| Unpaid Family Workers | 0 | 0.0% |
| Total | 81 | 100.0% |
Employment Status by Age in Wabeno
According to the labor force statistics for Wabeno, out of the total population over 16 years of age (216), 39.4% or 85 individuals are in the labor force, with 4.7% or 4 of them unemployed. The age group with the highest labor force participation rate is 20 to 24 years, with 100.0% or 20 individuals in the labor force. Within the labor force, the 25 to 29 years age range has the highest percentage of unemployed individuals, with 28.6% or 4 of them being unemployed.
| Age Bracket | In Labor Force | Unemployed |
| 16 to 19 Years | 0 (0.0%) | 0 (0.0%) |
| 20 to 24 Years | 20 (100.0%) | 0 (0.0%) |
| 25 to 29 Years | 14 (87.5%) | 4 (28.6%) |
| 30 to 34 Years | 24 (100.0%) | 0 (0.0%) |
| 35 to 44 Years | 15 (100.0%) | 0 (0.0%) |
| 45 to 54 Years | 4 (11.4%) | 0 (0.0%) |
| 55 to 59 Years | 3 (37.5%) | 0 (0.0%) |
| 60 to 64 Years | 5 (33.3%) | 0 (0.0%) |
| 65 to 74 Years | 0 (0.0%) | 0 (0.0%) |
| 75 Years and over | 0 (0.0%) | 0 (0.0%) |
| Total | 85 (39.4%) | 4 (4.7%) |
Employment Status by Educational Attainment in Wabeno
According to labor force statistics for Wabeno, 57.5% of individuals (65) out of the total population between 25 and 64 years of age (113) are in the labor force, with 6.2% or 4 of them being unemployed. The group with the highest labor force participation rate are those with the educational attainment of high school diploma, with 61.3% or 49 individuals in the labor force. Within the labor force, individuals with high school diploma education have the highest percentage of unemployment, with 8.2% or 4 of them being unemployed.
| Educational Attainment | In Labor Force | Unemployed |
| Less than High School | 2 (28.6%) | 0 (0.0%) |
| High School Diploma | 49 (61.3%) | 7 (8.2%) |
| College / Associate Degree | 14 (53.8%) | 0 (0.0%) |
| Bachelor's Degree or higher | 0 (0.0%) | 0 (0.0%) |
| Total | 65 (57.5%) | 7 (6.2%) |
Employment Occupations by Sex in Wabeno
Management, Business, Science and Arts Occupations
The most common Management, Business, Science and Arts occupations in Wabeno are Computers, Engineering & Science (4 | 4.9%), Architecture & Engineering (4 | 4.9%), Health Diagnosing & Treating (4 | 4.9%), Community & Social Service (3 | 3.7%), and Education Instruction & Library (3 | 3.7%).
Management, Business, Science and Arts Occupations by Sex
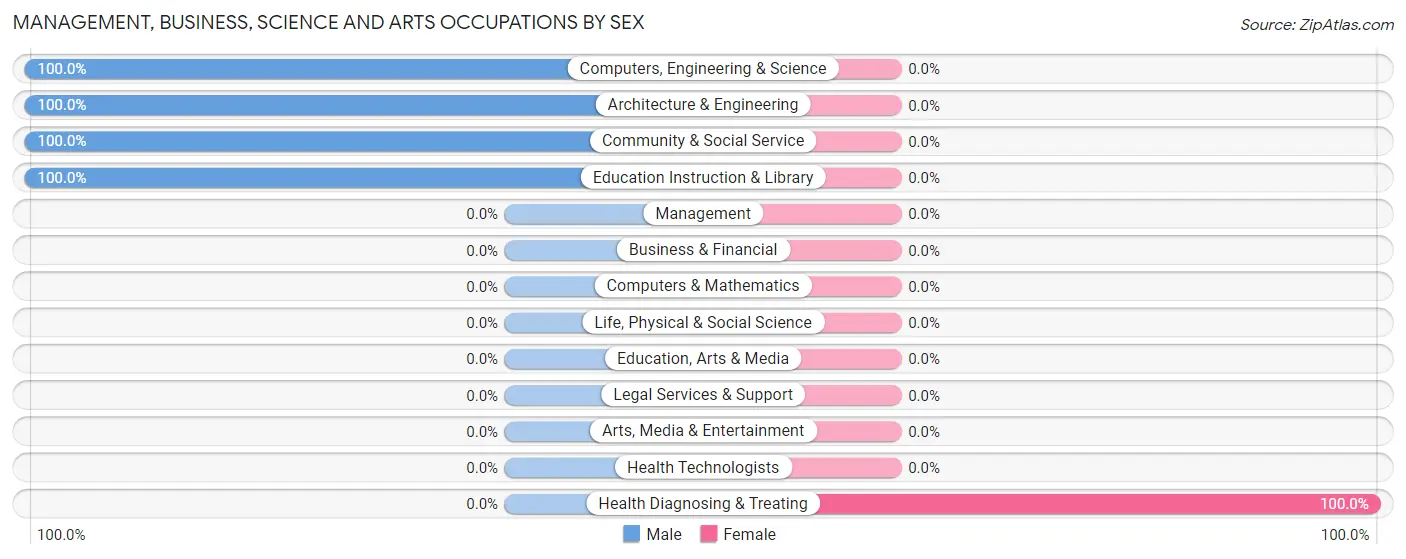
| Occupation | Male | Female |
| Management | 0 (0.0%) | 0 (0.0%) |
| Business & Financial | 0 (0.0%) | 0 (0.0%) |
| Computers, Engineering & Science | 4 (100.0%) | 0 (0.0%) |
| Computers & Mathematics | 0 (0.0%) | 0 (0.0%) |
| Architecture & Engineering | 4 (100.0%) | 0 (0.0%) |
| Life, Physical & Social Science | 0 (0.0%) | 0 (0.0%) |
| Community & Social Service | 3 (100.0%) | 0 (0.0%) |
| Education, Arts & Media | 0 (0.0%) | 0 (0.0%) |
| Legal Services & Support | 0 (0.0%) | 0 (0.0%) |
| Education Instruction & Library | 3 (100.0%) | 0 (0.0%) |
| Arts, Media & Entertainment | 0 (0.0%) | 0 (0.0%) |
| Health Diagnosing & Treating | 0 (0.0%) | 4 (100.0%) |
| Health Technologists | 0 (0.0%) | 0 (0.0%) |
| Total (Category) | 7 (63.6%) | 4 (36.4%) |
| Total (Overall) | 44 (54.3%) | 37 (45.7%) |
Services Occupations
The most common Services occupations in Wabeno are Food Preparation & Serving (31 | 38.3%), Personal Care & Service (4 | 4.9%), Security & Protection (3 | 3.7%), and Firefighting & Prevention (3 | 3.7%).
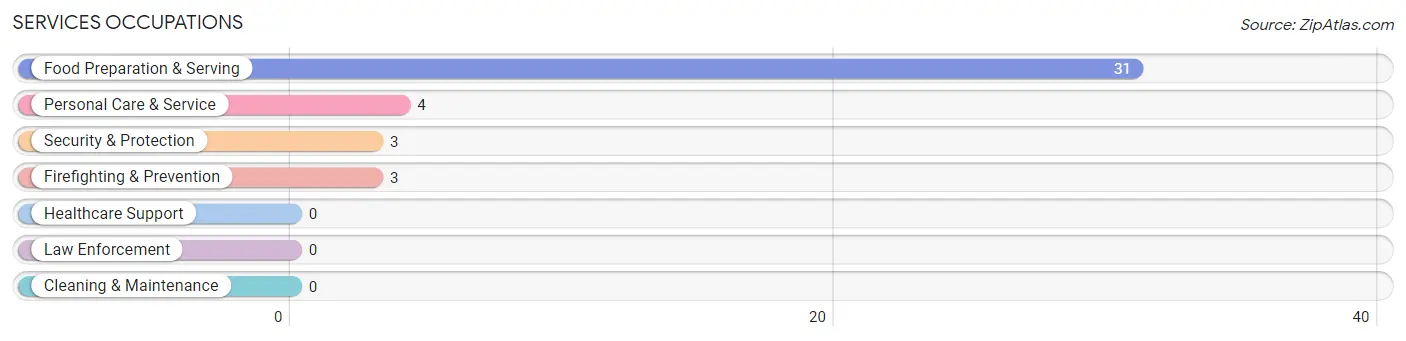
Services Occupations by Sex
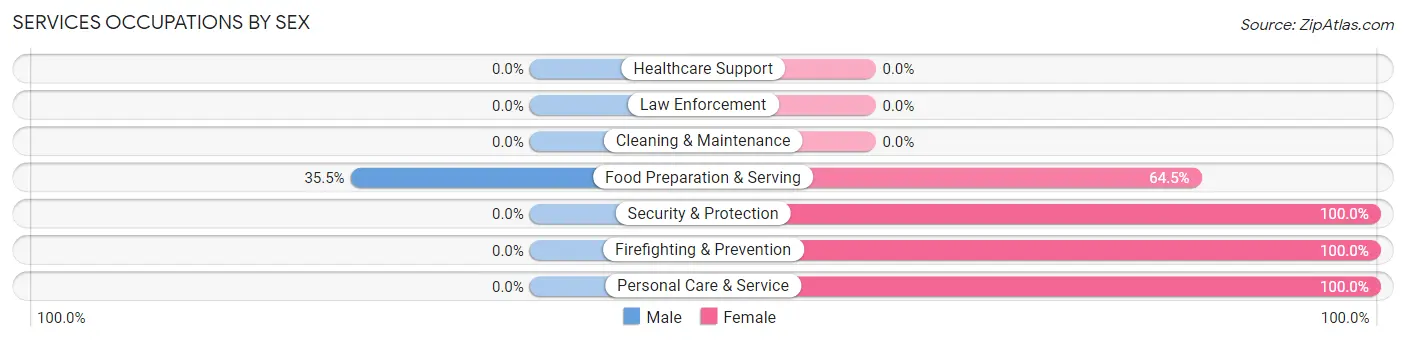
| Occupation | Male | Female |
| Healthcare Support | 0 (0.0%) | 0 (0.0%) |
| Security & Protection | 0 (0.0%) | 3 (100.0%) |
| Firefighting & Prevention | 0 (0.0%) | 3 (100.0%) |
| Law Enforcement | 0 (0.0%) | 0 (0.0%) |
| Food Preparation & Serving | 11 (35.5%) | 20 (64.5%) |
| Cleaning & Maintenance | 0 (0.0%) | 0 (0.0%) |
| Personal Care & Service | 0 (0.0%) | 4 (100.0%) |
| Total (Category) | 11 (28.9%) | 27 (71.1%) |
| Total (Overall) | 44 (54.3%) | 37 (45.7%) |
Sales and Office Occupations
The most common Sales and Office occupations in Wabeno are , and Office & Administration (4 | 4.9%).
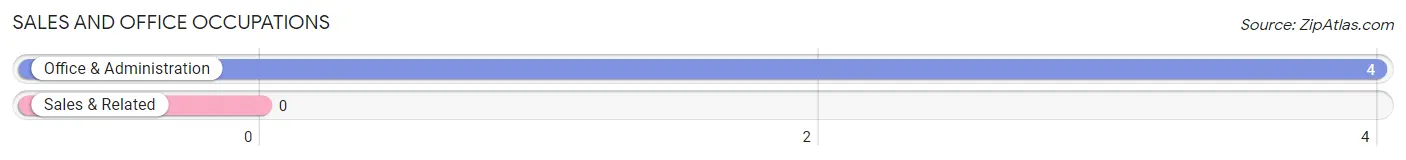
Sales and Office Occupations by Sex
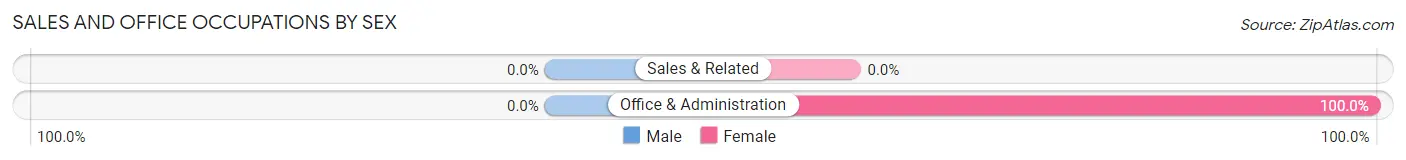
| Occupation | Male | Female |
| Sales & Related | 0 (0.0%) | 0 (0.0%) |
| Office & Administration | 0 (0.0%) | 4 (100.0%) |
| Total (Category) | 0 (0.0%) | 4 (100.0%) |
| Total (Overall) | 44 (54.3%) | 37 (45.7%) |
Natural Resources, Construction and Maintenance Occupations
The most common Natural Resources, Construction and Maintenance occupations in Wabeno are Farming, Fishing & Forestry (8 | 9.9%), and Installation, Maintenance & Repair (8 | 9.9%).
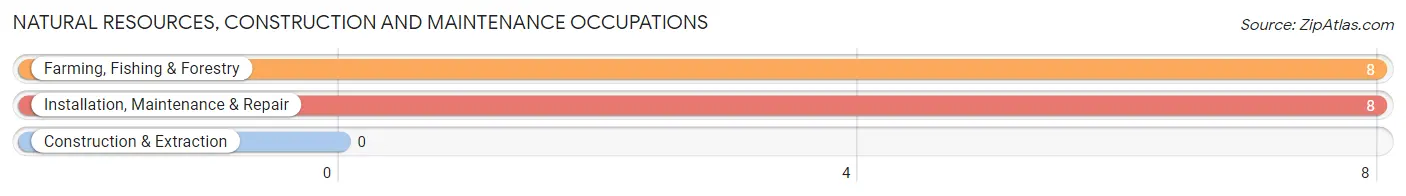
Natural Resources, Construction and Maintenance Occupations by Sex
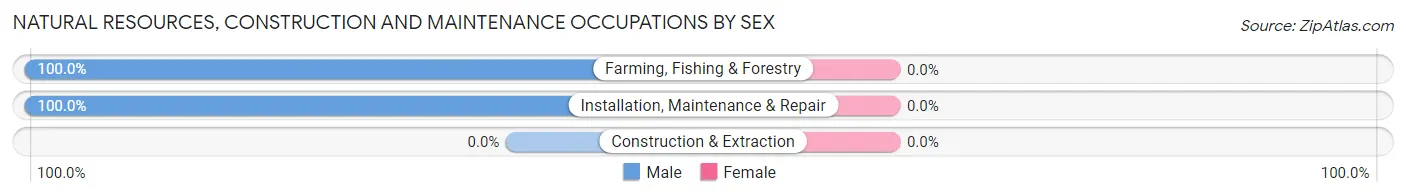
| Occupation | Male | Female |
| Farming, Fishing & Forestry | 8 (100.0%) | 0 (0.0%) |
| Construction & Extraction | 0 (0.0%) | 0 (0.0%) |
| Installation, Maintenance & Repair | 8 (100.0%) | 0 (0.0%) |
| Total (Category) | 16 (100.0%) | 0 (0.0%) |
| Total (Overall) | 44 (54.3%) | 37 (45.7%) |
Production, Transportation and Moving Occupations
The most common Production, Transportation and Moving occupations in Wabeno are Material Moving (6 | 7.4%), Production (3 | 3.7%), and Transportation (3 | 3.7%).
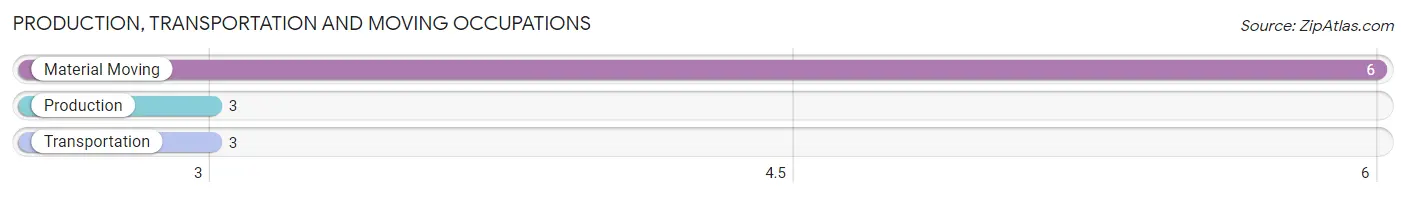
Production, Transportation and Moving Occupations by Sex
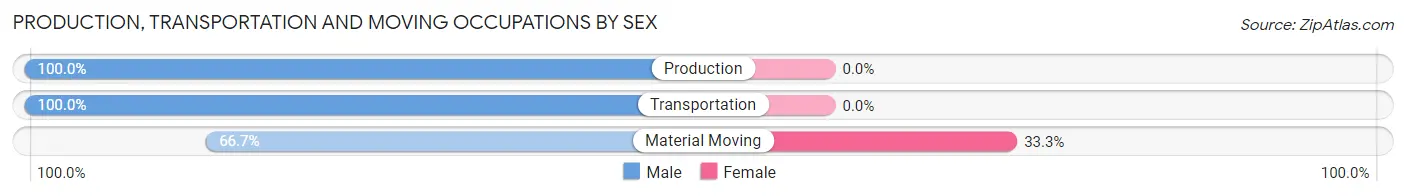
| Occupation | Male | Female |
| Production | 3 (100.0%) | 0 (0.0%) |
| Transportation | 3 (100.0%) | 0 (0.0%) |
| Material Moving | 4 (66.7%) | 2 (33.3%) |
| Total (Category) | 10 (83.3%) | 2 (16.7%) |
| Total (Overall) | 44 (54.3%) | 37 (45.7%) |
Employment Industries by Sex in Wabeno
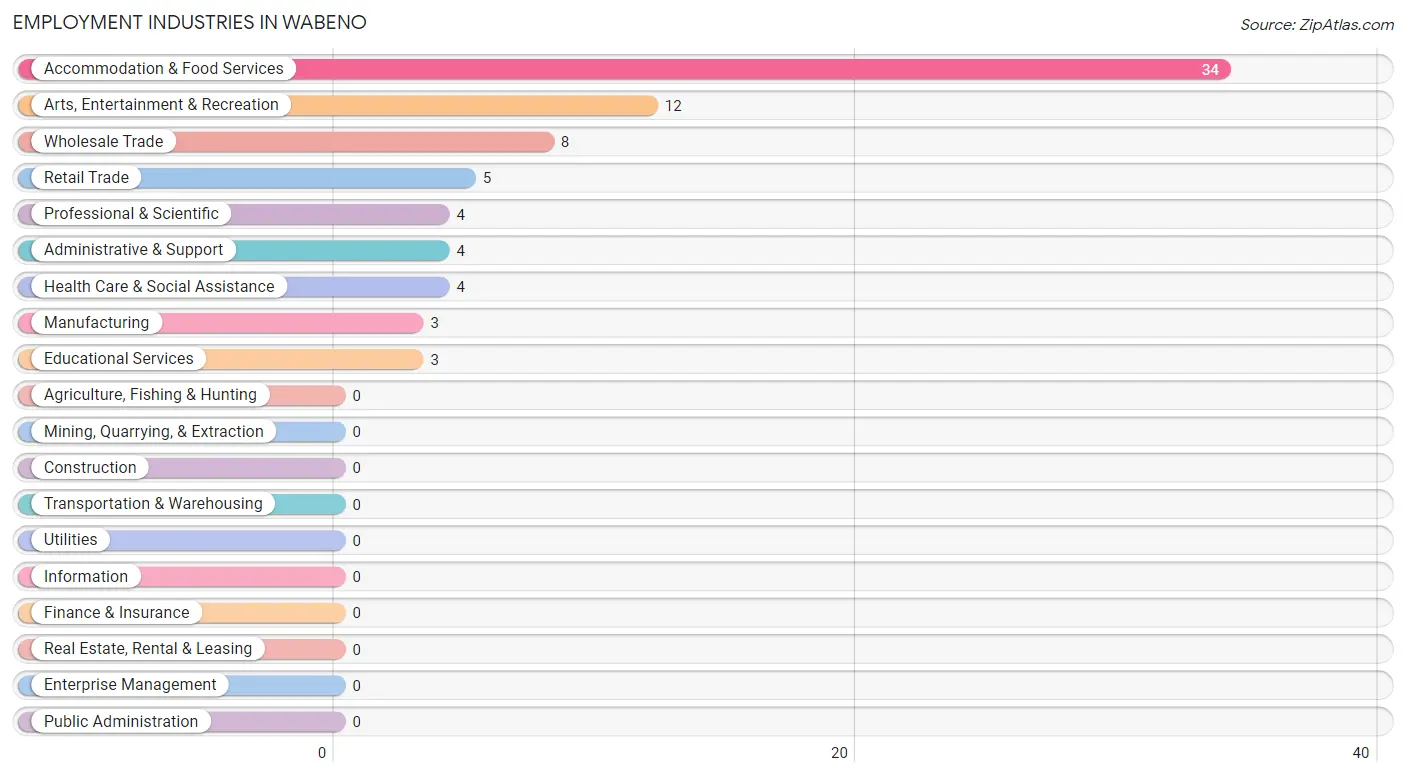
Employment Industries in Wabeno
The major employment industries in Wabeno include Accommodation & Food Services (34 | 42.0%), Arts, Entertainment & Recreation (12 | 14.8%), Wholesale Trade (8 | 9.9%), Retail Trade (5 | 6.2%), and Professional & Scientific (4 | 4.9%).
Employment Industries by Sex in Wabeno
The Wabeno industries that see more men than women are Manufacturing (100.0%), Wholesale Trade (100.0%), and Professional & Scientific (100.0%), whereas the industries that tend to have a higher number of women are Health Care & Social Assistance (100.0%), Accommodation & Food Services (67.6%), and Arts, Entertainment & Recreation (66.7%).
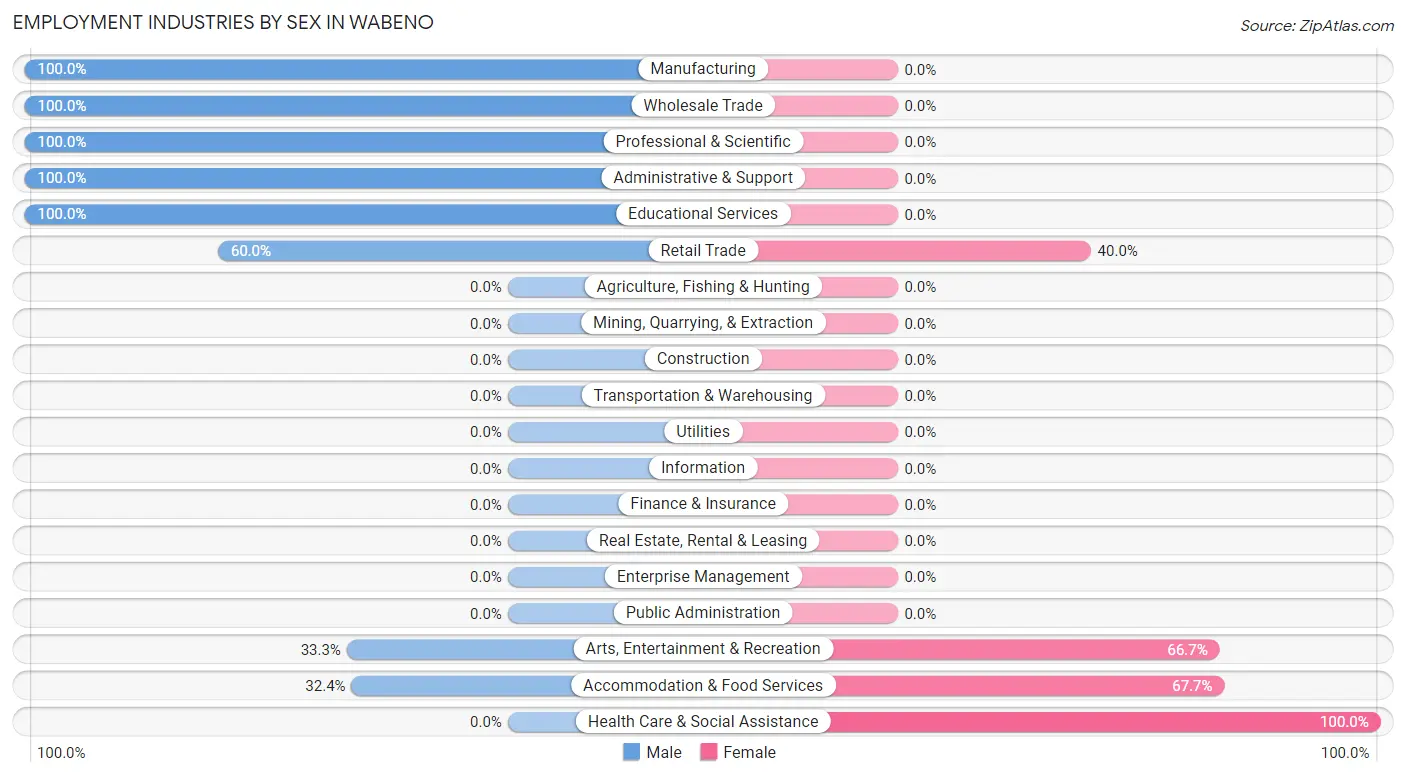
| Industry | Male | Female |
| Agriculture, Fishing & Hunting | 0 (0.0%) | 0 (0.0%) |
| Mining, Quarrying, & Extraction | 0 (0.0%) | 0 (0.0%) |
| Construction | 0 (0.0%) | 0 (0.0%) |
| Manufacturing | 3 (100.0%) | 0 (0.0%) |
| Wholesale Trade | 8 (100.0%) | 0 (0.0%) |
| Retail Trade | 3 (60.0%) | 2 (40.0%) |
| Transportation & Warehousing | 0 (0.0%) | 0 (0.0%) |
| Utilities | 0 (0.0%) | 0 (0.0%) |
| Information | 0 (0.0%) | 0 (0.0%) |
| Finance & Insurance | 0 (0.0%) | 0 (0.0%) |
| Real Estate, Rental & Leasing | 0 (0.0%) | 0 (0.0%) |
| Professional & Scientific | 4 (100.0%) | 0 (0.0%) |
| Enterprise Management | 0 (0.0%) | 0 (0.0%) |
| Administrative & Support | 4 (100.0%) | 0 (0.0%) |
| Educational Services | 3 (100.0%) | 0 (0.0%) |
| Health Care & Social Assistance | 0 (0.0%) | 4 (100.0%) |
| Arts, Entertainment & Recreation | 4 (33.3%) | 8 (66.7%) |
| Accommodation & Food Services | 11 (32.4%) | 23 (67.6%) |
| Public Administration | 0 (0.0%) | 0 (0.0%) |
| Total | 44 (54.3%) | 37 (45.7%) |
Education in Wabeno
School Enrollment in Wabeno
The most common levels of schooling among the 12 students in Wabeno are elementary school (4 | 33.3%), middle school (3 | 25.0%), and high school (3 | 25.0%).
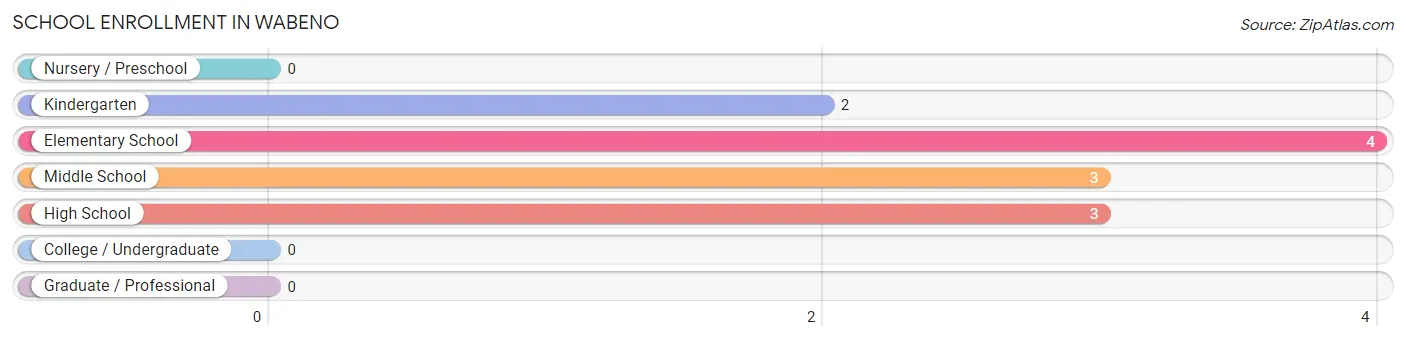
| School Level | # Students | % Students |
| Nursery / Preschool | 0 | 0.0% |
| Kindergarten | 2 | 16.7% |
| Elementary School | 4 | 33.3% |
| Middle School | 3 | 25.0% |
| High School | 3 | 25.0% |
| College / Undergraduate | 0 | 0.0% |
| Graduate / Professional | 0 | 0.0% |
| Total | 12 | 100.0% |
School Enrollment by Age by Funding Source in Wabeno
Out of a total of 12 students who are enrolled in schools in Wabeno, 2 (16.7%) attend a private institution, while the remaining 10 (83.3%) are enrolled in public schools. The age group of 5 to 9 year old has the highest likelihood of being enrolled in private schools, with 2 (33.3% in the age bracket) enrolled. Conversely, the age group of 10 to 14 year olds has the lowest likelihood of being enrolled in a private school, with 3 (100.0% in the age bracket) attending a public institution.
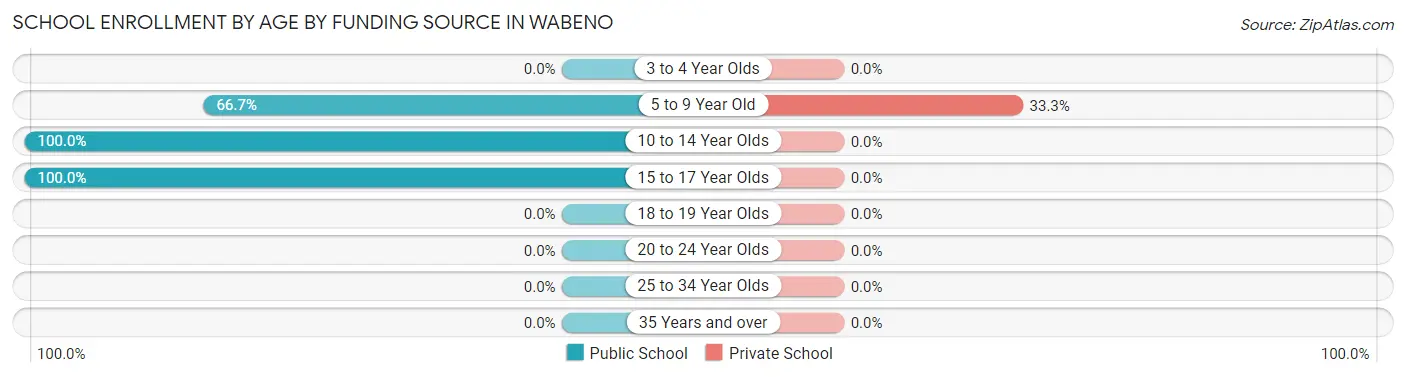
| Age Bracket | Public School | Private School |
| 3 to 4 Year Olds | 0 (0.0%) | 0 (0.0%) |
| 5 to 9 Year Old | 4 (66.7%) | 2 (33.3%) |
| 10 to 14 Year Olds | 3 (100.0%) | 0 (0.0%) |
| 15 to 17 Year Olds | 3 (100.0%) | 0 (0.0%) |
| 18 to 19 Year Olds | 0 (0.0%) | 0 (0.0%) |
| 20 to 24 Year Olds | 0 (0.0%) | 0 (0.0%) |
| 25 to 34 Year Olds | 0 (0.0%) | 0 (0.0%) |
| 35 Years and over | 0 (0.0%) | 0 (0.0%) |
| Total | 10 (83.3%) | 2 (16.7%) |
Educational Attainment by Field of Study in Wabeno
, and social sciences (9 | 100.0%) are the most common fields of study among 9 individuals in Wabeno who have obtained a bachelor's degree or higher.
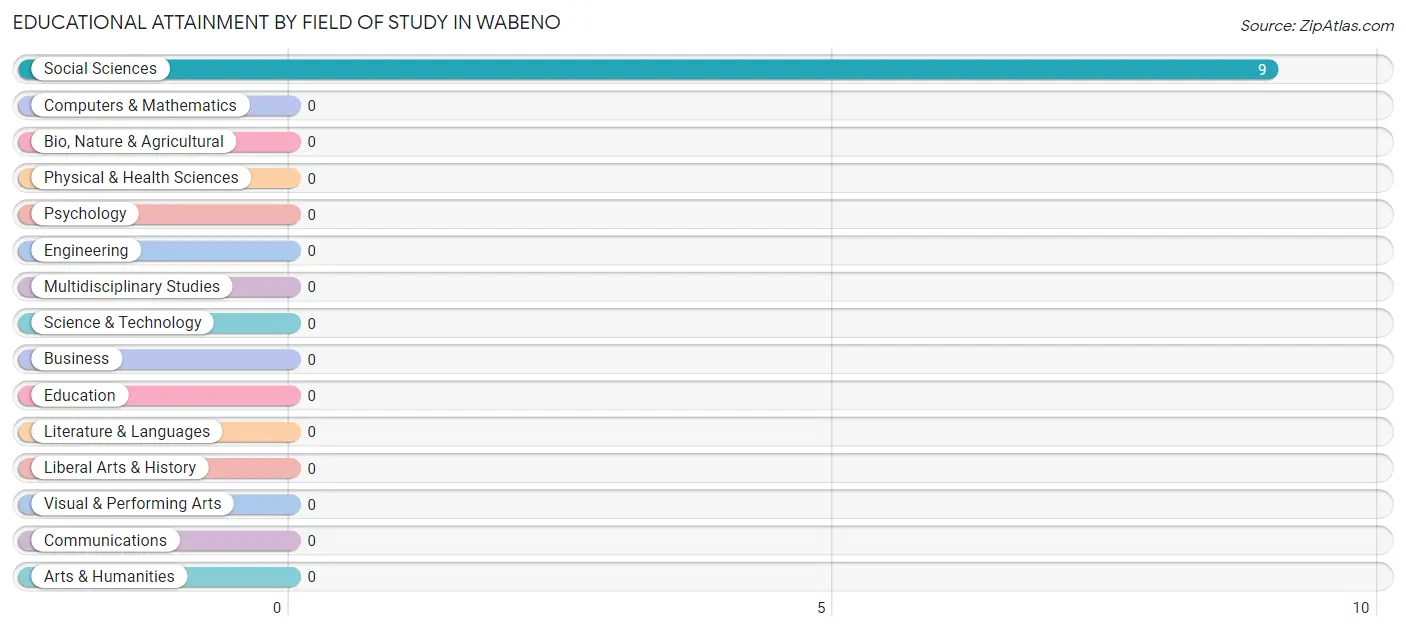
| Field of Study | # Graduates | % Graduates |
| Computers & Mathematics | 0 | 0.0% |
| Bio, Nature & Agricultural | 0 | 0.0% |
| Physical & Health Sciences | 0 | 0.0% |
| Psychology | 0 | 0.0% |
| Social Sciences | 9 | 100.0% |
| Engineering | 0 | 0.0% |
| Multidisciplinary Studies | 0 | 0.0% |
| Science & Technology | 0 | 0.0% |
| Business | 0 | 0.0% |
| Education | 0 | 0.0% |
| Literature & Languages | 0 | 0.0% |
| Liberal Arts & History | 0 | 0.0% |
| Visual & Performing Arts | 0 | 0.0% |
| Communications | 0 | 0.0% |
| Arts & Humanities | 0 | 0.0% |
| Total | 9 | 100.0% |
Transportation & Commute in Wabeno
Vehicle Availability by Sex in Wabeno
The most prevalent vehicle ownership categories in Wabeno are males with 3 vehicles (25, accounting for 56.8%) and females with 3 vehicles (7, making up 67.6%).
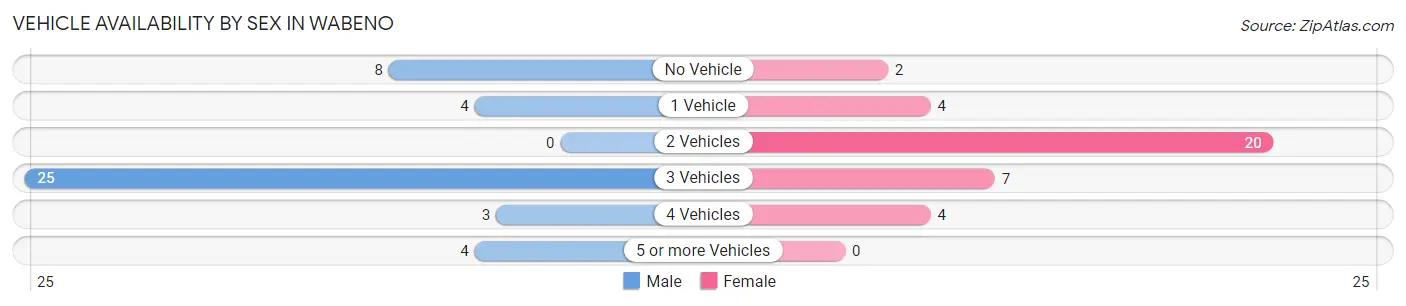
| Vehicles Available | Male | Female |
| No Vehicle | 8 (18.2%) | 2 (5.4%) |
| 1 Vehicle | 4 (9.1%) | 4 (10.8%) |
| 2 Vehicles | 0 (0.0%) | 20 (54.0%) |
| 3 Vehicles | 25 (56.8%) | 7 (18.9%) |
| 4 Vehicles | 3 (6.8%) | 4 (10.8%) |
| 5 or more Vehicles | 4 (9.1%) | 0 (0.0%) |
| Total | 44 (100.0%) | 37 (100.0%) |
Commute Time in Wabeno
The most frequently occuring commute durations in Wabeno are less than 5 minutes (26 commuters, 32.1%), 10 to 14 minutes (17 commuters, 21.0%), and 5 to 9 minutes (16 commuters, 19.8%).
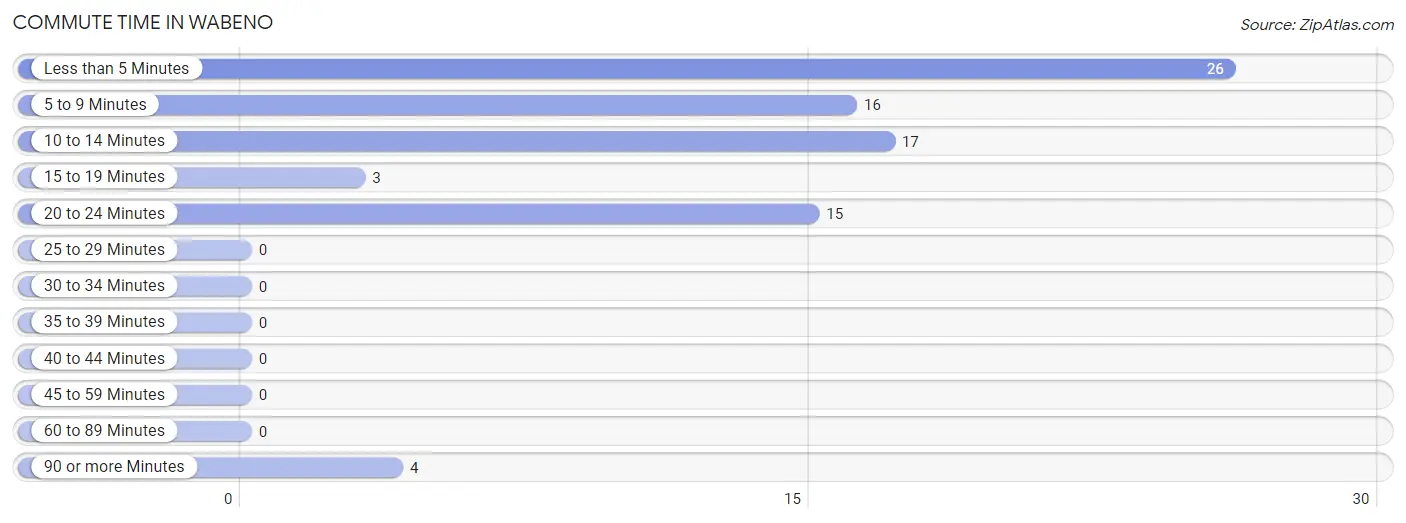
| Commute Time | # Commuters | % Commuters |
| Less than 5 Minutes | 26 | 32.1% |
| 5 to 9 Minutes | 16 | 19.8% |
| 10 to 14 Minutes | 17 | 21.0% |
| 15 to 19 Minutes | 3 | 3.7% |
| 20 to 24 Minutes | 15 | 18.5% |
| 25 to 29 Minutes | 0 | 0.0% |
| 30 to 34 Minutes | 0 | 0.0% |
| 35 to 39 Minutes | 0 | 0.0% |
| 40 to 44 Minutes | 0 | 0.0% |
| 45 to 59 Minutes | 0 | 0.0% |
| 60 to 89 Minutes | 0 | 0.0% |
| 90 or more Minutes | 4 | 4.9% |
Commute Time by Sex in Wabeno
The most common commute times in Wabeno are 10 to 14 minutes (15 commuters, 34.1%) for males and less than 5 minutes (23 commuters, 62.2%) for females.
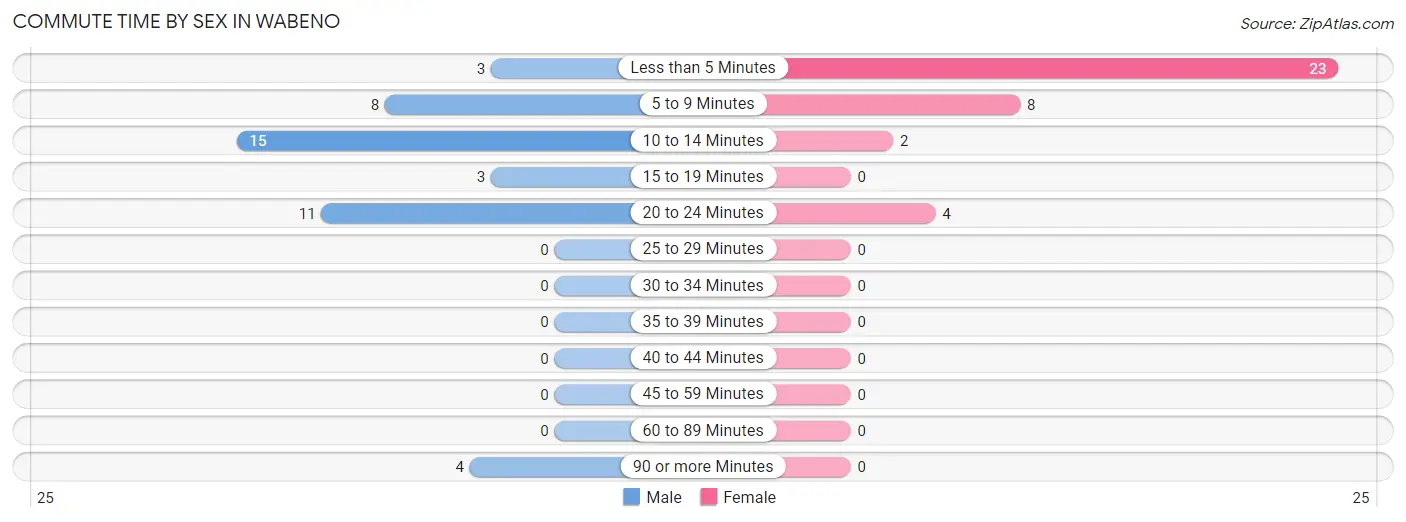
| Commute Time | Male | Female |
| Less than 5 Minutes | 3 (6.8%) | 23 (62.2%) |
| 5 to 9 Minutes | 8 (18.2%) | 8 (21.6%) |
| 10 to 14 Minutes | 15 (34.1%) | 2 (5.4%) |
| 15 to 19 Minutes | 3 (6.8%) | 0 (0.0%) |
| 20 to 24 Minutes | 11 (25.0%) | 4 (10.8%) |
| 25 to 29 Minutes | 0 (0.0%) | 0 (0.0%) |
| 30 to 34 Minutes | 0 (0.0%) | 0 (0.0%) |
| 35 to 39 Minutes | 0 (0.0%) | 0 (0.0%) |
| 40 to 44 Minutes | 0 (0.0%) | 0 (0.0%) |
| 45 to 59 Minutes | 0 (0.0%) | 0 (0.0%) |
| 60 to 89 Minutes | 0 (0.0%) | 0 (0.0%) |
| 90 or more Minutes | 4 (9.1%) | 0 (0.0%) |
Time of Departure to Work by Sex in Wabeno
The most frequent times of departure to work in Wabeno are 12:00 PM to 3:59 PM (11, 25.0%) for males and 5:30 AM to 5:59 AM (20, 54.0%) for females.
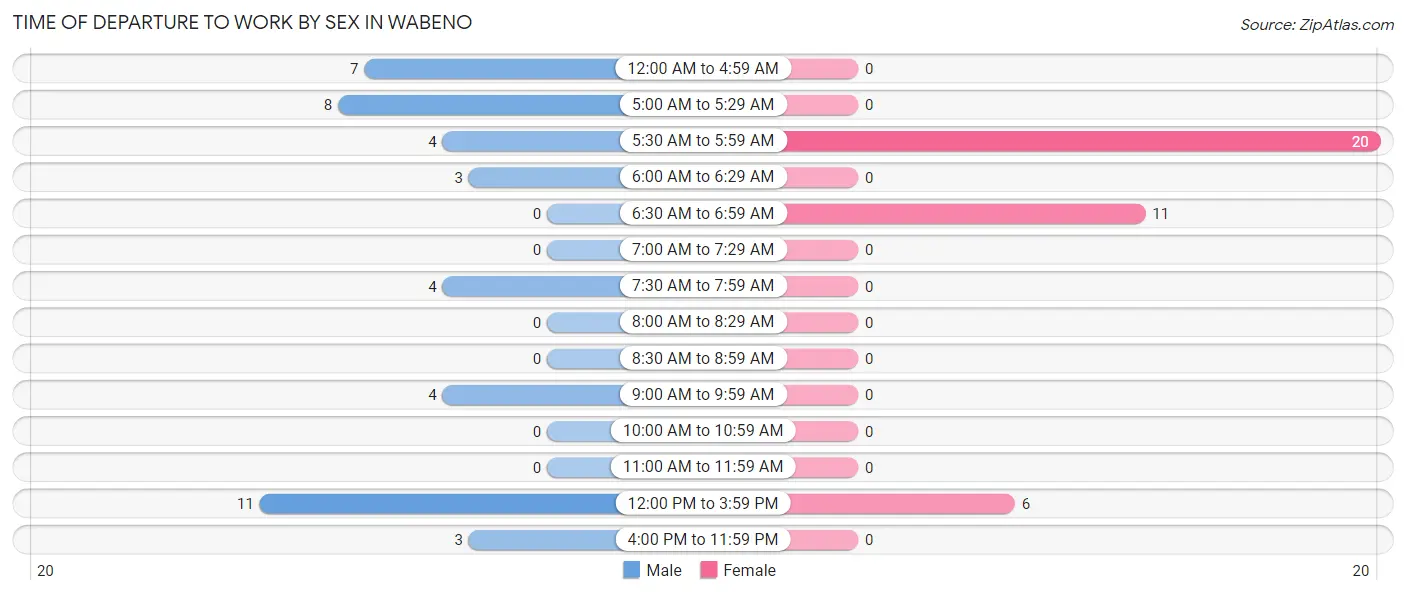
| Time of Departure | Male | Female |
| 12:00 AM to 4:59 AM | 7 (15.9%) | 0 (0.0%) |
| 5:00 AM to 5:29 AM | 8 (18.2%) | 0 (0.0%) |
| 5:30 AM to 5:59 AM | 4 (9.1%) | 20 (54.0%) |
| 6:00 AM to 6:29 AM | 3 (6.8%) | 0 (0.0%) |
| 6:30 AM to 6:59 AM | 0 (0.0%) | 11 (29.7%) |
| 7:00 AM to 7:29 AM | 0 (0.0%) | 0 (0.0%) |
| 7:30 AM to 7:59 AM | 4 (9.1%) | 0 (0.0%) |
| 8:00 AM to 8:29 AM | 0 (0.0%) | 0 (0.0%) |
| 8:30 AM to 8:59 AM | 0 (0.0%) | 0 (0.0%) |
| 9:00 AM to 9:59 AM | 4 (9.1%) | 0 (0.0%) |
| 10:00 AM to 10:59 AM | 0 (0.0%) | 0 (0.0%) |
| 11:00 AM to 11:59 AM | 0 (0.0%) | 0 (0.0%) |
| 12:00 PM to 3:59 PM | 11 (25.0%) | 6 (16.2%) |
| 4:00 PM to 11:59 PM | 3 (6.8%) | 0 (0.0%) |
| Total | 44 (100.0%) | 37 (100.0%) |
Housing Occupancy in Wabeno
Occupancy by Ownership in Wabeno
Of the total 156 dwellings in Wabeno, owner-occupied units account for 101 (64.7%), while renter-occupied units make up 55 (35.3%).
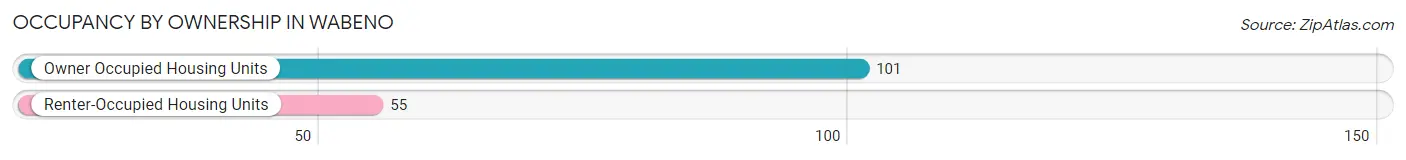
| Occupancy | # Housing Units | % Housing Units |
| Owner Occupied Housing Units | 101 | 64.7% |
| Renter-Occupied Housing Units | 55 | 35.3% |
| Total Occupied Housing Units | 156 | 100.0% |
Occupancy by Household Size in Wabeno
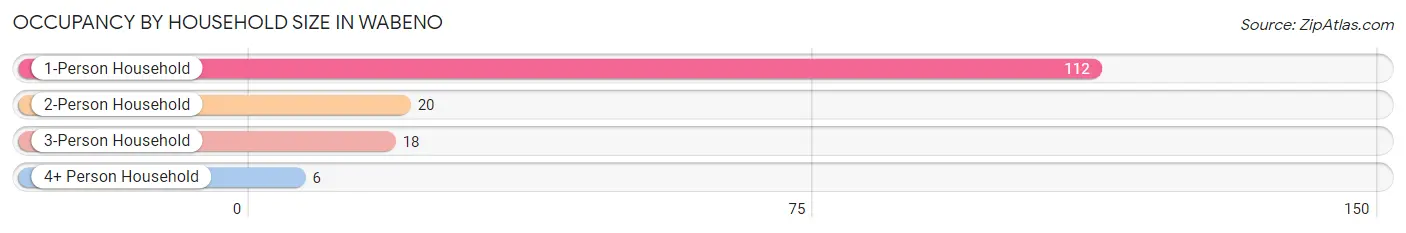
| Household Size | # Housing Units | % Housing Units |
| 1-Person Household | 112 | 71.8% |
| 2-Person Household | 20 | 12.8% |
| 3-Person Household | 18 | 11.5% |
| 4+ Person Household | 6 | 3.8% |
| Total Housing Units | 156 | 100.0% |
Occupancy by Ownership by Household Size in Wabeno
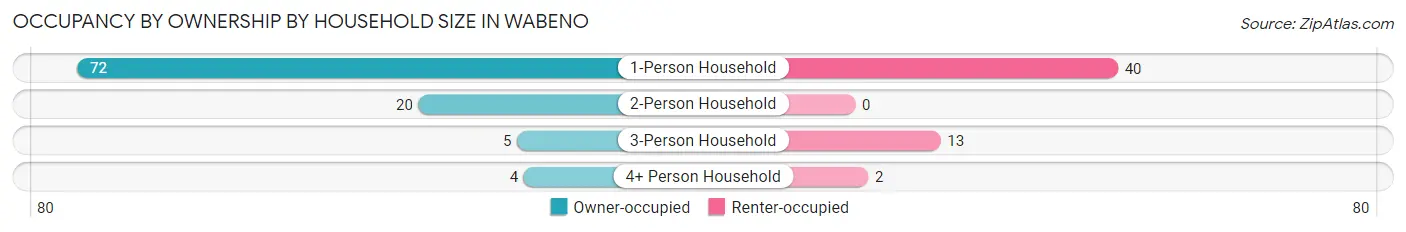
| Household Size | Owner-occupied | Renter-occupied |
| 1-Person Household | 72 (64.3%) | 40 (35.7%) |
| 2-Person Household | 20 (100.0%) | 0 (0.0%) |
| 3-Person Household | 5 (27.8%) | 13 (72.2%) |
| 4+ Person Household | 4 (66.7%) | 2 (33.3%) |
| Total Housing Units | 101 (64.7%) | 55 (35.3%) |
Occupancy by Educational Attainment in Wabeno
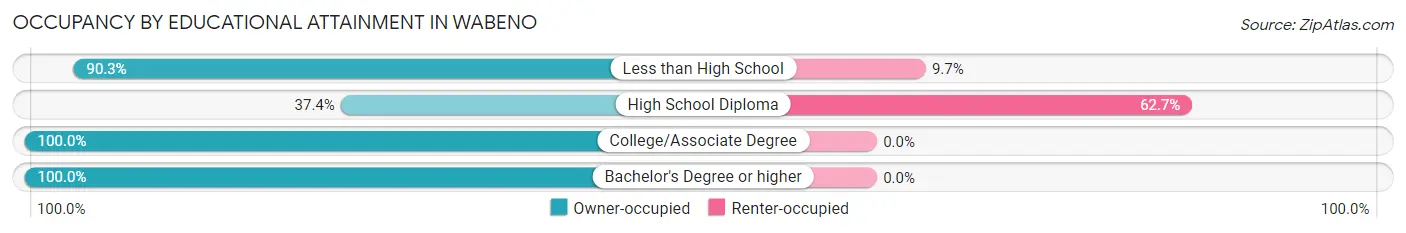
| Household Size | Owner-occupied | Renter-occupied |
| Less than High School | 28 (90.3%) | 3 (9.7%) |
| High School Diploma | 31 (37.3%) | 52 (62.6%) |
| College/Associate Degree | 33 (100.0%) | 0 (0.0%) |
| Bachelor's Degree or higher | 9 (100.0%) | 0 (0.0%) |
Occupancy by Age of Householder in Wabeno
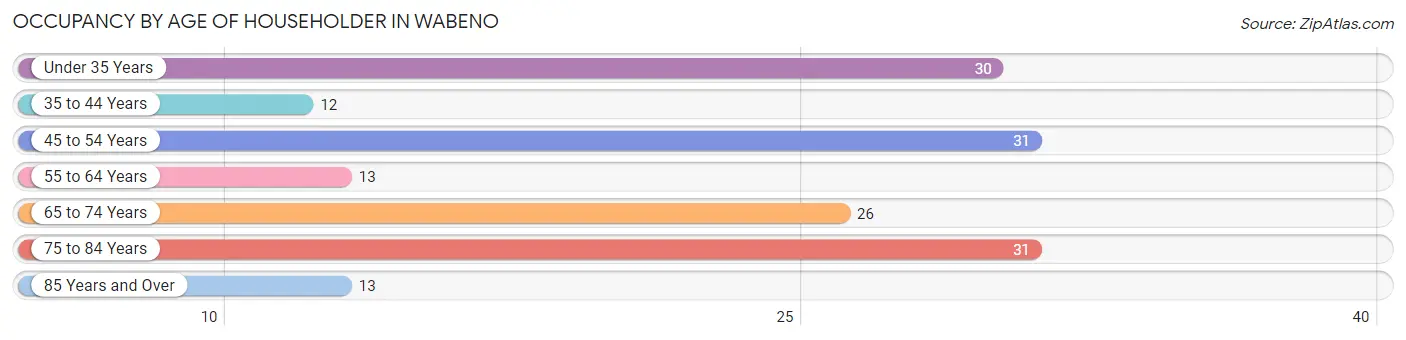
| Age Bracket | # Households | % Households |
| Under 35 Years | 30 | 19.2% |
| 35 to 44 Years | 12 | 7.7% |
| 45 to 54 Years | 31 | 19.9% |
| 55 to 64 Years | 13 | 8.3% |
| 65 to 74 Years | 26 | 16.7% |
| 75 to 84 Years | 31 | 19.9% |
| 85 Years and Over | 13 | 8.3% |
| Total | 156 | 100.0% |
Housing Finances in Wabeno
Median Income by Occupancy in Wabeno
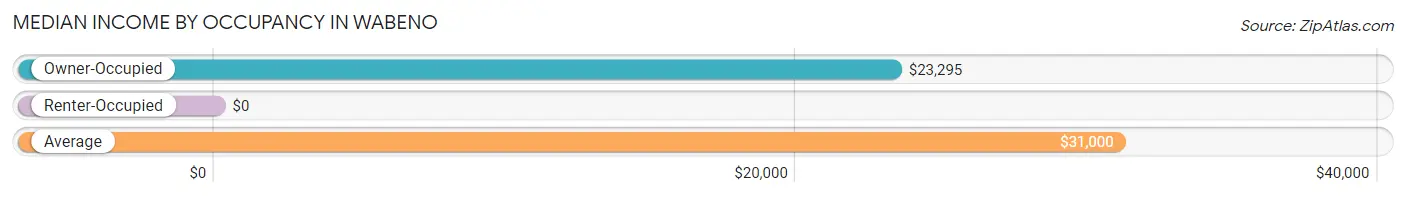
| Occupancy Type | # Households | Median Income |
| Owner-Occupied | 101 (64.7%) | $23,295 |
| Renter-Occupied | 55 (35.3%) | $0 |
| Average | 156 (100.0%) | $31,000 |
Occupancy by Householder Income Bracket in Wabeno
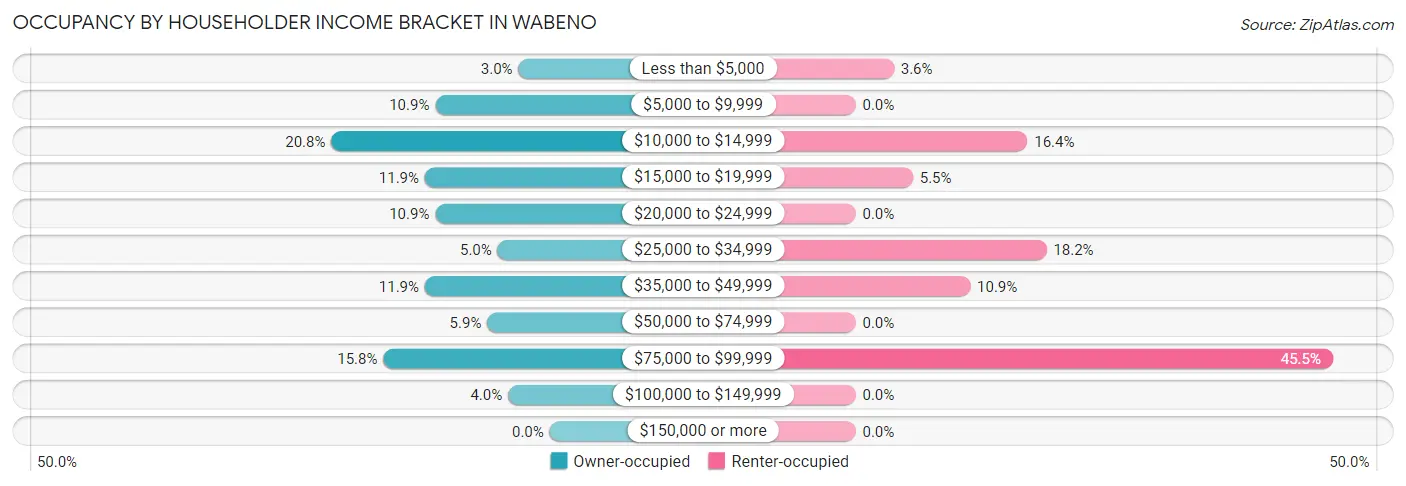
| Income Bracket | Owner-occupied | Renter-occupied |
| Less than $5,000 | 3 (3.0%) | 2 (3.6%) |
| $5,000 to $9,999 | 11 (10.9%) | 0 (0.0%) |
| $10,000 to $14,999 | 21 (20.8%) | 9 (16.4%) |
| $15,000 to $19,999 | 12 (11.9%) | 3 (5.4%) |
| $20,000 to $24,999 | 11 (10.9%) | 0 (0.0%) |
| $25,000 to $34,999 | 5 (5.0%) | 10 (18.2%) |
| $35,000 to $49,999 | 12 (11.9%) | 6 (10.9%) |
| $50,000 to $74,999 | 6 (5.9%) | 0 (0.0%) |
| $75,000 to $99,999 | 16 (15.8%) | 25 (45.5%) |
| $100,000 to $149,999 | 4 (4.0%) | 0 (0.0%) |
| $150,000 or more | 0 (0.0%) | 0 (0.0%) |
| Total | 101 (100.0%) | 55 (100.0%) |
Monthly Housing Cost Tiers in Wabeno
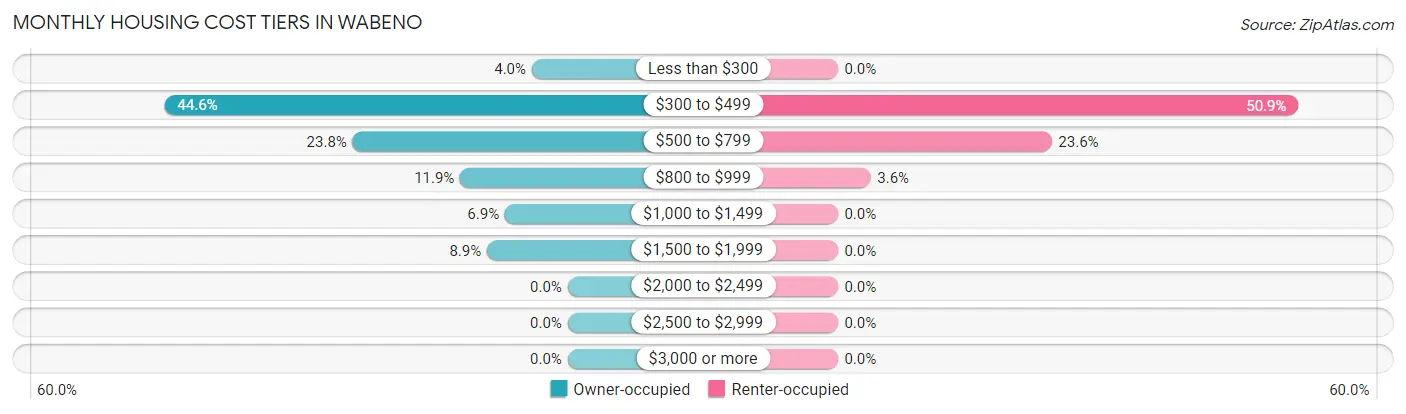
| Monthly Cost | Owner-occupied | Renter-occupied |
| Less than $300 | 4 (4.0%) | 0 (0.0%) |
| $300 to $499 | 45 (44.6%) | 28 (50.9%) |
| $500 to $799 | 24 (23.8%) | 13 (23.6%) |
| $800 to $999 | 12 (11.9%) | 2 (3.6%) |
| $1,000 to $1,499 | 7 (6.9%) | 0 (0.0%) |
| $1,500 to $1,999 | 9 (8.9%) | 0 (0.0%) |
| $2,000 to $2,499 | 0 (0.0%) | 0 (0.0%) |
| $2,500 to $2,999 | 0 (0.0%) | 0 (0.0%) |
| $3,000 or more | 0 (0.0%) | 0 (0.0%) |
| Total | 101 (100.0%) | 55 (100.0%) |
Physical Housing Characteristics in Wabeno
Housing Structures in Wabeno
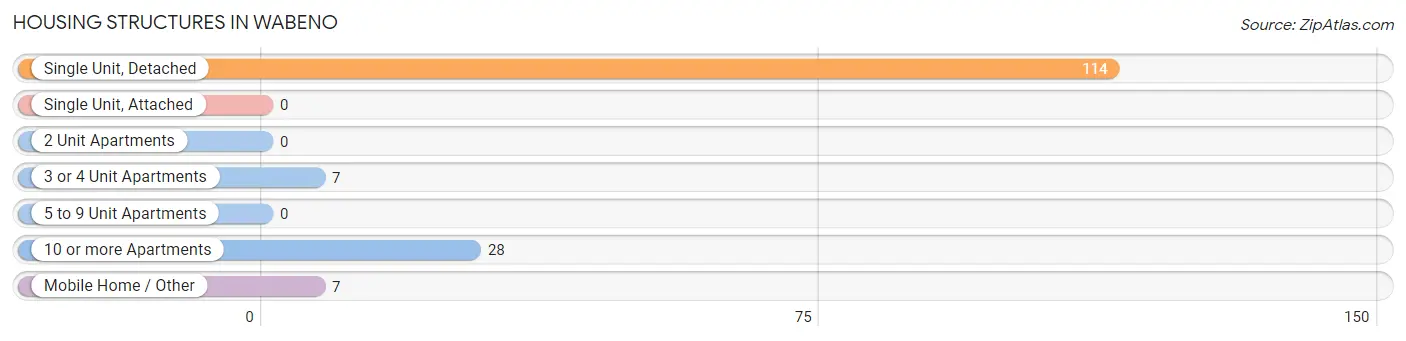
| Structure Type | # Housing Units | % Housing Units |
| Single Unit, Detached | 114 | 73.1% |
| Single Unit, Attached | 0 | 0.0% |
| 2 Unit Apartments | 0 | 0.0% |
| 3 or 4 Unit Apartments | 7 | 4.5% |
| 5 to 9 Unit Apartments | 0 | 0.0% |
| 10 or more Apartments | 28 | 17.9% |
| Mobile Home / Other | 7 | 4.5% |
| Total | 156 | 100.0% |
Housing Structures by Occupancy in Wabeno
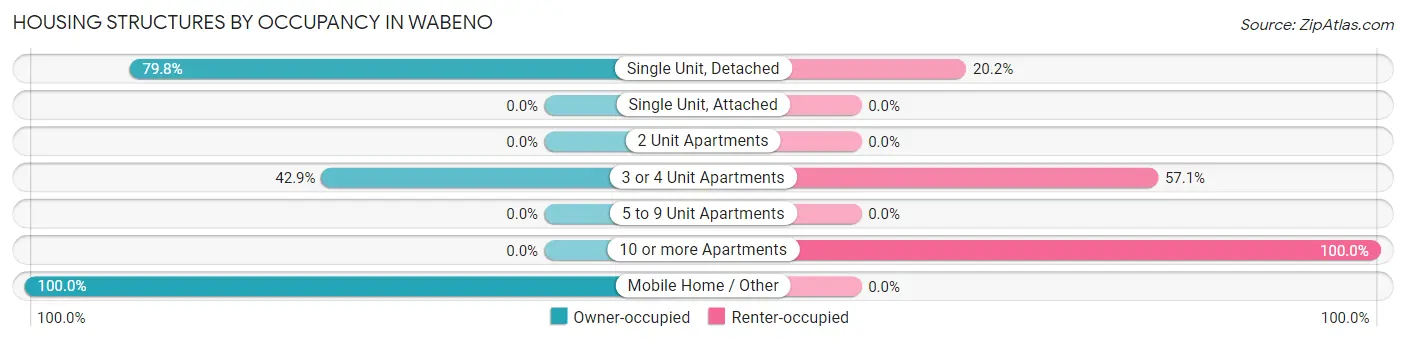
| Structure Type | Owner-occupied | Renter-occupied |
| Single Unit, Detached | 91 (79.8%) | 23 (20.2%) |
| Single Unit, Attached | 0 (0.0%) | 0 (0.0%) |
| 2 Unit Apartments | 0 (0.0%) | 0 (0.0%) |
| 3 or 4 Unit Apartments | 3 (42.9%) | 4 (57.1%) |
| 5 to 9 Unit Apartments | 0 (0.0%) | 0 (0.0%) |
| 10 or more Apartments | 0 (0.0%) | 28 (100.0%) |
| Mobile Home / Other | 7 (100.0%) | 0 (0.0%) |
| Total | 101 (64.7%) | 55 (35.3%) |
Housing Structures by Number of Rooms in Wabeno
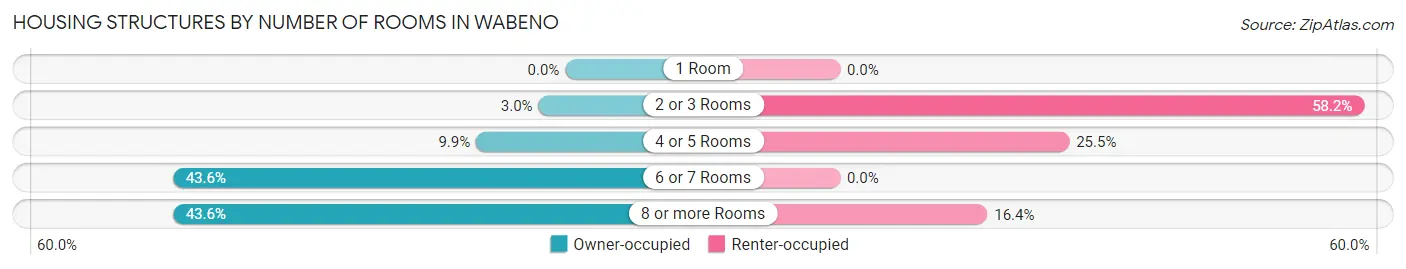
| Number of Rooms | Owner-occupied | Renter-occupied |
| 1 Room | 0 (0.0%) | 0 (0.0%) |
| 2 or 3 Rooms | 3 (3.0%) | 32 (58.2%) |
| 4 or 5 Rooms | 10 (9.9%) | 14 (25.5%) |
| 6 or 7 Rooms | 44 (43.6%) | 0 (0.0%) |
| 8 or more Rooms | 44 (43.6%) | 9 (16.4%) |
| Total | 101 (100.0%) | 55 (100.0%) |
Housing Structure by Heating Type in Wabeno
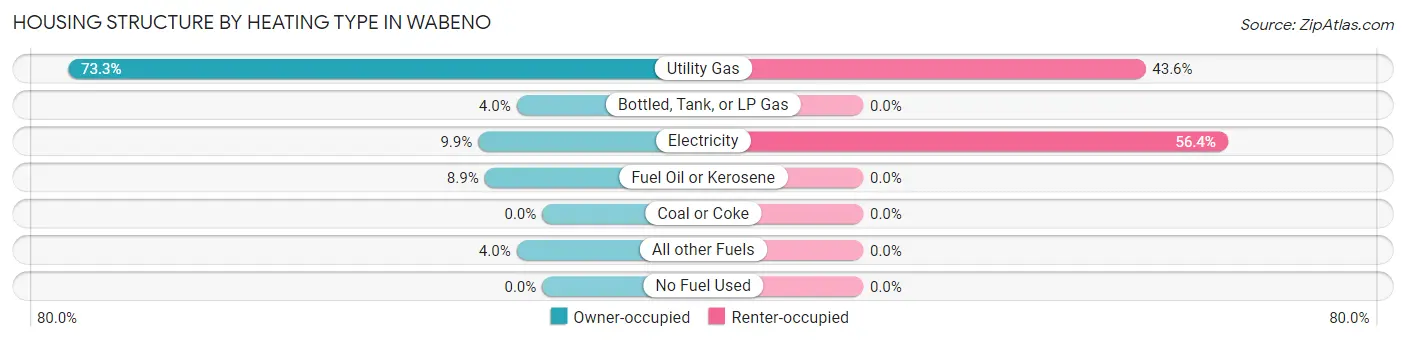
| Heating Type | Owner-occupied | Renter-occupied |
| Utility Gas | 74 (73.3%) | 24 (43.6%) |
| Bottled, Tank, or LP Gas | 4 (4.0%) | 0 (0.0%) |
| Electricity | 10 (9.9%) | 31 (56.4%) |
| Fuel Oil or Kerosene | 9 (8.9%) | 0 (0.0%) |
| Coal or Coke | 0 (0.0%) | 0 (0.0%) |
| All other Fuels | 4 (4.0%) | 0 (0.0%) |
| No Fuel Used | 0 (0.0%) | 0 (0.0%) |
| Total | 101 (100.0%) | 55 (100.0%) |
Household Vehicle Usage in Wabeno
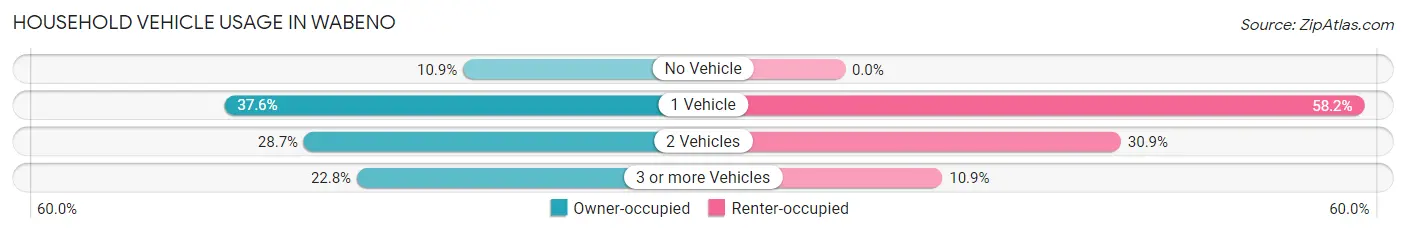
| Vehicles per Household | Owner-occupied | Renter-occupied |
| No Vehicle | 11 (10.9%) | 0 (0.0%) |
| 1 Vehicle | 38 (37.6%) | 32 (58.2%) |
| 2 Vehicles | 29 (28.7%) | 17 (30.9%) |
| 3 or more Vehicles | 23 (22.8%) | 6 (10.9%) |
| Total | 101 (100.0%) | 55 (100.0%) |
Real Estate & Mortgages in Wabeno
Real Estate and Mortgage Overview in Wabeno
| Characteristic | Without Mortgage | With Mortgage |
| Housing Units | 45 | 56 |
| Median Property Value | $101,400 | $84,500 |
| Median Household Income | - | - |
| Monthly Housing Costs | $419 | $0 |
| Real Estate Taxes | $1,023 | $0 |
Property Value by Mortgage Status in Wabeno
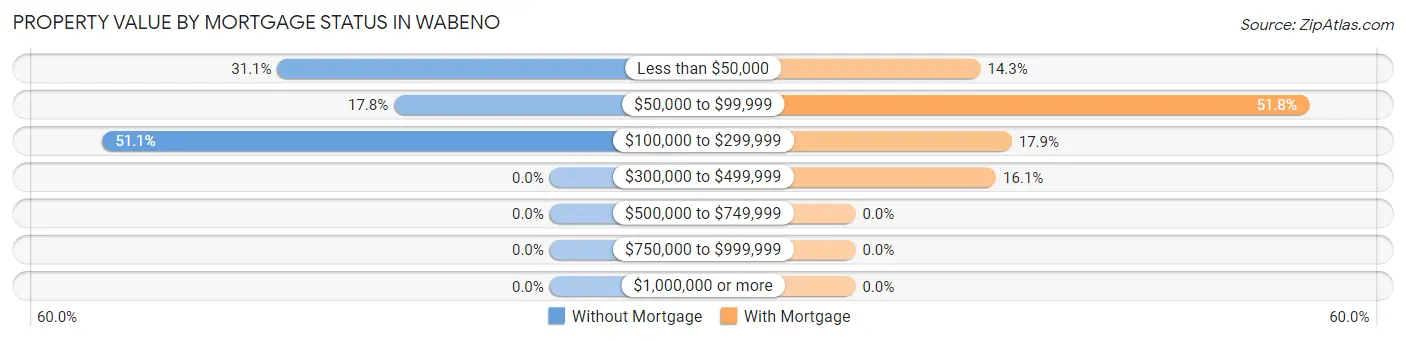
| Property Value | Without Mortgage | With Mortgage |
| Less than $50,000 | 14 (31.1%) | 8 (14.3%) |
| $50,000 to $99,999 | 8 (17.8%) | 29 (51.8%) |
| $100,000 to $299,999 | 23 (51.1%) | 10 (17.9%) |
| $300,000 to $499,999 | 0 (0.0%) | 9 (16.1%) |
| $500,000 to $749,999 | 0 (0.0%) | 0 (0.0%) |
| $750,000 to $999,999 | 0 (0.0%) | 0 (0.0%) |
| $1,000,000 or more | 0 (0.0%) | 0 (0.0%) |
| Total | 45 (100.0%) | 56 (100.0%) |
Household Income by Mortgage Status in Wabeno
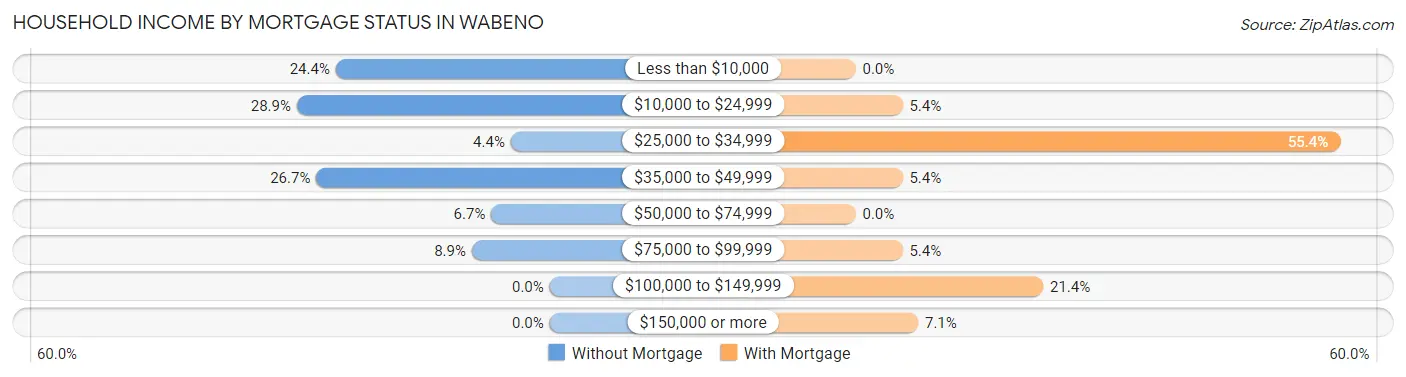
| Household Income | Without Mortgage | With Mortgage |
| Less than $10,000 | 11 (24.4%) | 0 (0.0%) |
| $10,000 to $24,999 | 13 (28.9%) | 3 (5.4%) |
| $25,000 to $34,999 | 2 (4.4%) | 31 (55.4%) |
| $35,000 to $49,999 | 12 (26.7%) | 3 (5.4%) |
| $50,000 to $74,999 | 3 (6.7%) | 0 (0.0%) |
| $75,000 to $99,999 | 4 (8.9%) | 3 (5.4%) |
| $100,000 to $149,999 | 0 (0.0%) | 12 (21.4%) |
| $150,000 or more | 0 (0.0%) | 4 (7.1%) |
| Total | 45 (100.0%) | 56 (100.0%) |
Property Value to Household Income Ratio in Wabeno
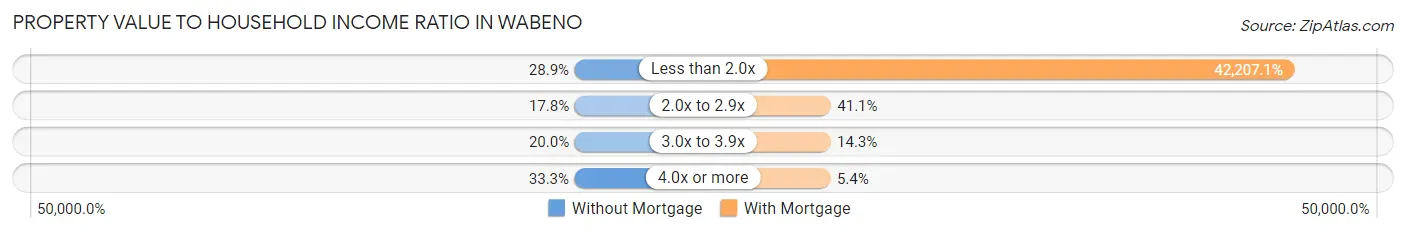
| Value-to-Income Ratio | Without Mortgage | With Mortgage |
| Less than 2.0x | 13 (28.9%) | 23,636 (42,207.1%) |
| 2.0x to 2.9x | 8 (17.8%) | 23 (41.1%) |
| 3.0x to 3.9x | 9 (20.0%) | 8 (14.3%) |
| 4.0x or more | 15 (33.3%) | 3 (5.4%) |
| Total | 45 (100.0%) | 56 (100.0%) |
Real Estate Taxes by Mortgage Status in Wabeno
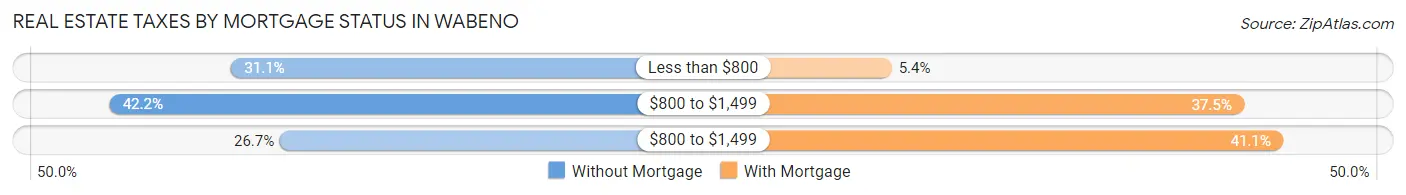
| Property Taxes | Without Mortgage | With Mortgage |
| Less than $800 | 14 (31.1%) | 3 (5.4%) |
| $800 to $1,499 | 19 (42.2%) | 21 (37.5%) |
| $800 to $1,499 | 12 (26.7%) | 23 (41.1%) |
| Total | 45 (100.0%) | 56 (100.0%) |
Health & Disability in Wabeno
Health Insurance Coverage by Age in Wabeno
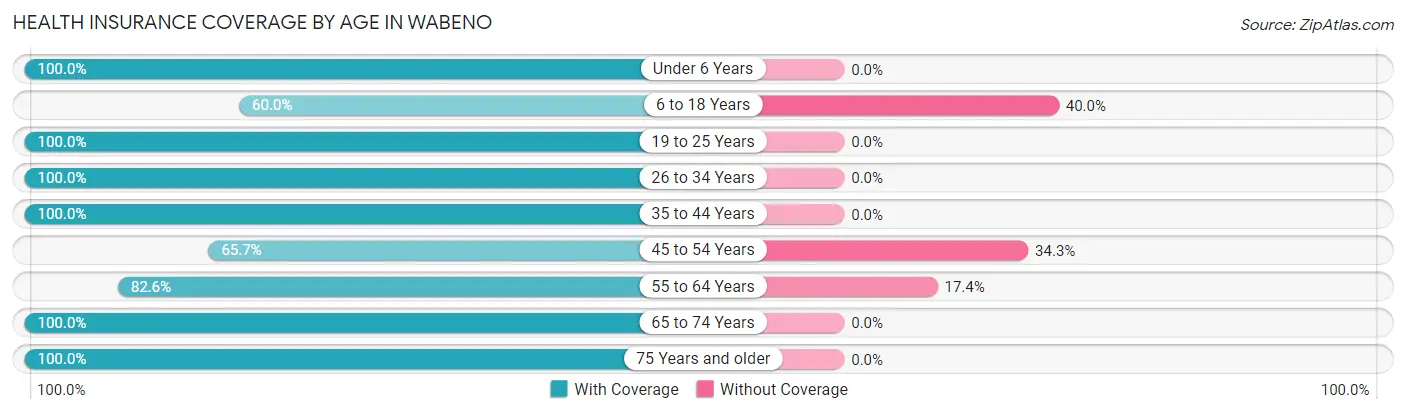
| Age Bracket | With Coverage | Without Coverage |
| Under 6 Years | 17 (100.0%) | 0 (0.0%) |
| 6 to 18 Years | 6 (60.0%) | 4 (40.0%) |
| 19 to 25 Years | 20 (100.0%) | 0 (0.0%) |
| 26 to 34 Years | 40 (100.0%) | 0 (0.0%) |
| 35 to 44 Years | 15 (100.0%) | 0 (0.0%) |
| 45 to 54 Years | 23 (65.7%) | 12 (34.3%) |
| 55 to 64 Years | 19 (82.6%) | 4 (17.4%) |
| 65 to 74 Years | 32 (100.0%) | 0 (0.0%) |
| 75 Years and older | 51 (100.0%) | 0 (0.0%) |
| Total | 223 (91.8%) | 20 (8.2%) |
Health Insurance Coverage by Citizenship Status in Wabeno
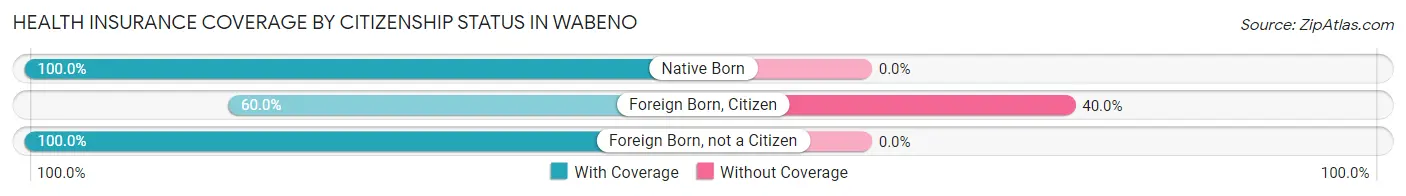
| Citizenship Status | With Coverage | Without Coverage |
| Native Born | 17 (100.0%) | 0 (0.0%) |
| Foreign Born, Citizen | 6 (60.0%) | 4 (40.0%) |
| Foreign Born, not a Citizen | 20 (100.0%) | 0 (0.0%) |
Health Insurance Coverage by Household Income in Wabeno
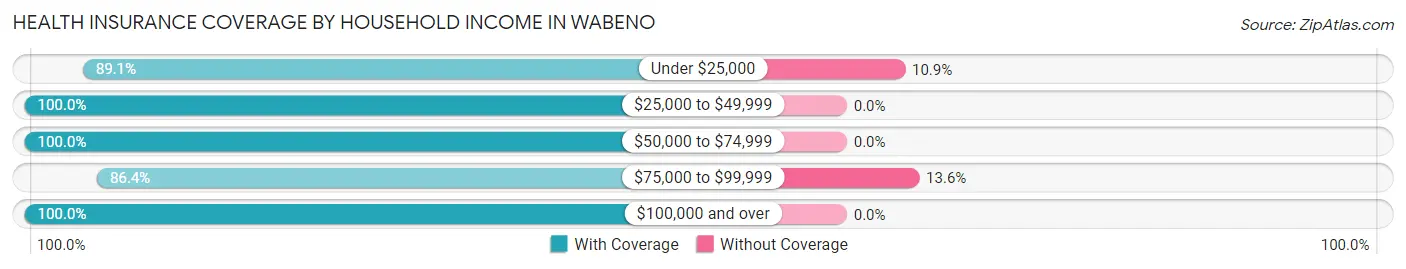
| Household Income | With Coverage | Without Coverage |
| Under $25,000 | 98 (89.1%) | 12 (10.9%) |
| $25,000 to $49,999 | 47 (100.0%) | 0 (0.0%) |
| $50,000 to $74,999 | 14 (100.0%) | 0 (0.0%) |
| $75,000 to $99,999 | 51 (86.4%) | 8 (13.6%) |
| $100,000 and over | 13 (100.0%) | 0 (0.0%) |
Public vs Private Health Insurance Coverage by Age in Wabeno
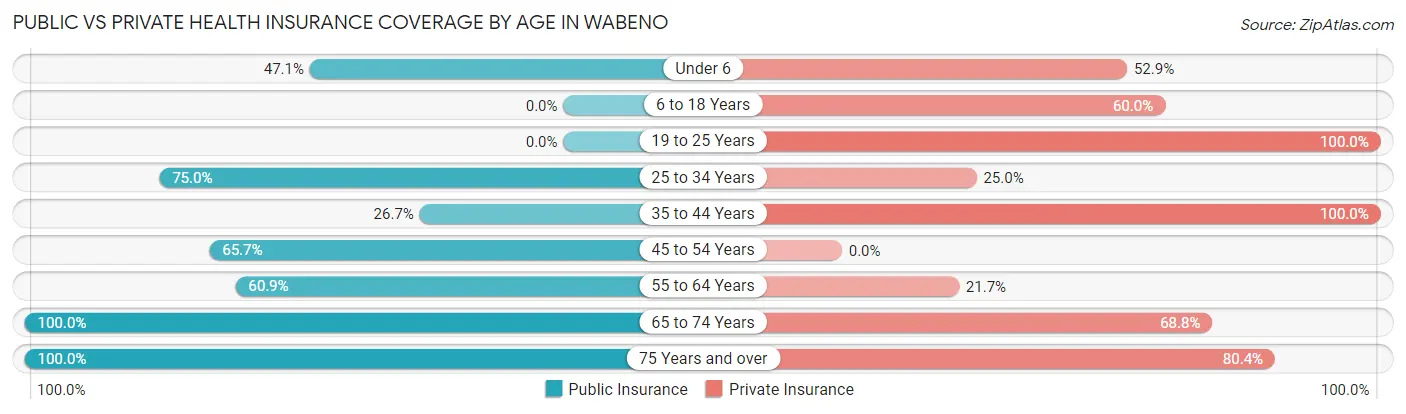
| Age Bracket | Public Insurance | Private Insurance |
| Under 6 | 8 (47.1%) | 9 (52.9%) |
| 6 to 18 Years | 0 (0.0%) | 6 (60.0%) |
| 19 to 25 Years | 0 (0.0%) | 20 (100.0%) |
| 25 to 34 Years | 30 (75.0%) | 10 (25.0%) |
| 35 to 44 Years | 4 (26.7%) | 15 (100.0%) |
| 45 to 54 Years | 23 (65.7%) | 0 (0.0%) |
| 55 to 64 Years | 14 (60.9%) | 5 (21.7%) |
| 65 to 74 Years | 32 (100.0%) | 22 (68.8%) |
| 75 Years and over | 51 (100.0%) | 41 (80.4%) |
| Total | 162 (66.7%) | 128 (52.7%) |
Disability Status by Sex by Age in Wabeno
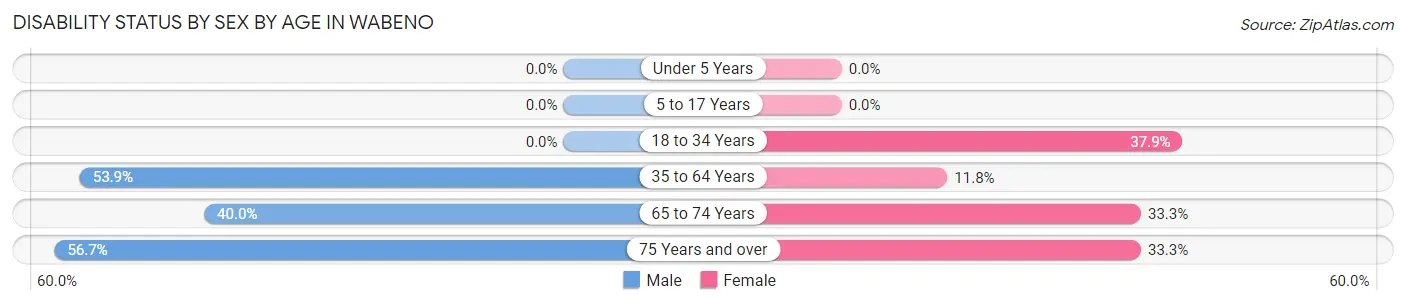
| Age Bracket | Male | Female |
| Under 5 Years | 0 (0.0%) | 0 (0.0%) |
| 5 to 17 Years | 0 (0.0%) | 0 (0.0%) |
| 18 to 34 Years | 0 (0.0%) | 11 (37.9%) |
| 35 to 64 Years | 21 (53.8%) | 4 (11.8%) |
| 65 to 74 Years | 8 (40.0%) | 4 (33.3%) |
| 75 Years and over | 17 (56.7%) | 7 (33.3%) |
Disability Class by Sex by Age in Wabeno
Disability Class: Hearing Difficulty
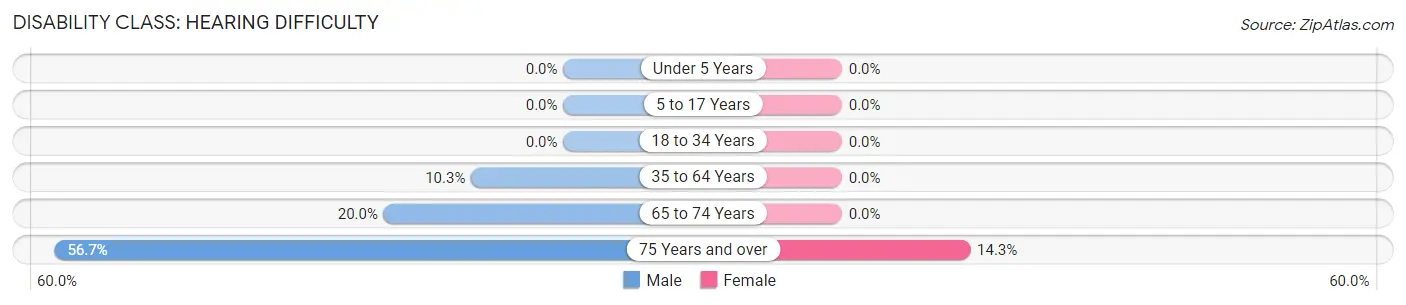
| Age Bracket | Male | Female |
| Under 5 Years | 0 (0.0%) | 0 (0.0%) |
| 5 to 17 Years | 0 (0.0%) | 0 (0.0%) |
| 18 to 34 Years | 0 (0.0%) | 0 (0.0%) |
| 35 to 64 Years | 4 (10.3%) | 0 (0.0%) |
| 65 to 74 Years | 4 (20.0%) | 0 (0.0%) |
| 75 Years and over | 17 (56.7%) | 3 (14.3%) |
Disability Class: Vision Difficulty
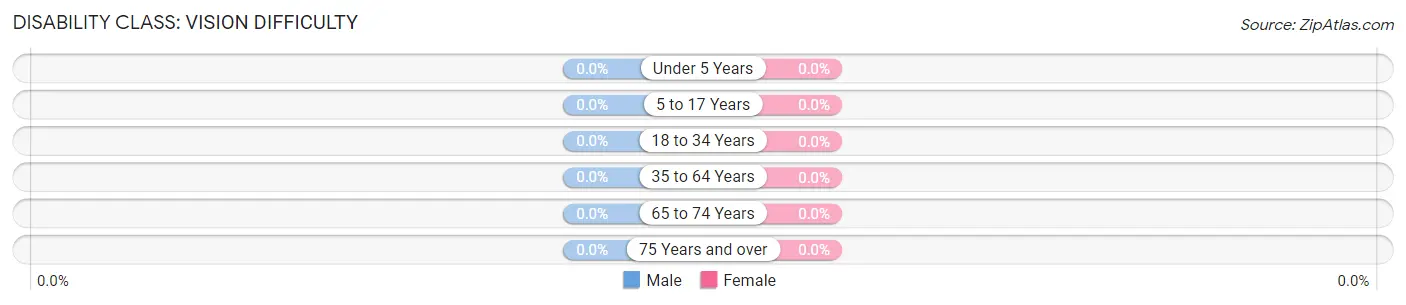
| Age Bracket | Male | Female |
| Under 5 Years | 0 (0.0%) | 0 (0.0%) |
| 5 to 17 Years | 0 (0.0%) | 0 (0.0%) |
| 18 to 34 Years | 0 (0.0%) | 0 (0.0%) |
| 35 to 64 Years | 0 (0.0%) | 0 (0.0%) |
| 65 to 74 Years | 0 (0.0%) | 0 (0.0%) |
| 75 Years and over | 0 (0.0%) | 0 (0.0%) |
Disability Class: Cognitive Difficulty
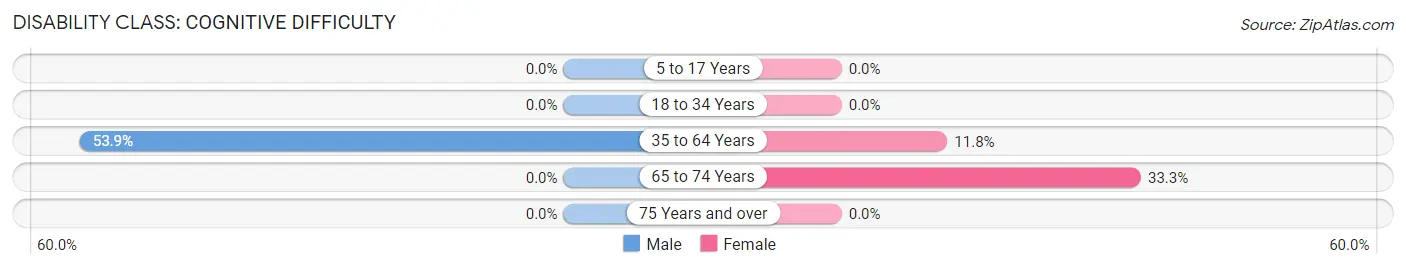
| Age Bracket | Male | Female |
| 5 to 17 Years | 0 (0.0%) | 0 (0.0%) |
| 18 to 34 Years | 0 (0.0%) | 0 (0.0%) |
| 35 to 64 Years | 21 (53.8%) | 4 (11.8%) |
| 65 to 74 Years | 0 (0.0%) | 4 (33.3%) |
| 75 Years and over | 0 (0.0%) | 0 (0.0%) |
Disability Class: Ambulatory Difficulty
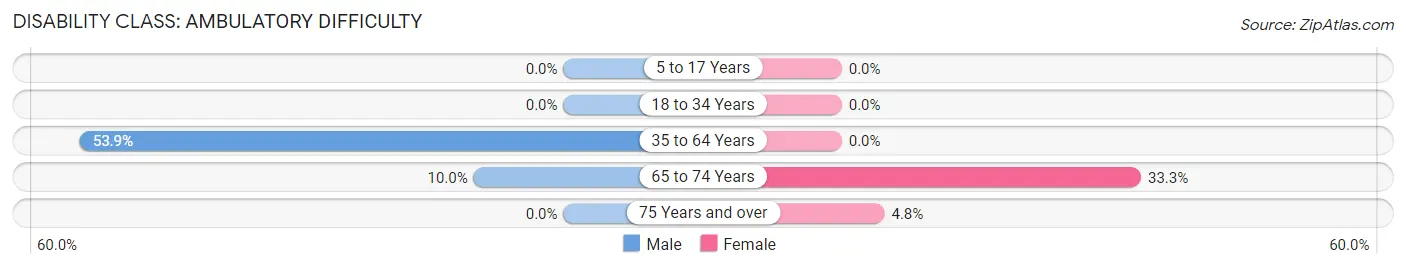
| Age Bracket | Male | Female |
| 5 to 17 Years | 0 (0.0%) | 0 (0.0%) |
| 18 to 34 Years | 0 (0.0%) | 0 (0.0%) |
| 35 to 64 Years | 21 (53.8%) | 0 (0.0%) |
| 65 to 74 Years | 2 (10.0%) | 4 (33.3%) |
| 75 Years and over | 0 (0.0%) | 1 (4.8%) |
Disability Class: Self-Care Difficulty
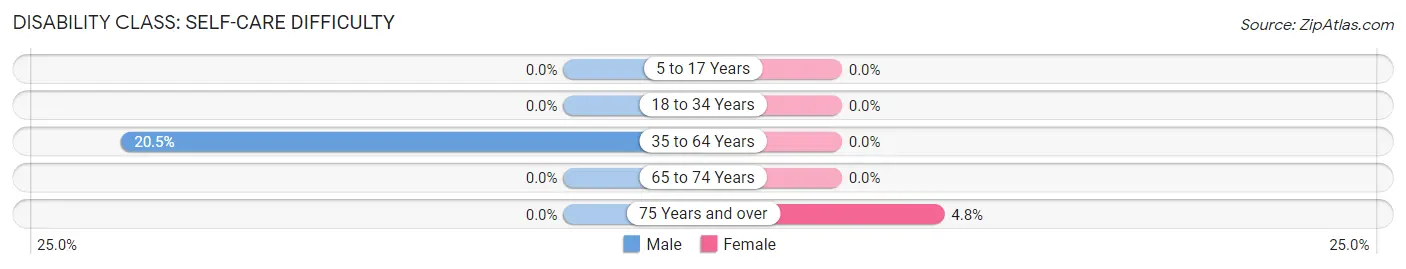
| Age Bracket | Male | Female |
| 5 to 17 Years | 0 (0.0%) | 0 (0.0%) |
| 18 to 34 Years | 0 (0.0%) | 0 (0.0%) |
| 35 to 64 Years | 8 (20.5%) | 0 (0.0%) |
| 65 to 74 Years | 0 (0.0%) | 0 (0.0%) |
| 75 Years and over | 0 (0.0%) | 1 (4.8%) |
Technology Access in Wabeno
Computing Device Access in Wabeno
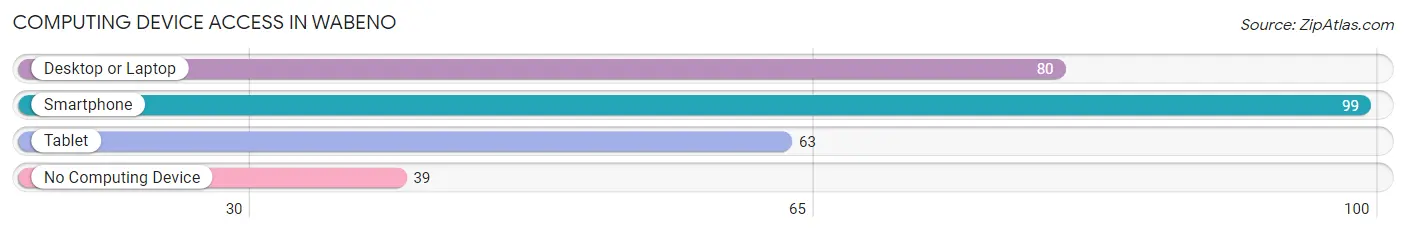
| Device Type | # Households | % Households |
| Desktop or Laptop | 80 | 51.3% |
| Smartphone | 99 | 63.5% |
| Tablet | 63 | 40.4% |
| No Computing Device | 39 | 25.0% |
| Total | 156 | 100.0% |
Internet Access in Wabeno
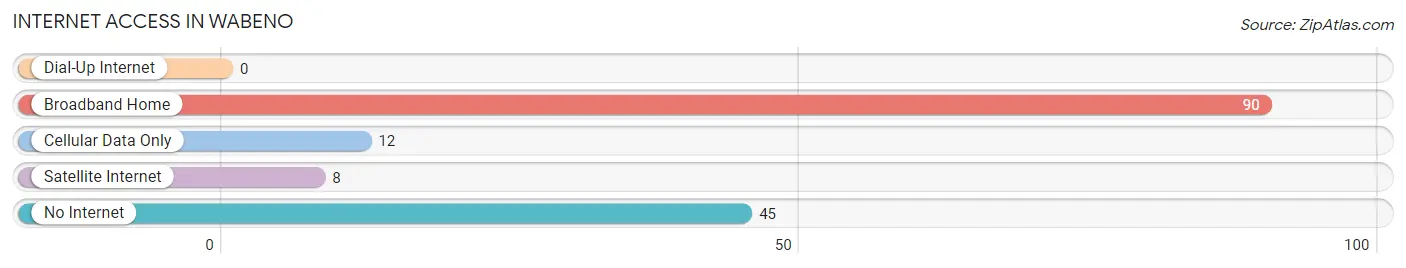
| Internet Type | # Households | % Households |
| Dial-Up Internet | 0 | 0.0% |
| Broadband Home | 90 | 57.7% |
| Cellular Data Only | 12 | 7.7% |
| Satellite Internet | 8 | 5.1% |
| No Internet | 45 | 28.8% |
| Total | 156 | 100.0% |
Wabeno Summary
Wabeno is a small town located in Forest County, Wisconsin. It is situated in the northern part of the state, near the border of Michigan’s Upper Peninsula. The town was founded in 1883 and has a population of approximately 600 people.
History
The area that is now Wabeno was originally inhabited by the Menominee and Potawatomi Native American tribes. The first white settlers arrived in the area in the late 1800s, and the town was officially founded in 1883. The name “Wabeno” is derived from the Menominee word “wabenowi,” which means “place of the white birch.”
The town was initially a logging community, and the first sawmill was built in 1884. The logging industry was the primary source of employment for the town’s residents until the mid-1900s. In the 1950s, the town began to diversify its economy, and today it is home to a variety of businesses, including a cheese factory, a lumber mill, and a paper mill.
Geography
Wabeno is located in the northern part of Wisconsin, near the border of Michigan’s Upper Peninsula. The town is situated in a heavily forested area, and the surrounding landscape is characterized by rolling hills and dense forests. The town is located on the banks of the Wabeno River, which flows through the town and is a popular destination for fishing and canoeing.
The town is located approximately 30 miles from the city of Green Bay, and is accessible by car via US Highway 141. The nearest major airport is located in Appleton, which is approximately 70 miles away.
Economy
The economy of Wabeno is largely based on the lumber and paper industries. The town is home to a number of lumber mills and paper mills, which provide employment for many of the town’s residents. The town is also home to a cheese factory, which produces a variety of cheeses for sale in the local area.
In addition to the lumber and paper industries, the town is also home to a number of small businesses, including restaurants, retail stores, and service providers. The town is also home to a number of tourist attractions, including a museum, a golf course, and a number of outdoor recreation areas.
Demographics
As of the 2010 census, the population of Wabeno was 590 people. The town has a median age of 44.7 years, and the median household income is $37,500. The town is predominantly white, with approximately 95% of the population identifying as Caucasian. The town also has a small Hispanic population, with approximately 4% of the population identifying as Hispanic or Latino.
Conclusion
Wabeno is a small town located in Forest County, Wisconsin. It was founded in 1883 and has a population of approximately 600 people. The town is situated in a heavily forested area, and the surrounding landscape is characterized by rolling hills and dense forests. The economy of Wabeno is largely based on the lumber and paper industries, and the town is also home to a number of small businesses and tourist attractions. The population of Wabeno is predominantly white, with approximately 95% of the population identifying as Caucasian.
Common Questions
What is Per Capita Income in Wabeno?
Per Capita income in Wabeno is $26,650.
What is the Median Household income in Wabeno?
Median Household Income in Wabeno is $31,000.
What is Inequality or Gini Index in Wabeno?
Inequality or Gini Index in Wabeno is 0.43.
What is the Total Population of Wabeno?
Total Population of Wabeno is 243.
What is the Total Male Population of Wabeno?
Total Male Population of Wabeno is 125.
What is the Total Female Population of Wabeno?
Total Female Population of Wabeno is 118.
What is the Ratio of Males per 100 Females in Wabeno?
There are 105.93 Males per 100 Females in Wabeno.
What is the Ratio of Females per 100 Males in Wabeno?
There are 94.40 Females per 100 Males in Wabeno.
What is the Median Population Age in Wabeno?
Median Population Age in Wabeno is 50.6 Years.
What is the Average Family Size in Wabeno
Average Family Size in Wabeno is 2.5 People.
What is the Average Household Size in Wabeno
Average Household Size in Wabeno is 1.6 People.
How Large is the Labor Force in Wabeno?
There are 85 People in the Labor Forcein in Wabeno.
What is the Percentage of People in the Labor Force in Wabeno?
39.4% of People are in the Labor Force in Wabeno.
What is the Unemployment Rate in Wabeno?
Unemployment Rate in Wabeno is 4.7%.