Mcfarland, WI Map & Demographics
Mcfarland Map
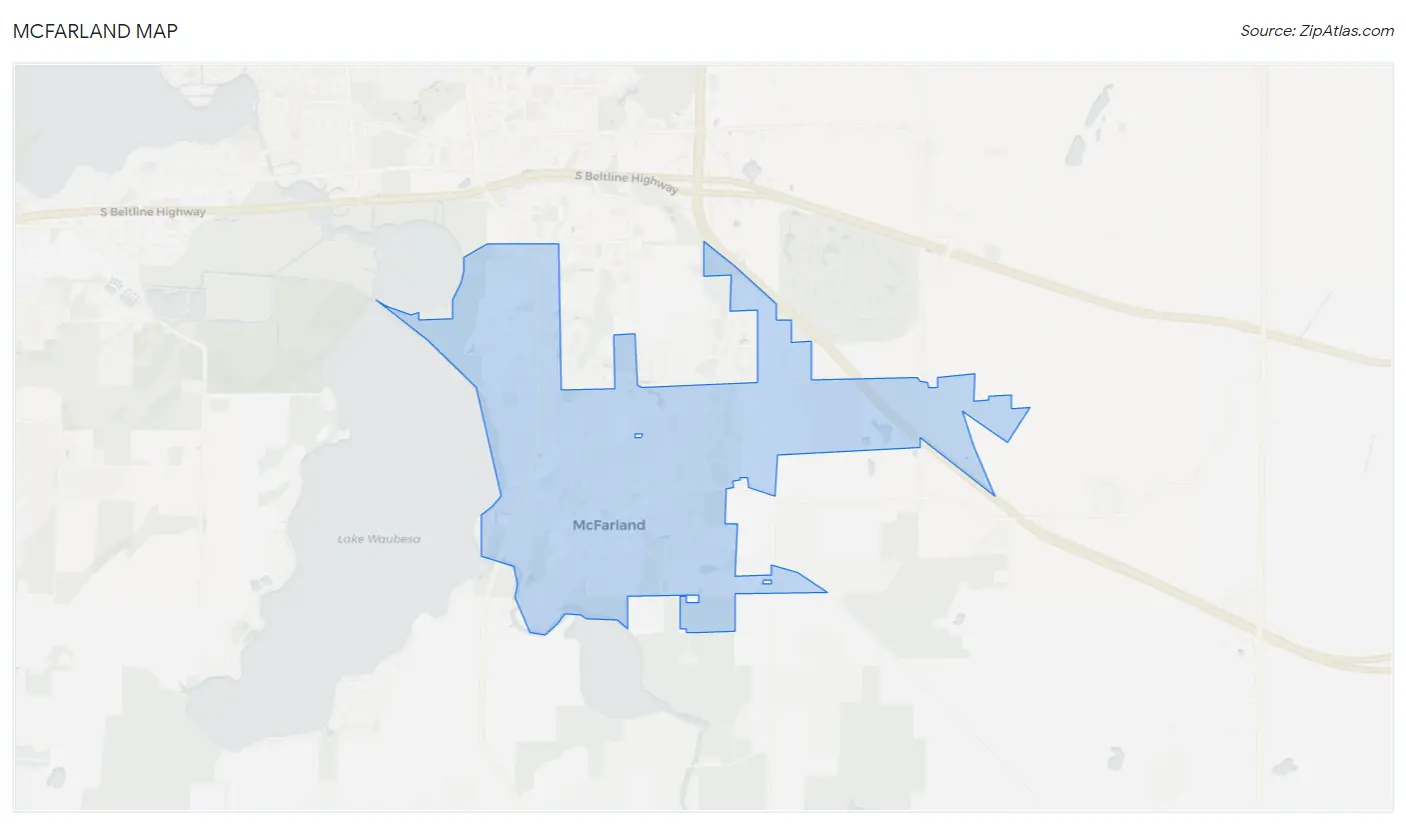
Mcfarland Overview
$51,121
PER CAPITA INCOME
$105,491
AVG FAMILY INCOME
$91,029
AVG HOUSEHOLD INCOME
30.1%
WAGE / INCOME GAP [ % ]
69.9¢/ $1
WAGE / INCOME GAP [ $ ]
0.41
INEQUALITY / GINI INDEX
9,104
TOTAL POPULATION
3,879
MALE POPULATION
5,225
FEMALE POPULATION
74.24
MALES / 100 FEMALES
134.70
FEMALES / 100 MALES
39.6
MEDIAN AGE
2.8
AVG FAMILY SIZE
2.5
AVG HOUSEHOLD SIZE
5,339
LABOR FORCE [ PEOPLE ]
74.2%
PERCENT IN LABOR FORCE
4.0%
UNEMPLOYMENT RATE
Mcfarland Zip Codes
Mcfarland Area Codes
Income in Mcfarland
Income Overview in Mcfarland
Per Capita Income in Mcfarland is $51,121, while median incomes of families and households are $105,491 and $91,029 respectively.
| Characteristic | Number | Measure |
| Per Capita Income | 9,104 | $51,121 |
| Median Family Income | 2,650 | $105,491 |
| Mean Family Income | 2,650 | $138,104 |
| Median Household Income | 3,672 | $91,029 |
| Mean Household Income | 3,672 | $125,373 |
| Income Deficit | 2,650 | $0 |
| Wage / Income Gap (%) | 9,104 | 30.13% |
| Wage / Income Gap ($) | 9,104 | 69.87¢ per $1 |
| Gini / Inequality Index | 9,104 | 0.41 |
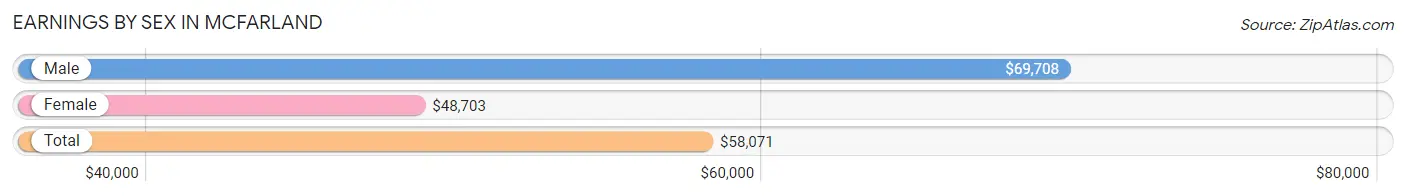
Earnings by Sex in Mcfarland
Average Earnings in Mcfarland are $58,071, $69,708 for men and $48,703 for women, a difference of 30.1%.
| Sex | Number | Average Earnings |
| Male | 2,370 (43.6%) | $69,708 |
| Female | 3,063 (56.4%) | $48,703 |
| Total | 5,433 (100.0%) | $58,071 |
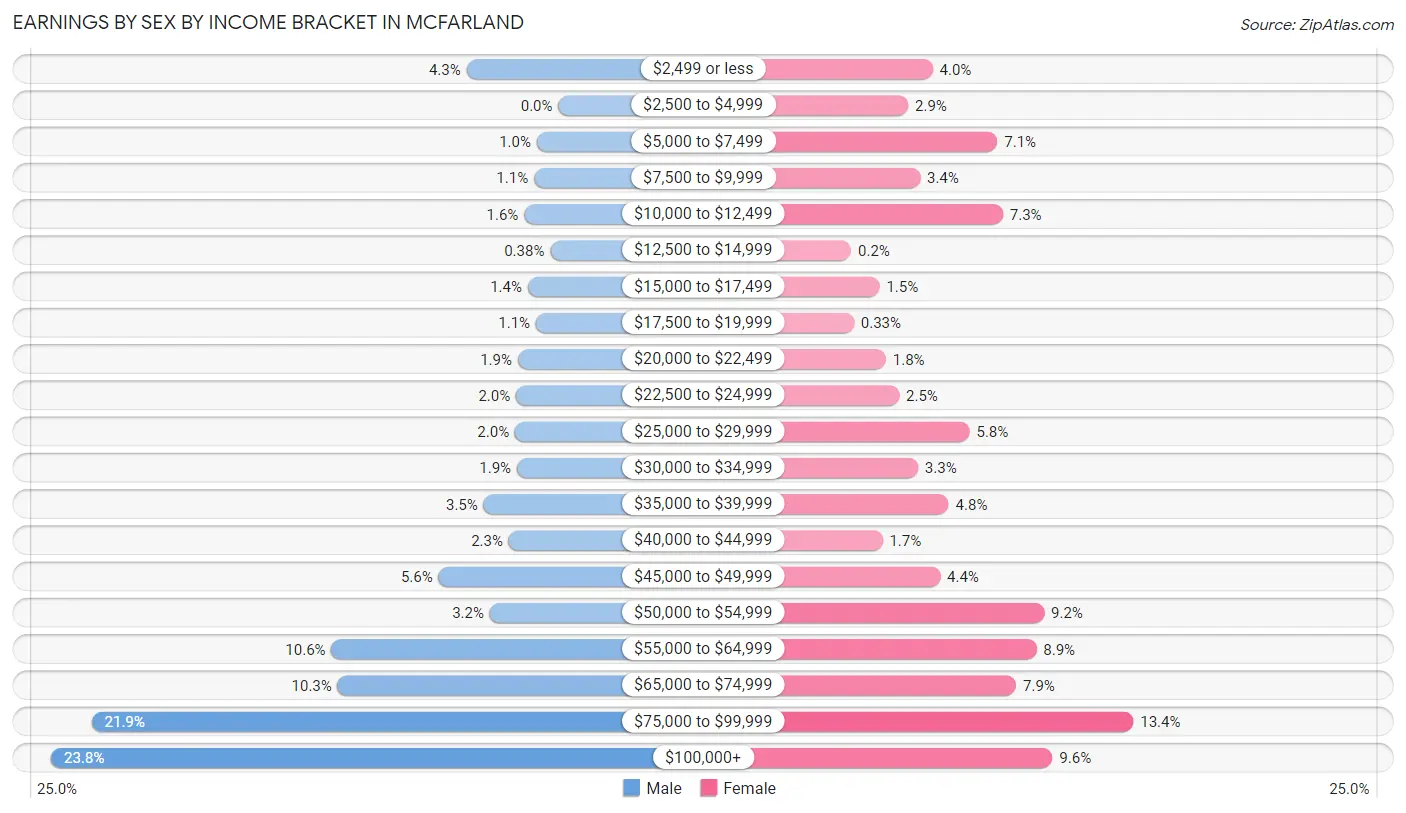
Earnings by Sex by Income Bracket in Mcfarland
The most common earnings brackets in Mcfarland are $100,000+ for men (563 | 23.8%) and $75,000 to $99,999 for women (411 | 13.4%).
| Income | Male | Female |
| $2,499 or less | 102 (4.3%) | 123 (4.0%) |
| $2,500 to $4,999 | 0 (0.0%) | 88 (2.9%) |
| $5,000 to $7,499 | 24 (1.0%) | 216 (7.0%) |
| $7,500 to $9,999 | 27 (1.1%) | 105 (3.4%) |
| $10,000 to $12,499 | 38 (1.6%) | 224 (7.3%) |
| $12,500 to $14,999 | 9 (0.4%) | 6 (0.2%) |
| $15,000 to $17,499 | 34 (1.4%) | 47 (1.5%) |
| $17,500 to $19,999 | 25 (1.1%) | 10 (0.3%) |
| $20,000 to $22,499 | 45 (1.9%) | 56 (1.8%) |
| $22,500 to $24,999 | 47 (2.0%) | 75 (2.5%) |
| $25,000 to $29,999 | 48 (2.0%) | 176 (5.8%) |
| $30,000 to $34,999 | 46 (1.9%) | 102 (3.3%) |
| $35,000 to $39,999 | 83 (3.5%) | 146 (4.8%) |
| $40,000 to $44,999 | 55 (2.3%) | 51 (1.7%) |
| $45,000 to $49,999 | 133 (5.6%) | 134 (4.4%) |
| $50,000 to $54,999 | 76 (3.2%) | 283 (9.2%) |
| $55,000 to $64,999 | 252 (10.6%) | 272 (8.9%) |
| $65,000 to $74,999 | 245 (10.3%) | 243 (7.9%) |
| $75,000 to $99,999 | 518 (21.9%) | 411 (13.4%) |
| $100,000+ | 563 (23.8%) | 295 (9.6%) |
| Total | 2,370 (100.0%) | 3,063 (100.0%) |
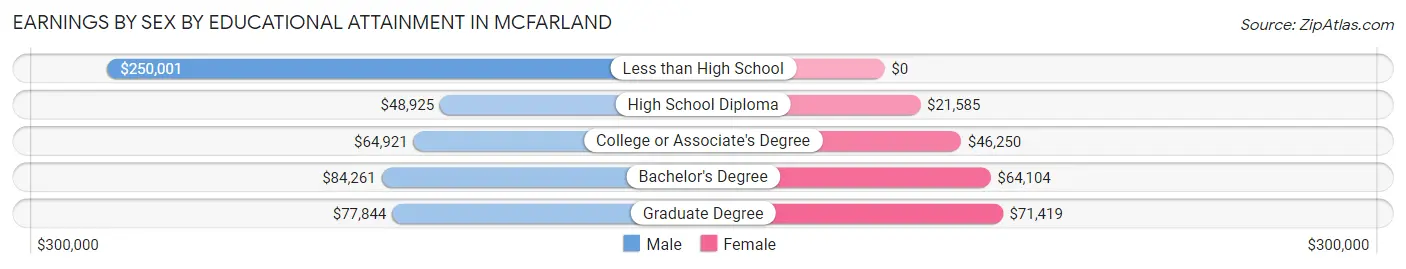
Earnings by Sex by Educational Attainment in Mcfarland
Average earnings in Mcfarland are $72,279 for men and $55,398 for women, a difference of 23.4%. Men with an educational attainment of less than high school enjoy the highest average annual earnings of $250,001, while those with high school diploma education earn the least with $48,925. Women with an educational attainment of graduate degree earn the most with the average annual earnings of $71,419, while those with high school diploma education have the smallest earnings of $21,585.
| Educational Attainment | Male Income | Female Income |
| Less than High School | $250,001 | $0 |
| High School Diploma | $48,925 | $21,585 |
| College or Associate's Degree | $64,921 | $46,250 |
| Bachelor's Degree | $84,261 | $64,104 |
| Graduate Degree | $77,844 | $71,419 |
| Total | $72,279 | $55,398 |
Family Income in Mcfarland
Family Income Brackets in Mcfarland
According to the Mcfarland family income data, there are 647 families falling into the $50,000 to $74,999 income range, which is the most common income bracket and makes up 24.4% of all families.
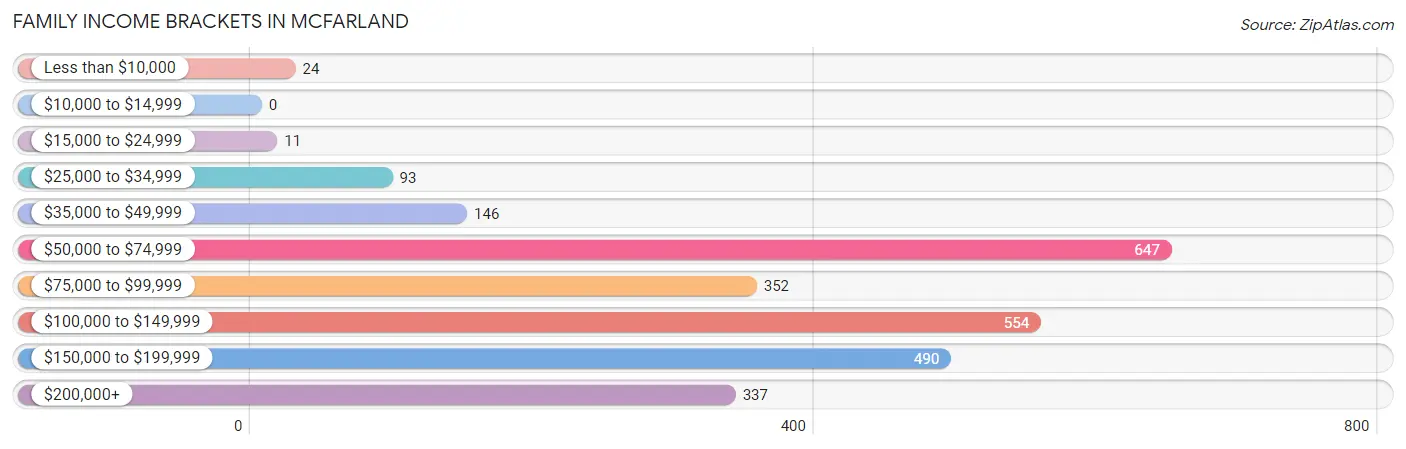
| Income Bracket | # Families | % Families |
| Less than $10,000 | 24 | 0.9% |
| $10,000 to $14,999 | 0 | 0.0% |
| $15,000 to $24,999 | 11 | 0.4% |
| $25,000 to $34,999 | 93 | 3.5% |
| $35,000 to $49,999 | 146 | 5.5% |
| $50,000 to $74,999 | 647 | 24.4% |
| $75,000 to $99,999 | 352 | 13.3% |
| $100,000 to $149,999 | 554 | 20.9% |
| $150,000 to $199,999 | 490 | 18.5% |
| $200,000+ | 337 | 12.7% |
Family Income by Famaliy Size in Mcfarland
4-person families (440 | 16.6%) account for the highest median family income in Mcfarland with $167,917 per family, while 2-person families (1,275 | 48.1%) have the highest median income of $43,388 per family member.
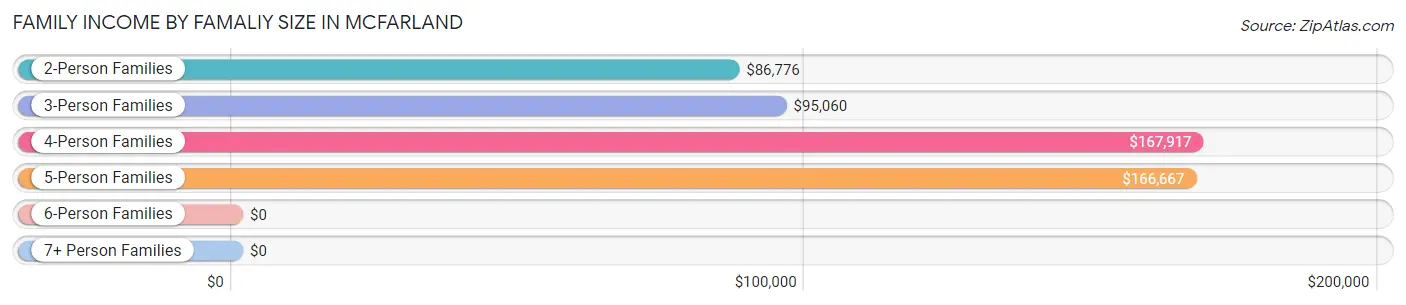
| Income Bracket | # Families | Median Income |
| 2-Person Families | 1,275 (48.1%) | $86,776 |
| 3-Person Families | 699 (26.4%) | $95,060 |
| 4-Person Families | 440 (16.6%) | $167,917 |
| 5-Person Families | 208 (7.9%) | $166,667 |
| 6-Person Families | 28 (1.1%) | $0 |
| 7+ Person Families | 0 (0.0%) | $0 |
| Total | 2,650 (100.0%) | $105,491 |
Family Income by Number of Earners in Mcfarland
The median family income in Mcfarland is $105,491, with families comprising 3+ earners (257) having the highest median family income of $174,732, while families with no earners (229) have the lowest median family income of $85,197, accounting for 9.7% and 8.6% of families, respectively.
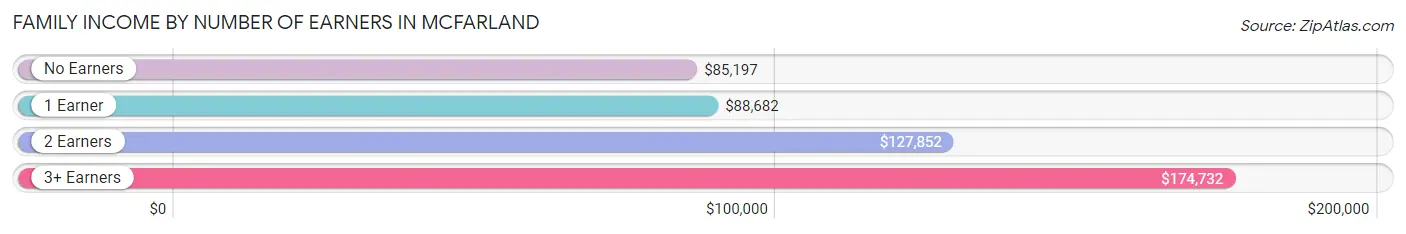
| Number of Earners | # Families | Median Income |
| No Earners | 229 (8.6%) | $85,197 |
| 1 Earner | 711 (26.8%) | $88,682 |
| 2 Earners | 1,453 (54.8%) | $127,852 |
| 3+ Earners | 257 (9.7%) | $174,732 |
| Total | 2,650 (100.0%) | $105,491 |
Household Income in Mcfarland
Household Income Brackets in Mcfarland
With 841 households falling in the category, the $50,000 to $74,999 income range is the most frequent in Mcfarland, accounting for 22.9% of all households. In contrast, only 48 households (1.3%) fall into the $10,000 to $14,999 income bracket, making it the least populous group.
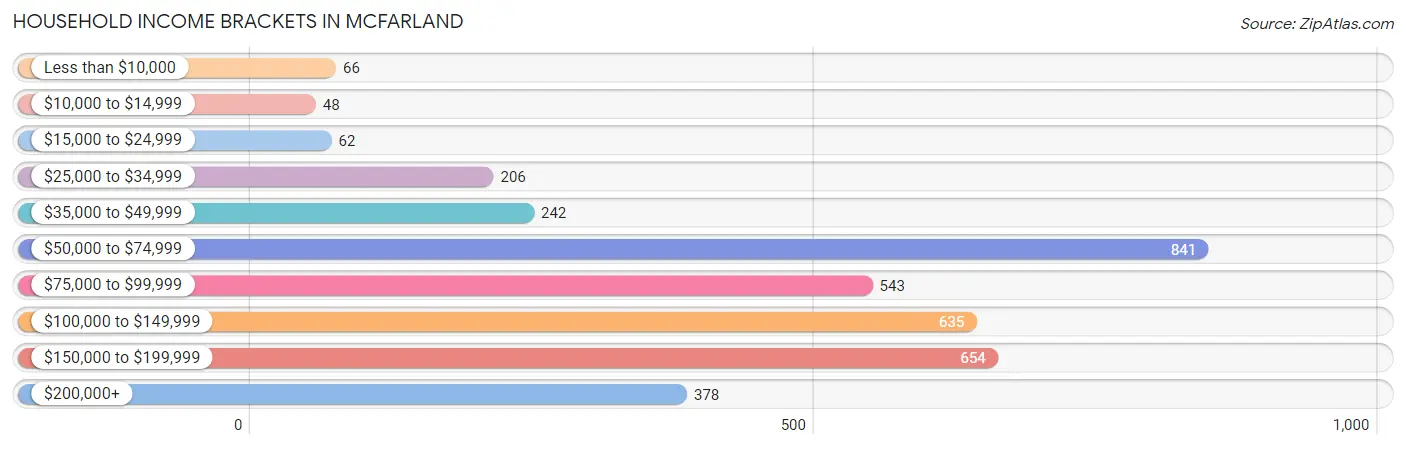
| Income Bracket | # Households | % Households |
| Less than $10,000 | 66 | 1.8% |
| $10,000 to $14,999 | 48 | 1.3% |
| $15,000 to $24,999 | 62 | 1.7% |
| $25,000 to $34,999 | 206 | 5.6% |
| $35,000 to $49,999 | 242 | 6.6% |
| $50,000 to $74,999 | 841 | 22.9% |
| $75,000 to $99,999 | 543 | 14.8% |
| $100,000 to $149,999 | 635 | 17.3% |
| $150,000 to $199,999 | 654 | 17.8% |
| $200,000+ | 378 | 10.3% |
Household Income by Householder Age in Mcfarland
The median household income in Mcfarland is $91,029, with the highest median household income of $119,083 found in the 25 to 44 years age bracket for the primary householder. A total of 1,242 households (33.8%) fall into this category. Meanwhile, the 15 to 24 years age bracket for the primary householder has the lowest median household income of $0, with 84 households (2.3%) in this group.
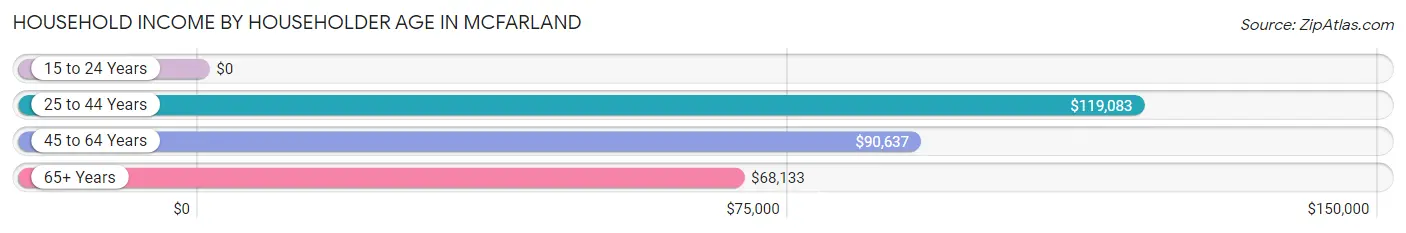
| Income Bracket | # Households | Median Income |
| 15 to 24 Years | 84 (2.3%) | $0 |
| 25 to 44 Years | 1,242 (33.8%) | $119,083 |
| 45 to 64 Years | 1,546 (42.1%) | $90,637 |
| 65+ Years | 800 (21.8%) | $68,133 |
| Total | 3,672 (100.0%) | $91,029 |
Poverty in Mcfarland
Income Below Poverty by Sex and Age in Mcfarland
With 1.4% poverty level for males and 2.5% for females among the residents of Mcfarland, 15 year old males and 75 year old and over females are the most vulnerable to poverty, with 9 males (13.9%) and 30 females (7.7%) in their respective age groups living below the poverty level.
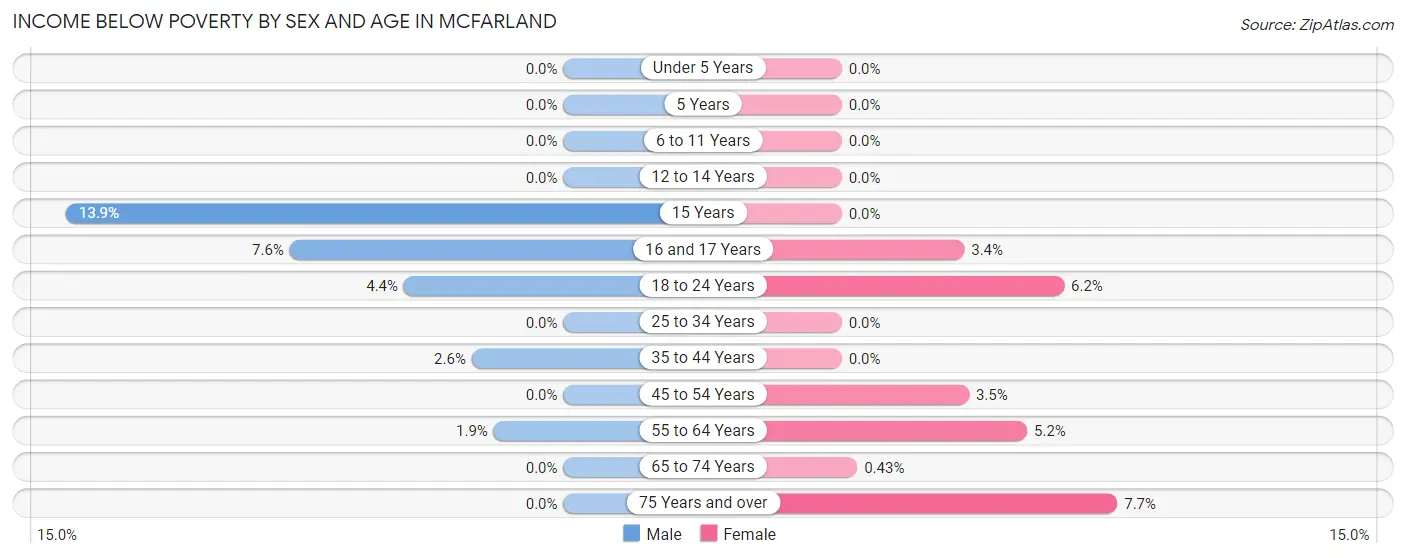
| Age Bracket | Male | Female |
| Under 5 Years | 0 (0.0%) | 0 (0.0%) |
| 5 Years | 0 (0.0%) | 0 (0.0%) |
| 6 to 11 Years | 0 (0.0%) | 0 (0.0%) |
| 12 to 14 Years | 0 (0.0%) | 0 (0.0%) |
| 15 Years | 9 (13.9%) | 0 (0.0%) |
| 16 and 17 Years | 8 (7.6%) | 9 (3.4%) |
| 18 to 24 Years | 8 (4.4%) | 38 (6.2%) |
| 25 to 34 Years | 0 (0.0%) | 0 (0.0%) |
| 35 to 44 Years | 18 (2.5%) | 0 (0.0%) |
| 45 to 54 Years | 0 (0.0%) | 23 (3.5%) |
| 55 to 64 Years | 11 (1.9%) | 28 (5.2%) |
| 65 to 74 Years | 0 (0.0%) | 2 (0.4%) |
| 75 Years and over | 0 (0.0%) | 30 (7.7%) |
| Total | 54 (1.4%) | 130 (2.5%) |
Income Above Poverty by Sex and Age in Mcfarland
According to the poverty statistics in Mcfarland, males aged under 5 years and females aged under 5 years are the age groups that are most secure financially, with 100.0% of males and 100.0% of females in these age groups living above the poverty line.
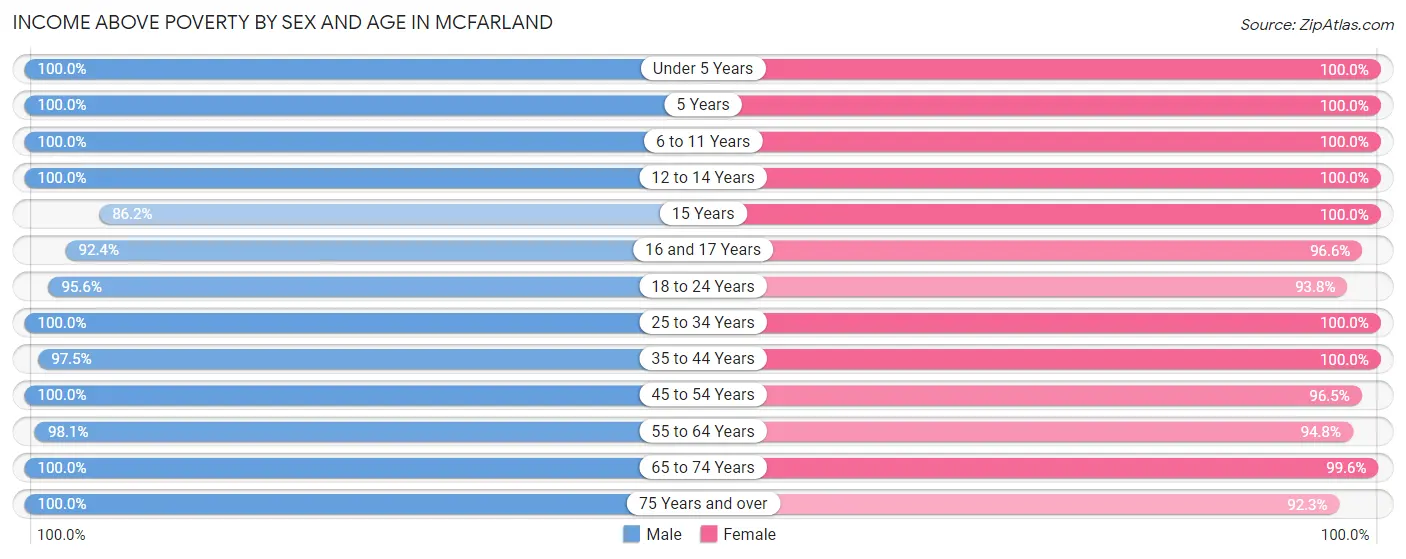
| Age Bracket | Male | Female |
| Under 5 Years | 195 (100.0%) | 145 (100.0%) |
| 5 Years | 16 (100.0%) | 52 (100.0%) |
| 6 to 11 Years | 361 (100.0%) | 496 (100.0%) |
| 12 to 14 Years | 271 (100.0%) | 196 (100.0%) |
| 15 Years | 56 (86.2%) | 94 (100.0%) |
| 16 and 17 Years | 97 (92.4%) | 255 (96.6%) |
| 18 to 24 Years | 172 (95.6%) | 576 (93.8%) |
| 25 to 34 Years | 373 (100.0%) | 505 (100.0%) |
| 35 to 44 Years | 689 (97.5%) | 792 (100.0%) |
| 45 to 54 Years | 500 (100.0%) | 626 (96.5%) |
| 55 to 64 Years | 555 (98.1%) | 515 (94.8%) |
| 65 to 74 Years | 329 (100.0%) | 464 (99.6%) |
| 75 Years and over | 211 (100.0%) | 361 (92.3%) |
| Total | 3,825 (98.6%) | 5,077 (97.5%) |
Income Below Poverty Among Married-Couple Families in Mcfarland
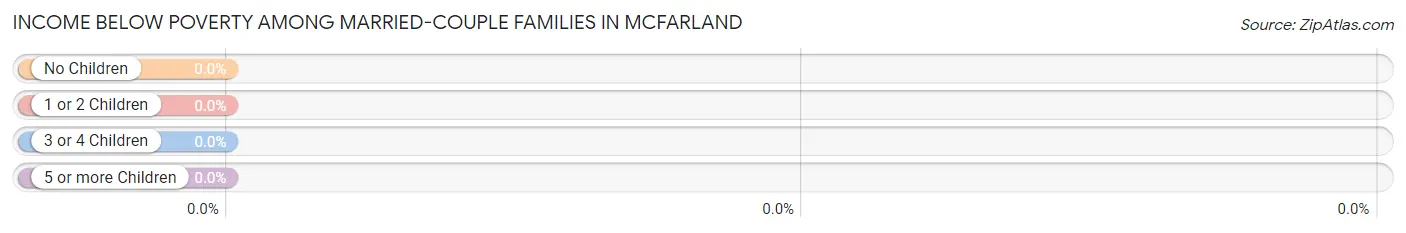
| Children | Above Poverty | Below Poverty |
| No Children | 959 (100.0%) | 0 (0.0%) |
| 1 or 2 Children | 650 (100.0%) | 0 (0.0%) |
| 3 or 4 Children | 181 (100.0%) | 0 (0.0%) |
| 5 or more Children | 0 (0.0%) | 0 (0.0%) |
| Total | 1,790 (100.0%) | 0 (0.0%) |
Income Below Poverty Among Single-Parent Households in Mcfarland
According to the poverty data in Mcfarland, 3.2% or 8 single-father households and 2.5% or 15 single-mother households are living below the poverty line. Among single-father households, those with 1 or 2 children have the highest poverty rate, with 8 households (7.8%) experiencing poverty. Likewise, among single-mother households, those with no children have the highest poverty rate, with 6 households (4.4%) falling below the poverty line.
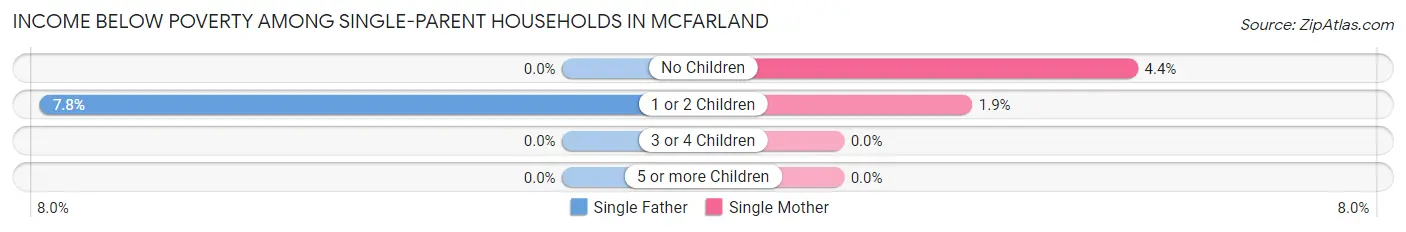
| Children | Single Father | Single Mother |
| No Children | 0 (0.0%) | 6 (4.4%) |
| 1 or 2 Children | 8 (7.8%) | 9 (1.9%) |
| 3 or 4 Children | 0 (0.0%) | 0 (0.0%) |
| 5 or more Children | 0 (0.0%) | 0 (0.0%) |
| Total | 8 (3.2%) | 15 (2.5%) |
Income Below Poverty Among Married-Couple vs Single-Parent Households in Mcfarland
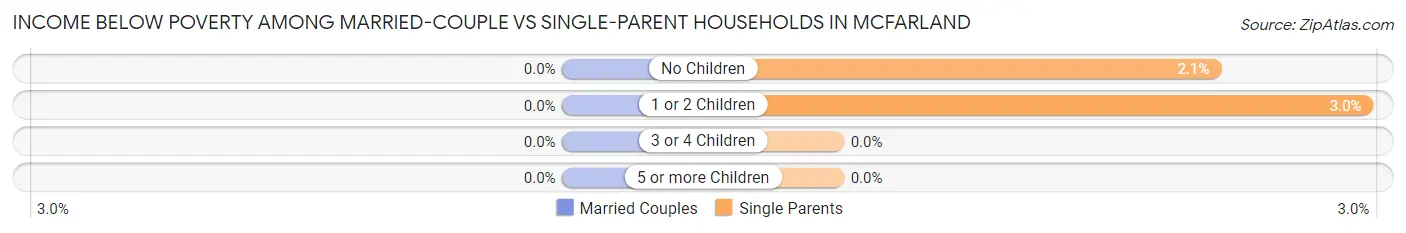
| Children | Married-Couple Families | Single-Parent Households |
| No Children | 0 (0.0%) | 6 (2.1%) |
| 1 or 2 Children | 0 (0.0%) | 17 (3.0%) |
| 3 or 4 Children | 0 (0.0%) | 0 (0.0%) |
| 5 or more Children | 0 (0.0%) | 0 (0.0%) |
| Total | 0 (0.0%) | 23 (2.7%) |
Race in Mcfarland
The most populous races in Mcfarland are White / Caucasian (8,494 | 93.3%), Two or more Races (392 | 4.3%), and Hispanic or Latino (191 | 2.1%).
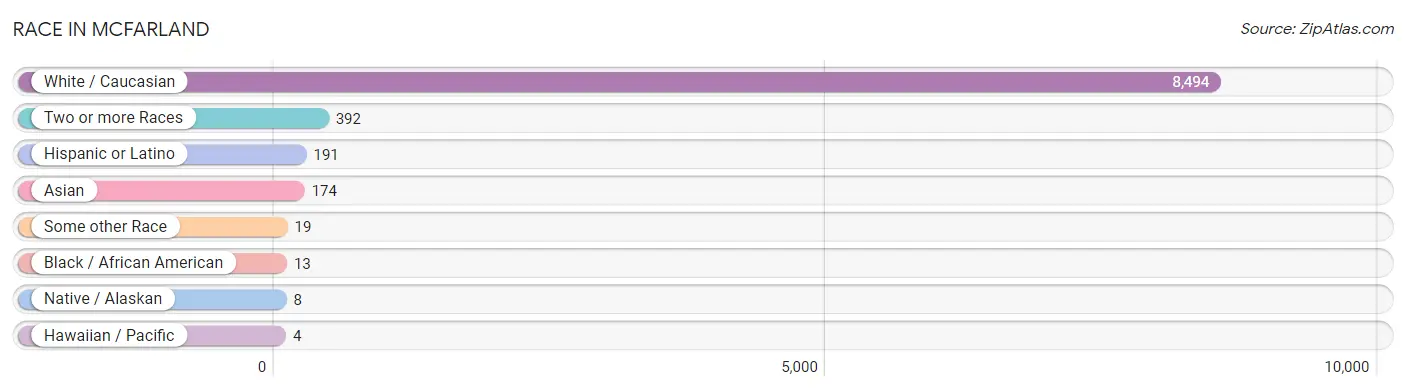
| Race | # Population | % Population |
| Asian | 174 | 1.9% |
| Black / African American | 13 | 0.1% |
| Hawaiian / Pacific | 4 | 0.0% |
| Hispanic or Latino | 191 | 2.1% |
| Native / Alaskan | 8 | 0.1% |
| White / Caucasian | 8,494 | 93.3% |
| Two or more Races | 392 | 4.3% |
| Some other Race | 19 | 0.2% |
| Total | 9,104 | 100.0% |
Ancestry in Mcfarland
The most populous ancestries reported in Mcfarland are German (3,689 | 40.5%), English (1,406 | 15.4%), Irish (1,283 | 14.1%), Norwegian (1,002 | 11.0%), and Polish (652 | 7.2%), together accounting for 88.2% of all Mcfarland residents.
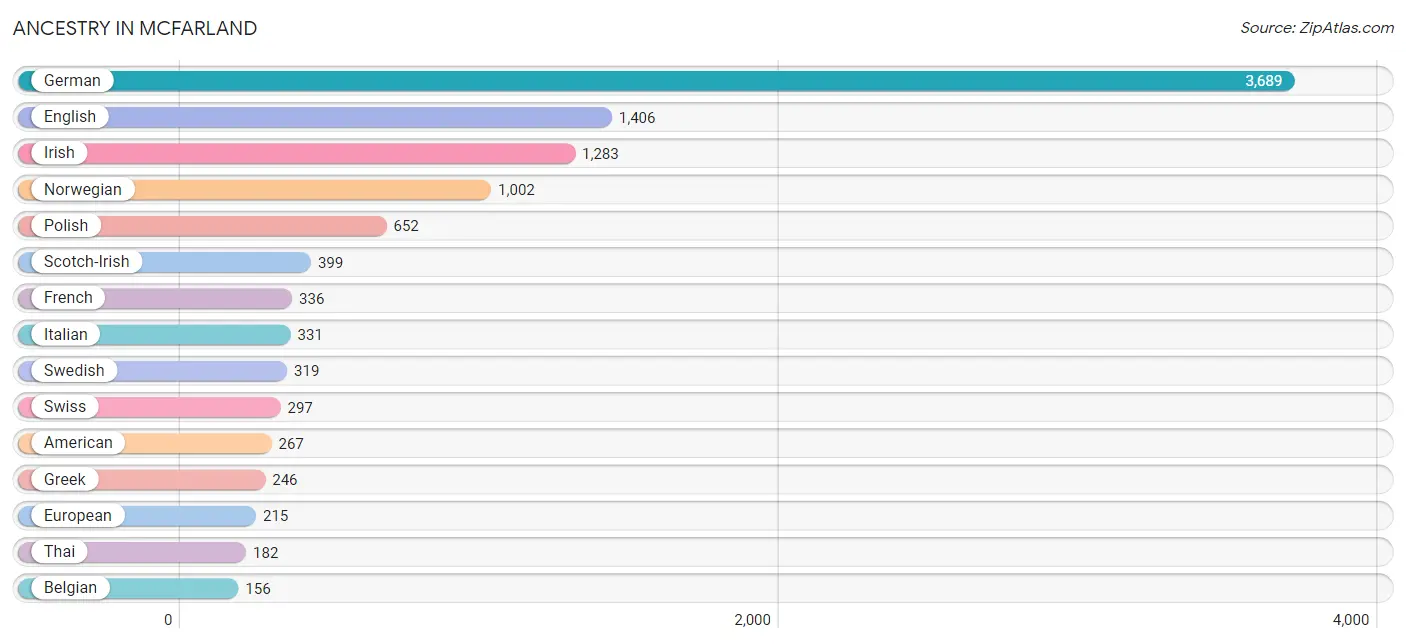
| Ancestry | # Population | % Population |
| American | 267 | 2.9% |
| Arab | 33 | 0.4% |
| Austrian | 16 | 0.2% |
| Belgian | 156 | 1.7% |
| British | 29 | 0.3% |
| Cherokee | 11 | 0.1% |
| Cuban | 27 | 0.3% |
| Czech | 17 | 0.2% |
| Danish | 124 | 1.4% |
| Dutch | 95 | 1.0% |
| Eastern European | 16 | 0.2% |
| English | 1,406 | 15.4% |
| European | 215 | 2.4% |
| French | 336 | 3.7% |
| French Canadian | 111 | 1.2% |
| German | 3,689 | 40.5% |
| Greek | 246 | 2.7% |
| Hungarian | 45 | 0.5% |
| Indian (Asian) | 39 | 0.4% |
| Inupiat | 23 | 0.3% |
| Iranian | 23 | 0.3% |
| Iraqi | 33 | 0.4% |
| Irish | 1,283 | 14.1% |
| Italian | 331 | 3.6% |
| Korean | 17 | 0.2% |
| Latvian | 12 | 0.1% |
| Mexican | 140 | 1.5% |
| Northern European | 42 | 0.5% |
| Norwegian | 1,002 | 11.0% |
| Polish | 652 | 7.2% |
| Puerto Rican | 24 | 0.3% |
| Russian | 74 | 0.8% |
| Scandinavian | 137 | 1.5% |
| Scotch-Irish | 399 | 4.4% |
| Scottish | 63 | 0.7% |
| Slovene | 52 | 0.6% |
| Swedish | 319 | 3.5% |
| Swiss | 297 | 3.3% |
| Thai | 182 | 2.0% |
| Ukrainian | 56 | 0.6% |
| Welsh | 67 | 0.7% | View All 41 Rows |
Immigrants in Mcfarland
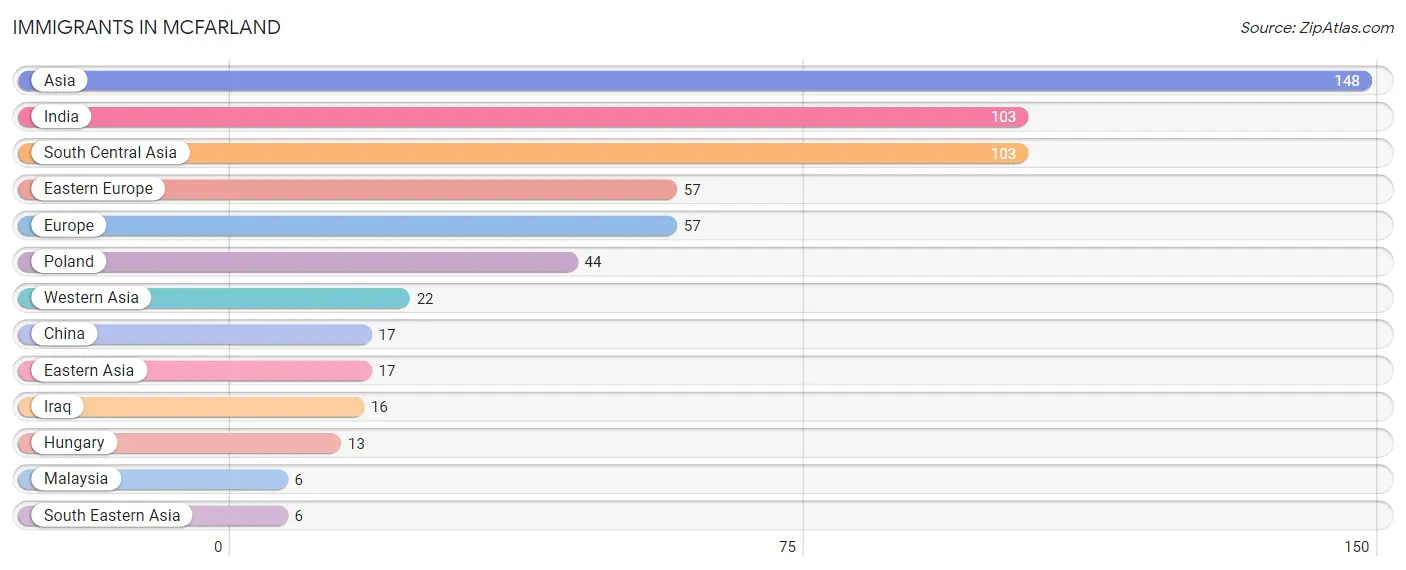
The most numerous immigrant groups reported in Mcfarland came from Asia (148 | 1.6%), India (103 | 1.1%), South Central Asia (103 | 1.1%), Eastern Europe (57 | 0.6%), and Europe (57 | 0.6%), together accounting for 5.1% of all Mcfarland residents.
| Immigration Origin | # Population | % Population |
| Asia | 148 | 1.6% |
| China | 17 | 0.2% |
| Eastern Asia | 17 | 0.2% |
| Eastern Europe | 57 | 0.6% |
| Europe | 57 | 0.6% |
| Hungary | 13 | 0.1% |
| India | 103 | 1.1% |
| Iraq | 16 | 0.2% |
| Malaysia | 6 | 0.1% |
| Poland | 44 | 0.5% |
| South Central Asia | 103 | 1.1% |
| South Eastern Asia | 6 | 0.1% |
| Western Asia | 22 | 0.2% | View All 13 Rows |
Sex and Age in Mcfarland
Sex and Age in Mcfarland
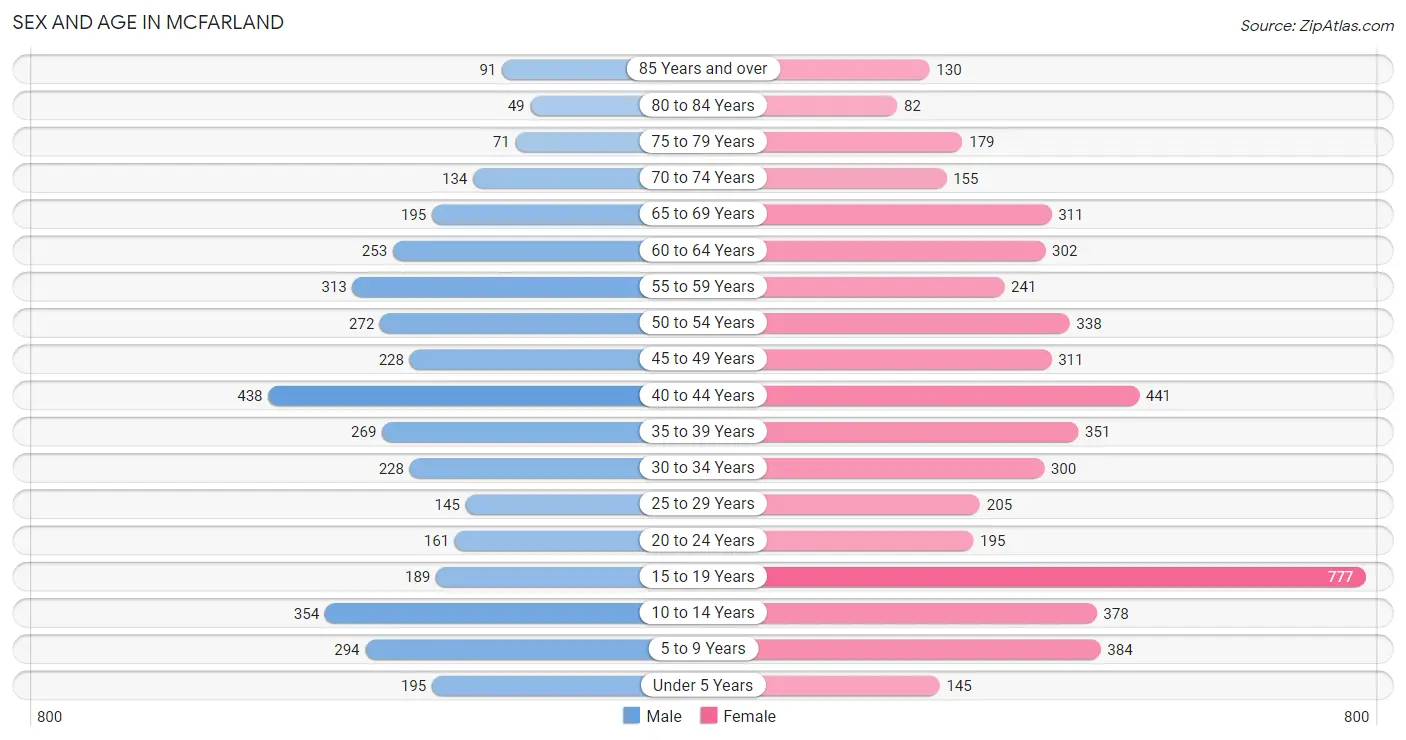
The most populous age groups in Mcfarland are 40 to 44 Years (438 | 11.3%) for men and 15 to 19 Years (777 | 14.9%) for women.
| Age Bracket | Male | Female |
| Under 5 Years | 195 (5.0%) | 145 (2.8%) |
| 5 to 9 Years | 294 (7.6%) | 384 (7.3%) |
| 10 to 14 Years | 354 (9.1%) | 378 (7.2%) |
| 15 to 19 Years | 189 (4.9%) | 777 (14.9%) |
| 20 to 24 Years | 161 (4.2%) | 195 (3.7%) |
| 25 to 29 Years | 145 (3.7%) | 205 (3.9%) |
| 30 to 34 Years | 228 (5.9%) | 300 (5.7%) |
| 35 to 39 Years | 269 (6.9%) | 351 (6.7%) |
| 40 to 44 Years | 438 (11.3%) | 441 (8.4%) |
| 45 to 49 Years | 228 (5.9%) | 311 (5.9%) |
| 50 to 54 Years | 272 (7.0%) | 338 (6.5%) |
| 55 to 59 Years | 313 (8.1%) | 241 (4.6%) |
| 60 to 64 Years | 253 (6.5%) | 302 (5.8%) |
| 65 to 69 Years | 195 (5.0%) | 311 (5.9%) |
| 70 to 74 Years | 134 (3.5%) | 155 (3.0%) |
| 75 to 79 Years | 71 (1.8%) | 179 (3.4%) |
| 80 to 84 Years | 49 (1.3%) | 82 (1.6%) |
| 85 Years and over | 91 (2.4%) | 130 (2.5%) |
| Total | 3,879 (100.0%) | 5,225 (100.0%) |
Families and Households in Mcfarland
Median Family Size in Mcfarland
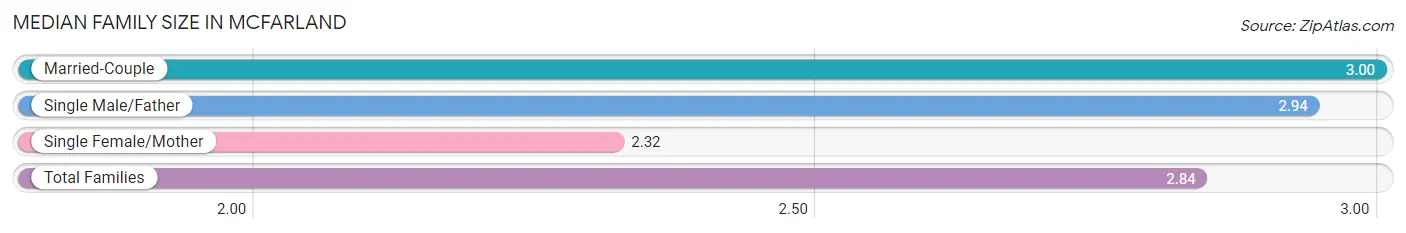
The median family size in Mcfarland is 2.84 persons per family, with married-couple families (1,790 | 67.5%) accounting for the largest median family size of 3 persons per family. On the other hand, single female/mother families (609 | 23.0%) represent the smallest median family size with 2.32 persons per family.
| Family Type | # Families | Family Size |
| Married-Couple | 1,790 (67.5%) | 3.00 |
| Single Male/Father | 251 (9.5%) | 2.94 |
| Single Female/Mother | 609 (23.0%) | 2.32 |
| Total Families | 2,650 (100.0%) | 2.84 |
Median Household Size in Mcfarland
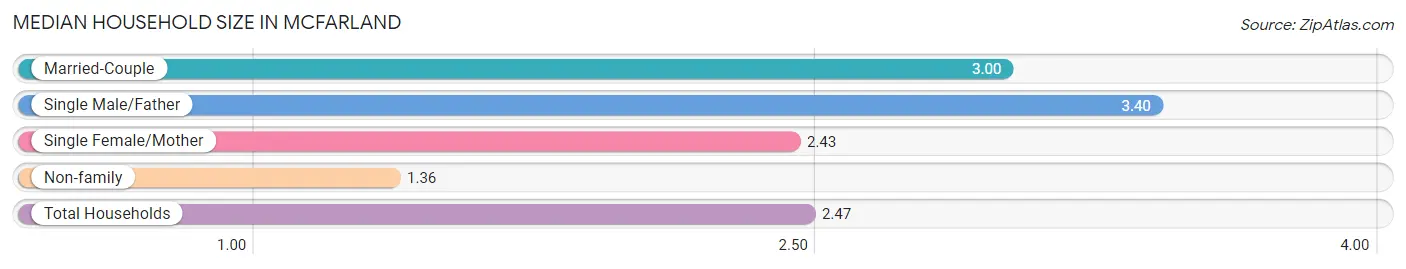
The median household size in Mcfarland is 2.47 persons per household, with single male/father households (251 | 6.8%) accounting for the largest median household size of 3.4 persons per household. non-family households (1,022 | 27.8%) represent the smallest median household size with 1.36 persons per household.
| Household Type | # Households | Household Size |
| Married-Couple | 1,790 (48.7%) | 3.00 |
| Single Male/Father | 251 (6.8%) | 3.40 |
| Single Female/Mother | 609 (16.6%) | 2.43 |
| Non-family | 1,022 (27.8%) | 1.36 |
| Total Households | 3,672 (100.0%) | 2.47 |
Household Size by Marriage Status in Mcfarland
Out of a total of 3,672 households in Mcfarland, 2,650 (72.2%) are family households, while 1,022 (27.8%) are nonfamily households. The most numerous type of family households are 2-person households, comprising 1,213, and the most common type of nonfamily households are 1-person households, comprising 773.
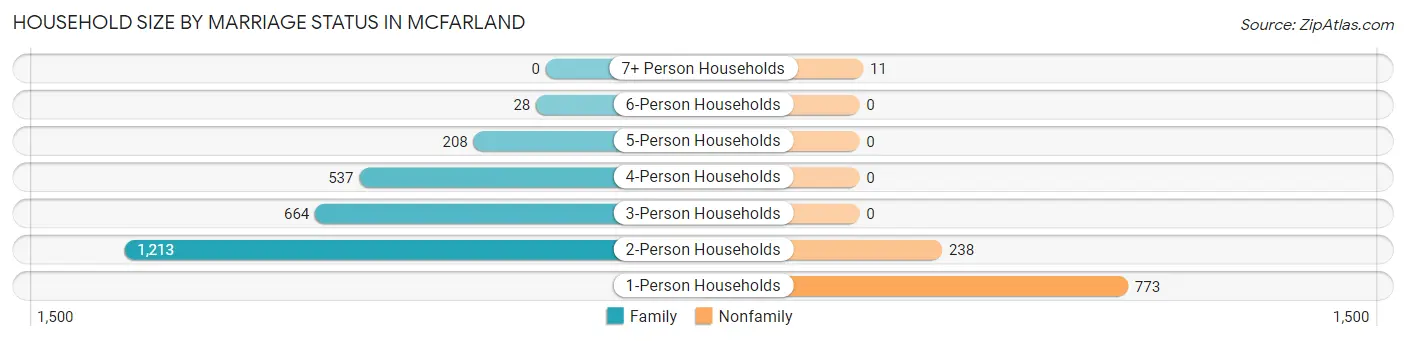
| Household Size | Family Households | Nonfamily Households |
| 1-Person Households | - | 773 (21.0%) |
| 2-Person Households | 1,213 (33.0%) | 238 (6.5%) |
| 3-Person Households | 664 (18.1%) | 0 (0.0%) |
| 4-Person Households | 537 (14.6%) | 0 (0.0%) |
| 5-Person Households | 208 (5.7%) | 0 (0.0%) |
| 6-Person Households | 28 (0.8%) | 0 (0.0%) |
| 7+ Person Households | 0 (0.0%) | 11 (0.3%) |
| Total | 2,650 (72.2%) | 1,022 (27.8%) |
Female Fertility in Mcfarland
Fertility by Age in Mcfarland
Average fertility rate in Mcfarland is 14.0 births per 1,000 women. Women in the age bracket of 20 to 34 years have the highest fertility rate with 53.0 births per 1,000 women. Women in the age bracket of 20 to 34 years acount for 100.0% of all women with births.
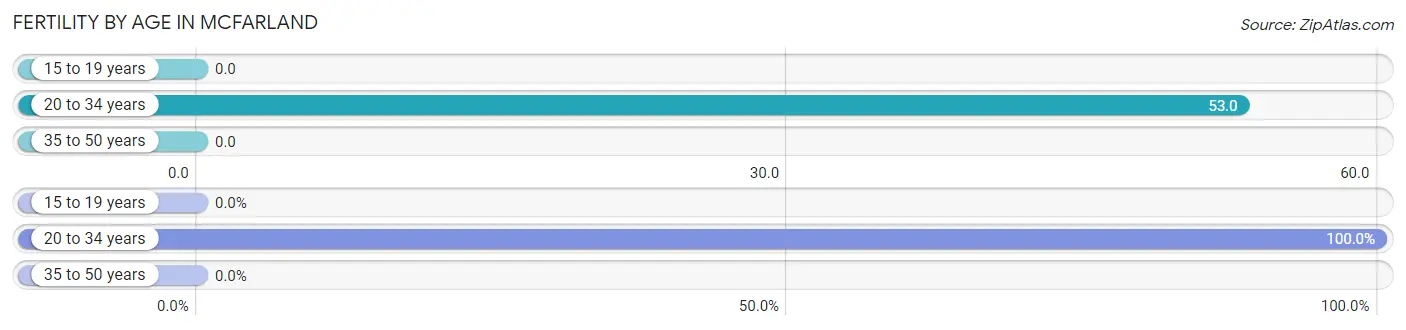
| Age Bracket | Women with Births | Births / 1,000 Women |
| 15 to 19 years | 0 (0.0%) | 0.0 |
| 20 to 34 years | 37 (100.0%) | 53.0 |
| 35 to 50 years | 0 (0.0%) | 0.0 |
| Total | 37 (100.0%) | 14.0 |
Fertility by Age by Marriage Status in Mcfarland
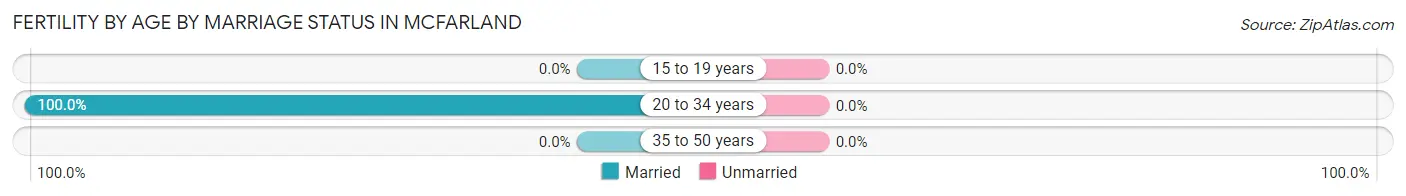
| Age Bracket | Married | Unmarried |
| 15 to 19 years | 0 (0.0%) | 0 (0.0%) |
| 20 to 34 years | 37 (100.0%) | 0 (0.0%) |
| 35 to 50 years | 0 (0.0%) | 0 (0.0%) |
| Total | 37 (100.0%) | 0 (0.0%) |
Fertility by Education in Mcfarland
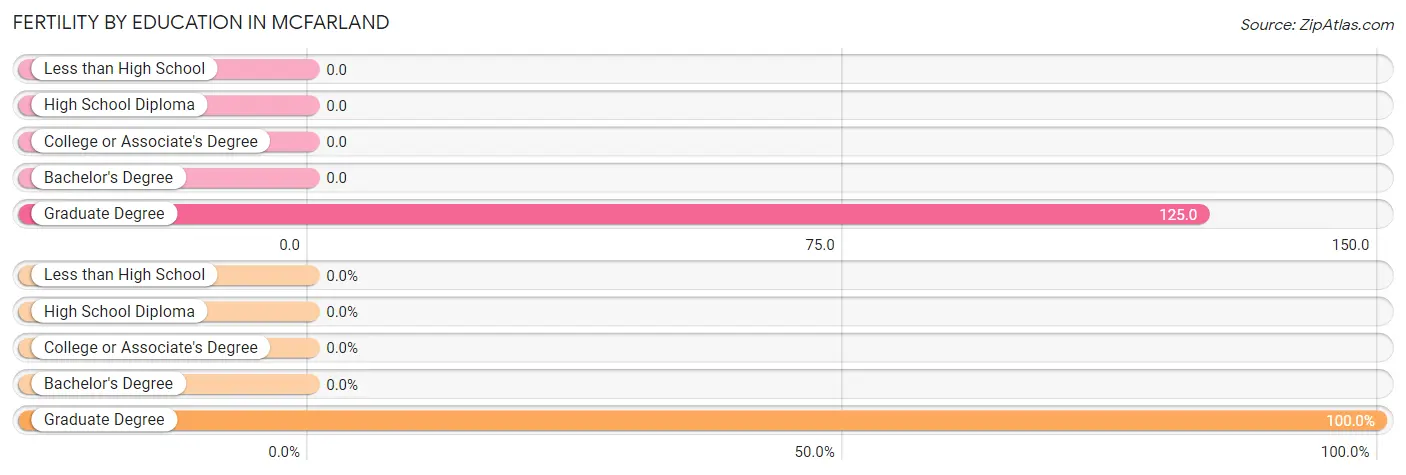
| Educational Attainment | Women with Births | Births / 1,000 Women |
| Less than High School | 0 (0.0%) | 0.0 |
| High School Diploma | 0 (0.0%) | 0.0 |
| College or Associate's Degree | 0 (0.0%) | 0.0 |
| Bachelor's Degree | 0 (0.0%) | 0.0 |
| Graduate Degree | 37 (100.0%) | 125.0 |
| Total | 37 (100.0%) | 14.0 |
Fertility by Education by Marriage Status in Mcfarland
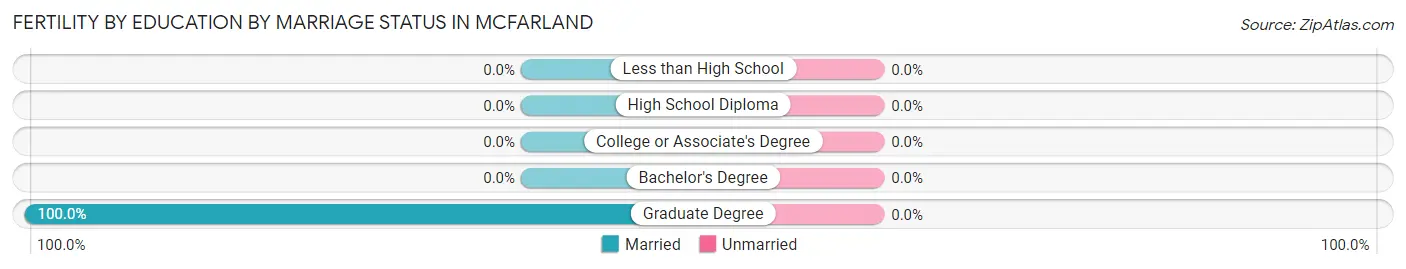
| Educational Attainment | Married | Unmarried |
| Less than High School | 0 (0.0%) | 0 (0.0%) |
| High School Diploma | 0 (0.0%) | 0 (0.0%) |
| College or Associate's Degree | 0 (0.0%) | 0 (0.0%) |
| Bachelor's Degree | 0 (0.0%) | 0 (0.0%) |
| Graduate Degree | 37 (100.0%) | 0 (0.0%) |
| Total | 37 (100.0%) | 0 (0.0%) |
Employment Characteristics in Mcfarland
Employment by Class of Employer in Mcfarland
Among the 5,068 employed individuals in Mcfarland, private company employees (3,187 | 62.9%), not-for-profit organizations (659 | 13.0%), and state government employees (406 | 8.0%) make up the most common classes of employment.
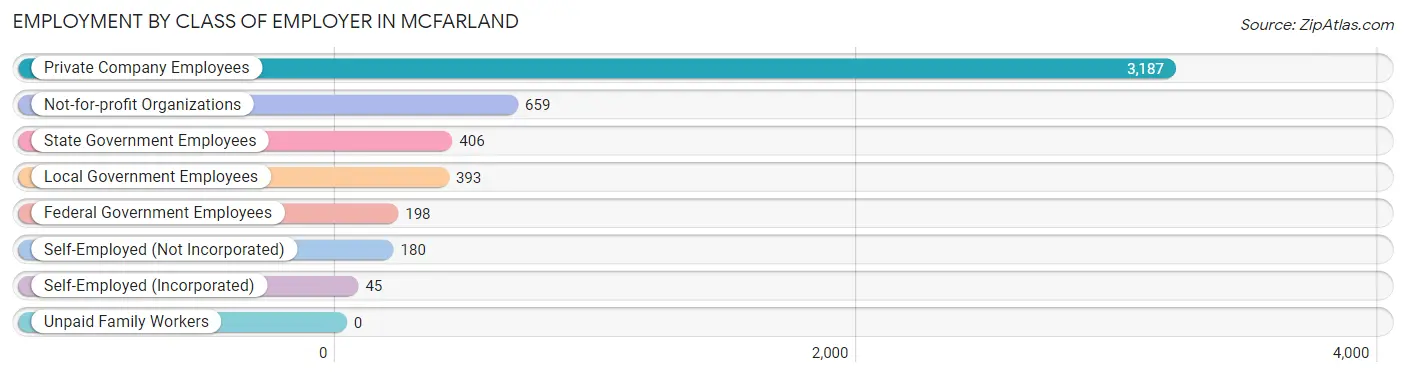
| Employer Class | # Employees | % Employees |
| Private Company Employees | 3,187 | 62.9% |
| Self-Employed (Incorporated) | 45 | 0.9% |
| Self-Employed (Not Incorporated) | 180 | 3.5% |
| Not-for-profit Organizations | 659 | 13.0% |
| Local Government Employees | 393 | 7.7% |
| State Government Employees | 406 | 8.0% |
| Federal Government Employees | 198 | 3.9% |
| Unpaid Family Workers | 0 | 0.0% |
| Total | 5,068 | 100.0% |
Employment Status by Age in Mcfarland
According to the labor force statistics for Mcfarland, out of the total population over 16 years of age (7,195), 74.2% or 5,339 individuals are in the labor force, with 4.0% or 214 of them unemployed. The age group with the highest labor force participation rate is 30 to 34 years, with 100.0% or 528 individuals in the labor force. Within the labor force, the 16 to 19 years age range has the highest percentage of unemployed individuals, with 20.0% or 119 of them being unemployed.
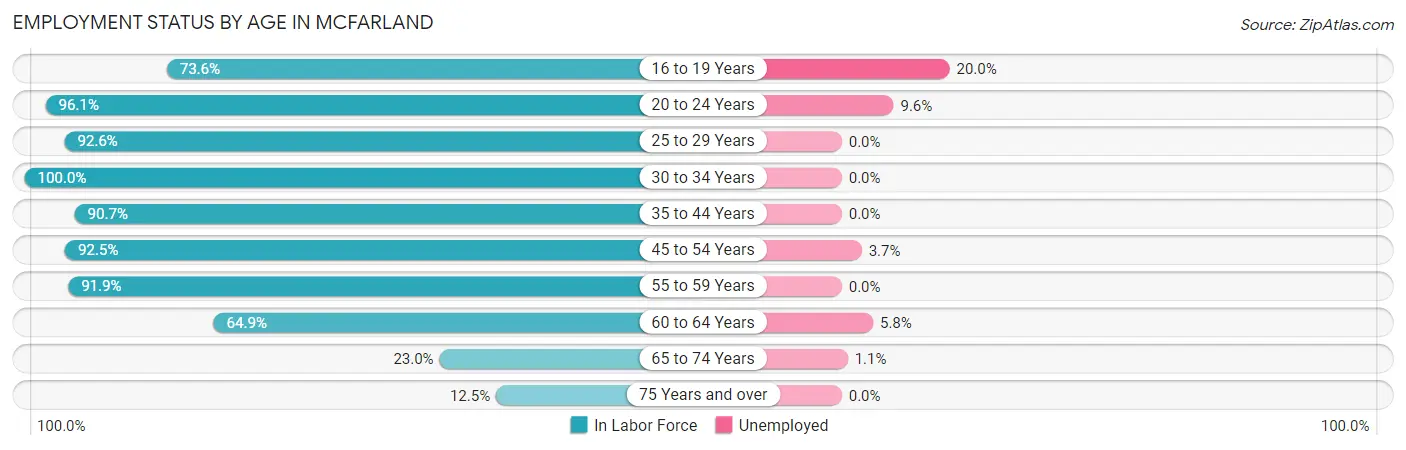
| Age Bracket | In Labor Force | Unemployed |
| 16 to 19 Years | 594 (73.6%) | 119 (20.0%) |
| 20 to 24 Years | 342 (96.1%) | 33 (9.6%) |
| 25 to 29 Years | 324 (92.6%) | 0 (0.0%) |
| 30 to 34 Years | 528 (100.0%) | 0 (0.0%) |
| 35 to 44 Years | 1,360 (90.7%) | 0 (0.0%) |
| 45 to 54 Years | 1,063 (92.5%) | 39 (3.7%) |
| 55 to 59 Years | 509 (91.9%) | 0 (0.0%) |
| 60 to 64 Years | 360 (64.9%) | 21 (5.8%) |
| 65 to 74 Years | 183 (23.0%) | 2 (1.1%) |
| 75 Years and over | 75 (12.5%) | 0 (0.0%) |
| Total | 5,339 (74.2%) | 214 (4.0%) |
Employment Status by Educational Attainment in Mcfarland
According to labor force statistics for Mcfarland, 89.4% of individuals (4,144) out of the total population between 25 and 64 years of age (4,635) are in the labor force, with 1.4% or 58 of them being unemployed. The group with the highest labor force participation rate are those with the educational attainment of bachelor's degree or higher, with 92.6% or 2,315 individuals in the labor force. Within the labor force, individuals with high school diploma education have the highest percentage of unemployment, with 5.7% or 32 of them being unemployed.
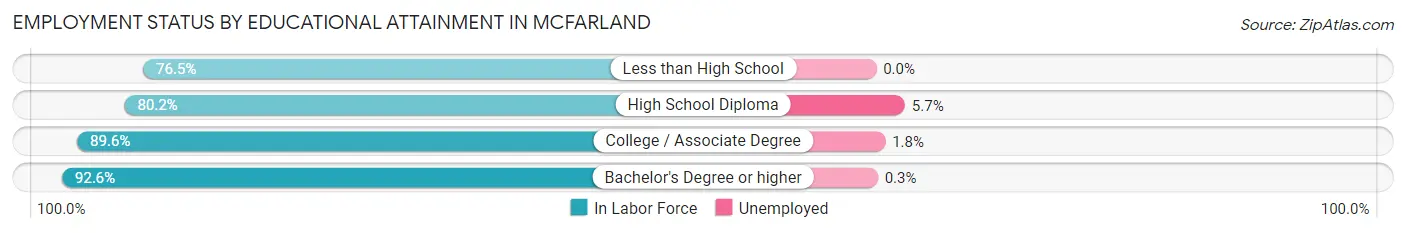
| Educational Attainment | In Labor Force | Unemployed |
| Less than High School | 101 (76.5%) | 0 (0.0%) |
| High School Diploma | 559 (80.2%) | 40 (5.7%) |
| College / Associate Degree | 1,170 (89.6%) | 24 (1.8%) |
| Bachelor's Degree or higher | 2,315 (92.6%) | 8 (0.3%) |
| Total | 4,144 (89.4%) | 65 (1.4%) |
Employment Occupations by Sex in Mcfarland
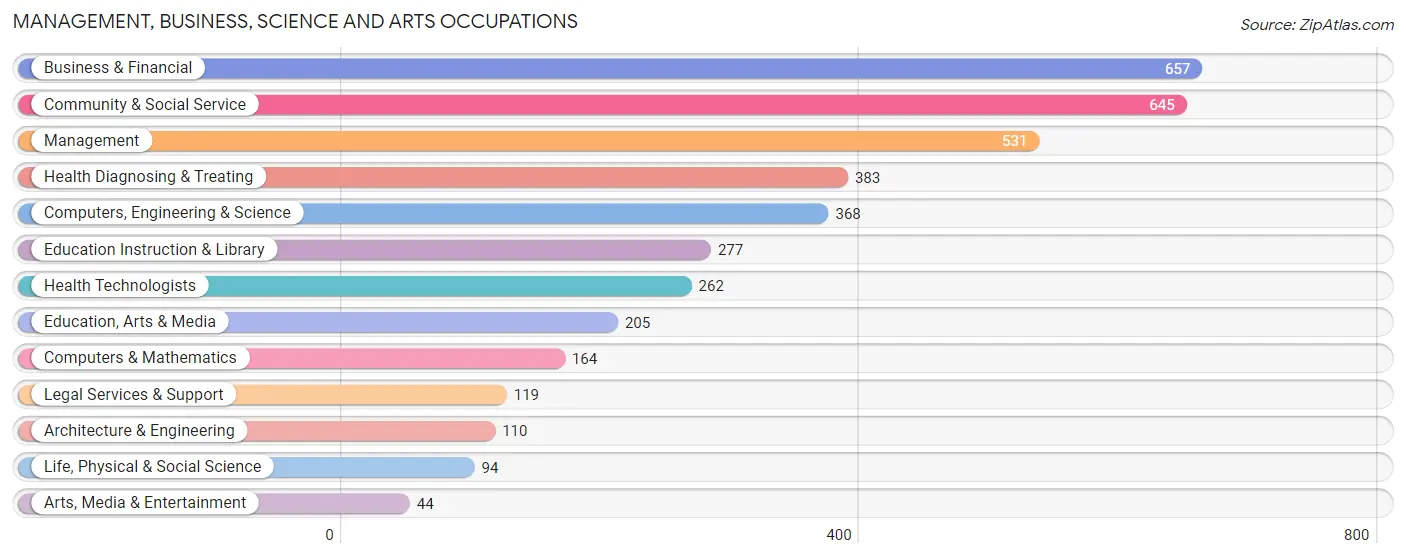
Management, Business, Science and Arts Occupations
The most common Management, Business, Science and Arts occupations in Mcfarland are Business & Financial (657 | 12.8%), Community & Social Service (645 | 12.6%), Management (531 | 10.4%), Health Diagnosing & Treating (383 | 7.5%), and Computers, Engineering & Science (368 | 7.2%).
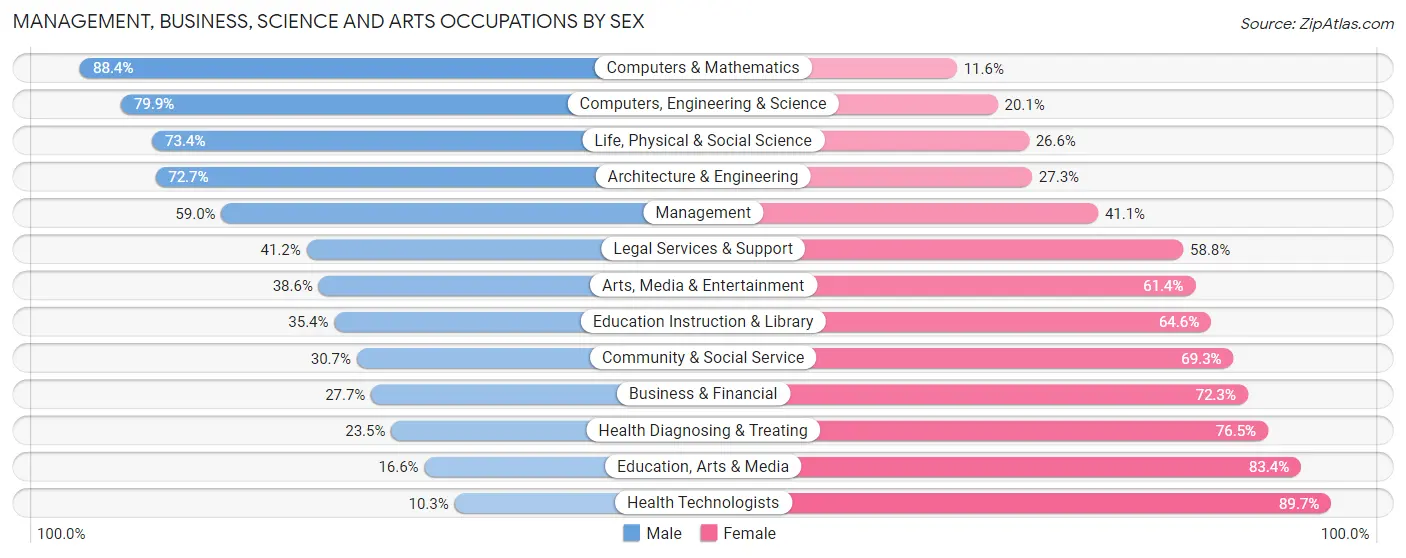
Management, Business, Science and Arts Occupations by Sex
Within the Management, Business, Science and Arts occupations in Mcfarland, the most male-oriented occupations are Computers & Mathematics (88.4%), Computers, Engineering & Science (79.9%), and Life, Physical & Social Science (73.4%), while the most female-oriented occupations are Health Technologists (89.7%), Education, Arts & Media (83.4%), and Health Diagnosing & Treating (76.5%).
| Occupation | Male | Female |
| Management | 313 (59.0%) | 218 (41.0%) |
| Business & Financial | 182 (27.7%) | 475 (72.3%) |
| Computers, Engineering & Science | 294 (79.9%) | 74 (20.1%) |
| Computers & Mathematics | 145 (88.4%) | 19 (11.6%) |
| Architecture & Engineering | 80 (72.7%) | 30 (27.3%) |
| Life, Physical & Social Science | 69 (73.4%) | 25 (26.6%) |
| Community & Social Service | 198 (30.7%) | 447 (69.3%) |
| Education, Arts & Media | 34 (16.6%) | 171 (83.4%) |
| Legal Services & Support | 49 (41.2%) | 70 (58.8%) |
| Education Instruction & Library | 98 (35.4%) | 179 (64.6%) |
| Arts, Media & Entertainment | 17 (38.6%) | 27 (61.4%) |
| Health Diagnosing & Treating | 90 (23.5%) | 293 (76.5%) |
| Health Technologists | 27 (10.3%) | 235 (89.7%) |
| Total (Category) | 1,077 (41.7%) | 1,507 (58.3%) |
| Total (Overall) | 2,240 (43.7%) | 2,884 (56.3%) |
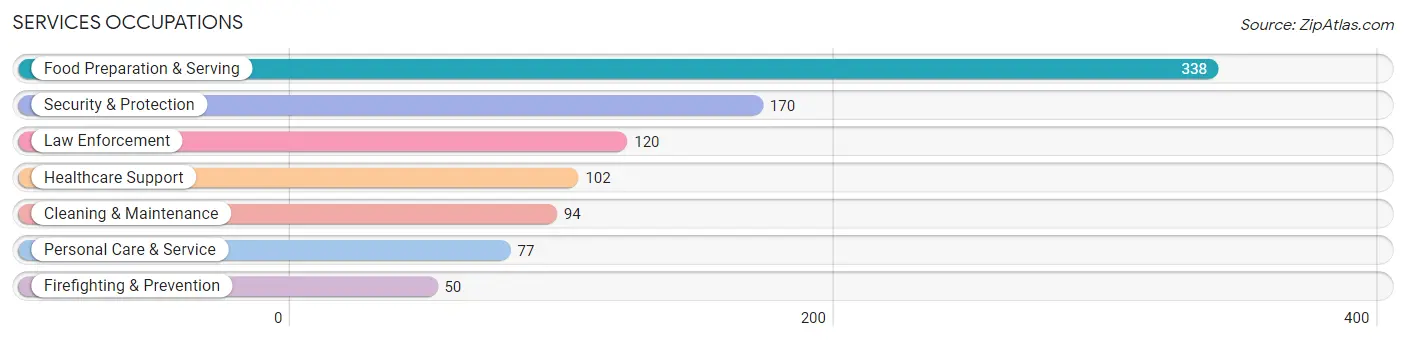
Services Occupations
The most common Services occupations in Mcfarland are Food Preparation & Serving (338 | 6.6%), Security & Protection (170 | 3.3%), Law Enforcement (120 | 2.3%), Healthcare Support (102 | 2.0%), and Cleaning & Maintenance (94 | 1.8%).
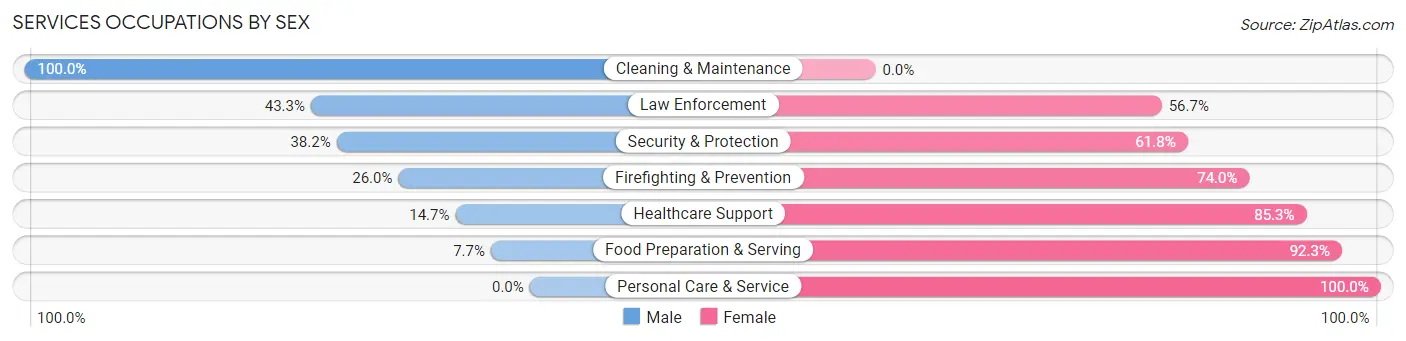
Services Occupations by Sex
Within the Services occupations in Mcfarland, the most male-oriented occupations are Cleaning & Maintenance (100.0%), Law Enforcement (43.3%), and Security & Protection (38.2%), while the most female-oriented occupations are Personal Care & Service (100.0%), Food Preparation & Serving (92.3%), and Healthcare Support (85.3%).
| Occupation | Male | Female |
| Healthcare Support | 15 (14.7%) | 87 (85.3%) |
| Security & Protection | 65 (38.2%) | 105 (61.8%) |
| Firefighting & Prevention | 13 (26.0%) | 37 (74.0%) |
| Law Enforcement | 52 (43.3%) | 68 (56.7%) |
| Food Preparation & Serving | 26 (7.7%) | 312 (92.3%) |
| Cleaning & Maintenance | 94 (100.0%) | 0 (0.0%) |
| Personal Care & Service | 0 (0.0%) | 77 (100.0%) |
| Total (Category) | 200 (25.6%) | 581 (74.4%) |
| Total (Overall) | 2,240 (43.7%) | 2,884 (56.3%) |
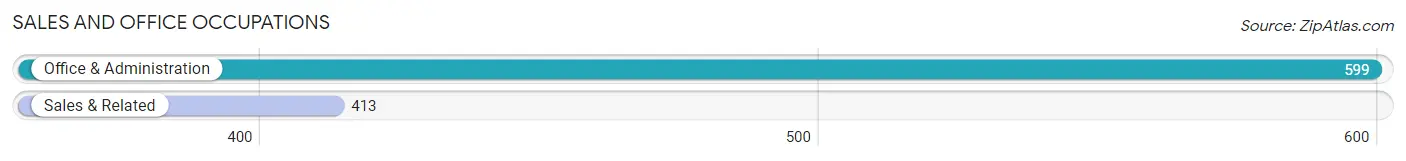
Sales and Office Occupations
The most common Sales and Office occupations in Mcfarland are Office & Administration (599 | 11.7%), and Sales & Related (413 | 8.1%).
Sales and Office Occupations by Sex
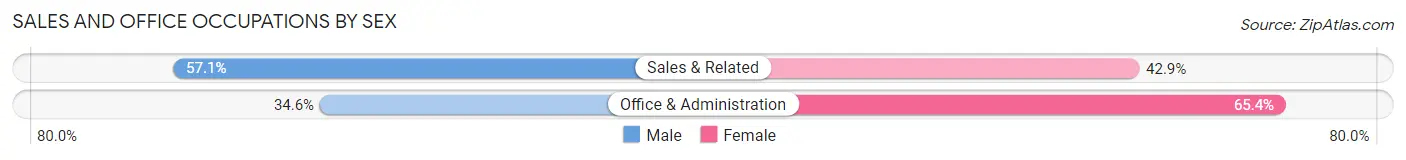
| Occupation | Male | Female |
| Sales & Related | 236 (57.1%) | 177 (42.9%) |
| Office & Administration | 207 (34.6%) | 392 (65.4%) |
| Total (Category) | 443 (43.8%) | 569 (56.2%) |
| Total (Overall) | 2,240 (43.7%) | 2,884 (56.3%) |
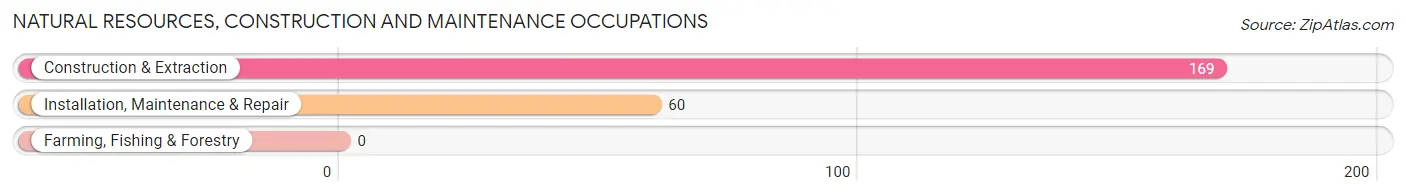
Natural Resources, Construction and Maintenance Occupations
The most common Natural Resources, Construction and Maintenance occupations in Mcfarland are Construction & Extraction (169 | 3.3%), and Installation, Maintenance & Repair (60 | 1.2%).
Natural Resources, Construction and Maintenance Occupations by Sex
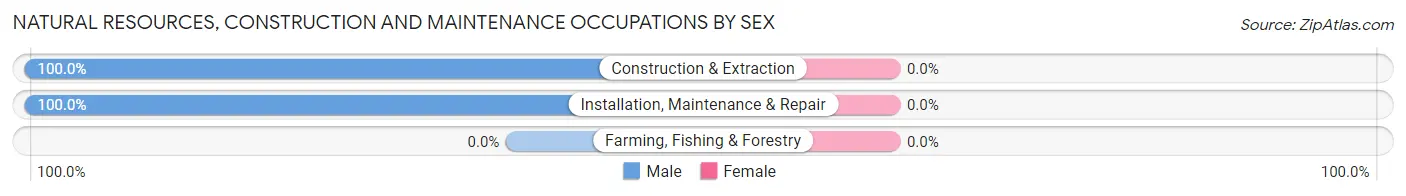
| Occupation | Male | Female |
| Farming, Fishing & Forestry | 0 (0.0%) | 0 (0.0%) |
| Construction & Extraction | 169 (100.0%) | 0 (0.0%) |
| Installation, Maintenance & Repair | 60 (100.0%) | 0 (0.0%) |
| Total (Category) | 229 (100.0%) | 0 (0.0%) |
| Total (Overall) | 2,240 (43.7%) | 2,884 (56.3%) |
Production, Transportation and Moving Occupations
The most common Production, Transportation and Moving occupations in Mcfarland are Production (228 | 4.4%), Transportation (172 | 3.4%), and Material Moving (118 | 2.3%).
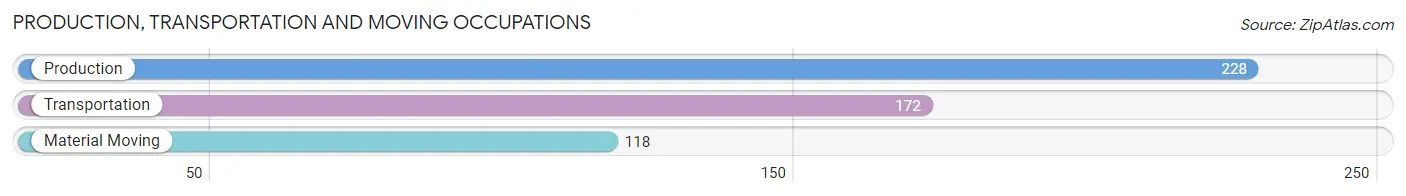
Production, Transportation and Moving Occupations by Sex
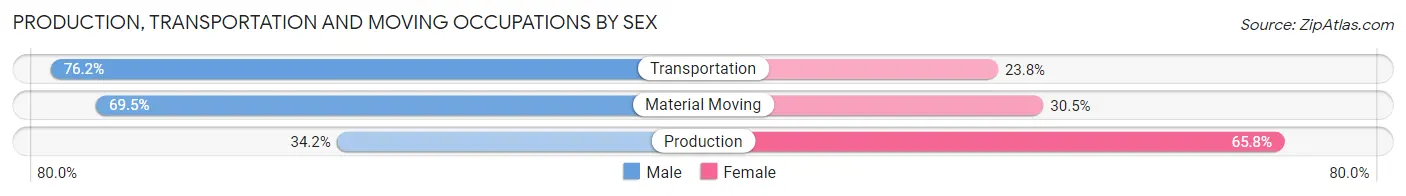
| Occupation | Male | Female |
| Production | 78 (34.2%) | 150 (65.8%) |
| Transportation | 131 (76.2%) | 41 (23.8%) |
| Material Moving | 82 (69.5%) | 36 (30.5%) |
| Total (Category) | 291 (56.2%) | 227 (43.8%) |
| Total (Overall) | 2,240 (43.7%) | 2,884 (56.3%) |
Employment Industries by Sex in Mcfarland
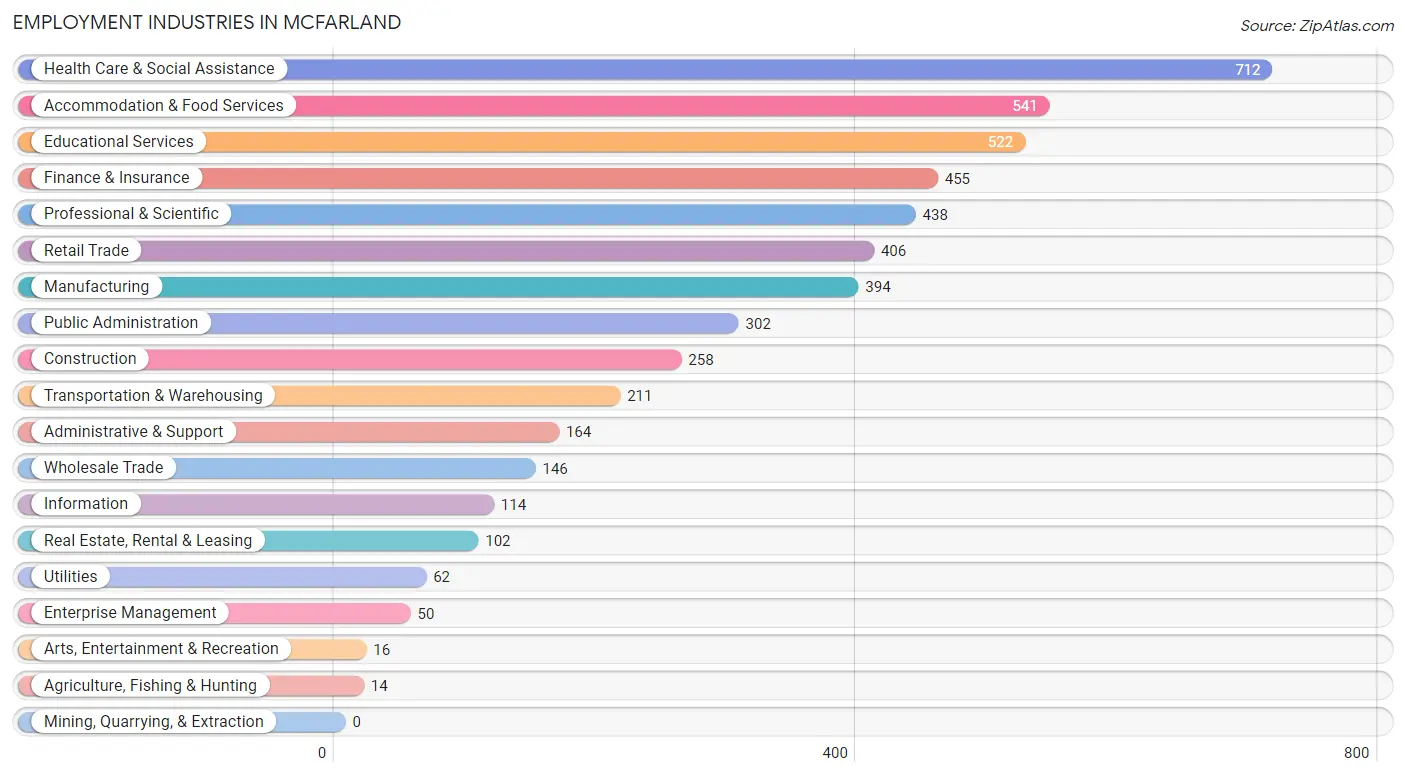
Employment Industries in Mcfarland
The major employment industries in Mcfarland include Health Care & Social Assistance (712 | 13.9%), Accommodation & Food Services (541 | 10.6%), Educational Services (522 | 10.2%), Finance & Insurance (455 | 8.9%), and Professional & Scientific (438 | 8.6%).
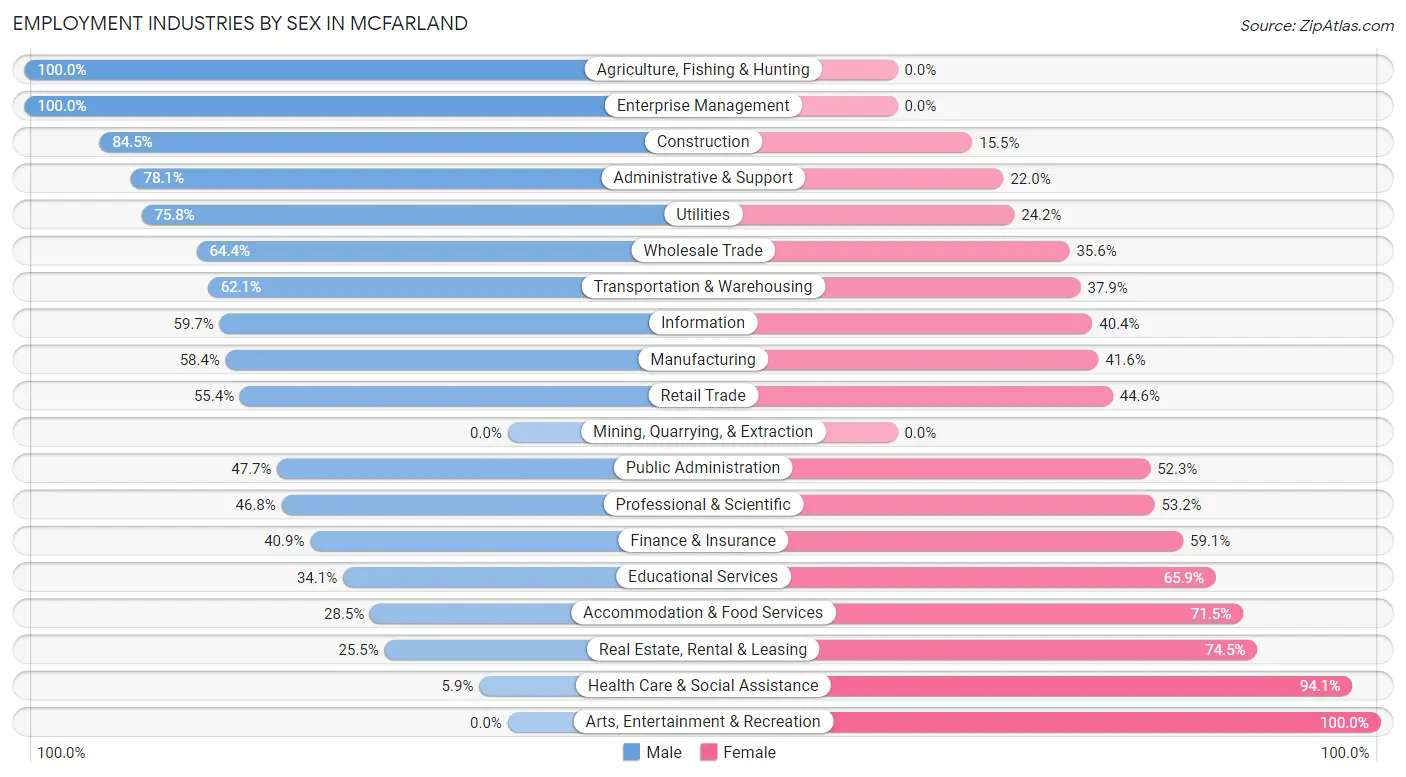
Employment Industries by Sex in Mcfarland
The Mcfarland industries that see more men than women are Agriculture, Fishing & Hunting (100.0%), Enterprise Management (100.0%), and Construction (84.5%), whereas the industries that tend to have a higher number of women are Arts, Entertainment & Recreation (100.0%), Health Care & Social Assistance (94.1%), and Real Estate, Rental & Leasing (74.5%).
| Industry | Male | Female |
| Agriculture, Fishing & Hunting | 14 (100.0%) | 0 (0.0%) |
| Mining, Quarrying, & Extraction | 0 (0.0%) | 0 (0.0%) |
| Construction | 218 (84.5%) | 40 (15.5%) |
| Manufacturing | 230 (58.4%) | 164 (41.6%) |
| Wholesale Trade | 94 (64.4%) | 52 (35.6%) |
| Retail Trade | 225 (55.4%) | 181 (44.6%) |
| Transportation & Warehousing | 131 (62.1%) | 80 (37.9%) |
| Utilities | 47 (75.8%) | 15 (24.2%) |
| Information | 68 (59.7%) | 46 (40.4%) |
| Finance & Insurance | 186 (40.9%) | 269 (59.1%) |
| Real Estate, Rental & Leasing | 26 (25.5%) | 76 (74.5%) |
| Professional & Scientific | 205 (46.8%) | 233 (53.2%) |
| Enterprise Management | 50 (100.0%) | 0 (0.0%) |
| Administrative & Support | 128 (78.0%) | 36 (22.0%) |
| Educational Services | 178 (34.1%) | 344 (65.9%) |
| Health Care & Social Assistance | 42 (5.9%) | 670 (94.1%) |
| Arts, Entertainment & Recreation | 0 (0.0%) | 16 (100.0%) |
| Accommodation & Food Services | 154 (28.5%) | 387 (71.5%) |
| Public Administration | 144 (47.7%) | 158 (52.3%) |
| Total | 2,240 (43.7%) | 2,884 (56.3%) |
Education in Mcfarland
School Enrollment in Mcfarland
The most common levels of schooling among the 2,631 students in Mcfarland are high school (954 | 36.3%), elementary school (586 | 22.3%), and middle school (583 | 22.2%).
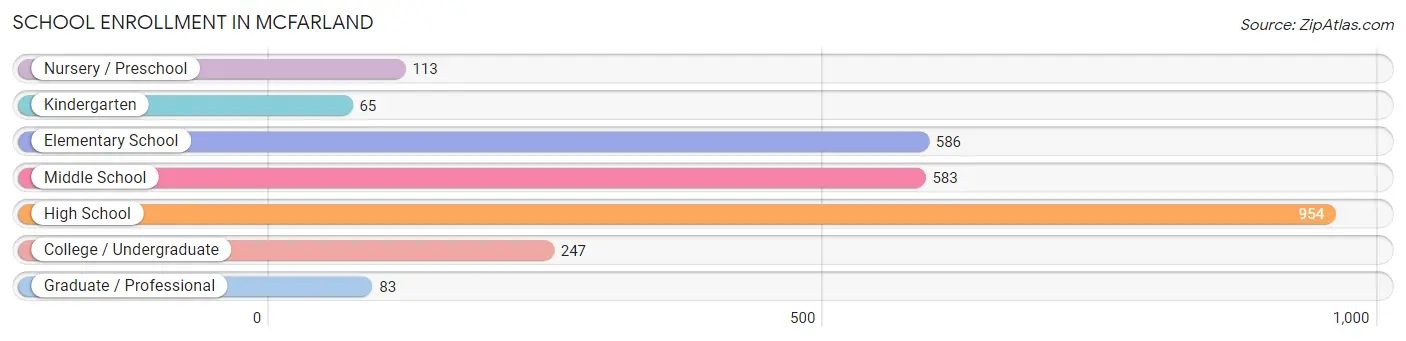
| School Level | # Students | % Students |
| Nursery / Preschool | 113 | 4.3% |
| Kindergarten | 65 | 2.5% |
| Elementary School | 586 | 22.3% |
| Middle School | 583 | 22.2% |
| High School | 954 | 36.3% |
| College / Undergraduate | 247 | 9.4% |
| Graduate / Professional | 83 | 3.2% |
| Total | 2,631 | 100.0% |
School Enrollment by Age by Funding Source in Mcfarland
Out of a total of 2,631 students who are enrolled in schools in Mcfarland, 310 (11.8%) attend a private institution, while the remaining 2,321 (88.2%) are enrolled in public schools. The age group of 3 to 4 year olds has the highest likelihood of being enrolled in private schools, with 52 (66.7% in the age bracket) enrolled. Conversely, the age group of 10 to 14 year olds has the lowest likelihood of being enrolled in a private school, with 732 (100.0% in the age bracket) attending a public institution.
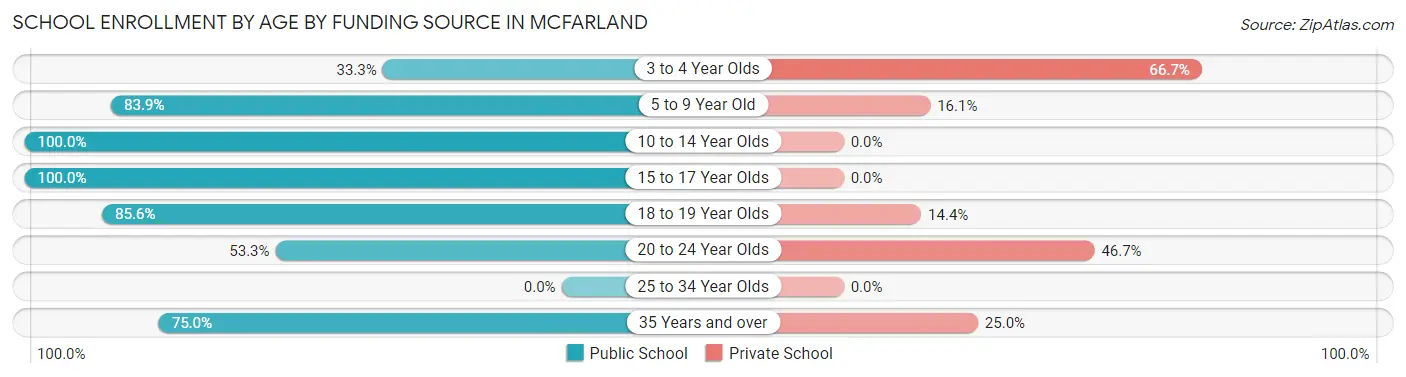
| Age Bracket | Public School | Private School |
| 3 to 4 Year Olds | 26 (33.3%) | 52 (66.7%) |
| 5 to 9 Year Old | 541 (83.9%) | 104 (16.1%) |
| 10 to 14 Year Olds | 732 (100.0%) | 0 (0.0%) |
| 15 to 17 Year Olds | 528 (100.0%) | 0 (0.0%) |
| 18 to 19 Year Olds | 332 (85.6%) | 56 (14.4%) |
| 20 to 24 Year Olds | 81 (53.3%) | 71 (46.7%) |
| 25 to 34 Year Olds | 0 (0.0%) | 0 (0.0%) |
| 35 Years and over | 81 (75.0%) | 27 (25.0%) |
| Total | 2,321 (88.2%) | 310 (11.8%) |
Educational Attainment by Field of Study in Mcfarland
Business (576 | 16.7%), education (402 | 11.7%), science & technology (386 | 11.2%), social sciences (380 | 11.0%), and bio, nature & agricultural (308 | 8.9%) are the most common fields of study among 3,441 individuals in Mcfarland who have obtained a bachelor's degree or higher.
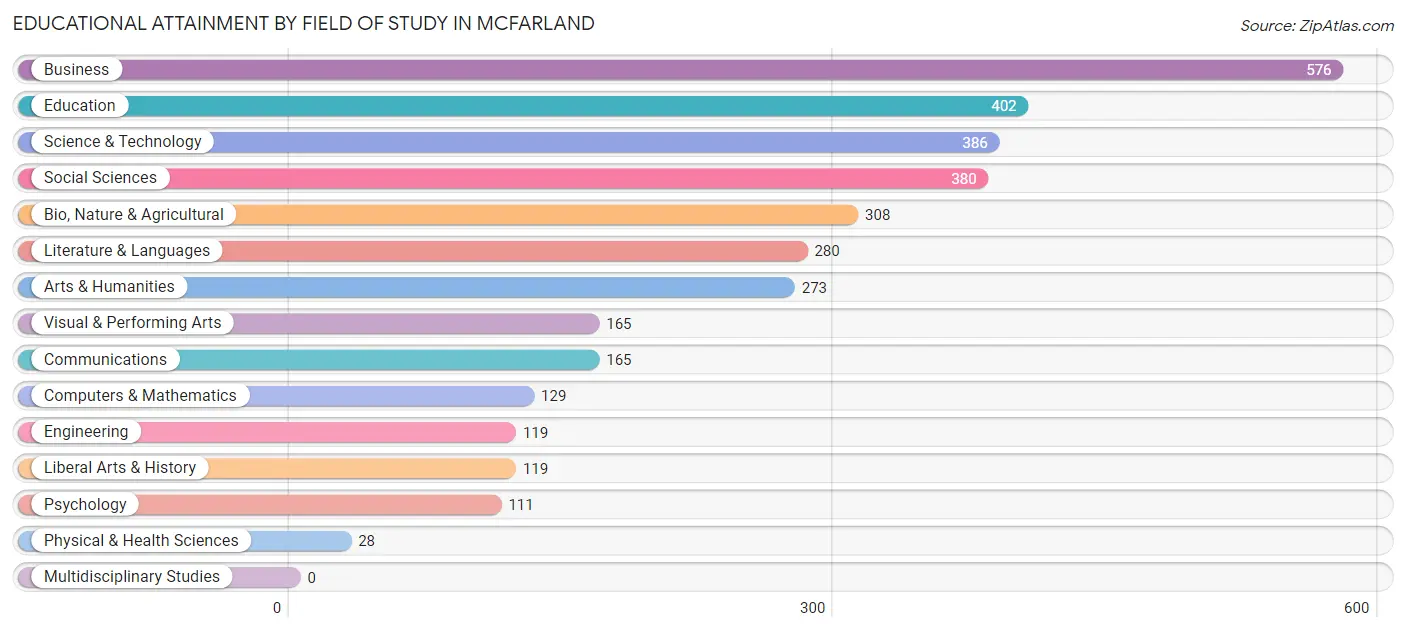
| Field of Study | # Graduates | % Graduates |
| Computers & Mathematics | 129 | 3.7% |
| Bio, Nature & Agricultural | 308 | 8.9% |
| Physical & Health Sciences | 28 | 0.8% |
| Psychology | 111 | 3.2% |
| Social Sciences | 380 | 11.0% |
| Engineering | 119 | 3.5% |
| Multidisciplinary Studies | 0 | 0.0% |
| Science & Technology | 386 | 11.2% |
| Business | 576 | 16.7% |
| Education | 402 | 11.7% |
| Literature & Languages | 280 | 8.1% |
| Liberal Arts & History | 119 | 3.5% |
| Visual & Performing Arts | 165 | 4.8% |
| Communications | 165 | 4.8% |
| Arts & Humanities | 273 | 7.9% |
| Total | 3,441 | 100.0% |
Transportation & Commute in Mcfarland
Vehicle Availability by Sex in Mcfarland
The most prevalent vehicle ownership categories in Mcfarland are males with 2 vehicles (1,200, accounting for 54.6%) and females with 2 vehicles (1,595, making up 41.8%).
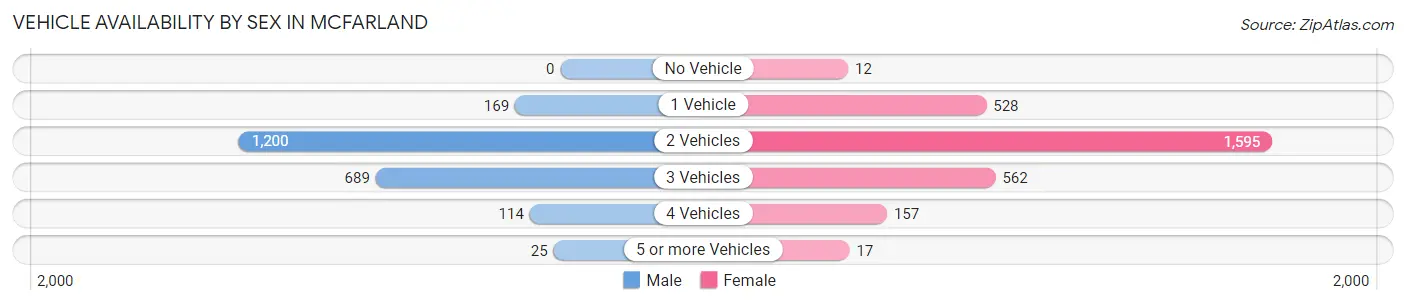
| Vehicles Available | Male | Female |
| No Vehicle | 0 (0.0%) | 12 (0.4%) |
| 1 Vehicle | 169 (7.7%) | 528 (18.4%) |
| 2 Vehicles | 1,200 (54.6%) | 1,595 (55.6%) |
| 3 Vehicles | 689 (31.4%) | 562 (19.6%) |
| 4 Vehicles | 114 (5.2%) | 157 (5.5%) |
| 5 or more Vehicles | 25 (1.1%) | 17 (0.6%) |
| Total | 2,197 (100.0%) | 2,871 (100.0%) |
Commute Time in Mcfarland
The most frequently occuring commute durations in Mcfarland are 20 to 24 minutes (893 commuters, 20.4%), 10 to 14 minutes (727 commuters, 16.6%), and 15 to 19 minutes (679 commuters, 15.5%).
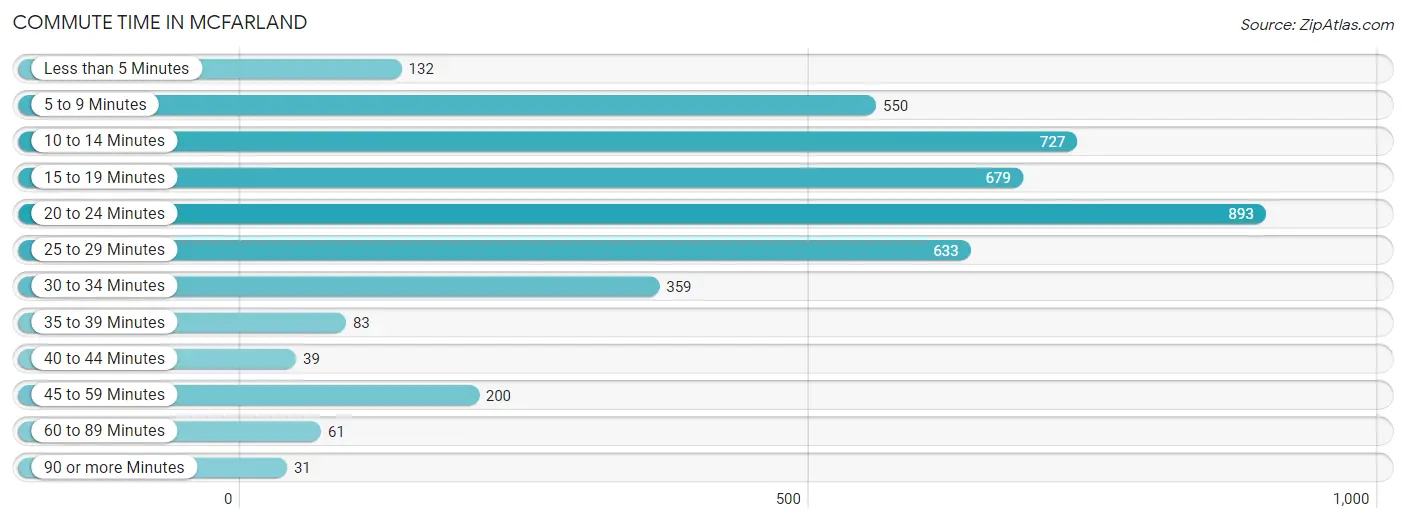
| Commute Time | # Commuters | % Commuters |
| Less than 5 Minutes | 132 | 3.0% |
| 5 to 9 Minutes | 550 | 12.5% |
| 10 to 14 Minutes | 727 | 16.6% |
| 15 to 19 Minutes | 679 | 15.5% |
| 20 to 24 Minutes | 893 | 20.4% |
| 25 to 29 Minutes | 633 | 14.4% |
| 30 to 34 Minutes | 359 | 8.2% |
| 35 to 39 Minutes | 83 | 1.9% |
| 40 to 44 Minutes | 39 | 0.9% |
| 45 to 59 Minutes | 200 | 4.6% |
| 60 to 89 Minutes | 61 | 1.4% |
| 90 or more Minutes | 31 | 0.7% |
Commute Time by Sex in Mcfarland
The most common commute times in Mcfarland are 20 to 24 minutes (436 commuters, 22.3%) for males and 20 to 24 minutes (457 commuters, 18.8%) for females.
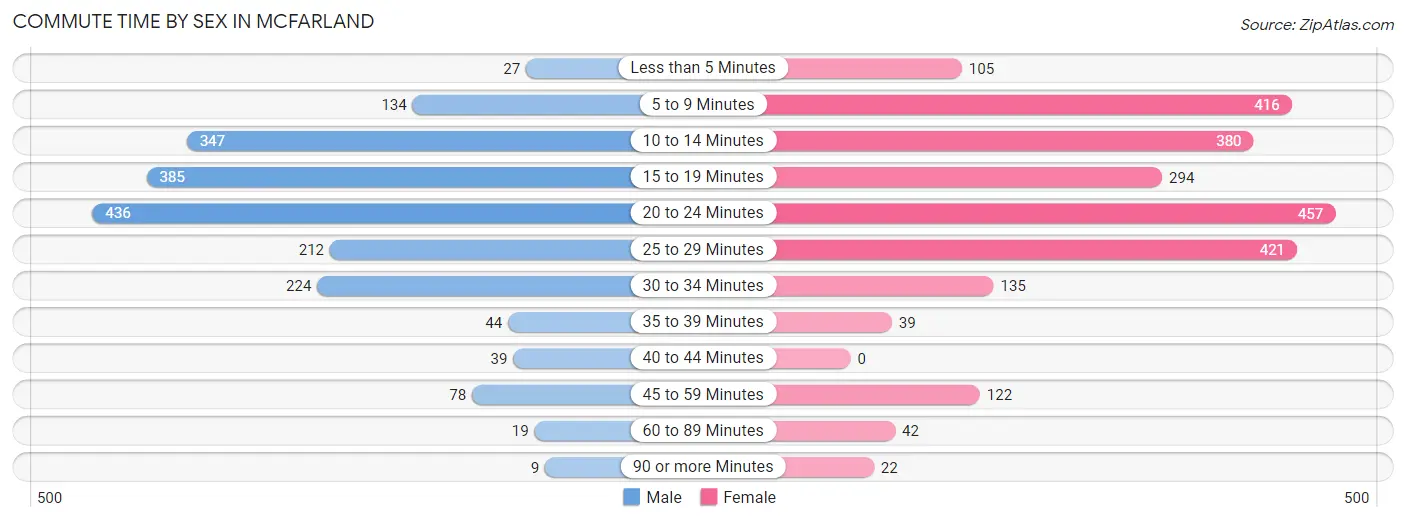
| Commute Time | Male | Female |
| Less than 5 Minutes | 27 (1.4%) | 105 (4.3%) |
| 5 to 9 Minutes | 134 (6.9%) | 416 (17.1%) |
| 10 to 14 Minutes | 347 (17.8%) | 380 (15.6%) |
| 15 to 19 Minutes | 385 (19.7%) | 294 (12.1%) |
| 20 to 24 Minutes | 436 (22.3%) | 457 (18.8%) |
| 25 to 29 Minutes | 212 (10.8%) | 421 (17.3%) |
| 30 to 34 Minutes | 224 (11.5%) | 135 (5.6%) |
| 35 to 39 Minutes | 44 (2.2%) | 39 (1.6%) |
| 40 to 44 Minutes | 39 (2.0%) | 0 (0.0%) |
| 45 to 59 Minutes | 78 (4.0%) | 122 (5.0%) |
| 60 to 89 Minutes | 19 (1.0%) | 42 (1.7%) |
| 90 or more Minutes | 9 (0.5%) | 22 (0.9%) |
Time of Departure to Work by Sex in Mcfarland
The most frequent times of departure to work in Mcfarland are 7:00 AM to 7:29 AM (476, 24.4%) for males and 7:00 AM to 7:29 AM (594, 24.4%) for females.
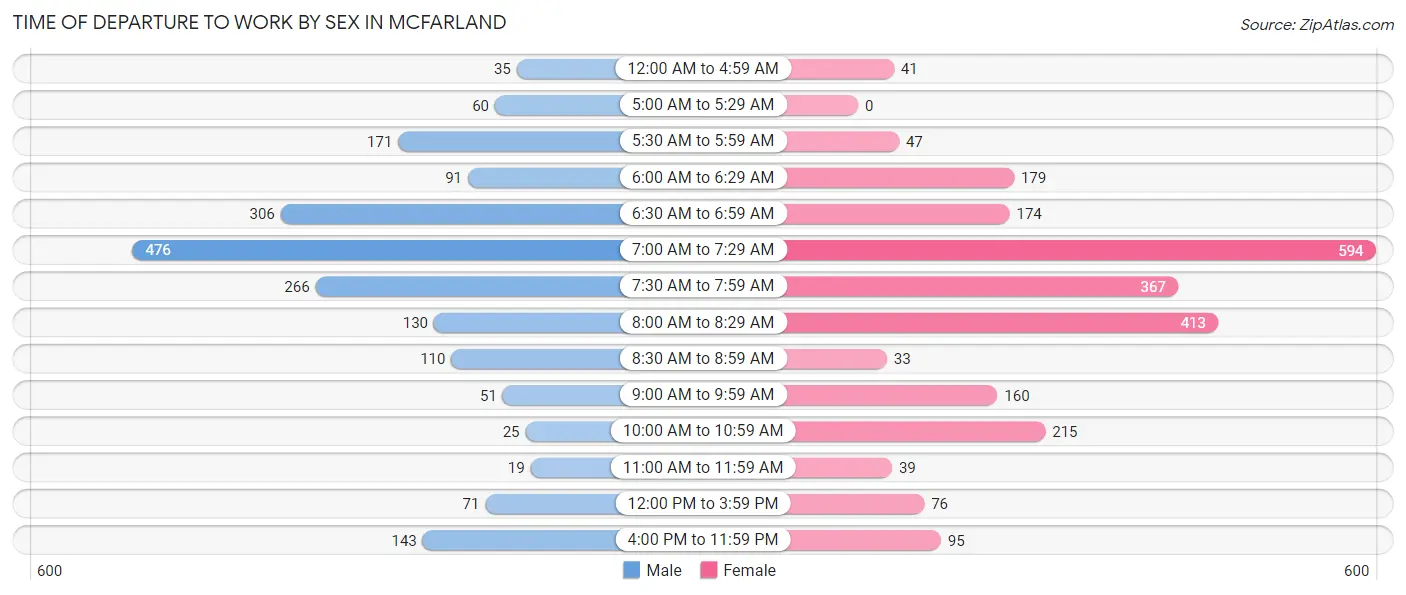
| Time of Departure | Male | Female |
| 12:00 AM to 4:59 AM | 35 (1.8%) | 41 (1.7%) |
| 5:00 AM to 5:29 AM | 60 (3.1%) | 0 (0.0%) |
| 5:30 AM to 5:59 AM | 171 (8.7%) | 47 (1.9%) |
| 6:00 AM to 6:29 AM | 91 (4.7%) | 179 (7.4%) |
| 6:30 AM to 6:59 AM | 306 (15.7%) | 174 (7.1%) |
| 7:00 AM to 7:29 AM | 476 (24.4%) | 594 (24.4%) |
| 7:30 AM to 7:59 AM | 266 (13.6%) | 367 (15.1%) |
| 8:00 AM to 8:29 AM | 130 (6.7%) | 413 (17.0%) |
| 8:30 AM to 8:59 AM | 110 (5.6%) | 33 (1.4%) |
| 9:00 AM to 9:59 AM | 51 (2.6%) | 160 (6.6%) |
| 10:00 AM to 10:59 AM | 25 (1.3%) | 215 (8.8%) |
| 11:00 AM to 11:59 AM | 19 (1.0%) | 39 (1.6%) |
| 12:00 PM to 3:59 PM | 71 (3.6%) | 76 (3.1%) |
| 4:00 PM to 11:59 PM | 143 (7.3%) | 95 (3.9%) |
| Total | 1,954 (100.0%) | 2,433 (100.0%) |
Housing Occupancy in Mcfarland
Occupancy by Ownership in Mcfarland
Of the total 3,672 dwellings in Mcfarland, owner-occupied units account for 2,737 (74.5%), while renter-occupied units make up 935 (25.5%).
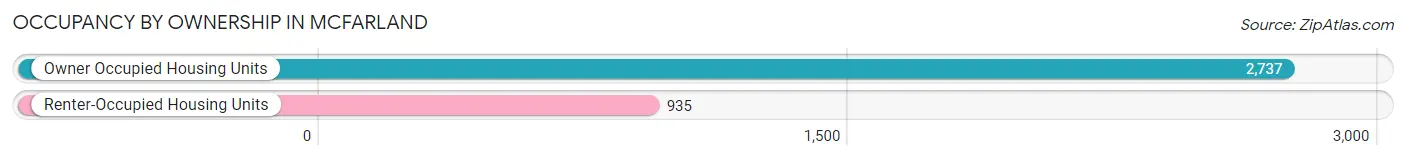
| Occupancy | # Housing Units | % Housing Units |
| Owner Occupied Housing Units | 2,737 | 74.5% |
| Renter-Occupied Housing Units | 935 | 25.5% |
| Total Occupied Housing Units | 3,672 | 100.0% |
Occupancy by Household Size in Mcfarland
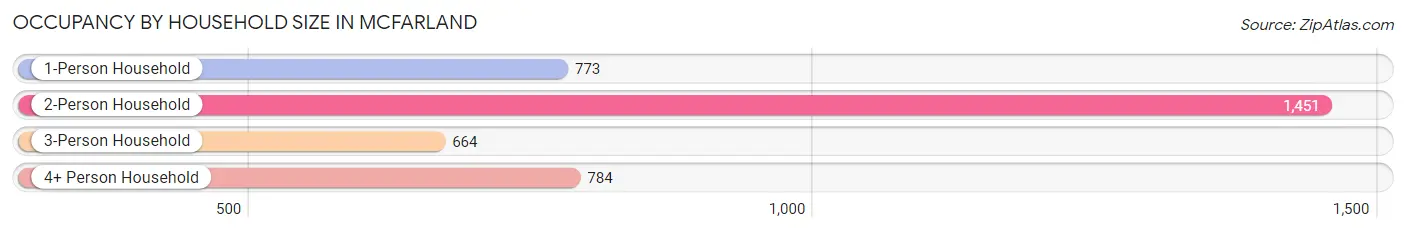
| Household Size | # Housing Units | % Housing Units |
| 1-Person Household | 773 | 21.0% |
| 2-Person Household | 1,451 | 39.5% |
| 3-Person Household | 664 | 18.1% |
| 4+ Person Household | 784 | 21.3% |
| Total Housing Units | 3,672 | 100.0% |
Occupancy by Ownership by Household Size in Mcfarland
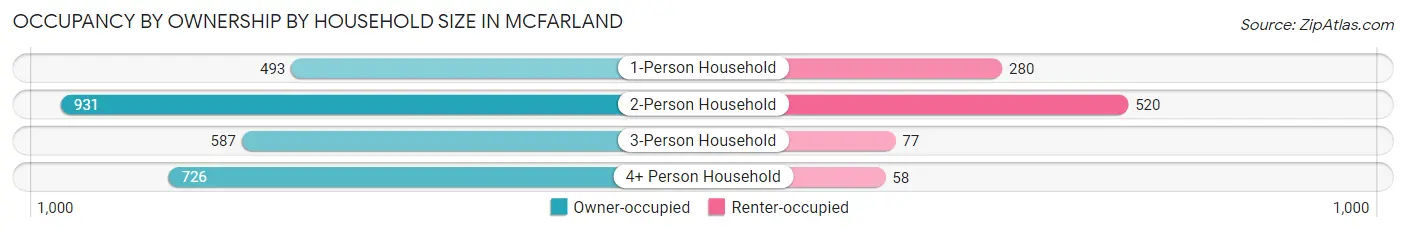
| Household Size | Owner-occupied | Renter-occupied |
| 1-Person Household | 493 (63.8%) | 280 (36.2%) |
| 2-Person Household | 931 (64.2%) | 520 (35.8%) |
| 3-Person Household | 587 (88.4%) | 77 (11.6%) |
| 4+ Person Household | 726 (92.6%) | 58 (7.4%) |
| Total Housing Units | 2,737 (74.5%) | 935 (25.5%) |
Occupancy by Educational Attainment in Mcfarland
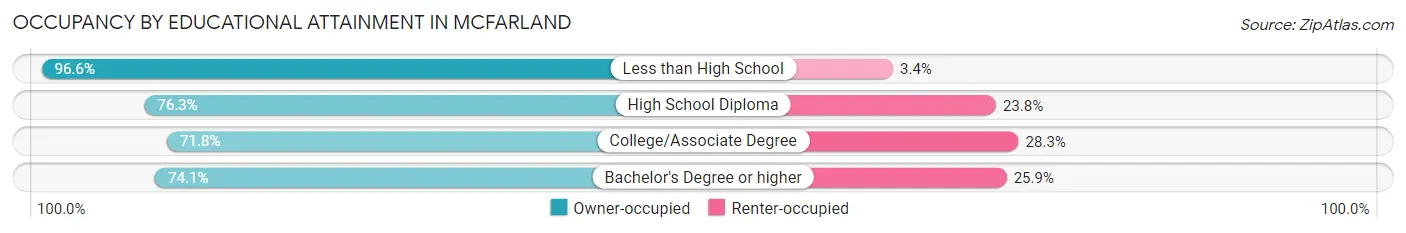
| Household Size | Owner-occupied | Renter-occupied |
| Less than High School | 115 (96.6%) | 4 (3.4%) |
| High School Diploma | 459 (76.2%) | 143 (23.7%) |
| College/Associate Degree | 729 (71.8%) | 287 (28.2%) |
| Bachelor's Degree or higher | 1,434 (74.1%) | 501 (25.9%) |
Occupancy by Age of Householder in Mcfarland
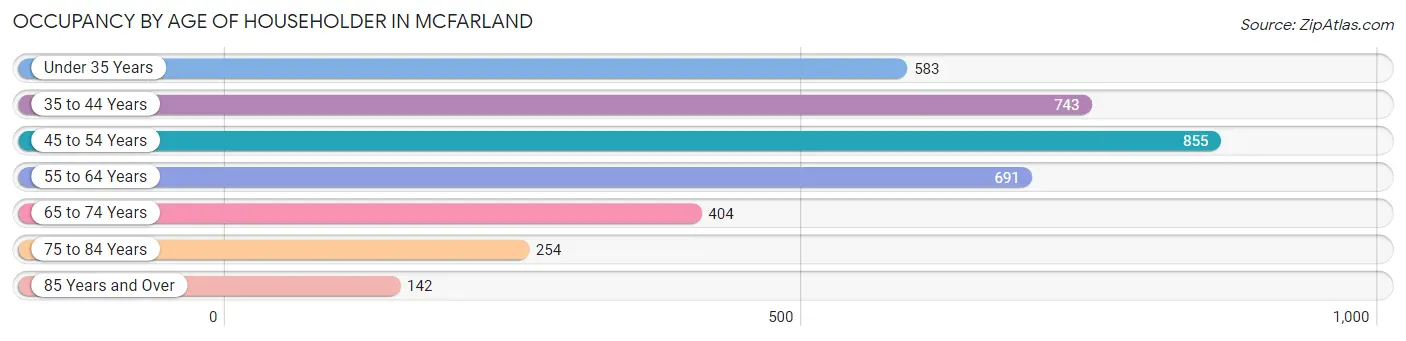
| Age Bracket | # Households | % Households |
| Under 35 Years | 583 | 15.9% |
| 35 to 44 Years | 743 | 20.2% |
| 45 to 54 Years | 855 | 23.3% |
| 55 to 64 Years | 691 | 18.8% |
| 65 to 74 Years | 404 | 11.0% |
| 75 to 84 Years | 254 | 6.9% |
| 85 Years and Over | 142 | 3.9% |
| Total | 3,672 | 100.0% |
Housing Finances in Mcfarland
Median Income by Occupancy in Mcfarland
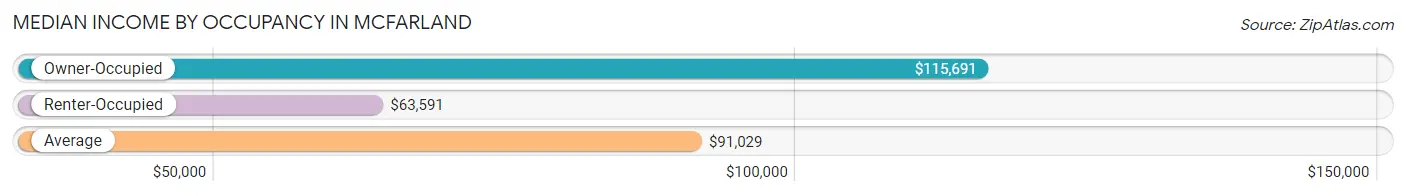
| Occupancy Type | # Households | Median Income |
| Owner-Occupied | 2,737 (74.5%) | $115,691 |
| Renter-Occupied | 935 (25.5%) | $63,591 |
| Average | 3,672 (100.0%) | $91,029 |
Occupancy by Householder Income Bracket in Mcfarland
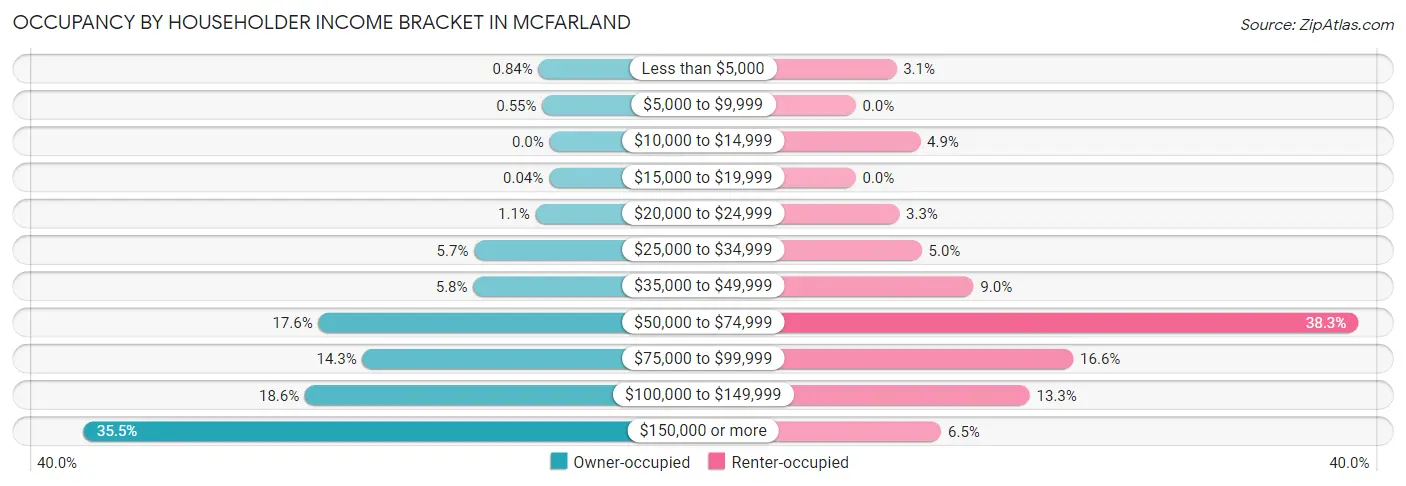
| Income Bracket | Owner-occupied | Renter-occupied |
| Less than $5,000 | 23 (0.8%) | 29 (3.1%) |
| $5,000 to $9,999 | 15 (0.5%) | 0 (0.0%) |
| $10,000 to $14,999 | 0 (0.0%) | 46 (4.9%) |
| $15,000 to $19,999 | 1 (0.0%) | 0 (0.0%) |
| $20,000 to $24,999 | 29 (1.1%) | 31 (3.3%) |
| $25,000 to $34,999 | 157 (5.7%) | 47 (5.0%) |
| $35,000 to $49,999 | 159 (5.8%) | 84 (9.0%) |
| $50,000 to $74,999 | 482 (17.6%) | 358 (38.3%) |
| $75,000 to $99,999 | 390 (14.2%) | 155 (16.6%) |
| $100,000 to $149,999 | 510 (18.6%) | 124 (13.3%) |
| $150,000 or more | 971 (35.5%) | 61 (6.5%) |
| Total | 2,737 (100.0%) | 935 (100.0%) |
Monthly Housing Cost Tiers in Mcfarland
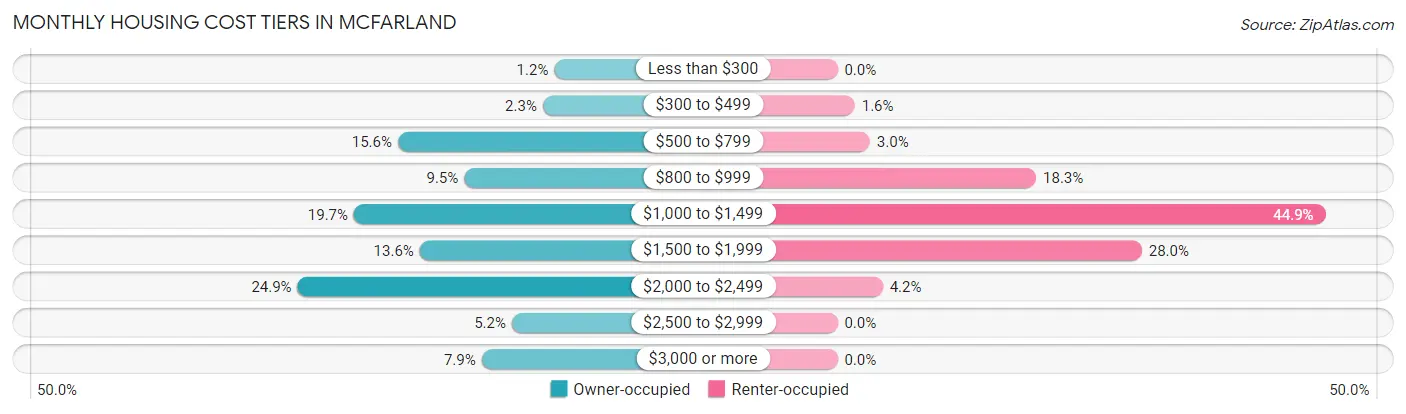
| Monthly Cost | Owner-occupied | Renter-occupied |
| Less than $300 | 34 (1.2%) | 0 (0.0%) |
| $300 to $499 | 63 (2.3%) | 15 (1.6%) |
| $500 to $799 | 428 (15.6%) | 28 (3.0%) |
| $800 to $999 | 261 (9.5%) | 171 (18.3%) |
| $1,000 to $1,499 | 539 (19.7%) | 420 (44.9%) |
| $1,500 to $1,999 | 373 (13.6%) | 262 (28.0%) |
| $2,000 to $2,499 | 681 (24.9%) | 39 (4.2%) |
| $2,500 to $2,999 | 141 (5.1%) | 0 (0.0%) |
| $3,000 or more | 217 (7.9%) | 0 (0.0%) |
| Total | 2,737 (100.0%) | 935 (100.0%) |
Physical Housing Characteristics in Mcfarland
Housing Structures in Mcfarland
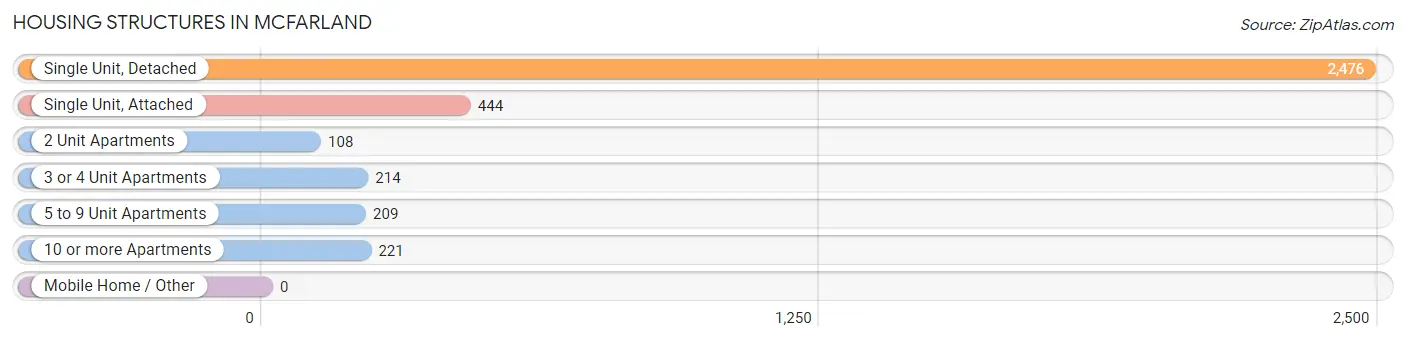
| Structure Type | # Housing Units | % Housing Units |
| Single Unit, Detached | 2,476 | 67.4% |
| Single Unit, Attached | 444 | 12.1% |
| 2 Unit Apartments | 108 | 2.9% |
| 3 or 4 Unit Apartments | 214 | 5.8% |
| 5 to 9 Unit Apartments | 209 | 5.7% |
| 10 or more Apartments | 221 | 6.0% |
| Mobile Home / Other | 0 | 0.0% |
| Total | 3,672 | 100.0% |
Housing Structures by Occupancy in Mcfarland
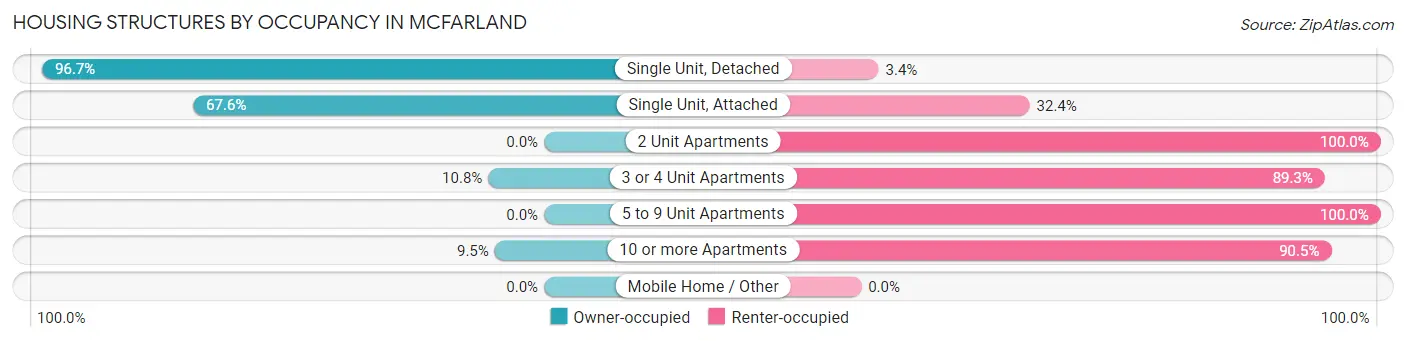
| Structure Type | Owner-occupied | Renter-occupied |
| Single Unit, Detached | 2,393 (96.7%) | 83 (3.4%) |
| Single Unit, Attached | 300 (67.6%) | 144 (32.4%) |
| 2 Unit Apartments | 0 (0.0%) | 108 (100.0%) |
| 3 or 4 Unit Apartments | 23 (10.7%) | 191 (89.2%) |
| 5 to 9 Unit Apartments | 0 (0.0%) | 209 (100.0%) |
| 10 or more Apartments | 21 (9.5%) | 200 (90.5%) |
| Mobile Home / Other | 0 (0.0%) | 0 (0.0%) |
| Total | 2,737 (74.5%) | 935 (25.5%) |
Housing Structures by Number of Rooms in Mcfarland
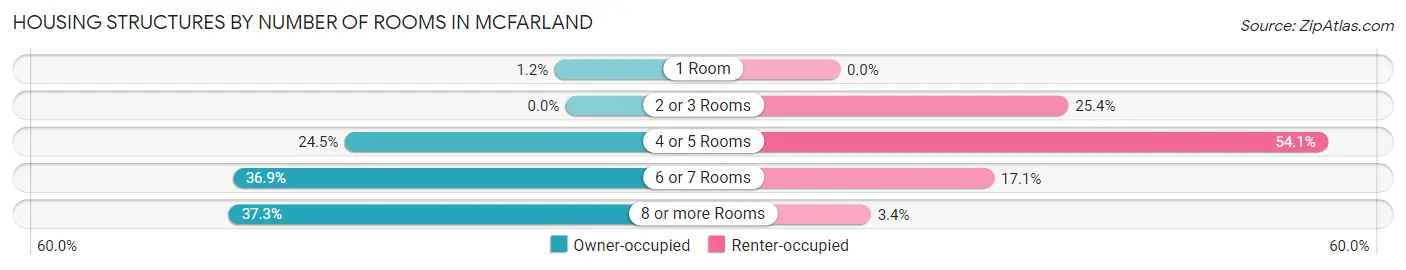
| Number of Rooms | Owner-occupied | Renter-occupied |
| 1 Room | 34 (1.2%) | 0 (0.0%) |
| 2 or 3 Rooms | 0 (0.0%) | 237 (25.4%) |
| 4 or 5 Rooms | 671 (24.5%) | 506 (54.1%) |
| 6 or 7 Rooms | 1,010 (36.9%) | 160 (17.1%) |
| 8 or more Rooms | 1,022 (37.3%) | 32 (3.4%) |
| Total | 2,737 (100.0%) | 935 (100.0%) |
Housing Structure by Heating Type in Mcfarland
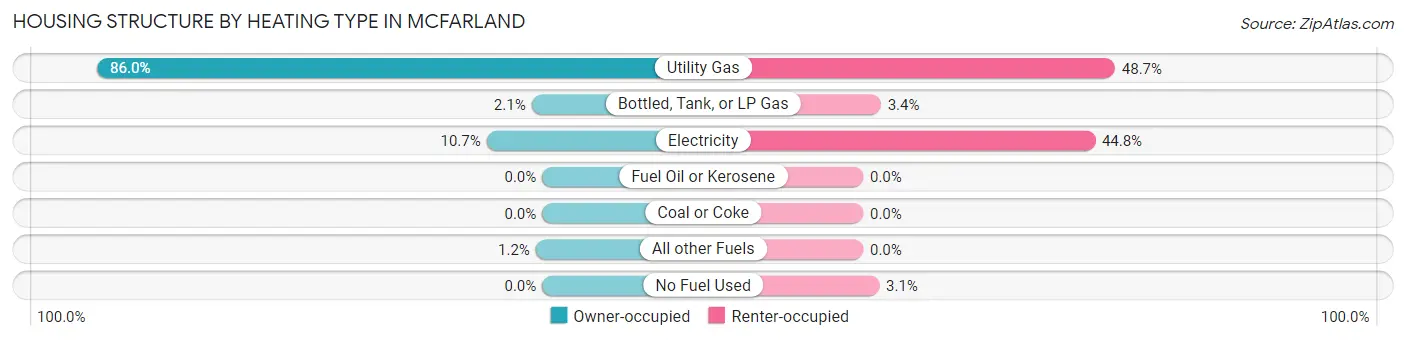
| Heating Type | Owner-occupied | Renter-occupied |
| Utility Gas | 2,353 (86.0%) | 455 (48.7%) |
| Bottled, Tank, or LP Gas | 56 (2.1%) | 32 (3.4%) |
| Electricity | 294 (10.7%) | 419 (44.8%) |
| Fuel Oil or Kerosene | 0 (0.0%) | 0 (0.0%) |
| Coal or Coke | 0 (0.0%) | 0 (0.0%) |
| All other Fuels | 34 (1.2%) | 0 (0.0%) |
| No Fuel Used | 0 (0.0%) | 29 (3.1%) |
| Total | 2,737 (100.0%) | 935 (100.0%) |
Household Vehicle Usage in Mcfarland
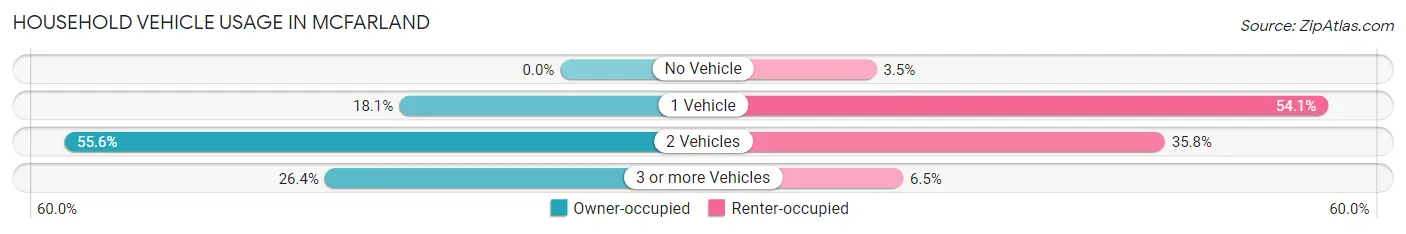
| Vehicles per Household | Owner-occupied | Renter-occupied |
| No Vehicle | 0 (0.0%) | 33 (3.5%) |
| 1 Vehicle | 494 (18.0%) | 506 (54.1%) |
| 2 Vehicles | 1,521 (55.6%) | 335 (35.8%) |
| 3 or more Vehicles | 722 (26.4%) | 61 (6.5%) |
| Total | 2,737 (100.0%) | 935 (100.0%) |
Real Estate & Mortgages in Mcfarland
Real Estate and Mortgage Overview in Mcfarland
| Characteristic | Without Mortgage | With Mortgage |
| Housing Units | 1,055 | 1,682 |
| Median Property Value | $315,700 | $354,000 |
| Median Household Income | $84,865 | $675 |
| Monthly Housing Costs | $824 | $217 |
| Real Estate Taxes | $5,231 | $0 |
Property Value by Mortgage Status in Mcfarland
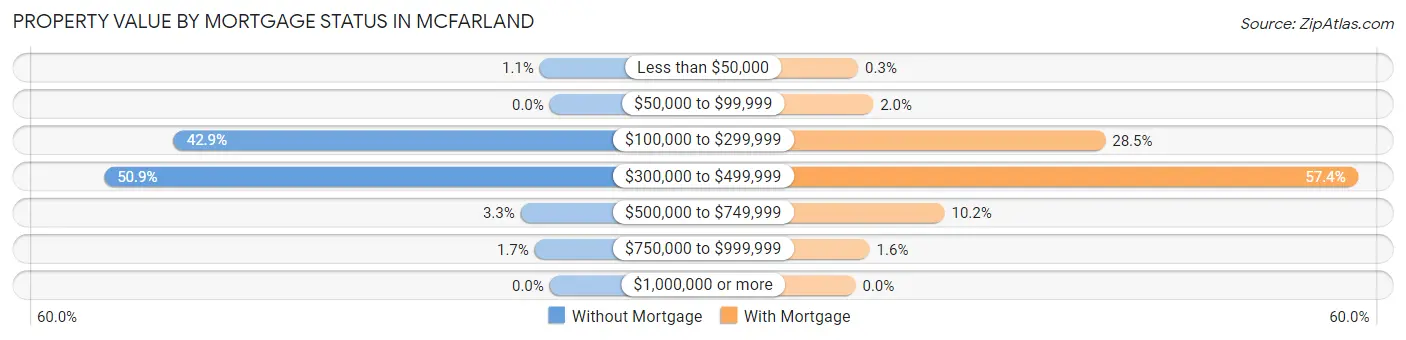
| Property Value | Without Mortgage | With Mortgage |
| Less than $50,000 | 12 (1.1%) | 5 (0.3%) |
| $50,000 to $99,999 | 0 (0.0%) | 34 (2.0%) |
| $100,000 to $299,999 | 453 (42.9%) | 480 (28.5%) |
| $300,000 to $499,999 | 537 (50.9%) | 965 (57.4%) |
| $500,000 to $749,999 | 35 (3.3%) | 171 (10.2%) |
| $750,000 to $999,999 | 18 (1.7%) | 27 (1.6%) |
| $1,000,000 or more | 0 (0.0%) | 0 (0.0%) |
| Total | 1,055 (100.0%) | 1,682 (100.0%) |
Household Income by Mortgage Status in Mcfarland
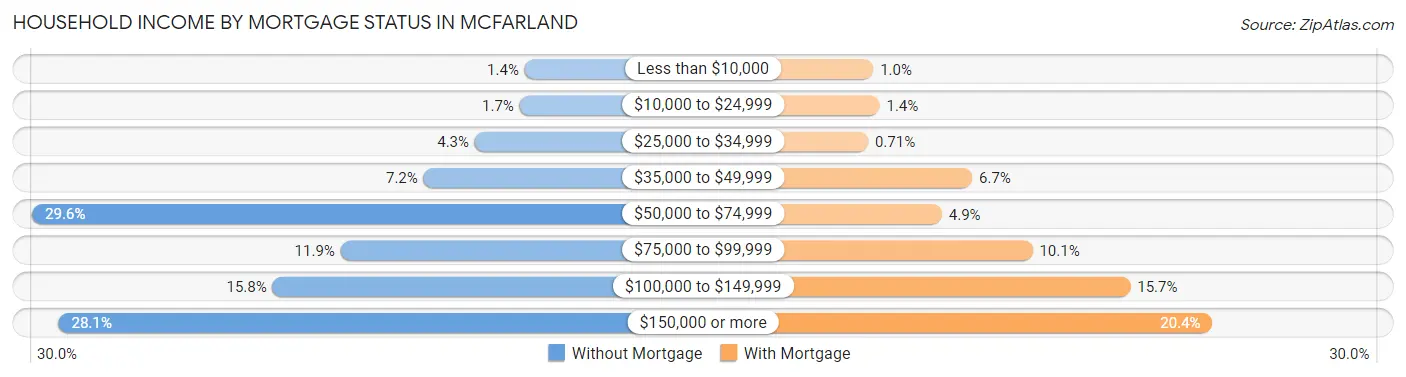
| Household Income | Without Mortgage | With Mortgage |
| Less than $10,000 | 15 (1.4%) | 17 (1.0%) |
| $10,000 to $24,999 | 18 (1.7%) | 23 (1.4%) |
| $25,000 to $34,999 | 45 (4.3%) | 12 (0.7%) |
| $35,000 to $49,999 | 76 (7.2%) | 112 (6.7%) |
| $50,000 to $74,999 | 312 (29.6%) | 83 (4.9%) |
| $75,000 to $99,999 | 126 (11.9%) | 170 (10.1%) |
| $100,000 to $149,999 | 167 (15.8%) | 264 (15.7%) |
| $150,000 or more | 296 (28.1%) | 343 (20.4%) |
| Total | 1,055 (100.0%) | 1,682 (100.0%) |
Property Value to Household Income Ratio in Mcfarland
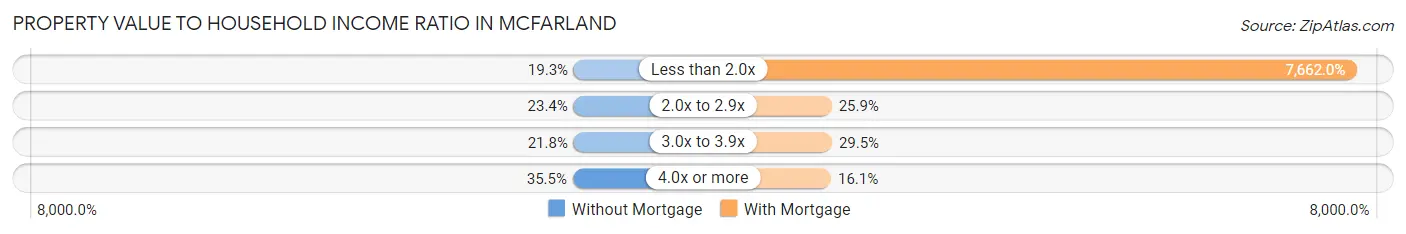
| Value-to-Income Ratio | Without Mortgage | With Mortgage |
| Less than 2.0x | 204 (19.3%) | 128,875 (7,662.0%) |
| 2.0x to 2.9x | 247 (23.4%) | 435 (25.9%) |
| 3.0x to 3.9x | 230 (21.8%) | 496 (29.5%) |
| 4.0x or more | 374 (35.4%) | 271 (16.1%) |
| Total | 1,055 (100.0%) | 1,682 (100.0%) |
Real Estate Taxes by Mortgage Status in Mcfarland
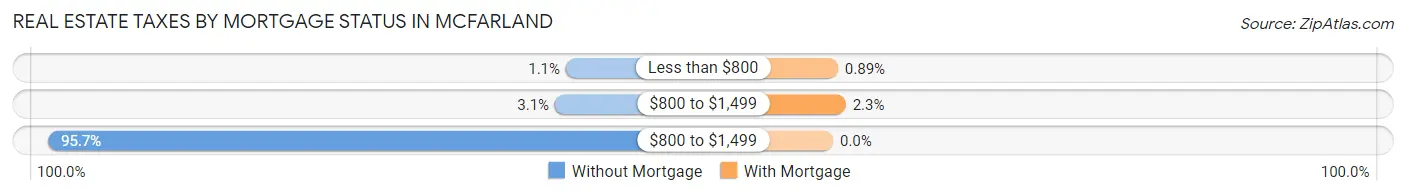
| Property Taxes | Without Mortgage | With Mortgage |
| Less than $800 | 12 (1.1%) | 15 (0.9%) |
| $800 to $1,499 | 33 (3.1%) | 39 (2.3%) |
| $800 to $1,499 | 1,010 (95.7%) | 0 (0.0%) |
| Total | 1,055 (100.0%) | 1,682 (100.0%) |
Health & Disability in Mcfarland
Health Insurance Coverage by Age in Mcfarland
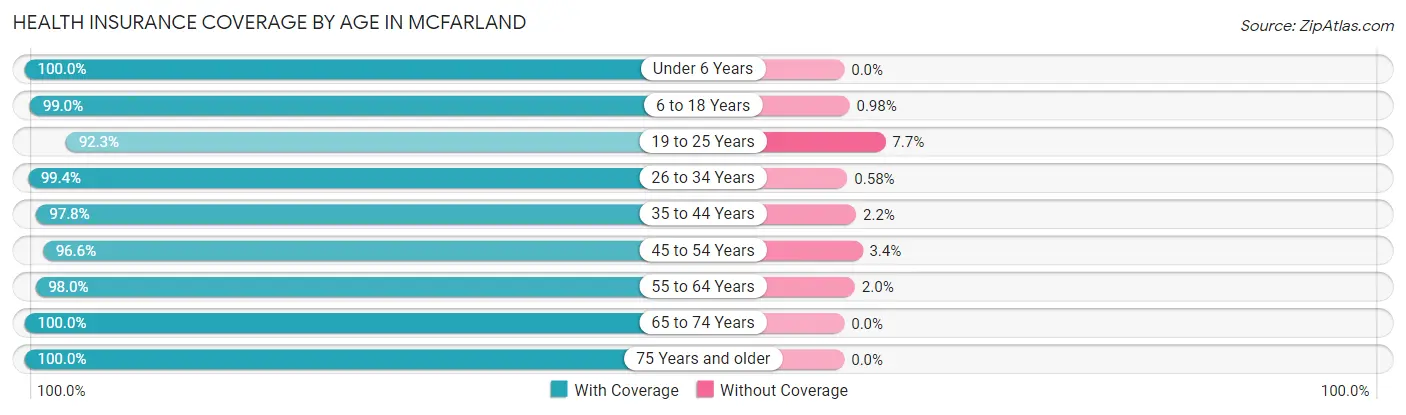
| Age Bracket | With Coverage | Without Coverage |
| Under 6 Years | 408 (100.0%) | 0 (0.0%) |
| 6 to 18 Years | 2,216 (99.0%) | 22 (1.0%) |
| 19 to 25 Years | 409 (92.3%) | 34 (7.7%) |
| 26 to 34 Years | 856 (99.4%) | 5 (0.6%) |
| 35 to 44 Years | 1,466 (97.8%) | 33 (2.2%) |
| 45 to 54 Years | 1,110 (96.6%) | 39 (3.4%) |
| 55 to 64 Years | 1,087 (98.0%) | 22 (2.0%) |
| 65 to 74 Years | 795 (100.0%) | 0 (0.0%) |
| 75 Years and older | 602 (100.0%) | 0 (0.0%) |
| Total | 8,949 (98.3%) | 155 (1.7%) |
Health Insurance Coverage by Citizenship Status in Mcfarland
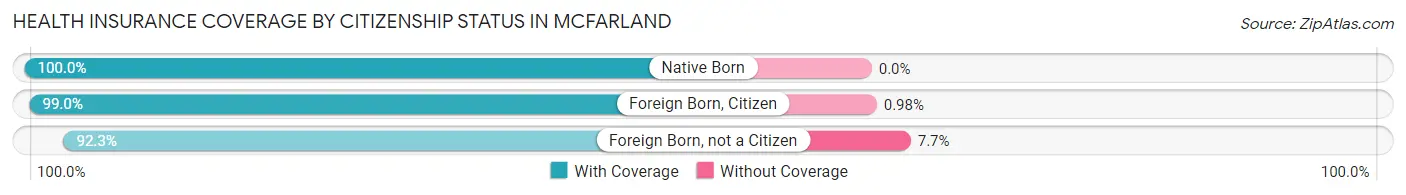
| Citizenship Status | With Coverage | Without Coverage |
| Native Born | 408 (100.0%) | 0 (0.0%) |
| Foreign Born, Citizen | 2,216 (99.0%) | 22 (1.0%) |
| Foreign Born, not a Citizen | 409 (92.3%) | 34 (7.7%) |
Health Insurance Coverage by Household Income in Mcfarland
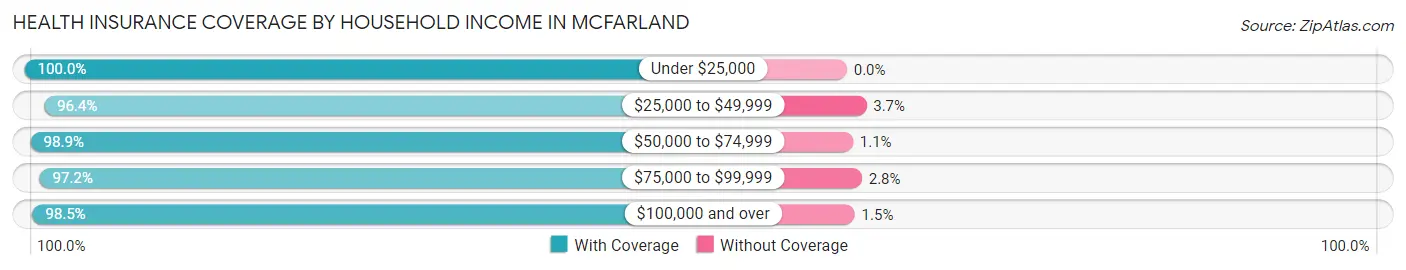
| Household Income | With Coverage | Without Coverage |
| Under $25,000 | 214 (100.0%) | 0 (0.0%) |
| $25,000 to $49,999 | 687 (96.4%) | 26 (3.6%) |
| $50,000 to $74,999 | 1,914 (98.9%) | 22 (1.1%) |
| $75,000 to $99,999 | 1,106 (97.2%) | 32 (2.8%) |
| $100,000 and over | 5,011 (98.5%) | 75 (1.5%) |
Public vs Private Health Insurance Coverage by Age in Mcfarland
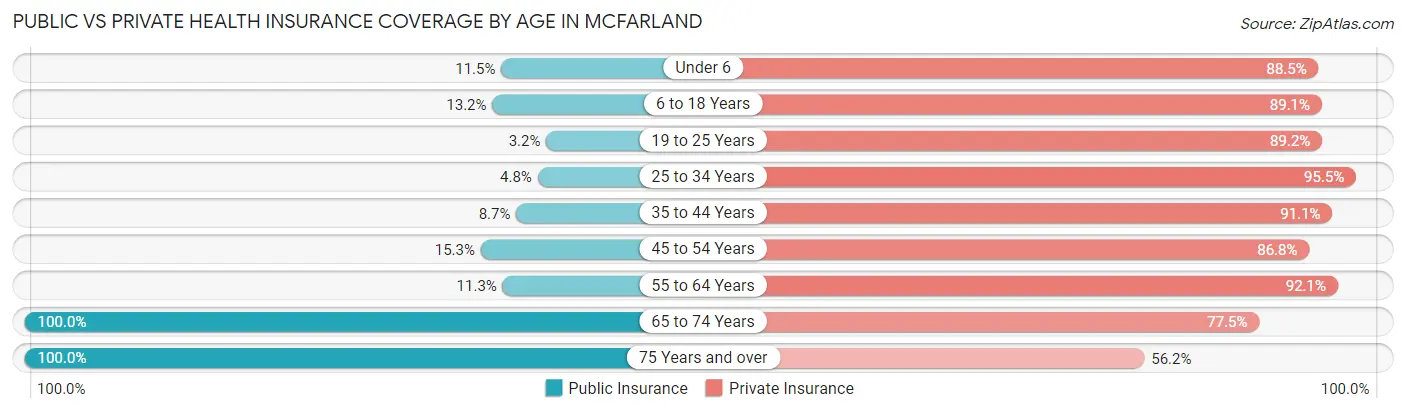
| Age Bracket | Public Insurance | Private Insurance |
| Under 6 | 47 (11.5%) | 361 (88.5%) |
| 6 to 18 Years | 295 (13.2%) | 1,994 (89.1%) |
| 19 to 25 Years | 14 (3.2%) | 395 (89.2%) |
| 25 to 34 Years | 41 (4.8%) | 822 (95.5%) |
| 35 to 44 Years | 131 (8.7%) | 1,365 (91.1%) |
| 45 to 54 Years | 176 (15.3%) | 997 (86.8%) |
| 55 to 64 Years | 125 (11.3%) | 1,021 (92.1%) |
| 65 to 74 Years | 795 (100.0%) | 616 (77.5%) |
| 75 Years and over | 602 (100.0%) | 338 (56.1%) |
| Total | 2,226 (24.4%) | 7,909 (86.9%) |
Disability Status by Sex by Age in Mcfarland
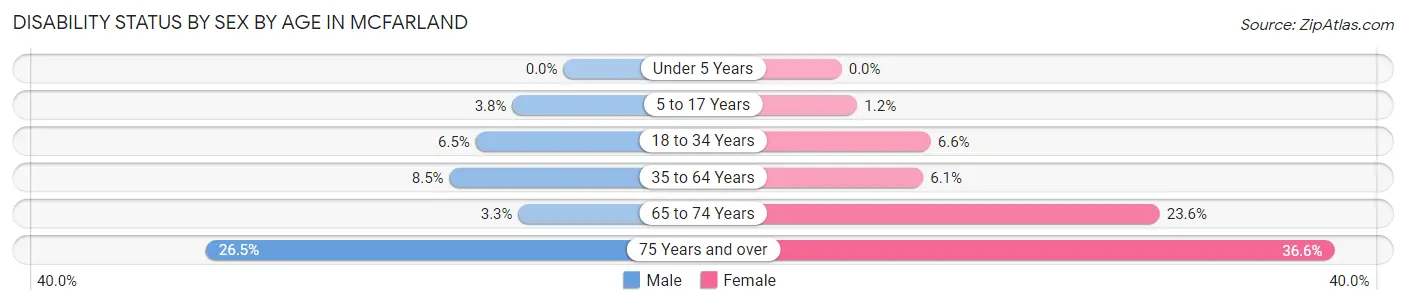
| Age Bracket | Male | Female |
| Under 5 Years | 0 (0.0%) | 0 (0.0%) |
| 5 to 17 Years | 31 (3.8%) | 13 (1.2%) |
| 18 to 34 Years | 36 (6.5%) | 74 (6.6%) |
| 35 to 64 Years | 150 (8.5%) | 120 (6.0%) |
| 65 to 74 Years | 11 (3.3%) | 110 (23.6%) |
| 75 Years and over | 56 (26.5%) | 143 (36.6%) |
Disability Class by Sex by Age in Mcfarland
Disability Class: Hearing Difficulty
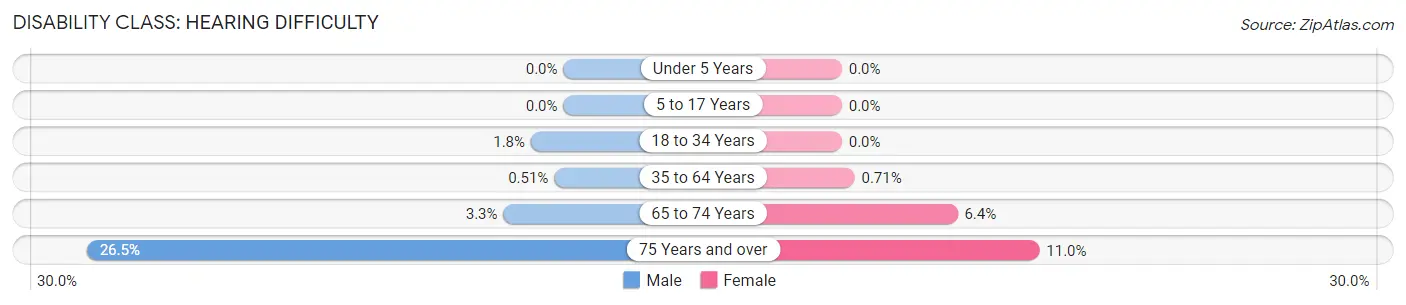
| Age Bracket | Male | Female |
| Under 5 Years | 0 (0.0%) | 0 (0.0%) |
| 5 to 17 Years | 0 (0.0%) | 0 (0.0%) |
| 18 to 34 Years | 10 (1.8%) | 0 (0.0%) |
| 35 to 64 Years | 9 (0.5%) | 14 (0.7%) |
| 65 to 74 Years | 11 (3.3%) | 30 (6.4%) |
| 75 Years and over | 56 (26.5%) | 43 (11.0%) |
Disability Class: Vision Difficulty
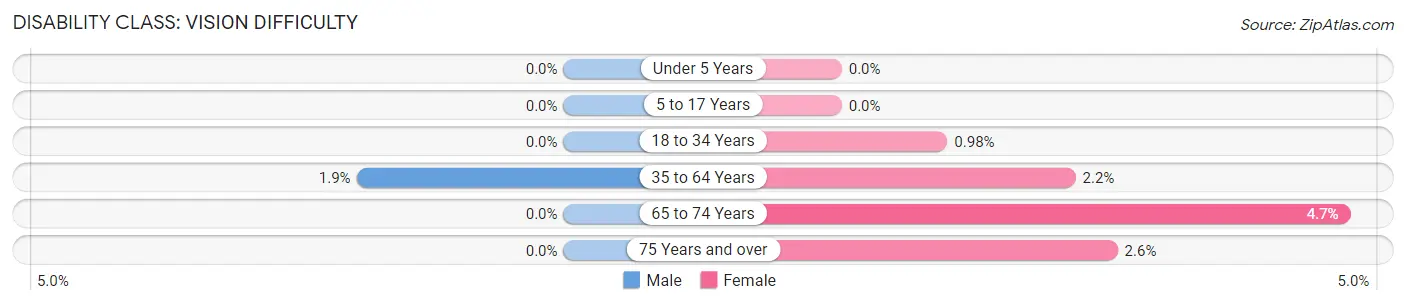
| Age Bracket | Male | Female |
| Under 5 Years | 0 (0.0%) | 0 (0.0%) |
| 5 to 17 Years | 0 (0.0%) | 0 (0.0%) |
| 18 to 34 Years | 0 (0.0%) | 11 (1.0%) |
| 35 to 64 Years | 34 (1.9%) | 43 (2.2%) |
| 65 to 74 Years | 0 (0.0%) | 22 (4.7%) |
| 75 Years and over | 0 (0.0%) | 10 (2.6%) |
Disability Class: Cognitive Difficulty
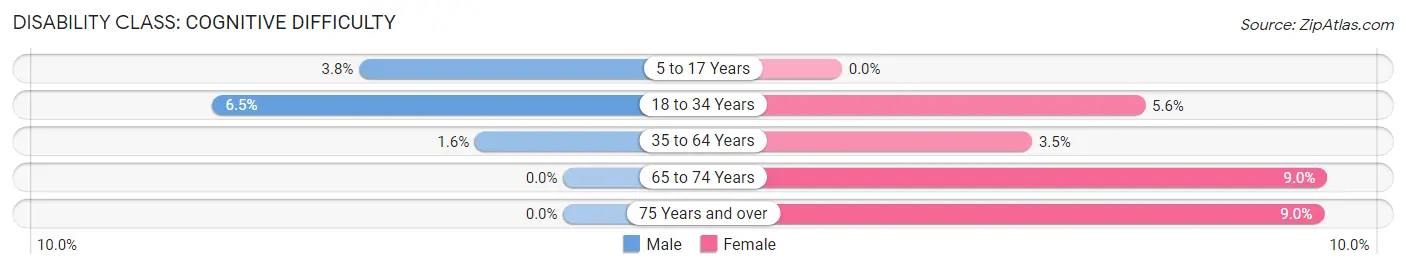
| Age Bracket | Male | Female |
| 5 to 17 Years | 31 (3.8%) | 0 (0.0%) |
| 18 to 34 Years | 36 (6.5%) | 63 (5.6%) |
| 35 to 64 Years | 29 (1.6%) | 70 (3.5%) |
| 65 to 74 Years | 0 (0.0%) | 42 (9.0%) |
| 75 Years and over | 0 (0.0%) | 35 (8.9%) |
Disability Class: Ambulatory Difficulty
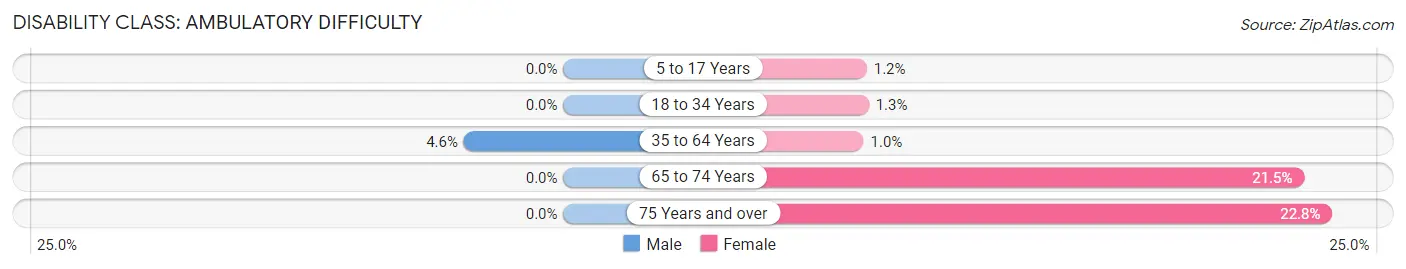
| Age Bracket | Male | Female |
| 5 to 17 Years | 0 (0.0%) | 13 (1.2%) |
| 18 to 34 Years | 0 (0.0%) | 14 (1.3%) |
| 35 to 64 Years | 82 (4.6%) | 20 (1.0%) |
| 65 to 74 Years | 0 (0.0%) | 100 (21.5%) |
| 75 Years and over | 0 (0.0%) | 89 (22.8%) |
Disability Class: Self-Care Difficulty
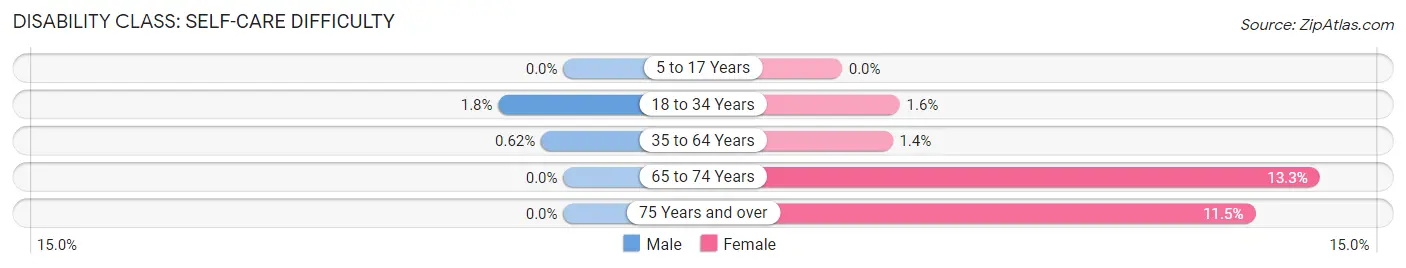
| Age Bracket | Male | Female |
| 5 to 17 Years | 0 (0.0%) | 0 (0.0%) |
| 18 to 34 Years | 10 (1.8%) | 18 (1.6%) |
| 35 to 64 Years | 11 (0.6%) | 28 (1.4%) |
| 65 to 74 Years | 0 (0.0%) | 62 (13.3%) |
| 75 Years and over | 0 (0.0%) | 45 (11.5%) |
Technology Access in Mcfarland
Computing Device Access in Mcfarland
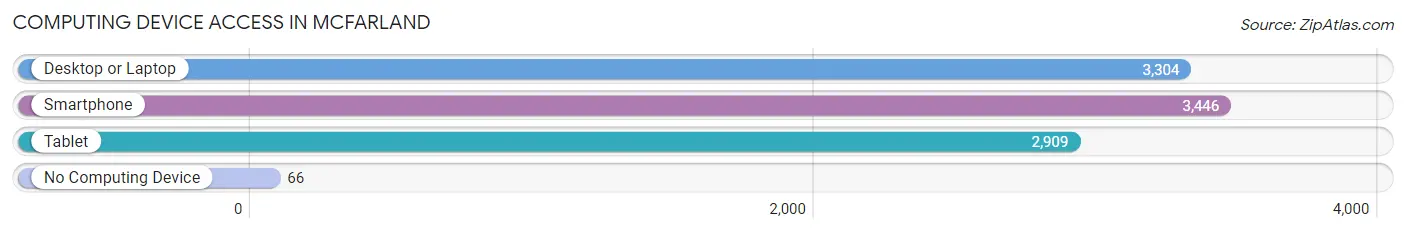
| Device Type | # Households | % Households |
| Desktop or Laptop | 3,304 | 90.0% |
| Smartphone | 3,446 | 93.9% |
| Tablet | 2,909 | 79.2% |
| No Computing Device | 66 | 1.8% |
| Total | 3,672 | 100.0% |
Internet Access in Mcfarland
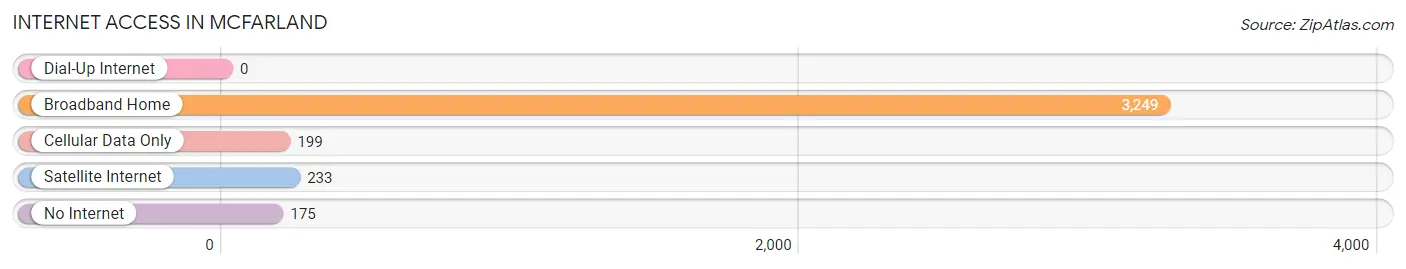
| Internet Type | # Households | % Households |
| Dial-Up Internet | 0 | 0.0% |
| Broadband Home | 3,249 | 88.5% |
| Cellular Data Only | 199 | 5.4% |
| Satellite Internet | 233 | 6.4% |
| No Internet | 175 | 4.8% |
| Total | 3,672 | 100.0% |
Mcfarland Summary
McFarland, Wisconsin is a small village located in Dane County, Wisconsin. It is situated on the eastern shore of Lake Waubesa, just south of Madison. The village has a population of approximately 8,000 people and is part of the Madison Metropolitan Statistical Area.
History
McFarland was first settled in 1845 by a group of settlers from New York. The village was named after the McFarland family, who were among the first settlers. The village was incorporated in 1887 and has remained a small, rural community ever since.
Geography
McFarland is located in Dane County, Wisconsin, on the eastern shore of Lake Waubesa. The village is situated on the banks of the Yahara River, which flows through the village and into Lake Waubesa. The village is surrounded by rolling hills and farmland, and is located just south of Madison.
Economy
McFarland’s economy is largely based on agriculture and tourism. The village is home to several small businesses, including a grocery store, a hardware store, and a few restaurants. The village also has a few small manufacturing companies, including a furniture manufacturer and a plastics manufacturer.
Demographics
As of the 2010 census, McFarland had a population of 8,000 people. The population is largely white (94.3%), with a small percentage of African Americans (2.2%), Asians (1.2%), and Hispanics (1.3%). The median household income is $60,000, and the median home value is $200,000.
McFarland is a small, rural village with a rich history and a strong sense of community. The village is home to a diverse population and a thriving economy. The village is a great place to live, work, and raise a family.
Common Questions
What is Per Capita Income in Mcfarland?
Per Capita income in Mcfarland is $51,121.
What is the Median Family Income in Mcfarland?
Median Family Income in Mcfarland is $105,491.
What is the Median Household income in Mcfarland?
Median Household Income in Mcfarland is $91,029.
What is Income or Wage Gap in Mcfarland?
Income or Wage Gap in Mcfarland is 30.1%.
Women in Mcfarland earn 69.9 cents for every dollar earned by a man.
What is Inequality or Gini Index in Mcfarland?
Inequality or Gini Index in Mcfarland is 0.41.
What is the Total Population of Mcfarland?
Total Population of Mcfarland is 9,104.
What is the Total Male Population of Mcfarland?
Total Male Population of Mcfarland is 3,879.
What is the Total Female Population of Mcfarland?
Total Female Population of Mcfarland is 5,225.
What is the Ratio of Males per 100 Females in Mcfarland?
There are 74.24 Males per 100 Females in Mcfarland.
What is the Ratio of Females per 100 Males in Mcfarland?
There are 134.70 Females per 100 Males in Mcfarland.
What is the Median Population Age in Mcfarland?
Median Population Age in Mcfarland is 39.6 Years.
What is the Average Family Size in Mcfarland
Average Family Size in Mcfarland is 2.8 People.
What is the Average Household Size in Mcfarland
Average Household Size in Mcfarland is 2.5 People.
How Large is the Labor Force in Mcfarland?
There are 5,339 People in the Labor Forcein in Mcfarland.
What is the Percentage of People in the Labor Force in Mcfarland?
74.2% of People are in the Labor Force in Mcfarland.
What is the Unemployment Rate in Mcfarland?
Unemployment Rate in Mcfarland is 4.0%.