Seabrook Beach, NH Map & Demographics
Seabrook Beach Map
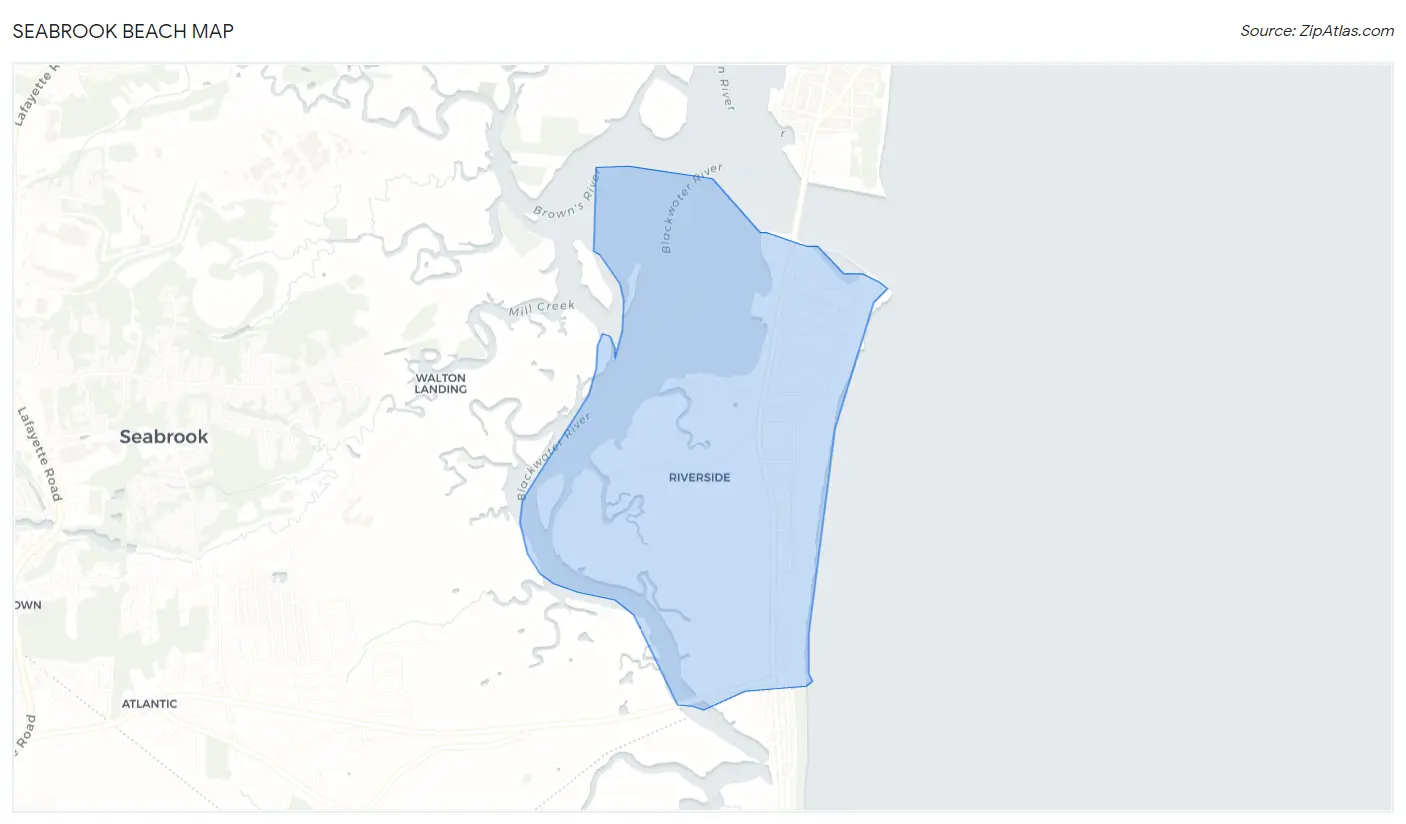
Seabrook Beach Overview
$89,645
PER CAPITA INCOME
$197,321
AVG FAMILY INCOME
$107,019
AVG HOUSEHOLD INCOME
21.5%
WAGE / INCOME GAP [ % ]
78.5¢/ $1
WAGE / INCOME GAP [ $ ]
0.49
INEQUALITY / GINI INDEX
864
TOTAL POPULATION
428
MALE POPULATION
436
FEMALE POPULATION
98.17
MALES / 100 FEMALES
101.87
FEMALES / 100 MALES
61.6
MEDIAN AGE
2.3
AVG FAMILY SIZE
1.7
AVG HOUSEHOLD SIZE
443
LABOR FORCE [ PEOPLE ]
53.6%
PERCENT IN LABOR FORCE
8.4%
UNEMPLOYMENT RATE
Income in Seabrook Beach
Income Overview in Seabrook Beach
Per Capita Income in Seabrook Beach is $89,645, while median incomes of families and households are $197,321 and $107,019 respectively.
| Characteristic | Number | Measure |
| Per Capita Income | 864 | $89,645 |
| Median Family Income | 262 | $197,321 |
| Mean Family Income | 262 | $211,013 |
| Median Household Income | 499 | $107,019 |
| Mean Household Income | 499 | $153,644 |
| Income Deficit | 262 | $0 |
| Wage / Income Gap (%) | 864 | 21.54% |
| Wage / Income Gap ($) | 864 | 78.46¢ per $1 |
| Gini / Inequality Index | 864 | 0.49 |
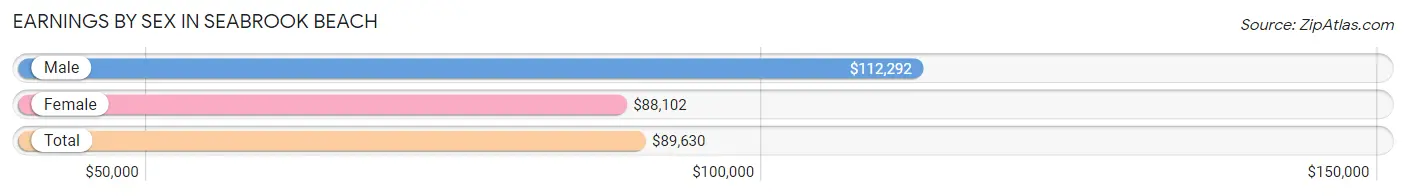
Earnings by Sex in Seabrook Beach
Average Earnings in Seabrook Beach are $89,630, $112,292 for men and $88,102 for women, a difference of 21.5%.
| Sex | Number | Average Earnings |
| Male | 275 (55.4%) | $112,292 |
| Female | 221 (44.6%) | $88,102 |
| Total | 496 (100.0%) | $89,630 |
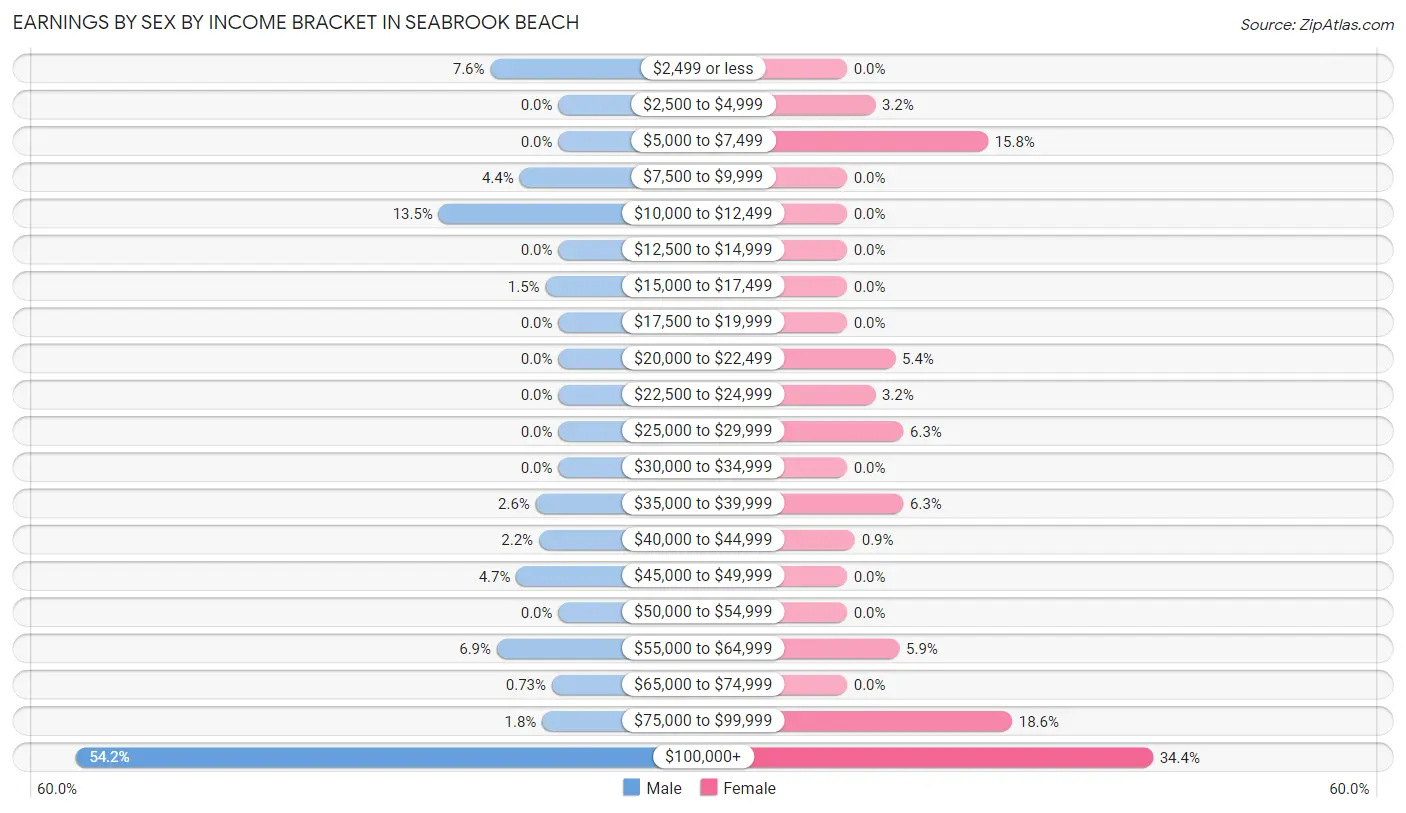
Earnings by Sex by Income Bracket in Seabrook Beach
The most common earnings brackets in Seabrook Beach are $100,000+ for men (149 | 54.2%) and $100,000+ for women (76 | 34.4%).
| Income | Male | Female |
| $2,499 or less | 21 (7.6%) | 0 (0.0%) |
| $2,500 to $4,999 | 0 (0.0%) | 7 (3.2%) |
| $5,000 to $7,499 | 0 (0.0%) | 35 (15.8%) |
| $7,500 to $9,999 | 12 (4.4%) | 0 (0.0%) |
| $10,000 to $12,499 | 37 (13.5%) | 0 (0.0%) |
| $12,500 to $14,999 | 0 (0.0%) | 0 (0.0%) |
| $15,000 to $17,499 | 4 (1.5%) | 0 (0.0%) |
| $17,500 to $19,999 | 0 (0.0%) | 0 (0.0%) |
| $20,000 to $22,499 | 0 (0.0%) | 12 (5.4%) |
| $22,500 to $24,999 | 0 (0.0%) | 7 (3.2%) |
| $25,000 to $29,999 | 0 (0.0%) | 14 (6.3%) |
| $30,000 to $34,999 | 0 (0.0%) | 0 (0.0%) |
| $35,000 to $39,999 | 7 (2.5%) | 14 (6.3%) |
| $40,000 to $44,999 | 6 (2.2%) | 2 (0.9%) |
| $45,000 to $49,999 | 13 (4.7%) | 0 (0.0%) |
| $50,000 to $54,999 | 0 (0.0%) | 0 (0.0%) |
| $55,000 to $64,999 | 19 (6.9%) | 13 (5.9%) |
| $65,000 to $74,999 | 2 (0.7%) | 0 (0.0%) |
| $75,000 to $99,999 | 5 (1.8%) | 41 (18.5%) |
| $100,000+ | 149 (54.2%) | 76 (34.4%) |
| Total | 275 (100.0%) | 221 (100.0%) |
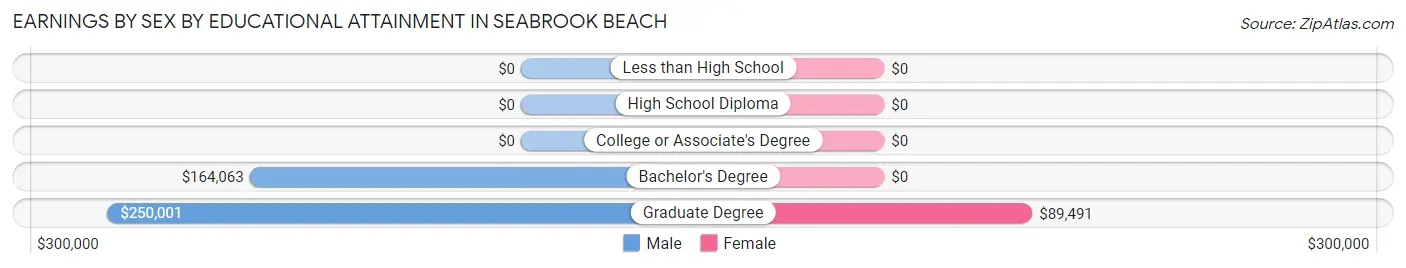
Earnings by Sex by Educational Attainment in Seabrook Beach
Average earnings in Seabrook Beach are $145,536 for men and $89,537 for women, a difference of 38.5%. Men with an educational attainment of graduate degree enjoy the highest average annual earnings of $250,001, while those with bachelor's degree education earn the least with $164,063. Women with an educational attainment of graduate degree earn the most with the average annual earnings of $89,491, while those with graduate degree education have the smallest earnings of $89,491.
| Educational Attainment | Male Income | Female Income |
| Less than High School | - | - |
| High School Diploma | - | - |
| College or Associate's Degree | - | - |
| Bachelor's Degree | $164,063 | $0 |
| Graduate Degree | $250,001 | $89,491 |
| Total | $145,536 | $89,537 |
Family Income in Seabrook Beach
Family Income Brackets in Seabrook Beach
According to the Seabrook Beach family income data, there are 130 families falling into the $200,000+ income range, which is the most common income bracket and makes up 49.6% of all families.
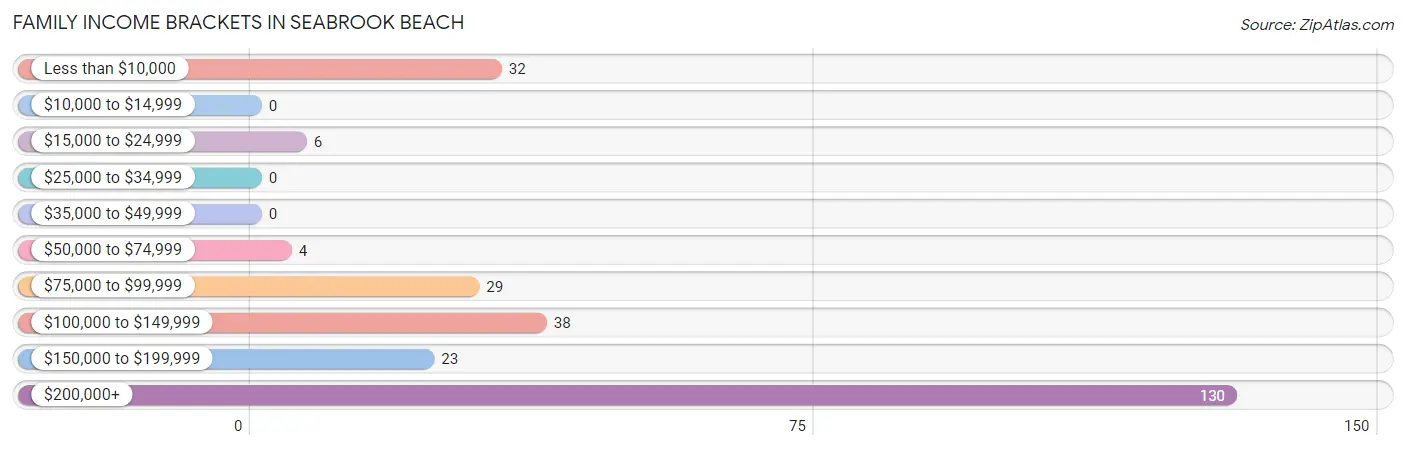
| Income Bracket | # Families | % Families |
| Less than $10,000 | 32 | 12.2% |
| $10,000 to $14,999 | 0 | 0.0% |
| $15,000 to $24,999 | 6 | 2.3% |
| $25,000 to $34,999 | 0 | 0.0% |
| $35,000 to $49,999 | 0 | 0.0% |
| $50,000 to $74,999 | 4 | 1.5% |
| $75,000 to $99,999 | 29 | 11.1% |
| $100,000 to $149,999 | 38 | 14.5% |
| $150,000 to $199,999 | 23 | 8.8% |
| $200,000+ | 130 | 49.6% |
Family Income by Famaliy Size in Seabrook Beach
3-person families (39 | 14.9%) account for the highest median family income in Seabrook Beach with $250,001 per family, while 3-person families (39 | 14.9%) have the highest median income of $83,334 per family member.
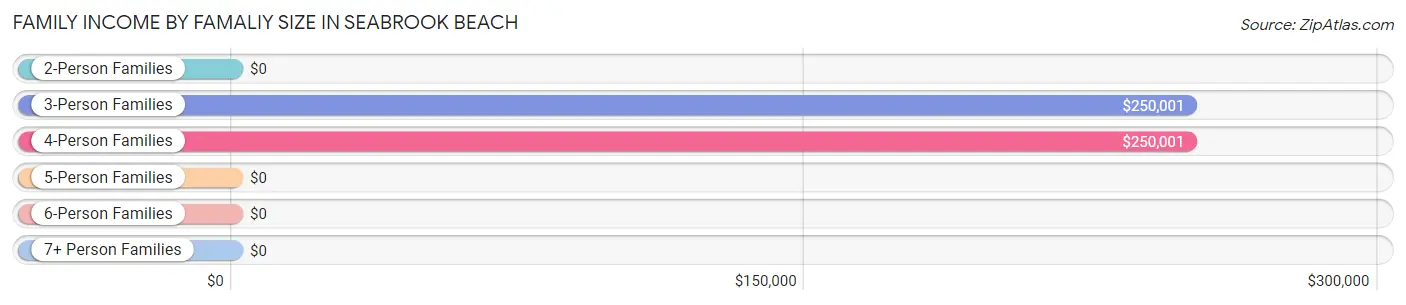
| Income Bracket | # Families | Median Income |
| 2-Person Families | 209 (79.8%) | $0 |
| 3-Person Families | 39 (14.9%) | $250,001 |
| 4-Person Families | 14 (5.3%) | $250,001 |
| 5-Person Families | 0 (0.0%) | $0 |
| 6-Person Families | 0 (0.0%) | $0 |
| 7+ Person Families | 0 (0.0%) | $0 |
| Total | 262 (100.0%) | $197,321 |
Family Income by Number of Earners in Seabrook Beach
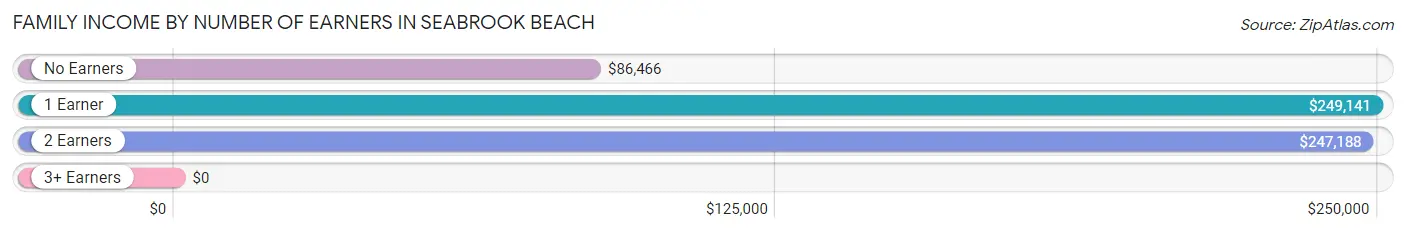
| Number of Earners | # Families | Median Income |
| No Earners | 70 (26.7%) | $86,466 |
| 1 Earner | 92 (35.1%) | $249,141 |
| 2 Earners | 81 (30.9%) | $247,188 |
| 3+ Earners | 19 (7.2%) | $0 |
| Total | 262 (100.0%) | $197,321 |
Household Income in Seabrook Beach
Household Income Brackets in Seabrook Beach
With 152 households falling in the category, the $200,000+ income range is the most frequent in Seabrook Beach, accounting for 30.5% of all households.
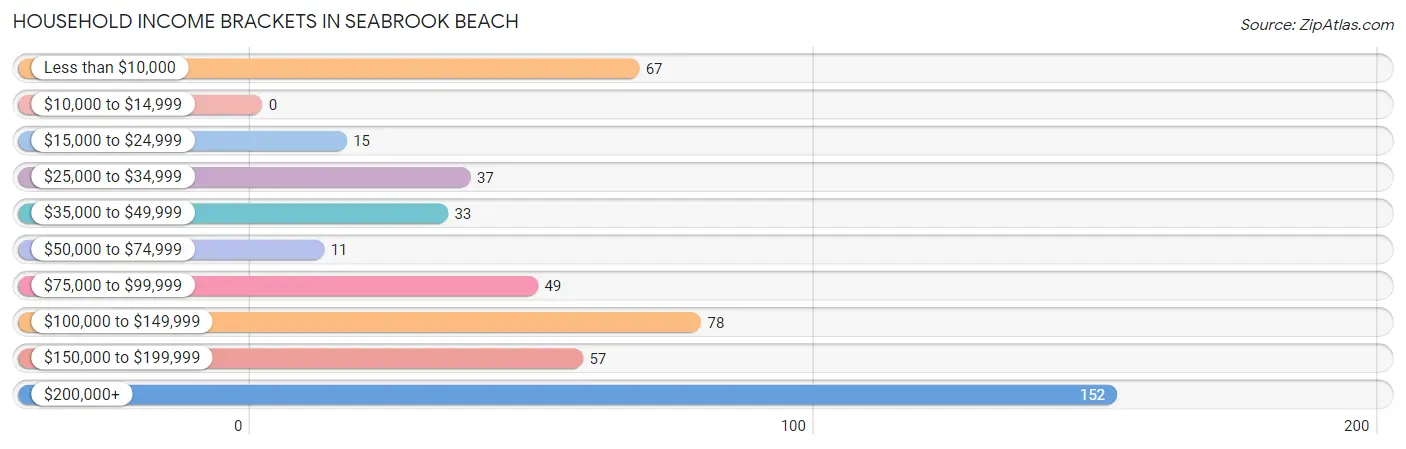
| Income Bracket | # Households | % Households |
| Less than $10,000 | 67 | 13.4% |
| $10,000 to $14,999 | 0 | 0.0% |
| $15,000 to $24,999 | 15 | 3.0% |
| $25,000 to $34,999 | 37 | 7.4% |
| $35,000 to $49,999 | 33 | 6.6% |
| $50,000 to $74,999 | 11 | 2.2% |
| $75,000 to $99,999 | 49 | 9.8% |
| $100,000 to $149,999 | 78 | 15.6% |
| $150,000 to $199,999 | 57 | 11.4% |
| $200,000+ | 152 | 30.5% |
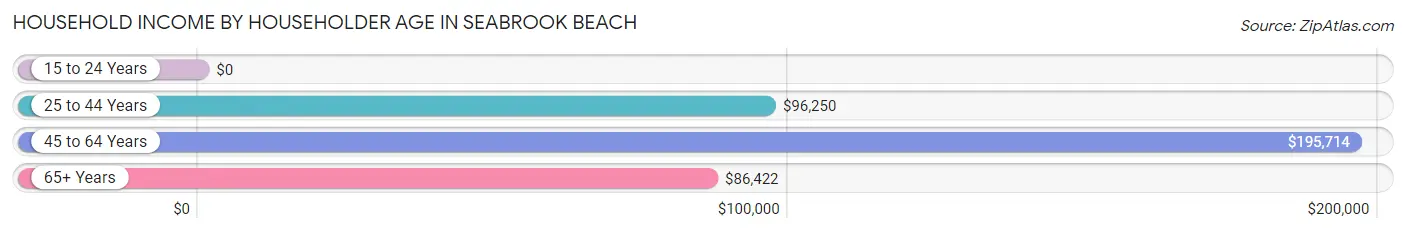
Household Income by Householder Age in Seabrook Beach
The median household income in Seabrook Beach is $107,019, with the highest median household income of $195,714 found in the 45 to 64 years age bracket for the primary householder. A total of 262 households (52.5%) fall into this category.
| Income Bracket | # Households | Median Income |
| 15 to 24 Years | 0 (0.0%) | $0 |
| 25 to 44 Years | 32 (6.4%) | $96,250 |
| 45 to 64 Years | 262 (52.5%) | $195,714 |
| 65+ Years | 205 (41.1%) | $86,422 |
| Total | 499 (100.0%) | $107,019 |
Poverty in Seabrook Beach
Income Below Poverty by Sex and Age in Seabrook Beach
With 10.7% poverty level for males and 17.9% for females among the residents of Seabrook Beach, under 5 year old males and 25 to 34 year old females are the most vulnerable to poverty, with 19 males (86.4%) and 20 females (100.0%) in their respective age groups living below the poverty level.
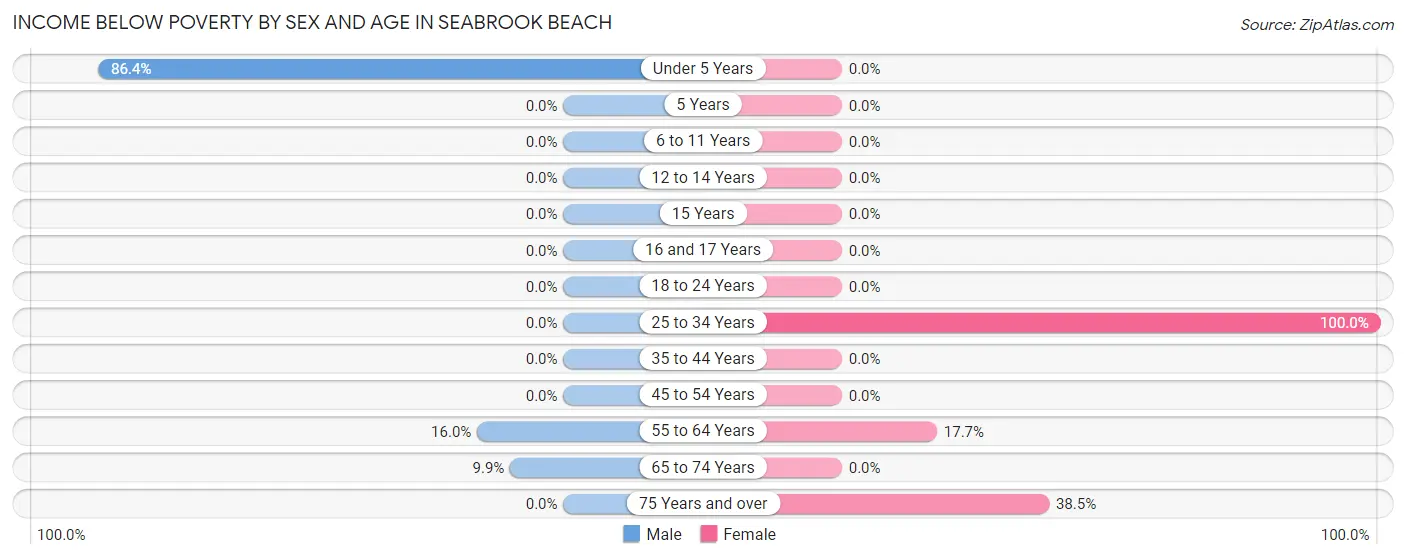
| Age Bracket | Male | Female |
| Under 5 Years | 19 (86.4%) | 0 (0.0%) |
| 5 Years | 0 (0.0%) | 0 (0.0%) |
| 6 to 11 Years | 0 (0.0%) | 0 (0.0%) |
| 12 to 14 Years | 0 (0.0%) | 0 (0.0%) |
| 15 Years | 0 (0.0%) | 0 (0.0%) |
| 16 and 17 Years | 0 (0.0%) | 0 (0.0%) |
| 18 to 24 Years | 0 (0.0%) | 0 (0.0%) |
| 25 to 34 Years | 0 (0.0%) | 20 (100.0%) |
| 35 to 44 Years | 0 (0.0%) | 0 (0.0%) |
| 45 to 54 Years | 0 (0.0%) | 0 (0.0%) |
| 55 to 64 Years | 12 (16.0%) | 18 (17.6%) |
| 65 to 74 Years | 15 (9.9%) | 0 (0.0%) |
| 75 Years and over | 0 (0.0%) | 40 (38.5%) |
| Total | 46 (10.7%) | 78 (17.9%) |
Income Above Poverty by Sex and Age in Seabrook Beach
According to the poverty statistics in Seabrook Beach, males aged 16 and 17 years and females aged under 5 years are the age groups that are most secure financially, with 100.0% of males and 100.0% of females in these age groups living above the poverty line.
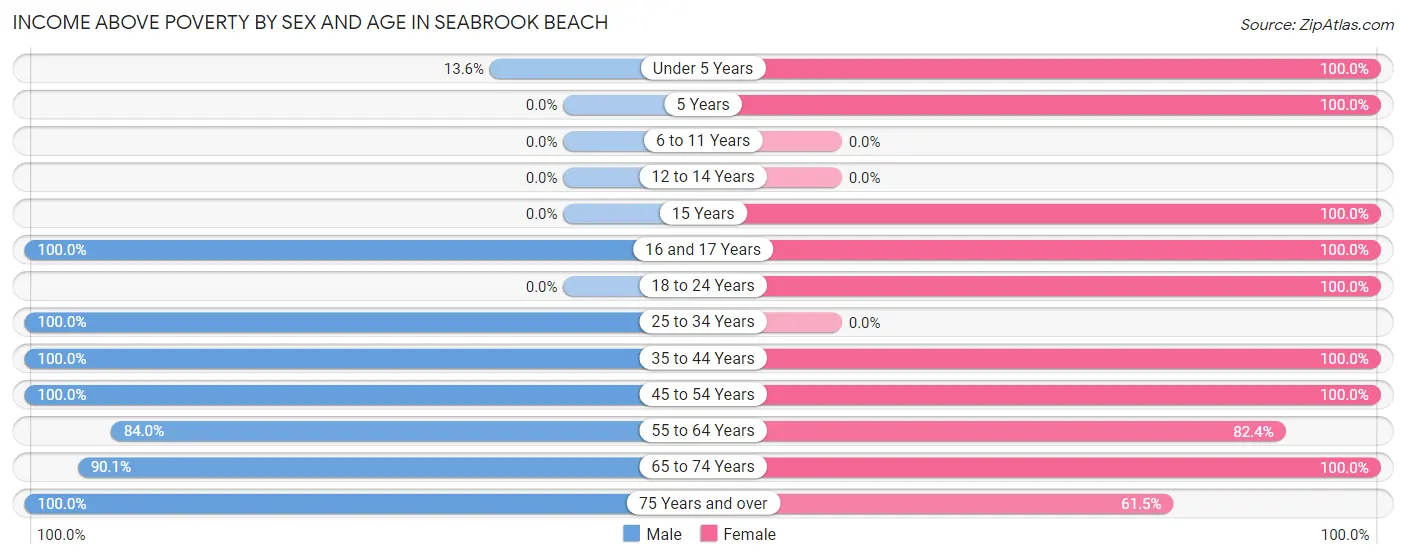
| Age Bracket | Male | Female |
| Under 5 Years | 3 (13.6%) | 1 (100.0%) |
| 5 Years | 0 (0.0%) | 1 (100.0%) |
| 6 to 11 Years | 0 (0.0%) | 0 (0.0%) |
| 12 to 14 Years | 0 (0.0%) | 0 (0.0%) |
| 15 Years | 0 (0.0%) | 14 (100.0%) |
| 16 and 17 Years | 17 (100.0%) | 11 (100.0%) |
| 18 to 24 Years | 0 (0.0%) | 31 (100.0%) |
| 25 to 34 Years | 7 (100.0%) | 0 (0.0%) |
| 35 to 44 Years | 5 (100.0%) | 8 (100.0%) |
| 45 to 54 Years | 93 (100.0%) | 79 (100.0%) |
| 55 to 64 Years | 63 (84.0%) | 84 (82.4%) |
| 65 to 74 Years | 137 (90.1%) | 65 (100.0%) |
| 75 Years and over | 57 (100.0%) | 64 (61.5%) |
| Total | 382 (89.2%) | 358 (82.1%) |
Income Below Poverty Among Married-Couple Families in Seabrook Beach
The poverty statistics for married-couple families in Seabrook Beach show that 5.9% or 12 of the total 203 families live below the poverty line. Families with no children have the highest poverty rate of 7.5%, comprising of 12 families. On the other hand, families with 1 or 2 children have the lowest poverty rate of 0.0%, which includes 0 families.
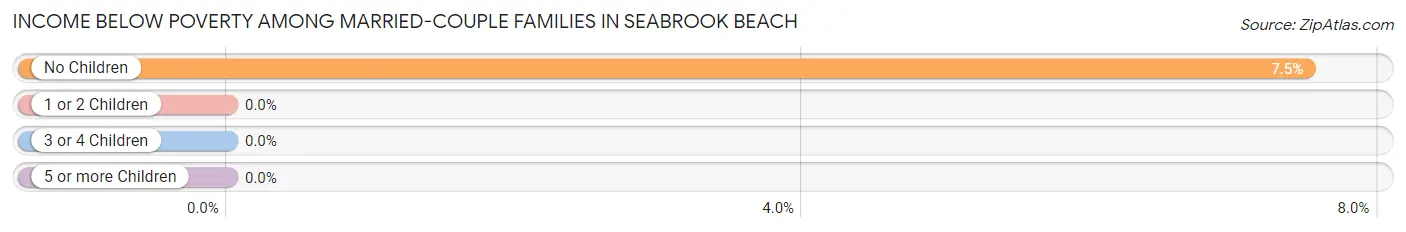
| Children | Above Poverty | Below Poverty |
| No Children | 148 (92.5%) | 12 (7.5%) |
| 1 or 2 Children | 43 (100.0%) | 0 (0.0%) |
| 3 or 4 Children | 0 (0.0%) | 0 (0.0%) |
| 5 or more Children | 0 (0.0%) | 0 (0.0%) |
| Total | 191 (94.1%) | 12 (5.9%) |
Income Below Poverty Among Single-Parent Households in Seabrook Beach
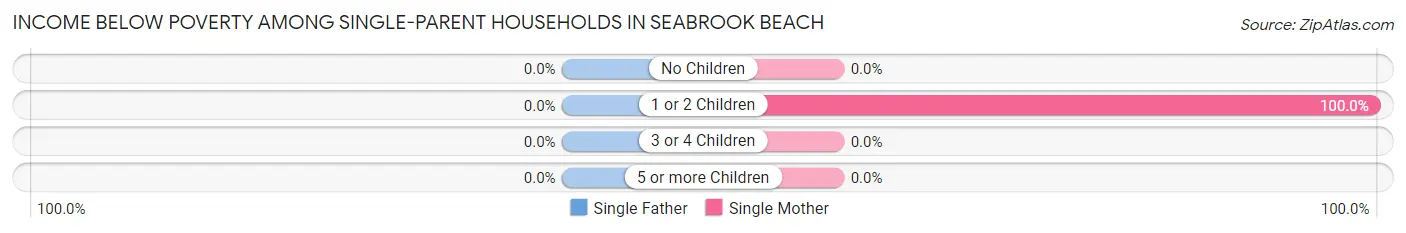
| Children | Single Father | Single Mother |
| No Children | 0 (0.0%) | 0 (0.0%) |
| 1 or 2 Children | 0 (0.0%) | 20 (100.0%) |
| 3 or 4 Children | 0 (0.0%) | 0 (0.0%) |
| 5 or more Children | 0 (0.0%) | 0 (0.0%) |
| Total | 0 (0.0%) | 20 (38.5%) |
Income Below Poverty Among Married-Couple vs Single-Parent Households in Seabrook Beach
The poverty data for Seabrook Beach shows that 12 of the married-couple family households (5.9%) and 20 of the single-parent households (33.9%) are living below the poverty level. Within the married-couple family households, those with no children have the highest poverty rate, with 12 households (7.5%) falling below the poverty line. Among the single-parent households, those with 1 or 2 children have the highest poverty rate, with 20 household (100.0%) living below poverty.
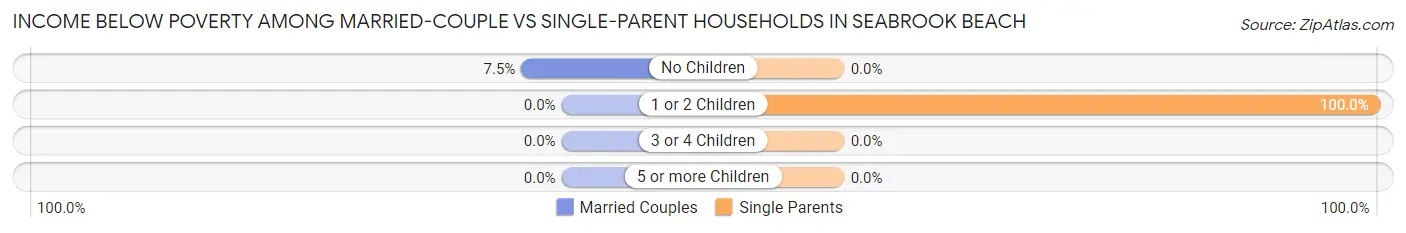
| Children | Married-Couple Families | Single-Parent Households |
| No Children | 12 (7.5%) | 0 (0.0%) |
| 1 or 2 Children | 0 (0.0%) | 20 (100.0%) |
| 3 or 4 Children | 0 (0.0%) | 0 (0.0%) |
| 5 or more Children | 0 (0.0%) | 0 (0.0%) |
| Total | 12 (5.9%) | 20 (33.9%) |
Race in Seabrook Beach
The most populous races in Seabrook Beach are White / Caucasian (859 | 99.4%), Hispanic or Latino (5 | 0.6%), and Two or more Races (3 | 0.4%).
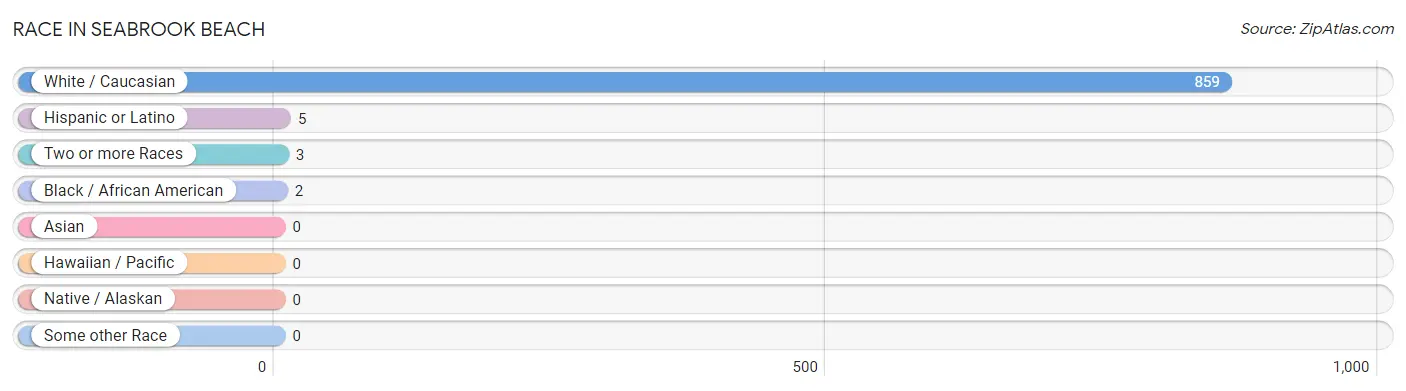
| Race | # Population | % Population |
| Asian | 0 | 0.0% |
| Black / African American | 2 | 0.2% |
| Hawaiian / Pacific | 0 | 0.0% |
| Hispanic or Latino | 5 | 0.6% |
| Native / Alaskan | 0 | 0.0% |
| White / Caucasian | 859 | 99.4% |
| Two or more Races | 3 | 0.4% |
| Some other Race | 0 | 0.0% |
| Total | 864 | 100.0% |
Ancestry in Seabrook Beach
The most populous ancestries reported in Seabrook Beach are Irish (340 | 39.4%), English (161 | 18.6%), Italian (144 | 16.7%), French (93 | 10.8%), and French Canadian (74 | 8.6%), together accounting for 94.0% of all Seabrook Beach residents.
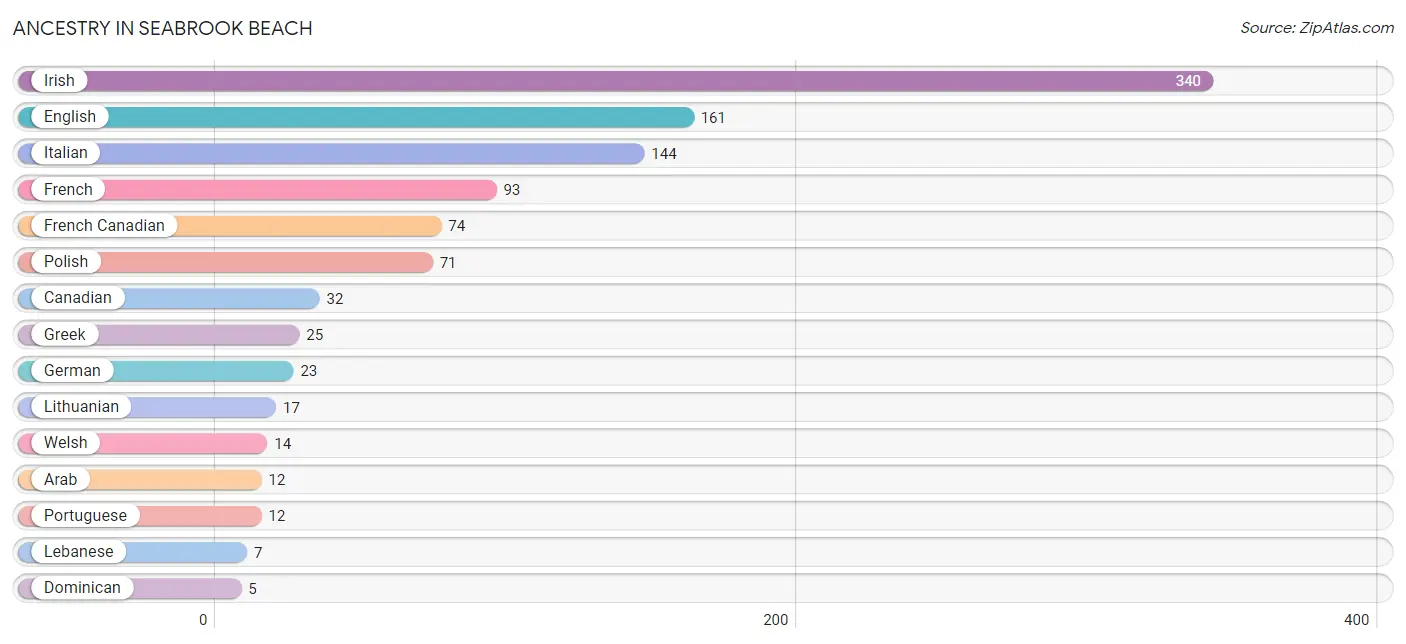
| Ancestry | # Population | % Population |
| Arab | 12 | 1.4% |
| Canadian | 32 | 3.7% |
| Czech | 3 | 0.4% |
| Dominican | 5 | 0.6% |
| English | 161 | 18.6% |
| Finnish | 5 | 0.6% |
| French | 93 | 10.8% |
| French Canadian | 74 | 8.6% |
| German | 23 | 2.7% |
| Greek | 25 | 2.9% |
| Haitian | 2 | 0.2% |
| Irish | 340 | 39.4% |
| Italian | 144 | 16.7% |
| Lebanese | 7 | 0.8% |
| Lithuanian | 17 | 2.0% |
| Polish | 71 | 8.2% |
| Portuguese | 12 | 1.4% |
| Scandinavian | 5 | 0.6% |
| Welsh | 14 | 1.6% | View All 19 Rows |
Immigrants in Seabrook Beach
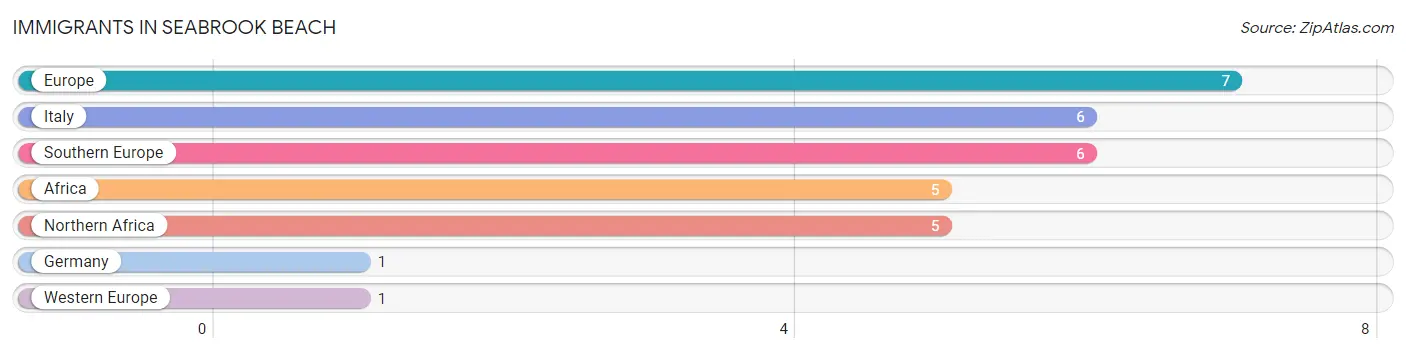
The most numerous immigrant groups reported in Seabrook Beach came from Europe (7 | 0.8%), Italy (6 | 0.7%), Southern Europe (6 | 0.7%), Africa (5 | 0.6%), and Northern Africa (5 | 0.6%), together accounting for 3.4% of all Seabrook Beach residents.
| Immigration Origin | # Population | % Population |
| Africa | 5 | 0.6% |
| Europe | 7 | 0.8% |
| Germany | 1 | 0.1% |
| Italy | 6 | 0.7% |
| Northern Africa | 5 | 0.6% |
| Southern Europe | 6 | 0.7% |
| Western Europe | 1 | 0.1% | View All 7 Rows |
Sex and Age in Seabrook Beach
Sex and Age in Seabrook Beach
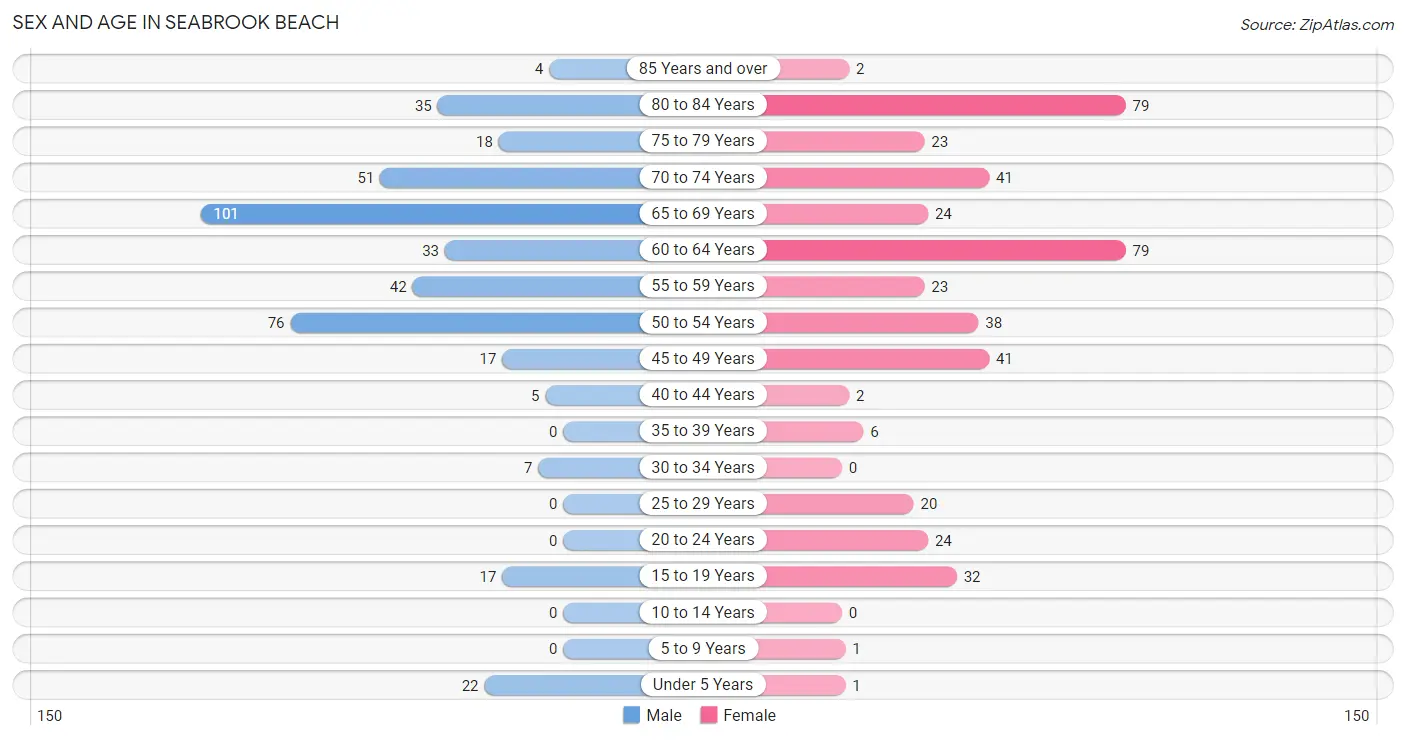
The most populous age groups in Seabrook Beach are 65 to 69 Years (101 | 23.6%) for men and 60 to 64 Years (79 | 18.1%) for women.
| Age Bracket | Male | Female |
| Under 5 Years | 22 (5.1%) | 1 (0.2%) |
| 5 to 9 Years | 0 (0.0%) | 1 (0.2%) |
| 10 to 14 Years | 0 (0.0%) | 0 (0.0%) |
| 15 to 19 Years | 17 (4.0%) | 32 (7.3%) |
| 20 to 24 Years | 0 (0.0%) | 24 (5.5%) |
| 25 to 29 Years | 0 (0.0%) | 20 (4.6%) |
| 30 to 34 Years | 7 (1.6%) | 0 (0.0%) |
| 35 to 39 Years | 0 (0.0%) | 6 (1.4%) |
| 40 to 44 Years | 5 (1.2%) | 2 (0.5%) |
| 45 to 49 Years | 17 (4.0%) | 41 (9.4%) |
| 50 to 54 Years | 76 (17.8%) | 38 (8.7%) |
| 55 to 59 Years | 42 (9.8%) | 23 (5.3%) |
| 60 to 64 Years | 33 (7.7%) | 79 (18.1%) |
| 65 to 69 Years | 101 (23.6%) | 24 (5.5%) |
| 70 to 74 Years | 51 (11.9%) | 41 (9.4%) |
| 75 to 79 Years | 18 (4.2%) | 23 (5.3%) |
| 80 to 84 Years | 35 (8.2%) | 79 (18.1%) |
| 85 Years and over | 4 (0.9%) | 2 (0.5%) |
| Total | 428 (100.0%) | 436 (100.0%) |
Families and Households in Seabrook Beach
Median Family Size in Seabrook Beach
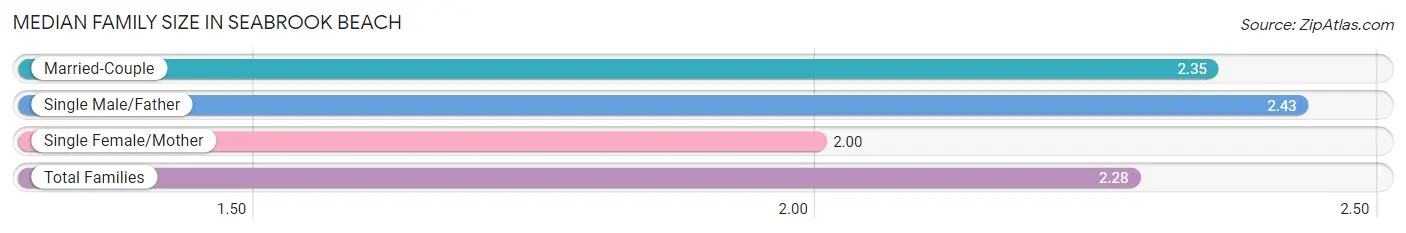
The median family size in Seabrook Beach is 2.28 persons per family, with single male/father families (7 | 2.7%) accounting for the largest median family size of 2.43 persons per family. On the other hand, single female/mother families (52 | 19.9%) represent the smallest median family size with 2.00 persons per family.
| Family Type | # Families | Family Size |
| Married-Couple | 203 (77.5%) | 2.35 |
| Single Male/Father | 7 (2.7%) | 2.43 |
| Single Female/Mother | 52 (19.9%) | 2.00 |
| Total Families | 262 (100.0%) | 2.28 |
Median Household Size in Seabrook Beach
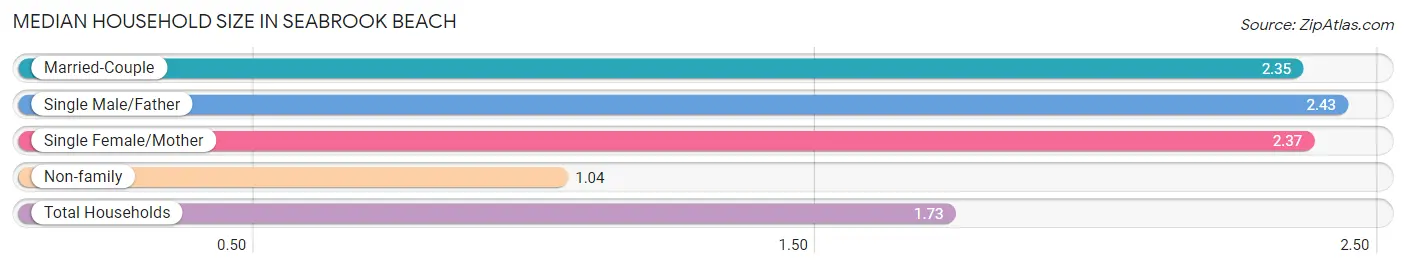
The median household size in Seabrook Beach is 1.73 persons per household, with single male/father households (7 | 1.4%) accounting for the largest median household size of 2.43 persons per household. non-family households (237 | 47.5%) represent the smallest median household size with 1.04 persons per household.
| Household Type | # Households | Household Size |
| Married-Couple | 203 (40.7%) | 2.35 |
| Single Male/Father | 7 (1.4%) | 2.43 |
| Single Female/Mother | 52 (10.4%) | 2.37 |
| Non-family | 237 (47.5%) | 1.04 |
| Total Households | 499 (100.0%) | 1.73 |
Household Size by Marriage Status in Seabrook Beach
Out of a total of 499 households in Seabrook Beach, 262 (52.5%) are family households, while 237 (47.5%) are nonfamily households. The most numerous type of family households are 2-person households, comprising 189, and the most common type of nonfamily households are 1-person households, comprising 232.
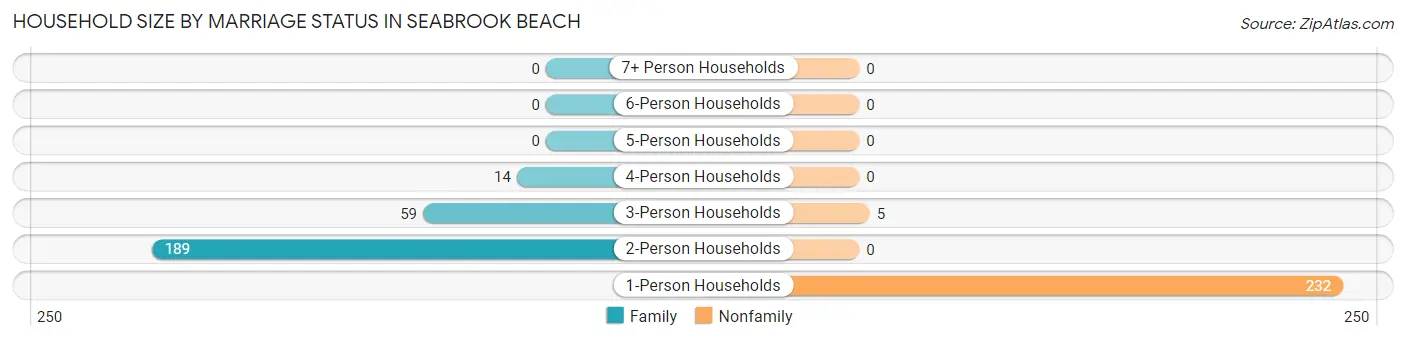
| Household Size | Family Households | Nonfamily Households |
| 1-Person Households | - | 232 (46.5%) |
| 2-Person Households | 189 (37.9%) | 0 (0.0%) |
| 3-Person Households | 59 (11.8%) | 5 (1.0%) |
| 4-Person Households | 14 (2.8%) | 0 (0.0%) |
| 5-Person Households | 0 (0.0%) | 0 (0.0%) |
| 6-Person Households | 0 (0.0%) | 0 (0.0%) |
| 7+ Person Households | 0 (0.0%) | 0 (0.0%) |
| Total | 262 (52.5%) | 237 (47.5%) |
Female Fertility in Seabrook Beach
Fertility by Age in Seabrook Beach
Average fertility rate in Seabrook Beach is 132.0 births per 1,000 women. Women in the age bracket of 20 to 34 years have the highest fertility rate with 455.0 births per 1,000 women. Women in the age bracket of 20 to 34 years acount for 100.0% of all women with births.
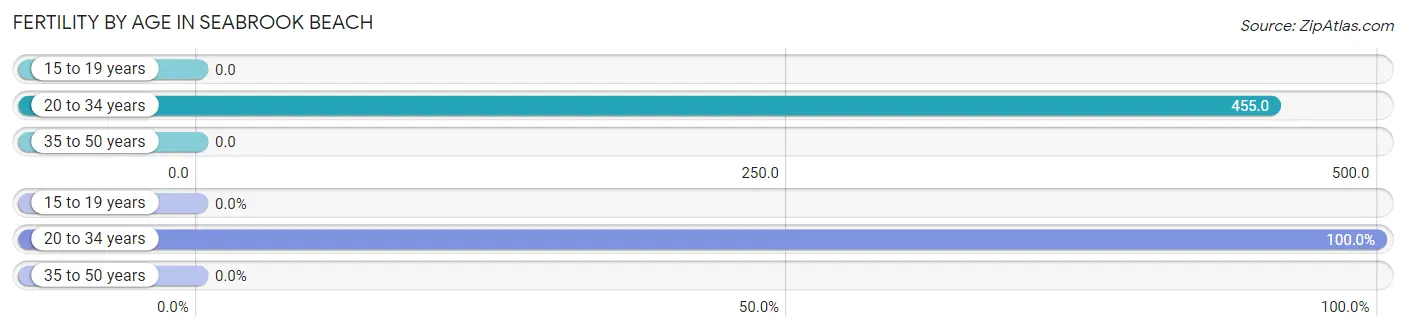
| Age Bracket | Women with Births | Births / 1,000 Women |
| 15 to 19 years | 0 (0.0%) | 0.0 |
| 20 to 34 years | 20 (100.0%) | 455.0 |
| 35 to 50 years | 0 (0.0%) | 0.0 |
| Total | 20 (100.0%) | 132.0 |
Fertility by Age by Marriage Status in Seabrook Beach
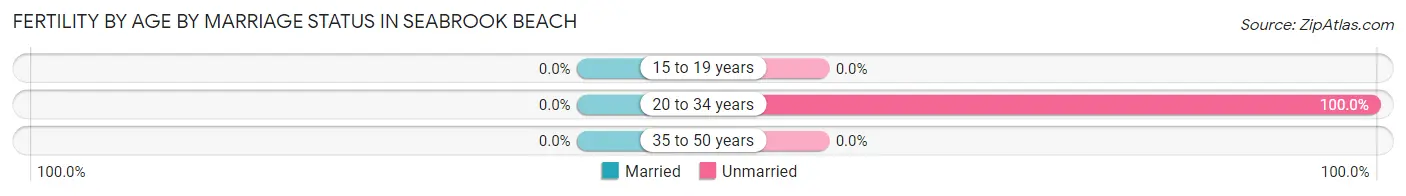
| Age Bracket | Married | Unmarried |
| 15 to 19 years | 0 (0.0%) | 0 (0.0%) |
| 20 to 34 years | 0 (0.0%) | 20 (100.0%) |
| 35 to 50 years | 0 (0.0%) | 0 (0.0%) |
| Total | 0 (0.0%) | 20 (100.0%) |
Fertility by Education in Seabrook Beach
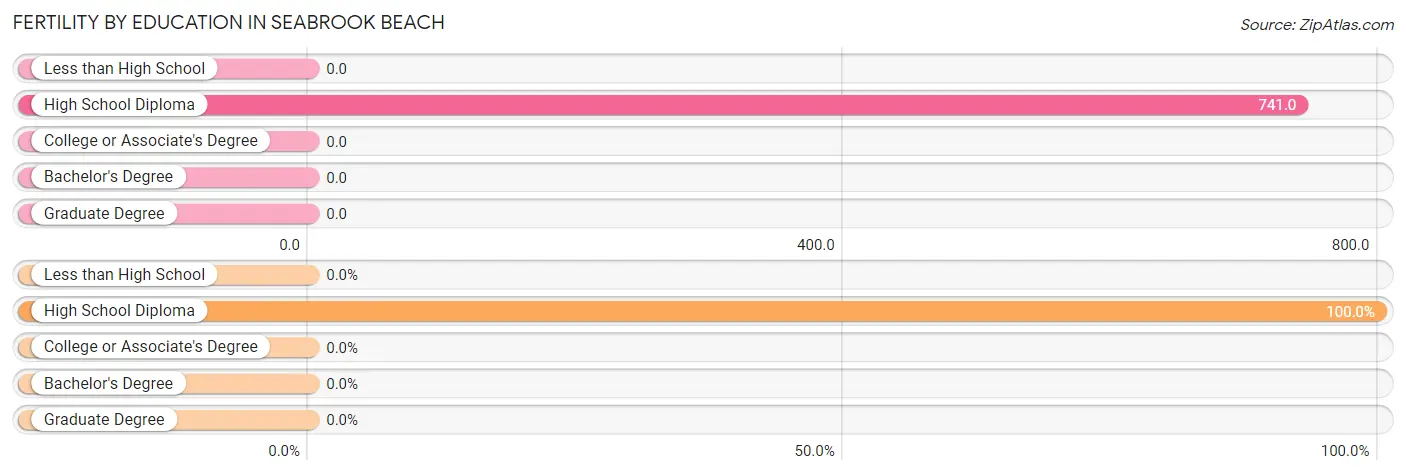
| Educational Attainment | Women with Births | Births / 1,000 Women |
| Less than High School | 0 (0.0%) | 0.0 |
| High School Diploma | 20 (100.0%) | 741.0 |
| College or Associate's Degree | 0 (0.0%) | 0.0 |
| Bachelor's Degree | 0 (0.0%) | 0.0 |
| Graduate Degree | 0 (0.0%) | 0.0 |
| Total | 20 (100.0%) | 132.0 |
Fertility by Education by Marriage Status in Seabrook Beach
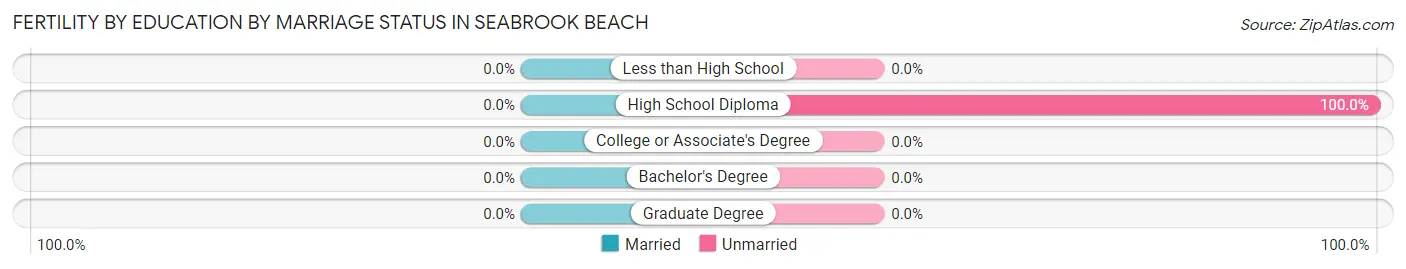
| Educational Attainment | Married | Unmarried |
| Less than High School | 0 (0.0%) | 0 (0.0%) |
| High School Diploma | 0 (0.0%) | 20 (100.0%) |
| College or Associate's Degree | 0 (0.0%) | 0 (0.0%) |
| Bachelor's Degree | 0 (0.0%) | 0 (0.0%) |
| Graduate Degree | 0 (0.0%) | 0 (0.0%) |
| Total | 0 (0.0%) | 20 (100.0%) |
Employment Characteristics in Seabrook Beach
Employment by Class of Employer in Seabrook Beach
Among the 406 employed individuals in Seabrook Beach, private company employees (292 | 71.9%), not-for-profit organizations (43 | 10.6%), and federal government employees (31 | 7.6%) make up the most common classes of employment.
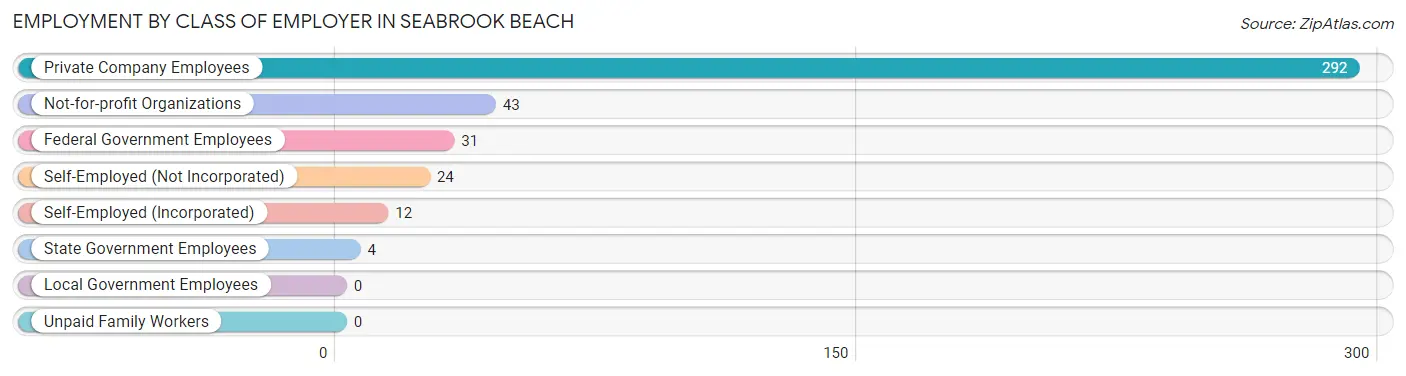
| Employer Class | # Employees | % Employees |
| Private Company Employees | 292 | 71.9% |
| Self-Employed (Incorporated) | 12 | 3.0% |
| Self-Employed (Not Incorporated) | 24 | 5.9% |
| Not-for-profit Organizations | 43 | 10.6% |
| Local Government Employees | 0 | 0.0% |
| State Government Employees | 4 | 1.0% |
| Federal Government Employees | 31 | 7.6% |
| Unpaid Family Workers | 0 | 0.0% |
| Total | 406 | 100.0% |
Employment Status by Age in Seabrook Beach
According to the labor force statistics for Seabrook Beach, out of the total population over 16 years of age (826), 53.6% or 443 individuals are in the labor force, with 8.4% or 37 of them unemployed. The age group with the highest labor force participation rate is 20 to 24 years, with 100.0% or 24 individuals in the labor force. Within the labor force, the 45 to 54 years age range has the highest percentage of unemployed individuals, with 24.5% or 37 of them being unemployed.
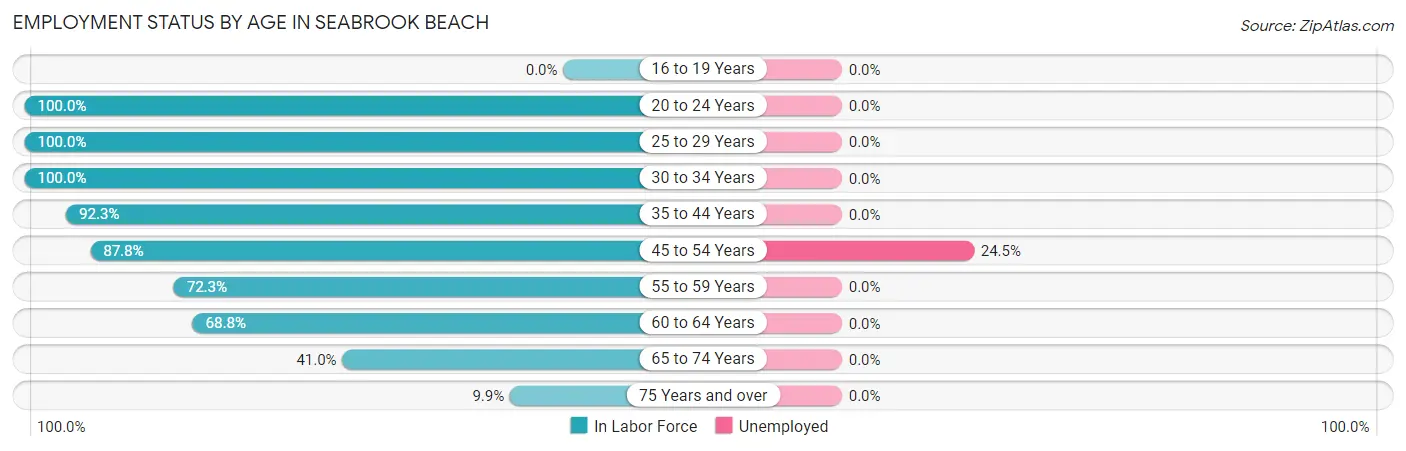
| Age Bracket | In Labor Force | Unemployed |
| 16 to 19 Years | 0 (0.0%) | 0 (0.0%) |
| 20 to 24 Years | 24 (100.0%) | 0 (0.0%) |
| 25 to 29 Years | 20 (100.0%) | 0 (0.0%) |
| 30 to 34 Years | 7 (100.0%) | 0 (0.0%) |
| 35 to 44 Years | 12 (92.3%) | 0 (0.0%) |
| 45 to 54 Years | 151 (87.8%) | 37 (24.5%) |
| 55 to 59 Years | 47 (72.3%) | 0 (0.0%) |
| 60 to 64 Years | 77 (68.8%) | 0 (0.0%) |
| 65 to 74 Years | 89 (41.0%) | 0 (0.0%) |
| 75 Years and over | 16 (9.9%) | 0 (0.0%) |
| Total | 443 (53.6%) | 37 (8.4%) |
Employment Status by Educational Attainment in Seabrook Beach
According to labor force statistics for Seabrook Beach, 80.7% of individuals (314) out of the total population between 25 and 64 years of age (389) are in the labor force, with 11.8% or 37 of them being unemployed. The group with the highest labor force participation rate are those with the educational attainment of less than high school, with 100.0% or 12 individuals in the labor force. Within the labor force, individuals with college / associate degree education have the highest percentage of unemployment, with 37.0% or 37 of them being unemployed.
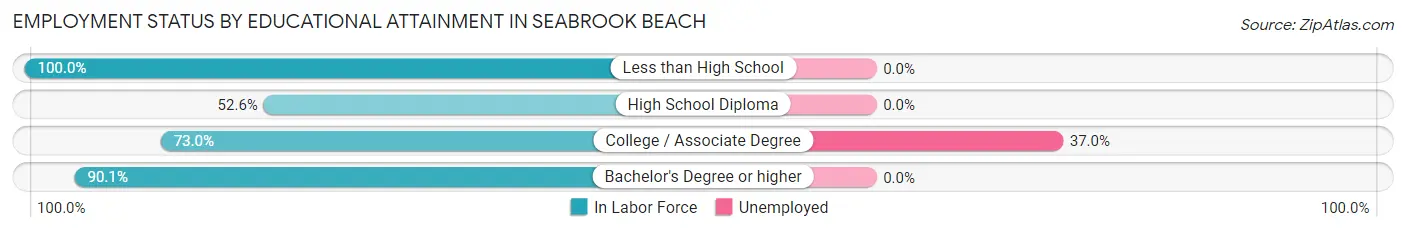
| Educational Attainment | In Labor Force | Unemployed |
| Less than High School | 12 (100.0%) | 0 (0.0%) |
| High School Diploma | 20 (52.6%) | 0 (0.0%) |
| College / Associate Degree | 100 (73.0%) | 51 (37.0%) |
| Bachelor's Degree or higher | 182 (90.1%) | 0 (0.0%) |
| Total | 314 (80.7%) | 46 (11.8%) |
Employment Occupations by Sex in Seabrook Beach
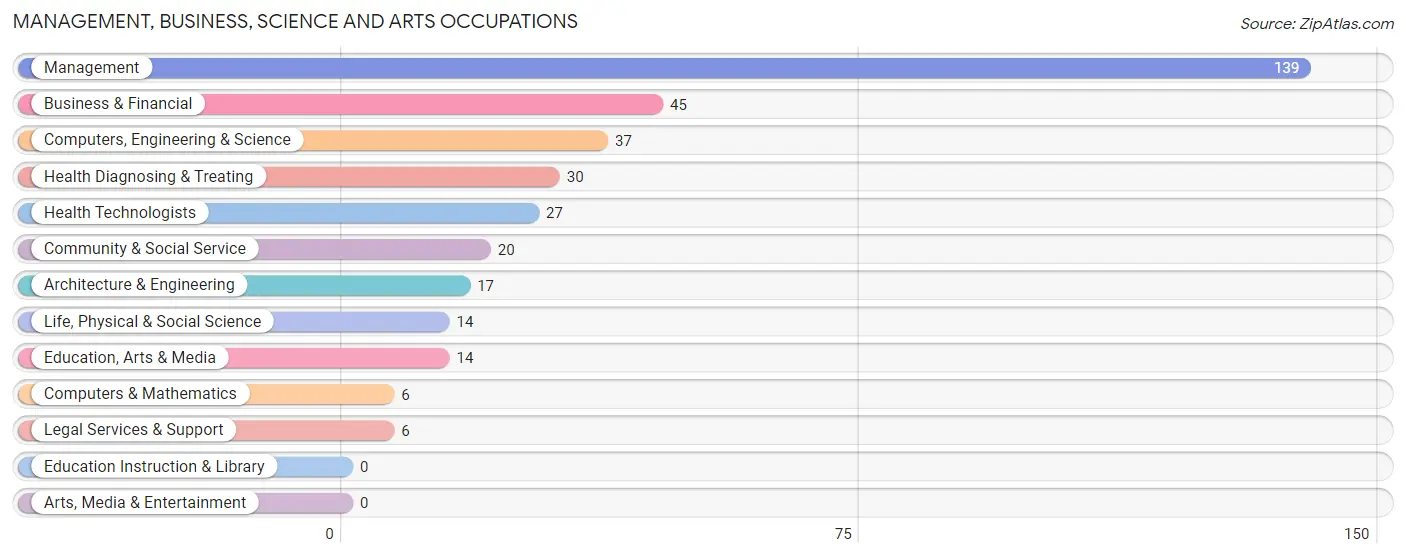
Management, Business, Science and Arts Occupations
The most common Management, Business, Science and Arts occupations in Seabrook Beach are Management (139 | 34.2%), Business & Financial (45 | 11.1%), Computers, Engineering & Science (37 | 9.1%), Health Diagnosing & Treating (30 | 7.4%), and Health Technologists (27 | 6.7%).
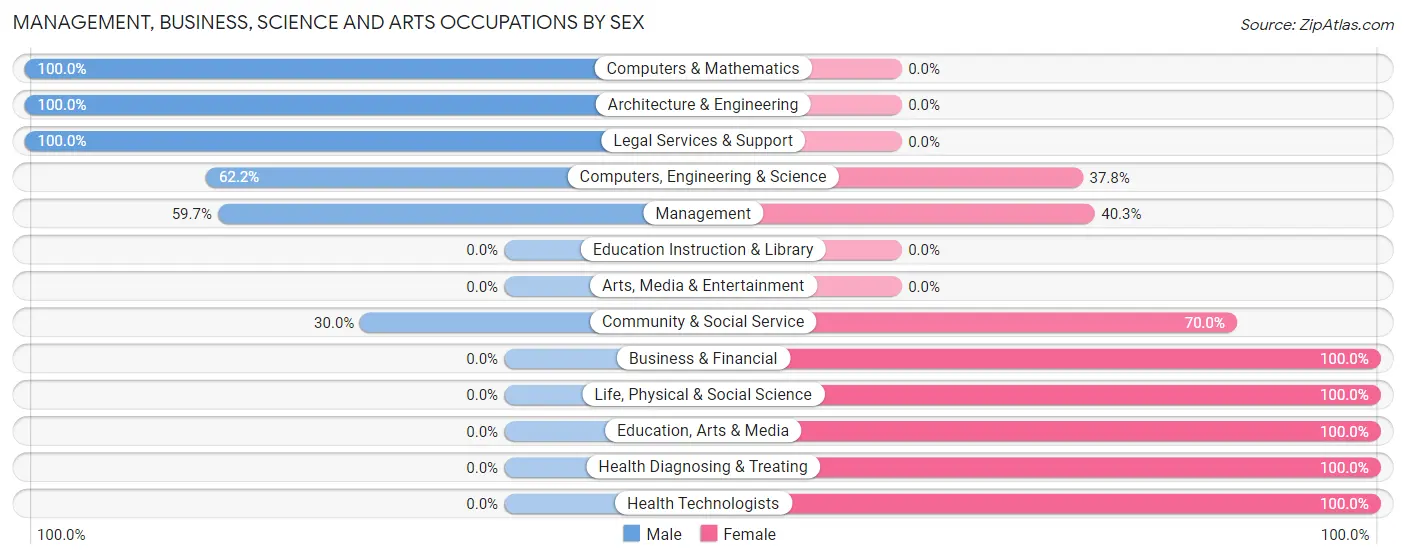
Management, Business, Science and Arts Occupations by Sex
Within the Management, Business, Science and Arts occupations in Seabrook Beach, the most male-oriented occupations are Computers & Mathematics (100.0%), Architecture & Engineering (100.0%), and Legal Services & Support (100.0%), while the most female-oriented occupations are Business & Financial (100.0%), Life, Physical & Social Science (100.0%), and Education, Arts & Media (100.0%).
| Occupation | Male | Female |
| Management | 83 (59.7%) | 56 (40.3%) |
| Business & Financial | 0 (0.0%) | 45 (100.0%) |
| Computers, Engineering & Science | 23 (62.2%) | 14 (37.8%) |
| Computers & Mathematics | 6 (100.0%) | 0 (0.0%) |
| Architecture & Engineering | 17 (100.0%) | 0 (0.0%) |
| Life, Physical & Social Science | 0 (0.0%) | 14 (100.0%) |
| Community & Social Service | 6 (30.0%) | 14 (70.0%) |
| Education, Arts & Media | 0 (0.0%) | 14 (100.0%) |
| Legal Services & Support | 6 (100.0%) | 0 (0.0%) |
| Education Instruction & Library | 0 (0.0%) | 0 (0.0%) |
| Arts, Media & Entertainment | 0 (0.0%) | 0 (0.0%) |
| Health Diagnosing & Treating | 0 (0.0%) | 30 (100.0%) |
| Health Technologists | 0 (0.0%) | 27 (100.0%) |
| Total (Category) | 112 (41.3%) | 159 (58.7%) |
| Total (Overall) | 211 (52.0%) | 195 (48.0%) |
Services Occupations
Services Occupations by Sex
| Occupation | Male | Female |
| Healthcare Support | 0 (0.0%) | 0 (0.0%) |
| Security & Protection | 0 (0.0%) | 0 (0.0%) |
| Firefighting & Prevention | 0 (0.0%) | 0 (0.0%) |
| Law Enforcement | 0 (0.0%) | 0 (0.0%) |
| Food Preparation & Serving | 0 (0.0%) | 0 (0.0%) |
| Cleaning & Maintenance | 0 (0.0%) | 0 (0.0%) |
| Personal Care & Service | 0 (0.0%) | 0 (0.0%) |
| Total (Category) | 0 (0.0%) | 0 (0.0%) |
| Total (Overall) | 211 (52.0%) | 195 (48.0%) |
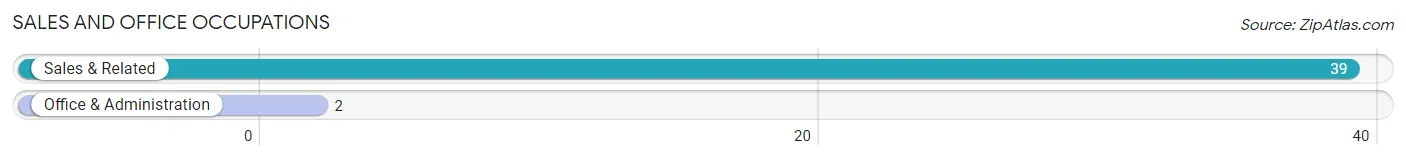
Sales and Office Occupations
The most common Sales and Office occupations in Seabrook Beach are Sales & Related (39 | 9.6%), and Office & Administration (2 | 0.5%).
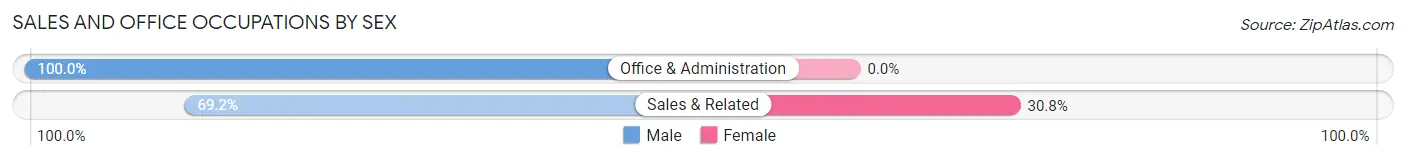
Sales and Office Occupations by Sex
| Occupation | Male | Female |
| Sales & Related | 27 (69.2%) | 12 (30.8%) |
| Office & Administration | 2 (100.0%) | 0 (0.0%) |
| Total (Category) | 29 (70.7%) | 12 (29.3%) |
| Total (Overall) | 211 (52.0%) | 195 (48.0%) |
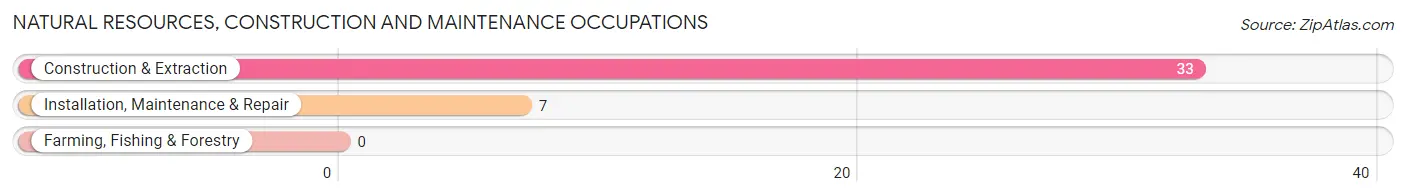
Natural Resources, Construction and Maintenance Occupations
The most common Natural Resources, Construction and Maintenance occupations in Seabrook Beach are Construction & Extraction (33 | 8.1%), and Installation, Maintenance & Repair (7 | 1.7%).
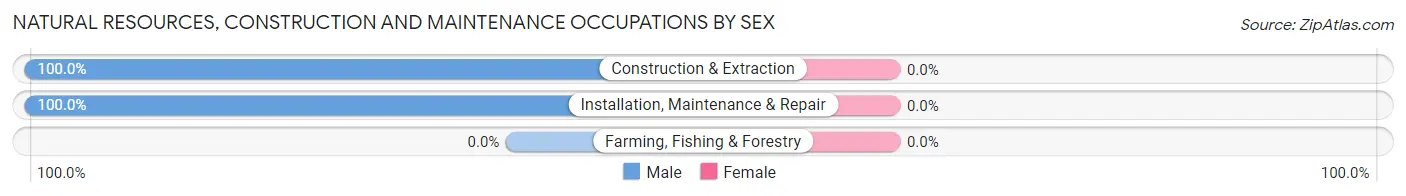
Natural Resources, Construction and Maintenance Occupations by Sex
| Occupation | Male | Female |
| Farming, Fishing & Forestry | 0 (0.0%) | 0 (0.0%) |
| Construction & Extraction | 33 (100.0%) | 0 (0.0%) |
| Installation, Maintenance & Repair | 7 (100.0%) | 0 (0.0%) |
| Total (Category) | 40 (100.0%) | 0 (0.0%) |
| Total (Overall) | 211 (52.0%) | 195 (48.0%) |
Production, Transportation and Moving Occupations
The most common Production, Transportation and Moving occupations in Seabrook Beach are Transportation (29 | 7.1%), Production (17 | 4.2%), and Material Moving (8 | 2.0%).
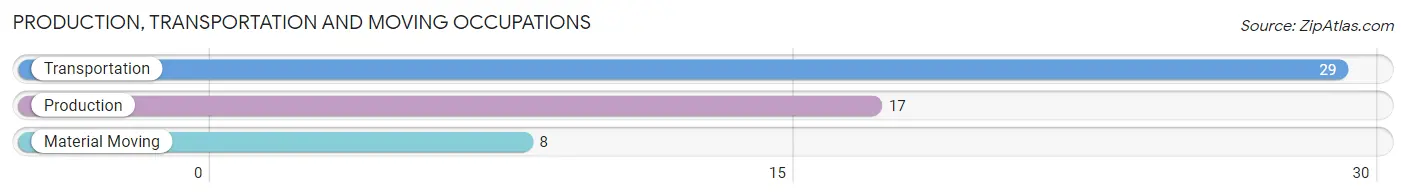
Production, Transportation and Moving Occupations by Sex
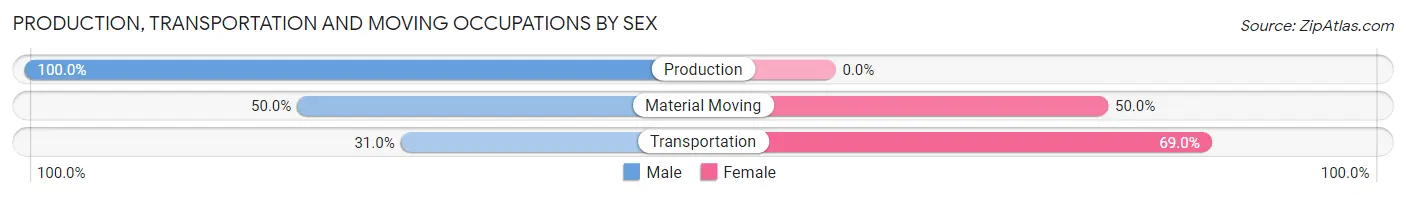
| Occupation | Male | Female |
| Production | 17 (100.0%) | 0 (0.0%) |
| Transportation | 9 (31.0%) | 20 (69.0%) |
| Material Moving | 4 (50.0%) | 4 (50.0%) |
| Total (Category) | 30 (55.6%) | 24 (44.4%) |
| Total (Overall) | 211 (52.0%) | 195 (48.0%) |
Employment Industries by Sex in Seabrook Beach
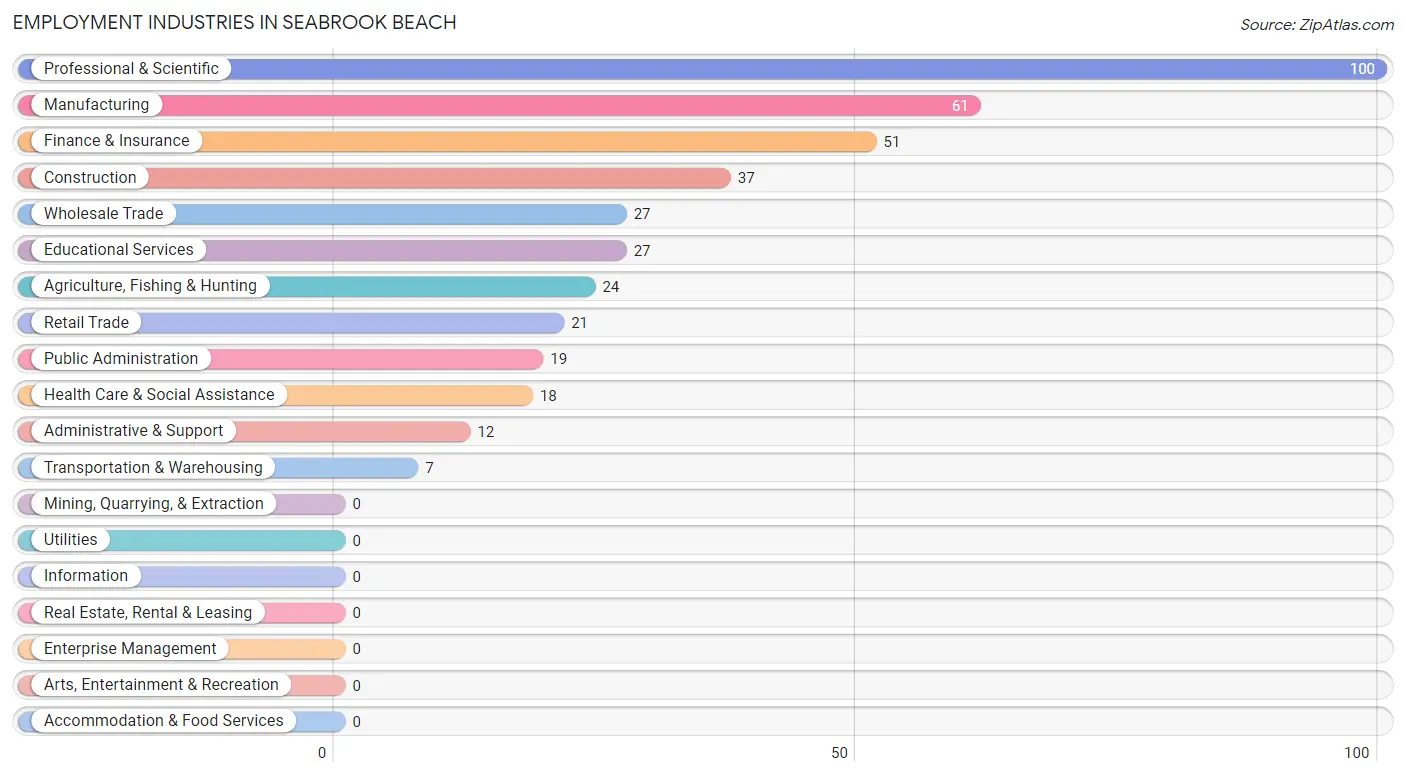
Employment Industries in Seabrook Beach
The major employment industries in Seabrook Beach include Professional & Scientific (100 | 24.6%), Manufacturing (61 | 15.0%), Finance & Insurance (51 | 12.6%), Construction (37 | 9.1%), and Wholesale Trade (27 | 6.7%).
Employment Industries by Sex in Seabrook Beach
The Seabrook Beach industries that see more men than women are Construction (100.0%), Manufacturing (100.0%), and Transportation & Warehousing (100.0%), whereas the industries that tend to have a higher number of women are Agriculture, Fishing & Hunting (100.0%), Educational Services (100.0%), and Health Care & Social Assistance (94.4%).
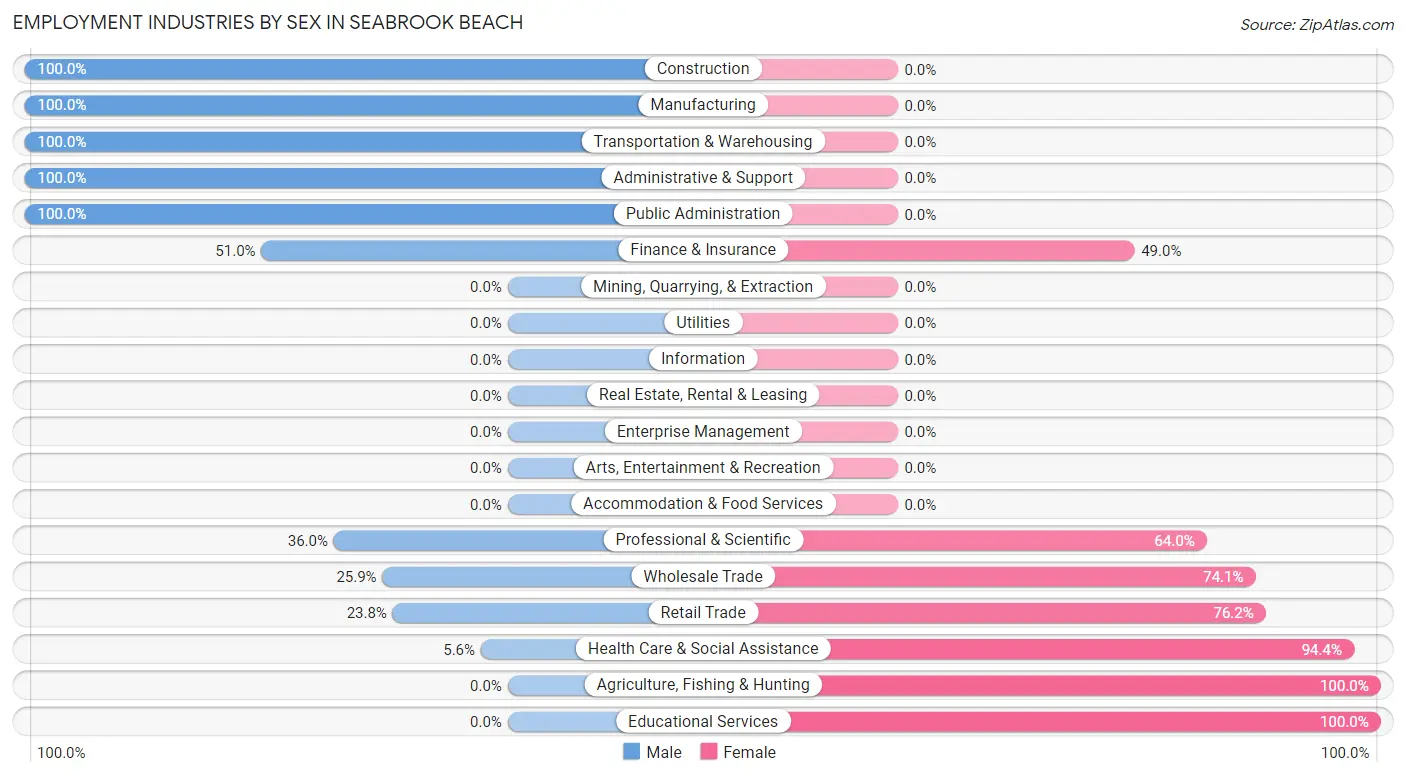
| Industry | Male | Female |
| Agriculture, Fishing & Hunting | 0 (0.0%) | 24 (100.0%) |
| Mining, Quarrying, & Extraction | 0 (0.0%) | 0 (0.0%) |
| Construction | 37 (100.0%) | 0 (0.0%) |
| Manufacturing | 61 (100.0%) | 0 (0.0%) |
| Wholesale Trade | 7 (25.9%) | 20 (74.1%) |
| Retail Trade | 5 (23.8%) | 16 (76.2%) |
| Transportation & Warehousing | 7 (100.0%) | 0 (0.0%) |
| Utilities | 0 (0.0%) | 0 (0.0%) |
| Information | 0 (0.0%) | 0 (0.0%) |
| Finance & Insurance | 26 (51.0%) | 25 (49.0%) |
| Real Estate, Rental & Leasing | 0 (0.0%) | 0 (0.0%) |
| Professional & Scientific | 36 (36.0%) | 64 (64.0%) |
| Enterprise Management | 0 (0.0%) | 0 (0.0%) |
| Administrative & Support | 12 (100.0%) | 0 (0.0%) |
| Educational Services | 0 (0.0%) | 27 (100.0%) |
| Health Care & Social Assistance | 1 (5.6%) | 17 (94.4%) |
| Arts, Entertainment & Recreation | 0 (0.0%) | 0 (0.0%) |
| Accommodation & Food Services | 0 (0.0%) | 0 (0.0%) |
| Public Administration | 19 (100.0%) | 0 (0.0%) |
| Total | 211 (52.0%) | 195 (48.0%) |
Education in Seabrook Beach
School Enrollment in Seabrook Beach
The most common levels of schooling among the 52 students in Seabrook Beach are high school (42 | 80.8%), college / undergraduate (7 | 13.5%), and nursery / preschool (3 | 5.8%).
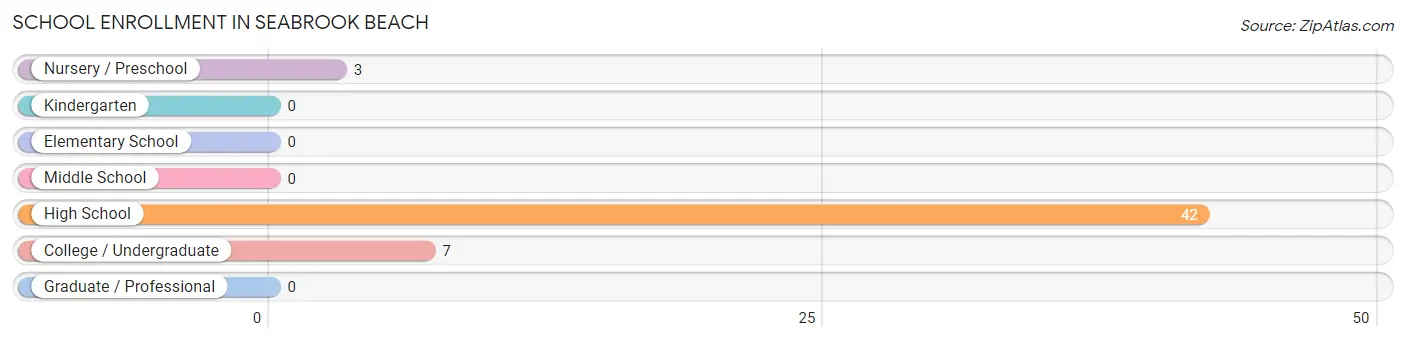
| School Level | # Students | % Students |
| Nursery / Preschool | 3 | 5.8% |
| Kindergarten | 0 | 0.0% |
| Elementary School | 0 | 0.0% |
| Middle School | 0 | 0.0% |
| High School | 42 | 80.8% |
| College / Undergraduate | 7 | 13.5% |
| Graduate / Professional | 0 | 0.0% |
| Total | 52 | 100.0% |
School Enrollment by Age by Funding Source in Seabrook Beach
Out of a total of 52 students who are enrolled in schools in Seabrook Beach, 7 (13.5%) attend a private institution, while the remaining 45 (86.5%) are enrolled in public schools. The age group of 18 to 19 year olds has the highest likelihood of being enrolled in private schools, with 7 (100.0% in the age bracket) enrolled. Conversely, the age group of 3 to 4 year olds has the lowest likelihood of being enrolled in a private school, with 3 (100.0% in the age bracket) attending a public institution.
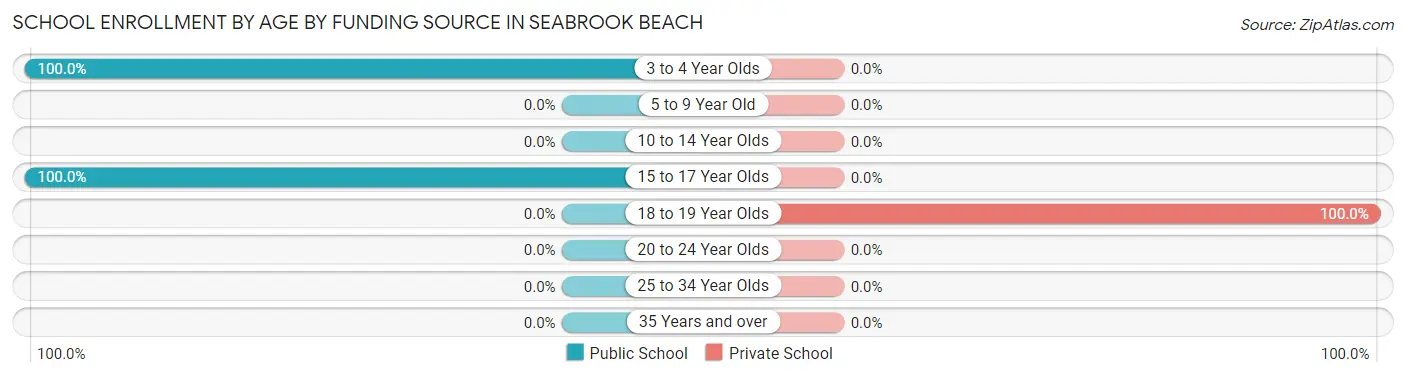
| Age Bracket | Public School | Private School |
| 3 to 4 Year Olds | 3 (100.0%) | 0 (0.0%) |
| 5 to 9 Year Old | 0 (0.0%) | 0 (0.0%) |
| 10 to 14 Year Olds | 0 (0.0%) | 0 (0.0%) |
| 15 to 17 Year Olds | 42 (100.0%) | 0 (0.0%) |
| 18 to 19 Year Olds | 0 (0.0%) | 7 (100.0%) |
| 20 to 24 Year Olds | 0 (0.0%) | 0 (0.0%) |
| 25 to 34 Year Olds | 0 (0.0%) | 0 (0.0%) |
| 35 Years and over | 0 (0.0%) | 0 (0.0%) |
| Total | 45 (86.5%) | 7 (13.5%) |
Educational Attainment by Field of Study in Seabrook Beach
Business (108 | 31.6%), education (106 | 31.0%), science & technology (32 | 9.4%), bio, nature & agricultural (30 | 8.8%), and social sciences (20 | 5.9%) are the most common fields of study among 342 individuals in Seabrook Beach who have obtained a bachelor's degree or higher.
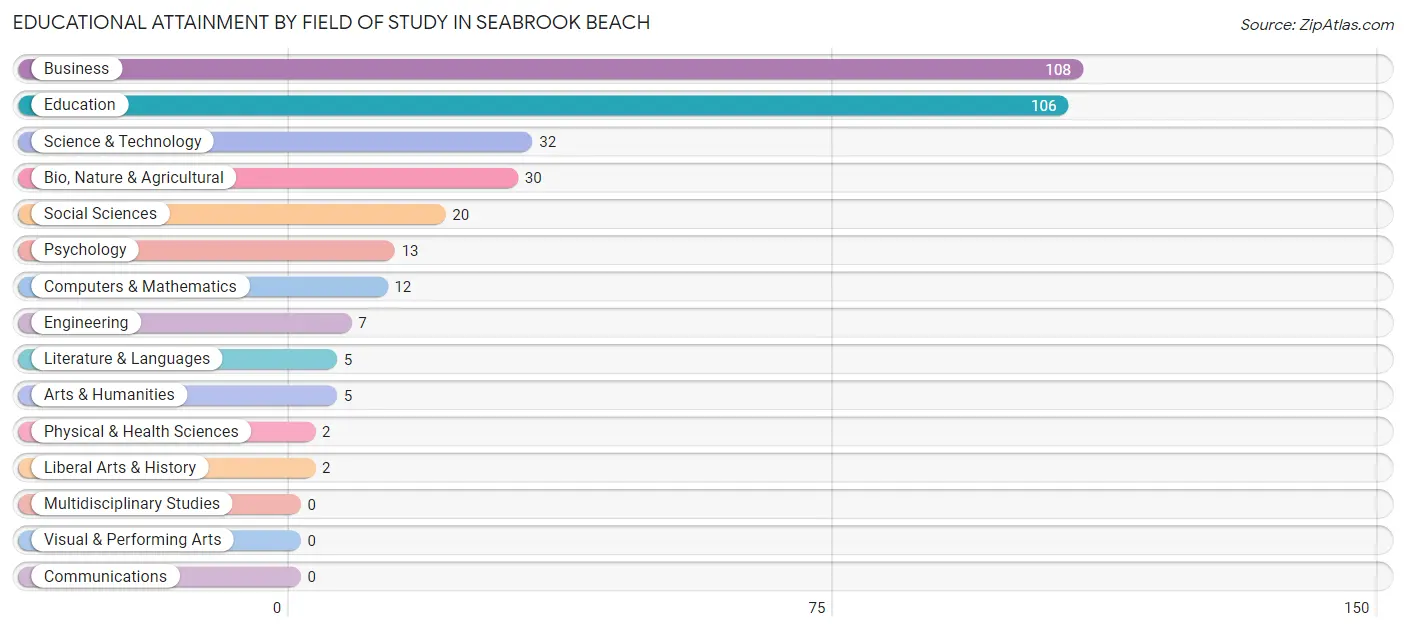
| Field of Study | # Graduates | % Graduates |
| Computers & Mathematics | 12 | 3.5% |
| Bio, Nature & Agricultural | 30 | 8.8% |
| Physical & Health Sciences | 2 | 0.6% |
| Psychology | 13 | 3.8% |
| Social Sciences | 20 | 5.9% |
| Engineering | 7 | 2.1% |
| Multidisciplinary Studies | 0 | 0.0% |
| Science & Technology | 32 | 9.4% |
| Business | 108 | 31.6% |
| Education | 106 | 31.0% |
| Literature & Languages | 5 | 1.5% |
| Liberal Arts & History | 2 | 0.6% |
| Visual & Performing Arts | 0 | 0.0% |
| Communications | 0 | 0.0% |
| Arts & Humanities | 5 | 1.5% |
| Total | 342 | 100.0% |
Transportation & Commute in Seabrook Beach
Vehicle Availability by Sex in Seabrook Beach
The most prevalent vehicle ownership categories in Seabrook Beach are males with 2 vehicles (115, accounting for 54.5%) and females with 2 vehicles (104, making up 59.0%).
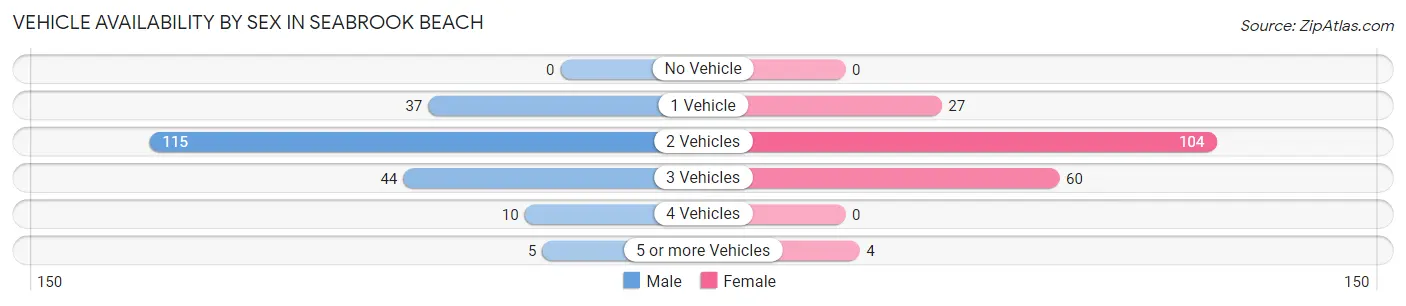
| Vehicles Available | Male | Female |
| No Vehicle | 0 (0.0%) | 0 (0.0%) |
| 1 Vehicle | 37 (17.5%) | 27 (13.9%) |
| 2 Vehicles | 115 (54.5%) | 104 (53.3%) |
| 3 Vehicles | 44 (20.8%) | 60 (30.8%) |
| 4 Vehicles | 10 (4.7%) | 0 (0.0%) |
| 5 or more Vehicles | 5 (2.4%) | 4 (2.1%) |
| Total | 211 (100.0%) | 195 (100.0%) |
Commute Time in Seabrook Beach
The most frequently occuring commute durations in Seabrook Beach are 20 to 24 minutes (72 commuters, 22.4%), 60 to 89 minutes (50 commuters, 15.6%), and 45 to 59 minutes (48 commuters, 14.9%).
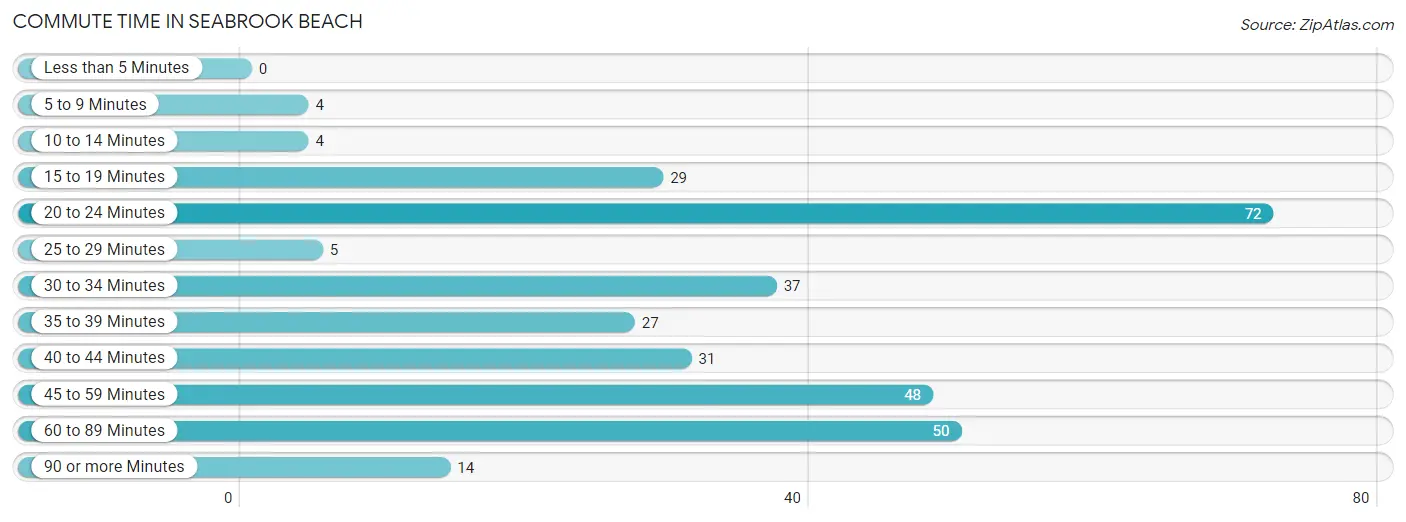
| Commute Time | # Commuters | % Commuters |
| Less than 5 Minutes | 0 | 0.0% |
| 5 to 9 Minutes | 4 | 1.3% |
| 10 to 14 Minutes | 4 | 1.3% |
| 15 to 19 Minutes | 29 | 9.0% |
| 20 to 24 Minutes | 72 | 22.4% |
| 25 to 29 Minutes | 5 | 1.6% |
| 30 to 34 Minutes | 37 | 11.5% |
| 35 to 39 Minutes | 27 | 8.4% |
| 40 to 44 Minutes | 31 | 9.7% |
| 45 to 59 Minutes | 48 | 14.9% |
| 60 to 89 Minutes | 50 | 15.6% |
| 90 or more Minutes | 14 | 4.4% |
Commute Time by Sex in Seabrook Beach
The most common commute times in Seabrook Beach are 45 to 59 minutes (46 commuters, 26.1%) for males and 20 to 24 minutes (38 commuters, 26.2%) for females.
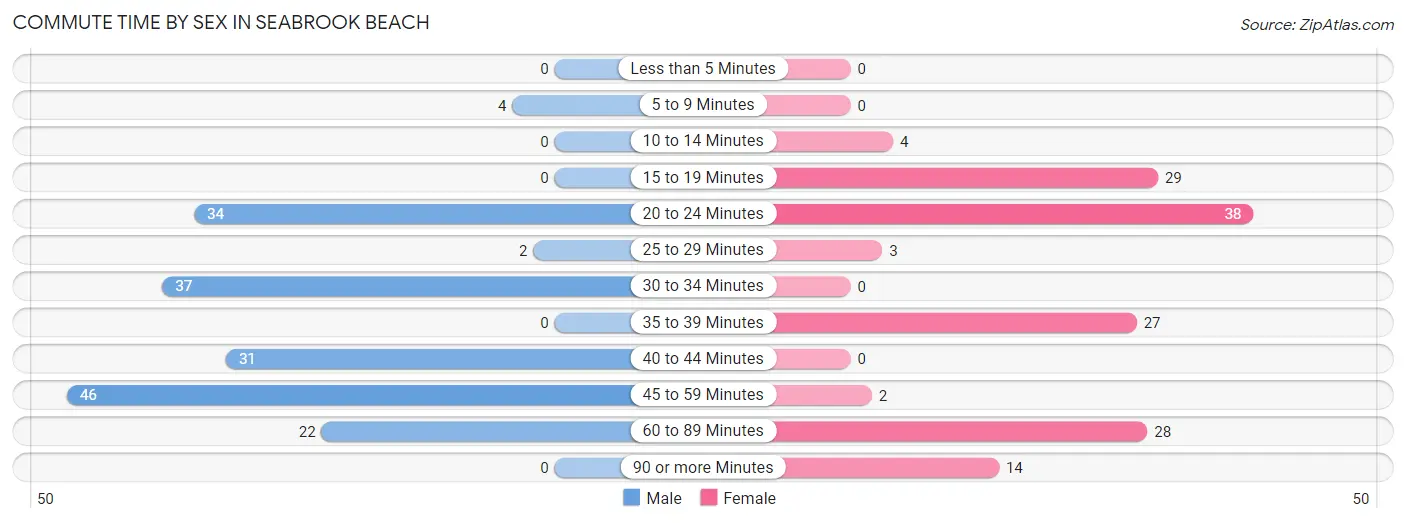
| Commute Time | Male | Female |
| Less than 5 Minutes | 0 (0.0%) | 0 (0.0%) |
| 5 to 9 Minutes | 4 (2.3%) | 0 (0.0%) |
| 10 to 14 Minutes | 0 (0.0%) | 4 (2.8%) |
| 15 to 19 Minutes | 0 (0.0%) | 29 (20.0%) |
| 20 to 24 Minutes | 34 (19.3%) | 38 (26.2%) |
| 25 to 29 Minutes | 2 (1.1%) | 3 (2.1%) |
| 30 to 34 Minutes | 37 (21.0%) | 0 (0.0%) |
| 35 to 39 Minutes | 0 (0.0%) | 27 (18.6%) |
| 40 to 44 Minutes | 31 (17.6%) | 0 (0.0%) |
| 45 to 59 Minutes | 46 (26.1%) | 2 (1.4%) |
| 60 to 89 Minutes | 22 (12.5%) | 28 (19.3%) |
| 90 or more Minutes | 0 (0.0%) | 14 (9.7%) |
Time of Departure to Work by Sex in Seabrook Beach
The most frequent times of departure to work in Seabrook Beach are 7:00 AM to 7:29 AM (49, 27.8%) for males and 6:30 AM to 6:59 AM (42, 29.0%) for females.
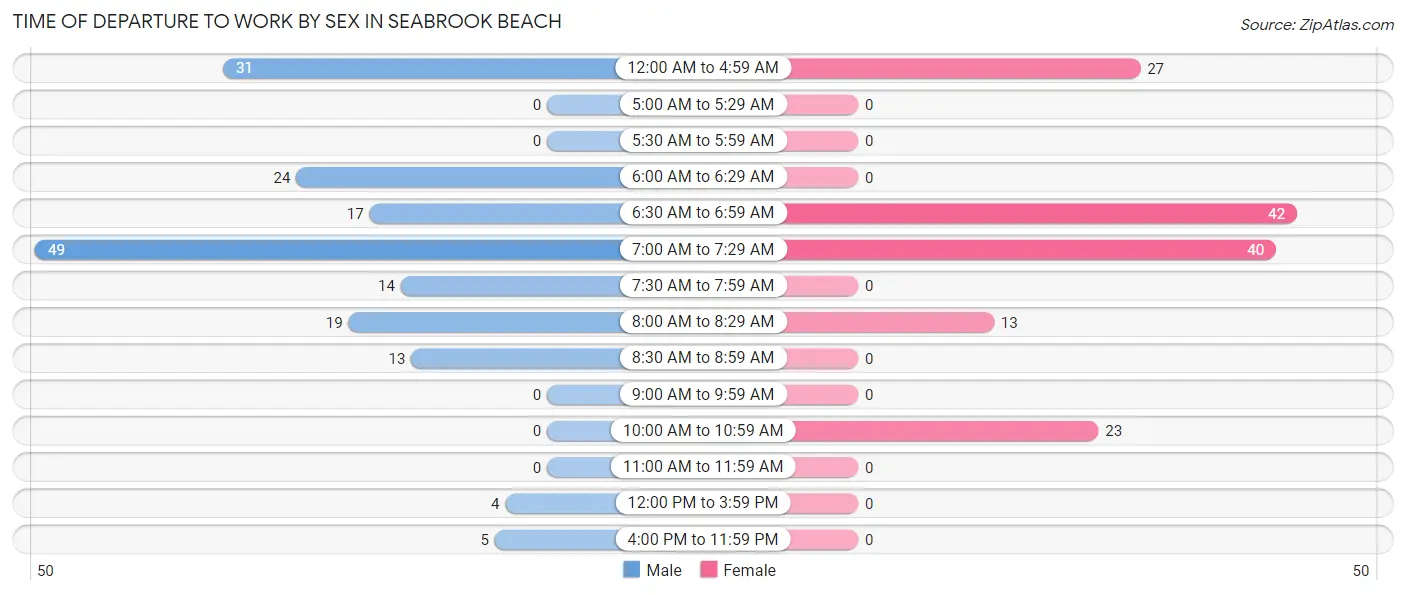
| Time of Departure | Male | Female |
| 12:00 AM to 4:59 AM | 31 (17.6%) | 27 (18.6%) |
| 5:00 AM to 5:29 AM | 0 (0.0%) | 0 (0.0%) |
| 5:30 AM to 5:59 AM | 0 (0.0%) | 0 (0.0%) |
| 6:00 AM to 6:29 AM | 24 (13.6%) | 0 (0.0%) |
| 6:30 AM to 6:59 AM | 17 (9.7%) | 42 (29.0%) |
| 7:00 AM to 7:29 AM | 49 (27.8%) | 40 (27.6%) |
| 7:30 AM to 7:59 AM | 14 (8.0%) | 0 (0.0%) |
| 8:00 AM to 8:29 AM | 19 (10.8%) | 13 (9.0%) |
| 8:30 AM to 8:59 AM | 13 (7.4%) | 0 (0.0%) |
| 9:00 AM to 9:59 AM | 0 (0.0%) | 0 (0.0%) |
| 10:00 AM to 10:59 AM | 0 (0.0%) | 23 (15.9%) |
| 11:00 AM to 11:59 AM | 0 (0.0%) | 0 (0.0%) |
| 12:00 PM to 3:59 PM | 4 (2.3%) | 0 (0.0%) |
| 4:00 PM to 11:59 PM | 5 (2.8%) | 0 (0.0%) |
| Total | 176 (100.0%) | 145 (100.0%) |
Housing Occupancy in Seabrook Beach
Occupancy by Ownership in Seabrook Beach
Of the total 499 dwellings in Seabrook Beach, owner-occupied units account for 382 (76.5%), while renter-occupied units make up 117 (23.4%).
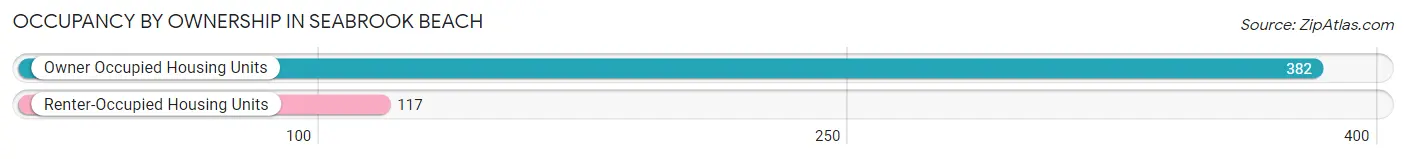
| Occupancy | # Housing Units | % Housing Units |
| Owner Occupied Housing Units | 382 | 76.5% |
| Renter-Occupied Housing Units | 117 | 23.4% |
| Total Occupied Housing Units | 499 | 100.0% |
Occupancy by Household Size in Seabrook Beach
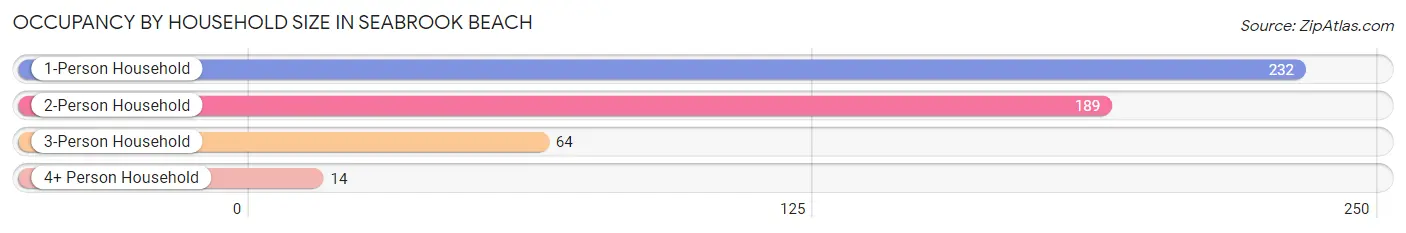
| Household Size | # Housing Units | % Housing Units |
| 1-Person Household | 232 | 46.5% |
| 2-Person Household | 189 | 37.9% |
| 3-Person Household | 64 | 12.8% |
| 4+ Person Household | 14 | 2.8% |
| Total Housing Units | 499 | 100.0% |
Occupancy by Ownership by Household Size in Seabrook Beach
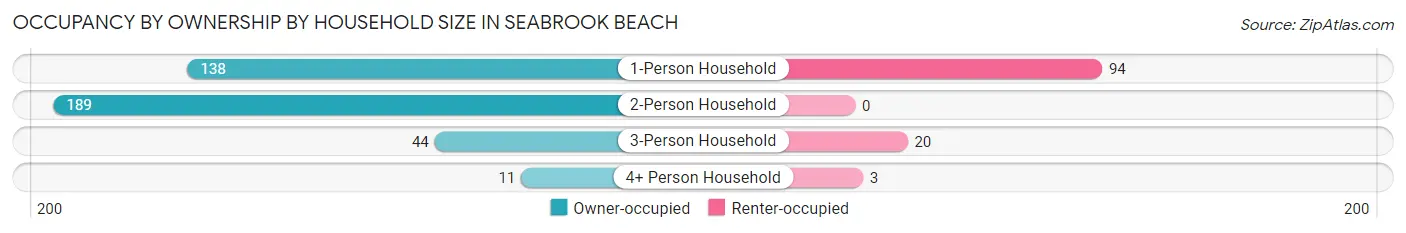
| Household Size | Owner-occupied | Renter-occupied |
| 1-Person Household | 138 (59.5%) | 94 (40.5%) |
| 2-Person Household | 189 (100.0%) | 0 (0.0%) |
| 3-Person Household | 44 (68.8%) | 20 (31.2%) |
| 4+ Person Household | 11 (78.6%) | 3 (21.4%) |
| Total Housing Units | 382 (76.5%) | 117 (23.4%) |
Occupancy by Educational Attainment in Seabrook Beach
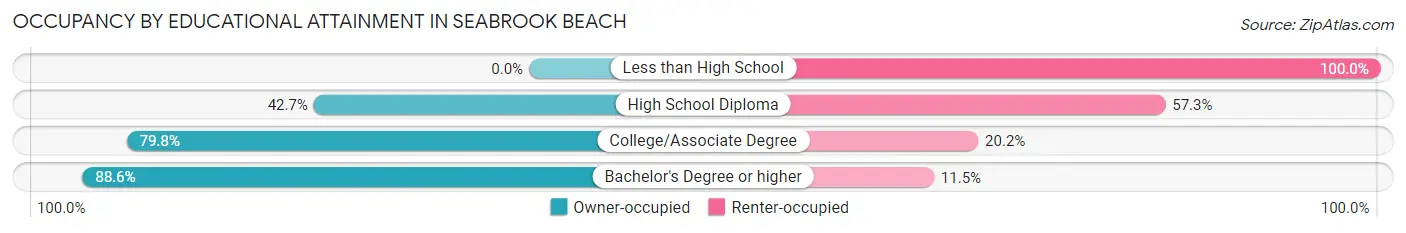
| Household Size | Owner-occupied | Renter-occupied |
| Less than High School | 0 (0.0%) | 7 (100.0%) |
| High School Diploma | 35 (42.7%) | 47 (57.3%) |
| College/Associate Degree | 146 (79.8%) | 37 (20.2%) |
| Bachelor's Degree or higher | 201 (88.5%) | 26 (11.5%) |
Occupancy by Age of Householder in Seabrook Beach
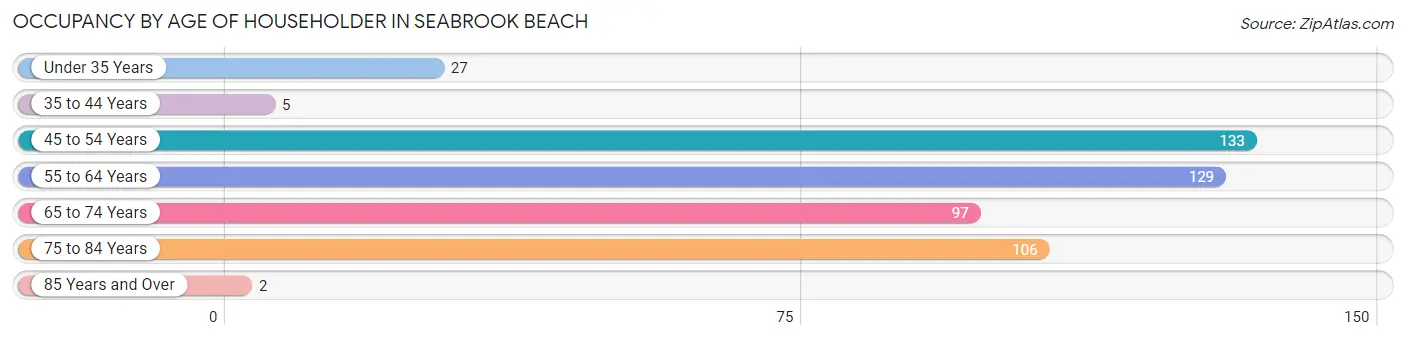
| Age Bracket | # Households | % Households |
| Under 35 Years | 27 | 5.4% |
| 35 to 44 Years | 5 | 1.0% |
| 45 to 54 Years | 133 | 26.7% |
| 55 to 64 Years | 129 | 25.9% |
| 65 to 74 Years | 97 | 19.4% |
| 75 to 84 Years | 106 | 21.2% |
| 85 Years and Over | 2 | 0.4% |
| Total | 499 | 100.0% |
Housing Finances in Seabrook Beach
Median Income by Occupancy in Seabrook Beach
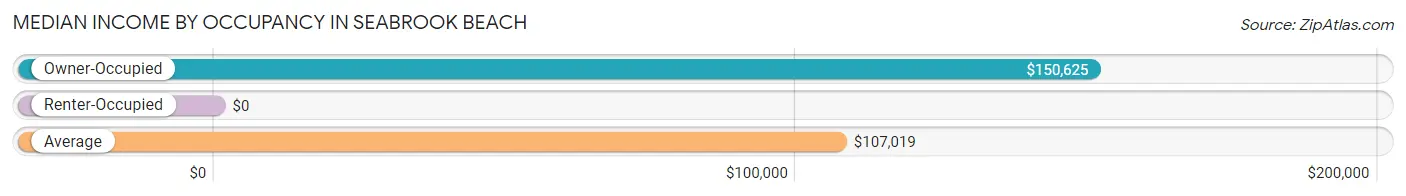
| Occupancy Type | # Households | Median Income |
| Owner-Occupied | 382 (76.5%) | $150,625 |
| Renter-Occupied | 117 (23.4%) | $0 |
| Average | 499 (100.0%) | $107,019 |
Occupancy by Householder Income Bracket in Seabrook Beach
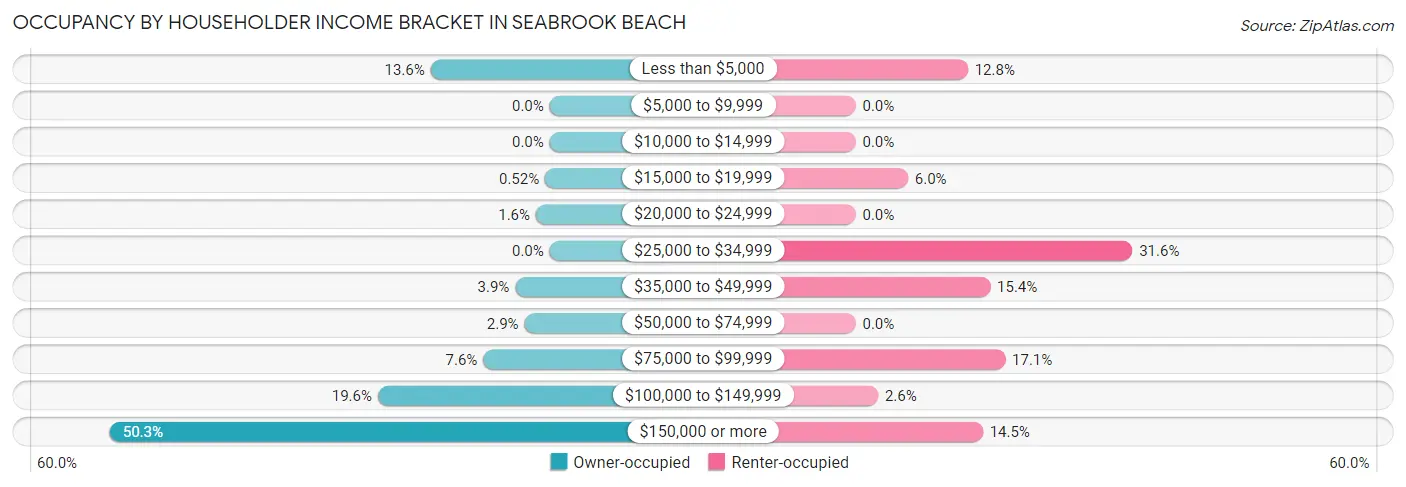
| Income Bracket | Owner-occupied | Renter-occupied |
| Less than $5,000 | 52 (13.6%) | 15 (12.8%) |
| $5,000 to $9,999 | 0 (0.0%) | 0 (0.0%) |
| $10,000 to $14,999 | 0 (0.0%) | 0 (0.0%) |
| $15,000 to $19,999 | 2 (0.5%) | 7 (6.0%) |
| $20,000 to $24,999 | 6 (1.6%) | 0 (0.0%) |
| $25,000 to $34,999 | 0 (0.0%) | 37 (31.6%) |
| $35,000 to $49,999 | 15 (3.9%) | 18 (15.4%) |
| $50,000 to $74,999 | 11 (2.9%) | 0 (0.0%) |
| $75,000 to $99,999 | 29 (7.6%) | 20 (17.1%) |
| $100,000 to $149,999 | 75 (19.6%) | 3 (2.6%) |
| $150,000 or more | 192 (50.3%) | 17 (14.5%) |
| Total | 382 (100.0%) | 117 (100.0%) |
Monthly Housing Cost Tiers in Seabrook Beach
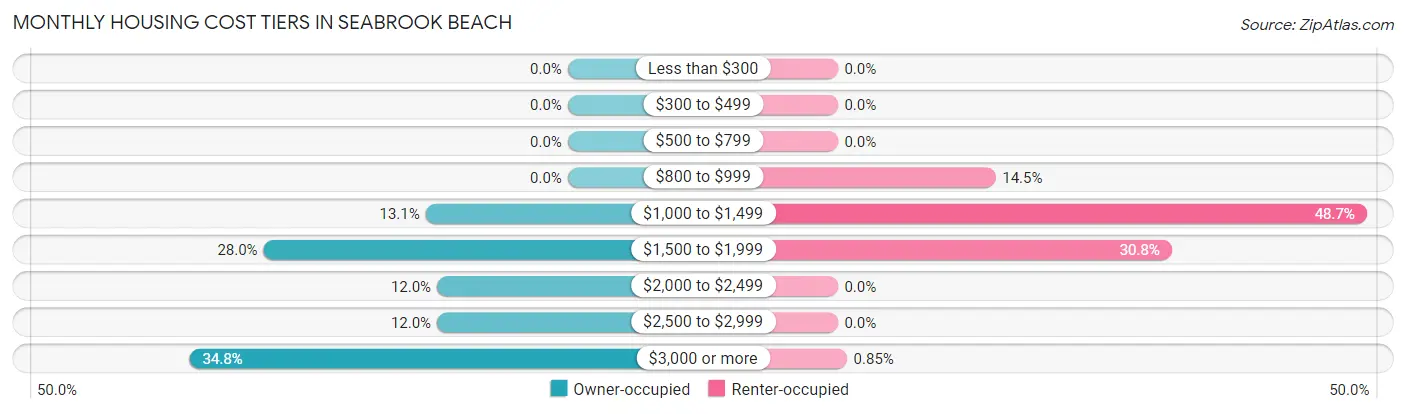
| Monthly Cost | Owner-occupied | Renter-occupied |
| Less than $300 | 0 (0.0%) | 0 (0.0%) |
| $300 to $499 | 0 (0.0%) | 0 (0.0%) |
| $500 to $799 | 0 (0.0%) | 0 (0.0%) |
| $800 to $999 | 0 (0.0%) | 17 (14.5%) |
| $1,000 to $1,499 | 50 (13.1%) | 57 (48.7%) |
| $1,500 to $1,999 | 107 (28.0%) | 36 (30.8%) |
| $2,000 to $2,499 | 46 (12.0%) | 0 (0.0%) |
| $2,500 to $2,999 | 46 (12.0%) | 0 (0.0%) |
| $3,000 or more | 133 (34.8%) | 1 (0.9%) |
| Total | 382 (100.0%) | 117 (100.0%) |
Physical Housing Characteristics in Seabrook Beach
Housing Structures in Seabrook Beach
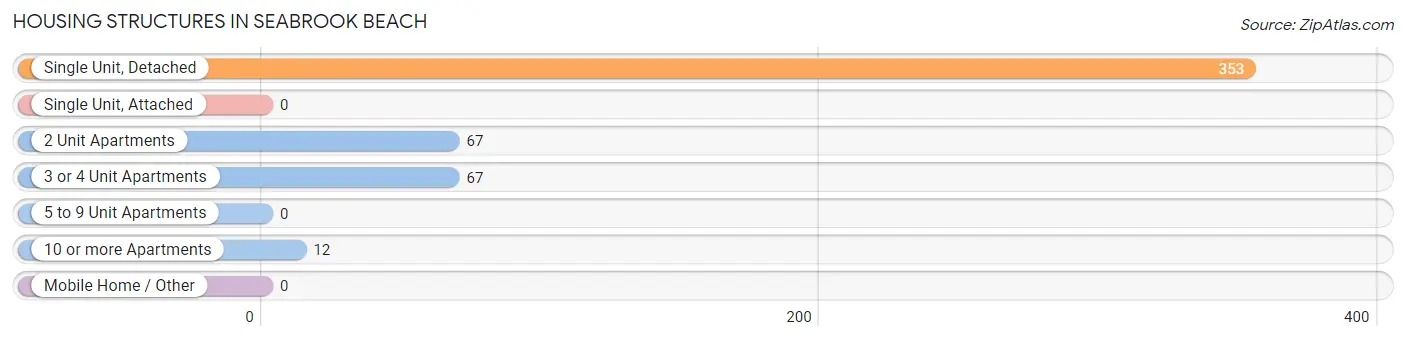
| Structure Type | # Housing Units | % Housing Units |
| Single Unit, Detached | 353 | 70.7% |
| Single Unit, Attached | 0 | 0.0% |
| 2 Unit Apartments | 67 | 13.4% |
| 3 or 4 Unit Apartments | 67 | 13.4% |
| 5 to 9 Unit Apartments | 0 | 0.0% |
| 10 or more Apartments | 12 | 2.4% |
| Mobile Home / Other | 0 | 0.0% |
| Total | 499 | 100.0% |
Housing Structures by Occupancy in Seabrook Beach
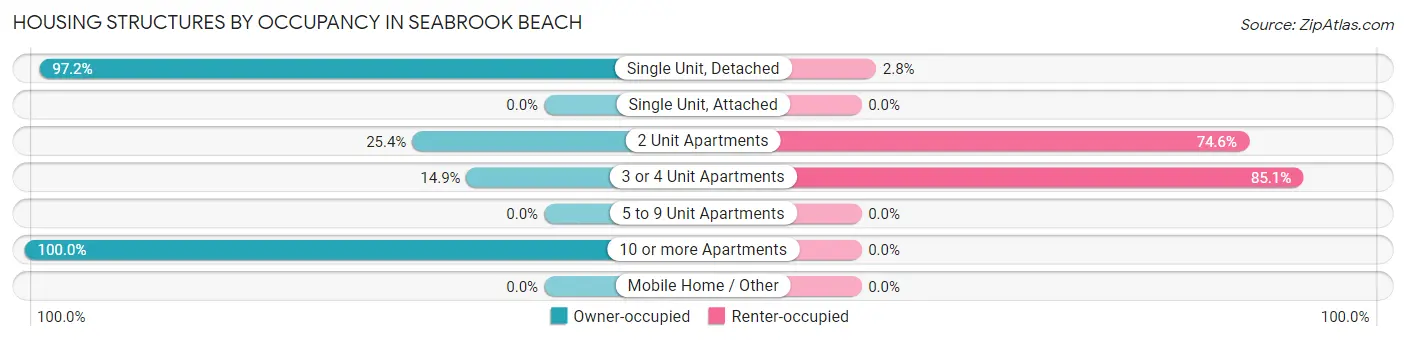
| Structure Type | Owner-occupied | Renter-occupied |
| Single Unit, Detached | 343 (97.2%) | 10 (2.8%) |
| Single Unit, Attached | 0 (0.0%) | 0 (0.0%) |
| 2 Unit Apartments | 17 (25.4%) | 50 (74.6%) |
| 3 or 4 Unit Apartments | 10 (14.9%) | 57 (85.1%) |
| 5 to 9 Unit Apartments | 0 (0.0%) | 0 (0.0%) |
| 10 or more Apartments | 12 (100.0%) | 0 (0.0%) |
| Mobile Home / Other | 0 (0.0%) | 0 (0.0%) |
| Total | 382 (76.5%) | 117 (23.4%) |
Housing Structures by Number of Rooms in Seabrook Beach
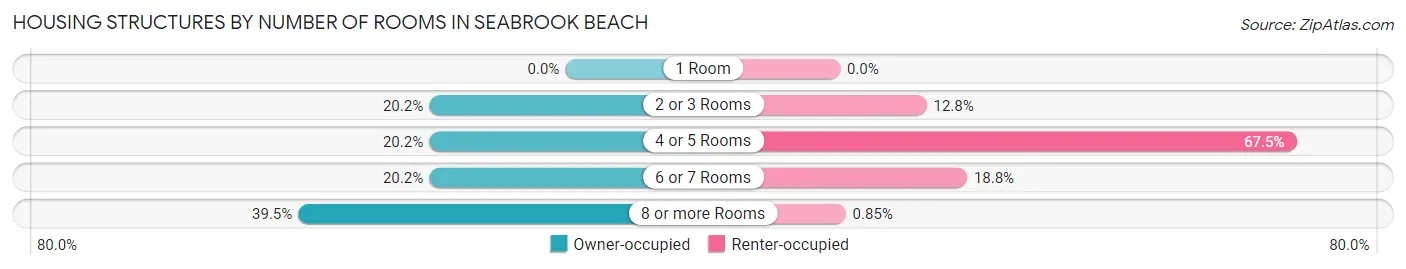
| Number of Rooms | Owner-occupied | Renter-occupied |
| 1 Room | 0 (0.0%) | 0 (0.0%) |
| 2 or 3 Rooms | 77 (20.2%) | 15 (12.8%) |
| 4 or 5 Rooms | 77 (20.2%) | 79 (67.5%) |
| 6 or 7 Rooms | 77 (20.2%) | 22 (18.8%) |
| 8 or more Rooms | 151 (39.5%) | 1 (0.9%) |
| Total | 382 (100.0%) | 117 (100.0%) |
Housing Structure by Heating Type in Seabrook Beach
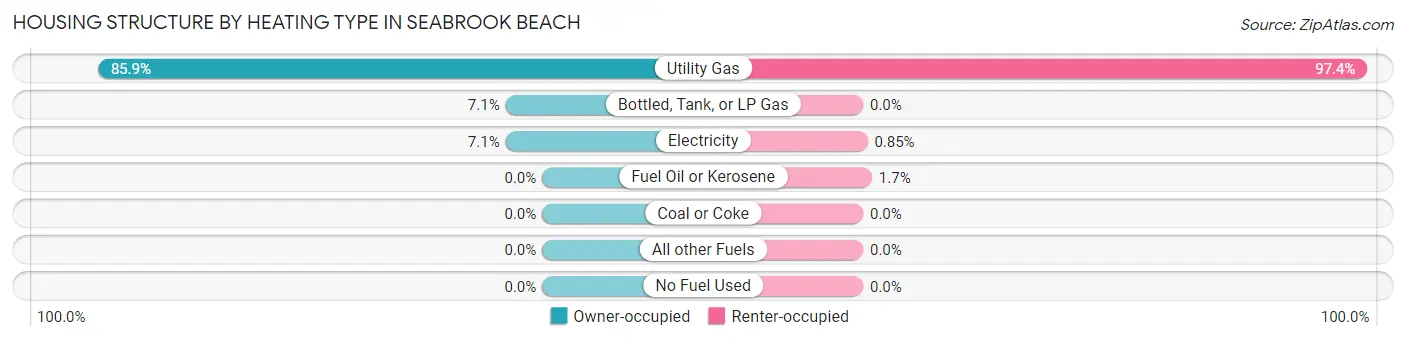
| Heating Type | Owner-occupied | Renter-occupied |
| Utility Gas | 328 (85.9%) | 114 (97.4%) |
| Bottled, Tank, or LP Gas | 27 (7.1%) | 0 (0.0%) |
| Electricity | 27 (7.1%) | 1 (0.9%) |
| Fuel Oil or Kerosene | 0 (0.0%) | 2 (1.7%) |
| Coal or Coke | 0 (0.0%) | 0 (0.0%) |
| All other Fuels | 0 (0.0%) | 0 (0.0%) |
| No Fuel Used | 0 (0.0%) | 0 (0.0%) |
| Total | 382 (100.0%) | 117 (100.0%) |
Household Vehicle Usage in Seabrook Beach
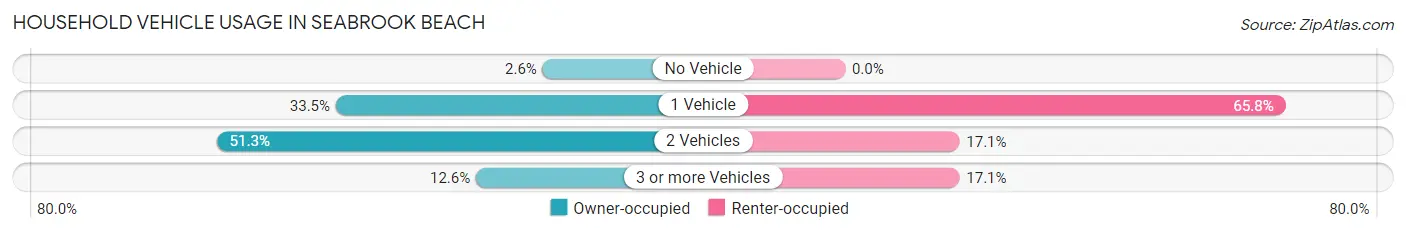
| Vehicles per Household | Owner-occupied | Renter-occupied |
| No Vehicle | 10 (2.6%) | 0 (0.0%) |
| 1 Vehicle | 128 (33.5%) | 77 (65.8%) |
| 2 Vehicles | 196 (51.3%) | 20 (17.1%) |
| 3 or more Vehicles | 48 (12.6%) | 20 (17.1%) |
| Total | 382 (100.0%) | 117 (100.0%) |
Real Estate & Mortgages in Seabrook Beach
Real Estate and Mortgage Overview in Seabrook Beach
| Characteristic | Without Mortgage | With Mortgage |
| Housing Units | 125 | 257 |
| Median Property Value | $957,200 | $716,300 |
| Median Household Income | - | - |
| Monthly Housing Costs | $1,501 | $128 |
| Real Estate Taxes | $10,001 | $0 |
Property Value by Mortgage Status in Seabrook Beach
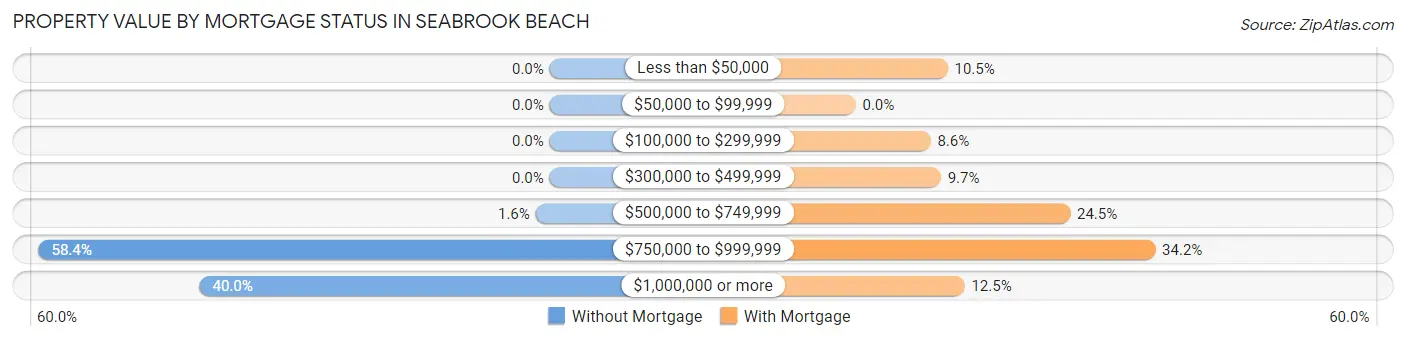
| Property Value | Without Mortgage | With Mortgage |
| Less than $50,000 | 0 (0.0%) | 27 (10.5%) |
| $50,000 to $99,999 | 0 (0.0%) | 0 (0.0%) |
| $100,000 to $299,999 | 0 (0.0%) | 22 (8.6%) |
| $300,000 to $499,999 | 0 (0.0%) | 25 (9.7%) |
| $500,000 to $749,999 | 2 (1.6%) | 63 (24.5%) |
| $750,000 to $999,999 | 73 (58.4%) | 88 (34.2%) |
| $1,000,000 or more | 50 (40.0%) | 32 (12.4%) |
| Total | 125 (100.0%) | 257 (100.0%) |
Household Income by Mortgage Status in Seabrook Beach
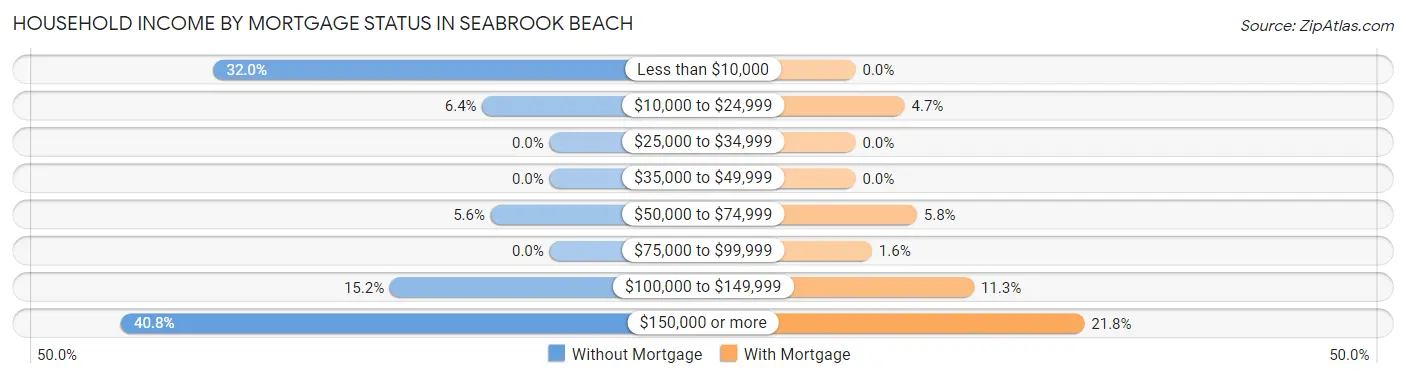
| Household Income | Without Mortgage | With Mortgage |
| Less than $10,000 | 40 (32.0%) | 0 (0.0%) |
| $10,000 to $24,999 | 8 (6.4%) | 12 (4.7%) |
| $25,000 to $34,999 | 0 (0.0%) | 0 (0.0%) |
| $35,000 to $49,999 | 0 (0.0%) | 0 (0.0%) |
| $50,000 to $74,999 | 7 (5.6%) | 15 (5.8%) |
| $75,000 to $99,999 | 0 (0.0%) | 4 (1.6%) |
| $100,000 to $149,999 | 19 (15.2%) | 29 (11.3%) |
| $150,000 or more | 51 (40.8%) | 56 (21.8%) |
| Total | 125 (100.0%) | 257 (100.0%) |
Property Value to Household Income Ratio in Seabrook Beach
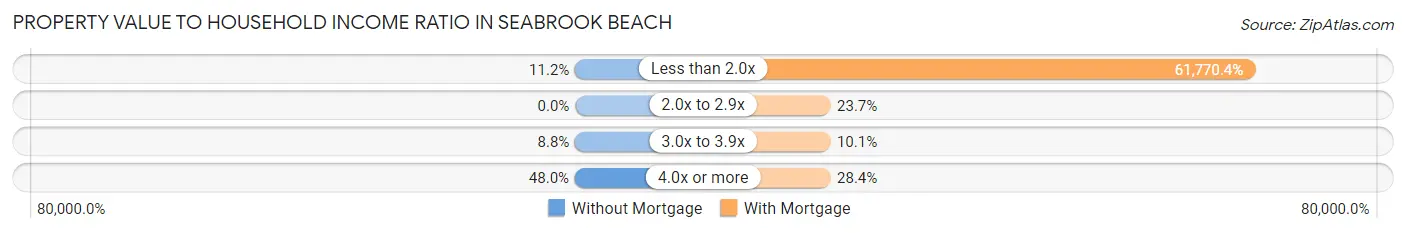
| Value-to-Income Ratio | Without Mortgage | With Mortgage |
| Less than 2.0x | 14 (11.2%) | 158,750 (61,770.4%) |
| 2.0x to 2.9x | 0 (0.0%) | 61 (23.7%) |
| 3.0x to 3.9x | 11 (8.8%) | 26 (10.1%) |
| 4.0x or more | 60 (48.0%) | 73 (28.4%) |
| Total | 125 (100.0%) | 257 (100.0%) |
Real Estate Taxes by Mortgage Status in Seabrook Beach
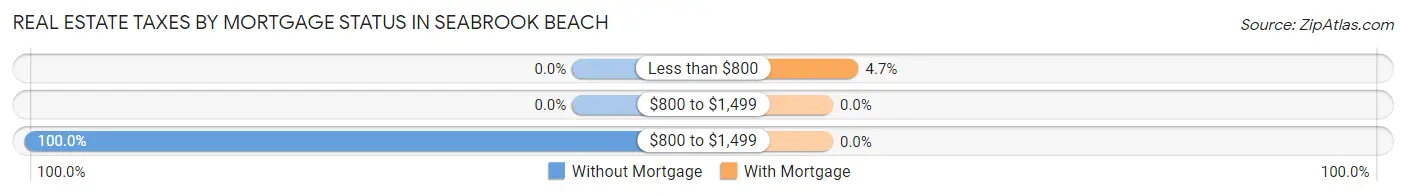
| Property Taxes | Without Mortgage | With Mortgage |
| Less than $800 | 0 (0.0%) | 12 (4.7%) |
| $800 to $1,499 | 0 (0.0%) | 0 (0.0%) |
| $800 to $1,499 | 125 (100.0%) | 0 (0.0%) |
| Total | 125 (100.0%) | 257 (100.0%) |
Health & Disability in Seabrook Beach
Health Insurance Coverage by Age in Seabrook Beach
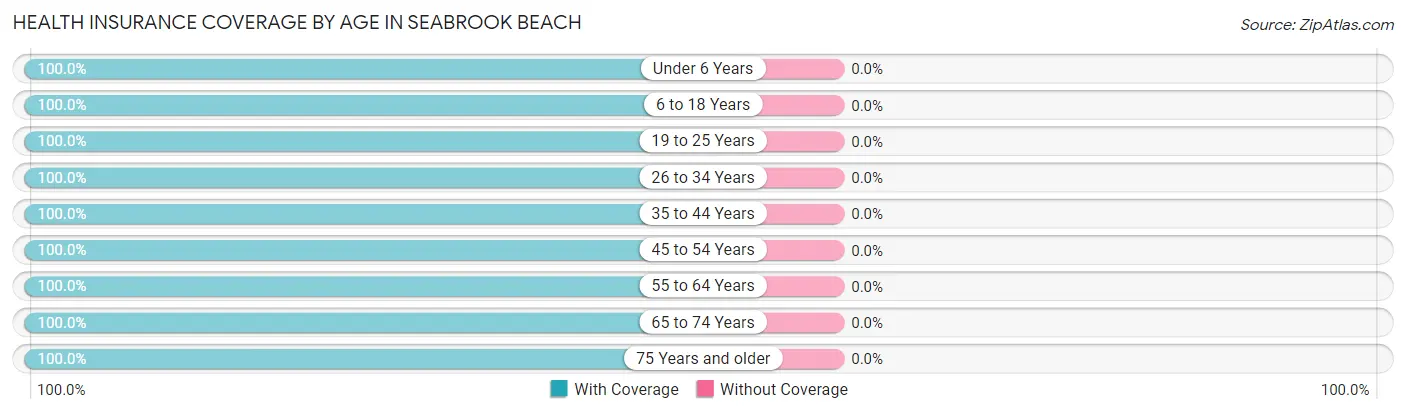
| Age Bracket | With Coverage | Without Coverage |
| Under 6 Years | 24 (100.0%) | 0 (0.0%) |
| 6 to 18 Years | 49 (100.0%) | 0 (0.0%) |
| 19 to 25 Years | 24 (100.0%) | 0 (0.0%) |
| 26 to 34 Years | 27 (100.0%) | 0 (0.0%) |
| 35 to 44 Years | 13 (100.0%) | 0 (0.0%) |
| 45 to 54 Years | 172 (100.0%) | 0 (0.0%) |
| 55 to 64 Years | 177 (100.0%) | 0 (0.0%) |
| 65 to 74 Years | 217 (100.0%) | 0 (0.0%) |
| 75 Years and older | 161 (100.0%) | 0 (0.0%) |
| Total | 864 (100.0%) | 0 (0.0%) |
Health Insurance Coverage by Citizenship Status in Seabrook Beach
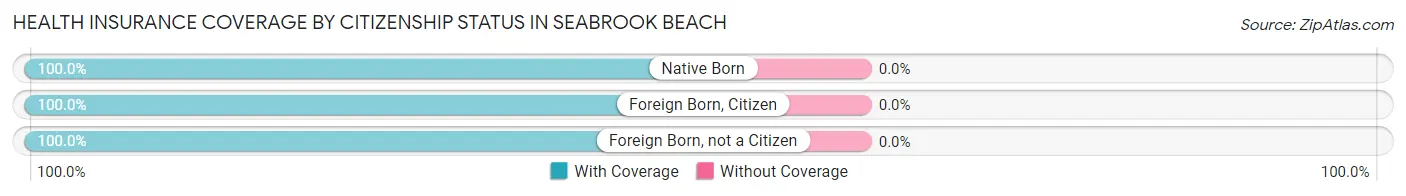
| Citizenship Status | With Coverage | Without Coverage |
| Native Born | 24 (100.0%) | 0 (0.0%) |
| Foreign Born, Citizen | 49 (100.0%) | 0 (0.0%) |
| Foreign Born, not a Citizen | 24 (100.0%) | 0 (0.0%) |
Health Insurance Coverage by Household Income in Seabrook Beach
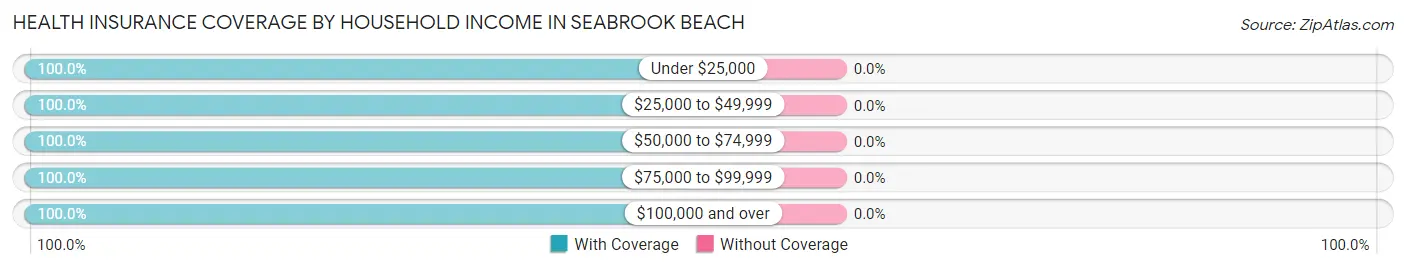
| Household Income | With Coverage | Without Coverage |
| Under $25,000 | 101 (100.0%) | 0 (0.0%) |
| $25,000 to $49,999 | 70 (100.0%) | 0 (0.0%) |
| $50,000 to $74,999 | 15 (100.0%) | 0 (0.0%) |
| $75,000 to $99,999 | 113 (100.0%) | 0 (0.0%) |
| $100,000 and over | 565 (100.0%) | 0 (0.0%) |
Public vs Private Health Insurance Coverage by Age in Seabrook Beach
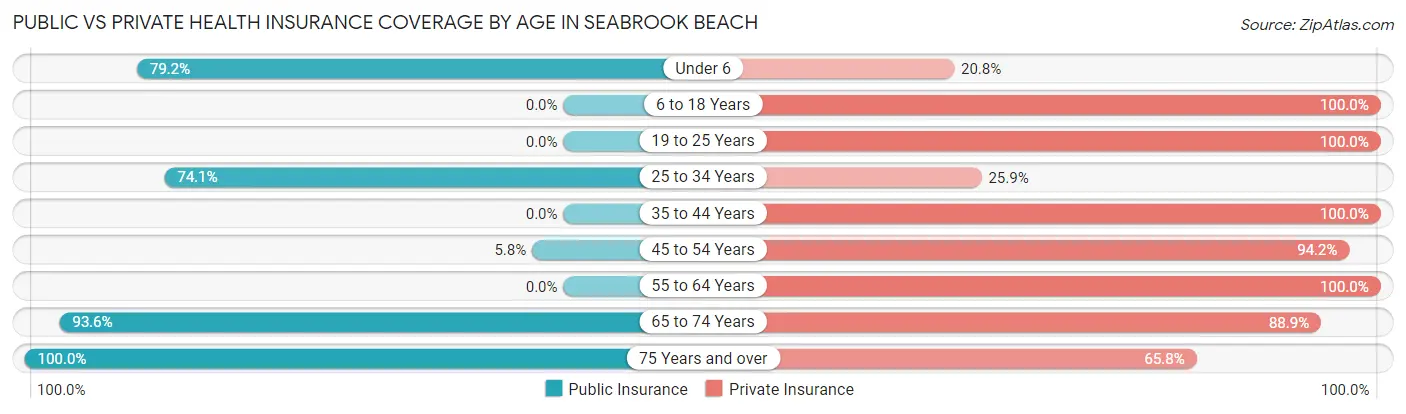
| Age Bracket | Public Insurance | Private Insurance |
| Under 6 | 19 (79.2%) | 5 (20.8%) |
| 6 to 18 Years | 0 (0.0%) | 49 (100.0%) |
| 19 to 25 Years | 0 (0.0%) | 24 (100.0%) |
| 25 to 34 Years | 20 (74.1%) | 7 (25.9%) |
| 35 to 44 Years | 0 (0.0%) | 13 (100.0%) |
| 45 to 54 Years | 10 (5.8%) | 162 (94.2%) |
| 55 to 64 Years | 0 (0.0%) | 177 (100.0%) |
| 65 to 74 Years | 203 (93.5%) | 193 (88.9%) |
| 75 Years and over | 161 (100.0%) | 106 (65.8%) |
| Total | 413 (47.8%) | 736 (85.2%) |
Disability Status by Sex by Age in Seabrook Beach
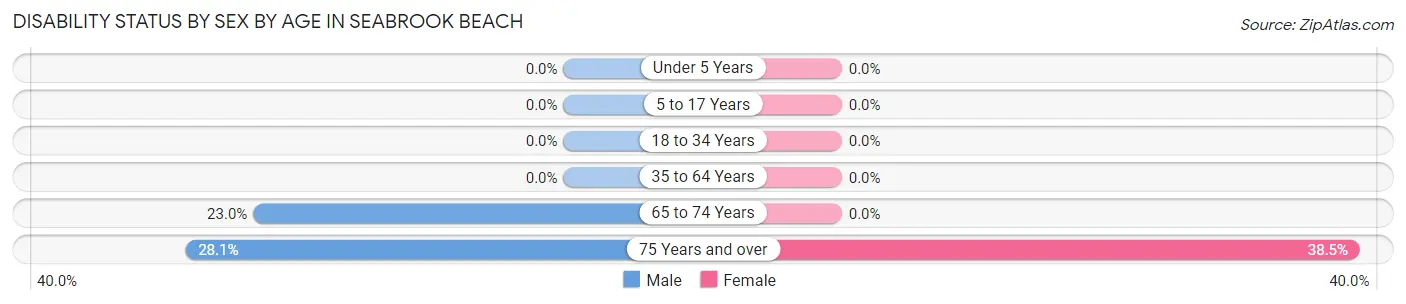
| Age Bracket | Male | Female |
| Under 5 Years | 0 (0.0%) | 0 (0.0%) |
| 5 to 17 Years | 0 (0.0%) | 0 (0.0%) |
| 18 to 34 Years | 0 (0.0%) | 0 (0.0%) |
| 35 to 64 Years | 0 (0.0%) | 0 (0.0%) |
| 65 to 74 Years | 35 (23.0%) | 0 (0.0%) |
| 75 Years and over | 16 (28.1%) | 40 (38.5%) |
Disability Class by Sex by Age in Seabrook Beach
Disability Class: Hearing Difficulty
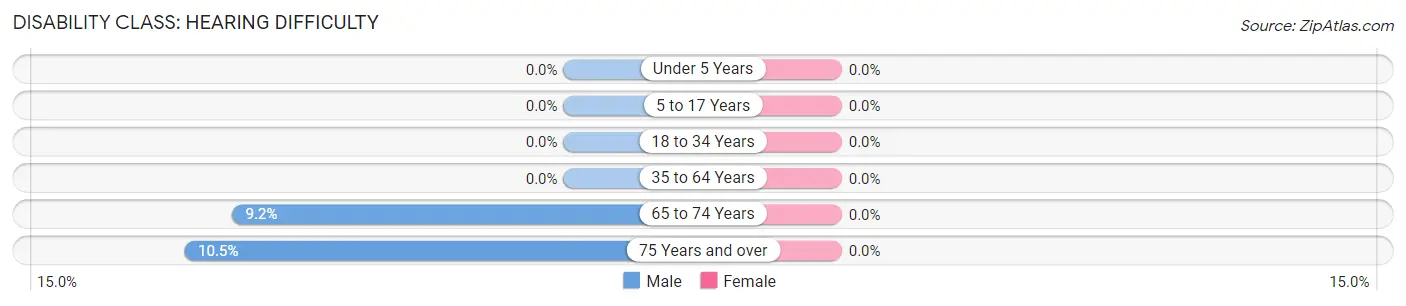
| Age Bracket | Male | Female |
| Under 5 Years | 0 (0.0%) | 0 (0.0%) |
| 5 to 17 Years | 0 (0.0%) | 0 (0.0%) |
| 18 to 34 Years | 0 (0.0%) | 0 (0.0%) |
| 35 to 64 Years | 0 (0.0%) | 0 (0.0%) |
| 65 to 74 Years | 14 (9.2%) | 0 (0.0%) |
| 75 Years and over | 6 (10.5%) | 0 (0.0%) |
Disability Class: Vision Difficulty
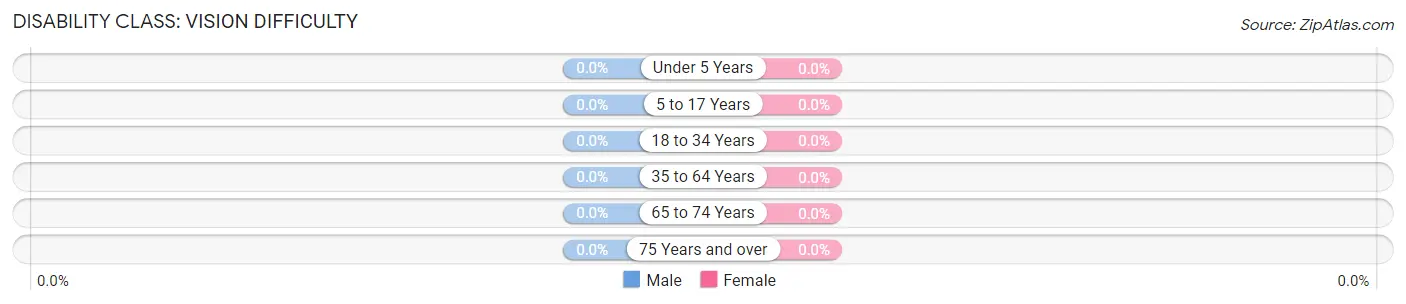
| Age Bracket | Male | Female |
| Under 5 Years | 0 (0.0%) | 0 (0.0%) |
| 5 to 17 Years | 0 (0.0%) | 0 (0.0%) |
| 18 to 34 Years | 0 (0.0%) | 0 (0.0%) |
| 35 to 64 Years | 0 (0.0%) | 0 (0.0%) |
| 65 to 74 Years | 0 (0.0%) | 0 (0.0%) |
| 75 Years and over | 0 (0.0%) | 0 (0.0%) |
Disability Class: Cognitive Difficulty
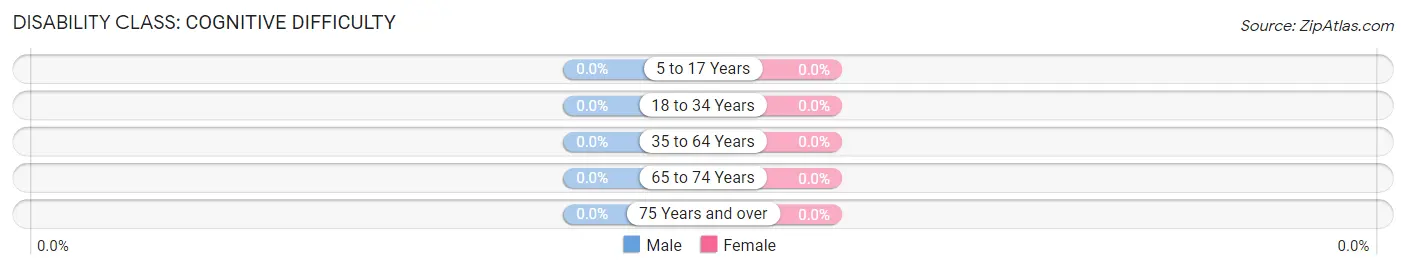
| Age Bracket | Male | Female |
| 5 to 17 Years | 0 (0.0%) | 0 (0.0%) |
| 18 to 34 Years | 0 (0.0%) | 0 (0.0%) |
| 35 to 64 Years | 0 (0.0%) | 0 (0.0%) |
| 65 to 74 Years | 0 (0.0%) | 0 (0.0%) |
| 75 Years and over | 0 (0.0%) | 0 (0.0%) |
Disability Class: Ambulatory Difficulty
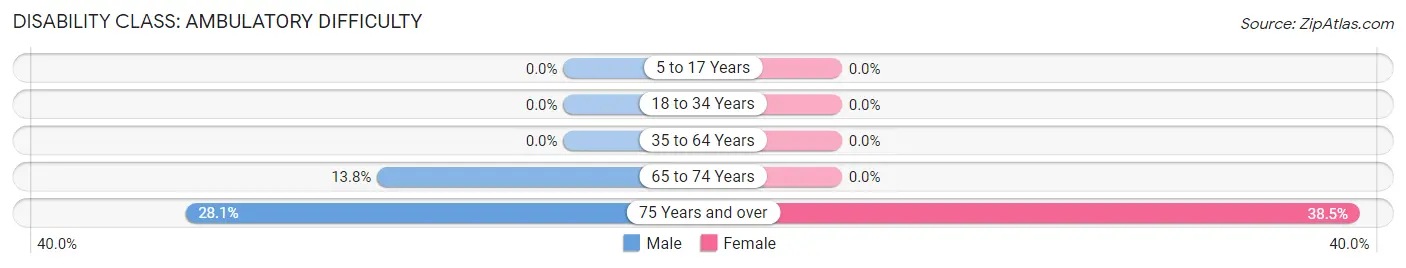
| Age Bracket | Male | Female |
| 5 to 17 Years | 0 (0.0%) | 0 (0.0%) |
| 18 to 34 Years | 0 (0.0%) | 0 (0.0%) |
| 35 to 64 Years | 0 (0.0%) | 0 (0.0%) |
| 65 to 74 Years | 21 (13.8%) | 0 (0.0%) |
| 75 Years and over | 16 (28.1%) | 40 (38.5%) |
Disability Class: Self-Care Difficulty
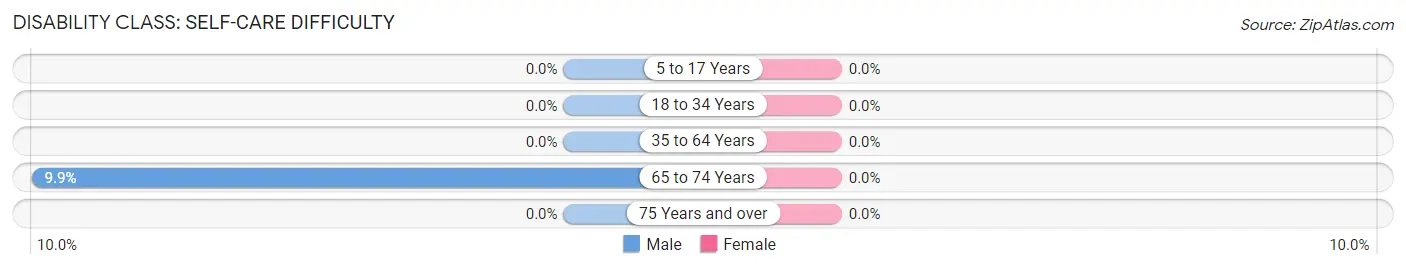
| Age Bracket | Male | Female |
| 5 to 17 Years | 0 (0.0%) | 0 (0.0%) |
| 18 to 34 Years | 0 (0.0%) | 0 (0.0%) |
| 35 to 64 Years | 0 (0.0%) | 0 (0.0%) |
| 65 to 74 Years | 15 (9.9%) | 0 (0.0%) |
| 75 Years and over | 0 (0.0%) | 0 (0.0%) |
Technology Access in Seabrook Beach
Computing Device Access in Seabrook Beach
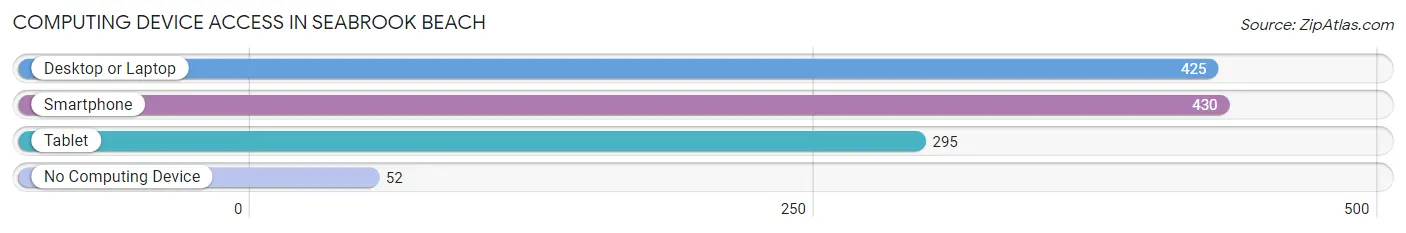
| Device Type | # Households | % Households |
| Desktop or Laptop | 425 | 85.2% |
| Smartphone | 430 | 86.2% |
| Tablet | 295 | 59.1% |
| No Computing Device | 52 | 10.4% |
| Total | 499 | 100.0% |
Internet Access in Seabrook Beach
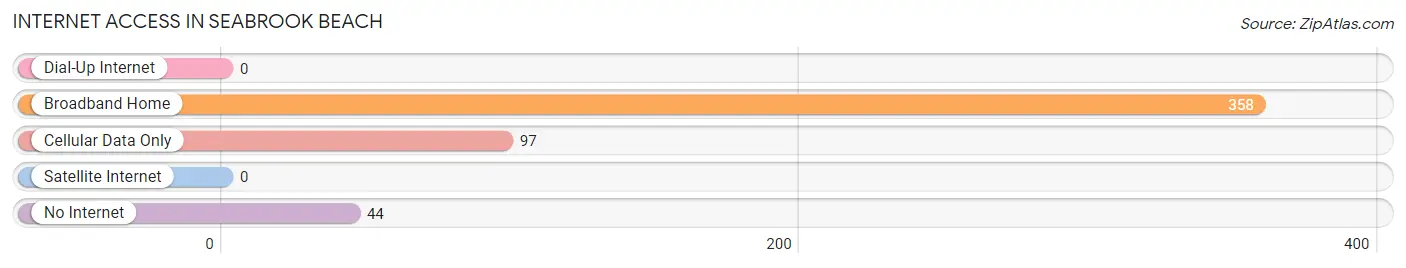
| Internet Type | # Households | % Households |
| Dial-Up Internet | 0 | 0.0% |
| Broadband Home | 358 | 71.7% |
| Cellular Data Only | 97 | 19.4% |
| Satellite Internet | 0 | 0.0% |
| No Internet | 44 | 8.8% |
| Total | 499 | 100.0% |
Seabrook Beach Summary
Seabrook Beach is a small town located in Rockingham County, New Hampshire, United States. It is situated on the Atlantic Ocean, approximately 10 miles south of Portsmouth. The town has a population of approximately 2,000 people and covers an area of 4.2 square miles.
History
Seabrook Beach was first settled in 1638 by a group of English settlers from the Massachusetts Bay Colony. The town was originally known as “Newichawannock”, which was derived from the Abenaki word for “place of many fish”. The town was renamed “Seabrook” in 1768, after the Seabrook family, who were prominent landowners in the area.
In the late 19th century, Seabrook Beach became a popular summer resort destination for wealthy families from Boston and New York. The town was home to several grand hotels, including the Seabrook Beach Hotel, which was built in 1891 and was one of the largest hotels in the area. The hotel was destroyed by fire in 1921.
In the early 20th century, Seabrook Beach became a popular destination for vacationers from all over the country. The town was home to several amusement parks, including the Seabrook Beach Amusement Park, which opened in 1912 and was one of the largest amusement parks in the country. The park closed in the late 1960s.
Geography
Seabrook Beach is located in southeastern New Hampshire, approximately 10 miles south of Portsmouth. The town is situated on the Atlantic Ocean and is bordered by the towns of Hampton, North Hampton, and Hampton Falls. The town is located on a peninsula, with the Atlantic Ocean to the east and the Hampton River to the west.
The town has a total area of 4.2 square miles, of which 0.2 square miles is water. The town is mostly flat, with an elevation of just 10 feet above sea level. The town is home to several small ponds, including Seabrook Pond, which is located in the center of town.
Economy
Seabrook Beach is a primarily residential community, with a small commercial district located along Route 1A. The town is home to several small businesses, including restaurants, convenience stores, and gift shops. The town is also home to several marinas, which provide boat storage and repair services.
The town is also home to several tourist attractions, including the Seabrook Beach Amusement Park, which is now a historical site. The town is also home to several beaches, including Seabrook Beach, which is a popular destination for swimming, fishing, and other recreational activities.
Demographics
As of the 2010 census, Seabrook Beach had a population of 2,000 people. The racial makeup of the town was 97.5% White, 0.5% African American, 0.5% Native American, 0.5% Asian, and 1.0% from other races. The median household income was $60,000, and the median family income was $68,000. The per capita income was $30,000.
Conclusion
Seabrook Beach is a small town located in Rockingham County, New Hampshire, United States. It is situated on the Atlantic Ocean, approximately 10 miles south of Portsmouth. The town has a population of approximately 2,000 people and covers an area of 4.2 square miles. Seabrook Beach was first settled in 1638 and was originally known as “Newichawannock”. The town was renamed “Seabrook” in 1768, after the Seabrook family, who were prominent landowners in the area. In the late 19th century, Seabrook Beach became a popular summer resort destination for wealthy families from Boston and New York. The town is now a primarily residential community, with a small commercial district located along Route 1A. The town is home to several tourist attractions, including the Seabrook Beach Amusement Park, which is now a historical site. As of the 2010 census, Seabrook Beach had a population of 2,000 people. The racial makeup of the town was 97.5% White, 0.5% African American, 0.5% Native American, 0.5% Asian, and 1.0% from other races. The median household income was $60,000, and the median family income was $68,000. The per capita income was $30,000.
Common Questions
What is Per Capita Income in Seabrook Beach?
Per Capita income in Seabrook Beach is $89,645.
What is the Median Family Income in Seabrook Beach?
Median Family Income in Seabrook Beach is $197,321.
What is the Median Household income in Seabrook Beach?
Median Household Income in Seabrook Beach is $107,019.
What is Income or Wage Gap in Seabrook Beach?
Income or Wage Gap in Seabrook Beach is 21.5%.
Women in Seabrook Beach earn 78.5 cents for every dollar earned by a man.
What is Inequality or Gini Index in Seabrook Beach?
Inequality or Gini Index in Seabrook Beach is 0.49.
What is the Total Population of Seabrook Beach?
Total Population of Seabrook Beach is 864.
What is the Total Male Population of Seabrook Beach?
Total Male Population of Seabrook Beach is 428.
What is the Total Female Population of Seabrook Beach?
Total Female Population of Seabrook Beach is 436.
What is the Ratio of Males per 100 Females in Seabrook Beach?
There are 98.17 Males per 100 Females in Seabrook Beach.
What is the Ratio of Females per 100 Males in Seabrook Beach?
There are 101.87 Females per 100 Males in Seabrook Beach.
What is the Median Population Age in Seabrook Beach?
Median Population Age in Seabrook Beach is 61.6 Years.
What is the Average Family Size in Seabrook Beach
Average Family Size in Seabrook Beach is 2.3 People.
What is the Average Household Size in Seabrook Beach
Average Household Size in Seabrook Beach is 1.7 People.
How Large is the Labor Force in Seabrook Beach?
There are 443 People in the Labor Forcein in Seabrook Beach.
What is the Percentage of People in the Labor Force in Seabrook Beach?
53.6% of People are in the Labor Force in Seabrook Beach.
What is the Unemployment Rate in Seabrook Beach?
Unemployment Rate in Seabrook Beach is 8.4%.