Milton, NH Map & Demographics
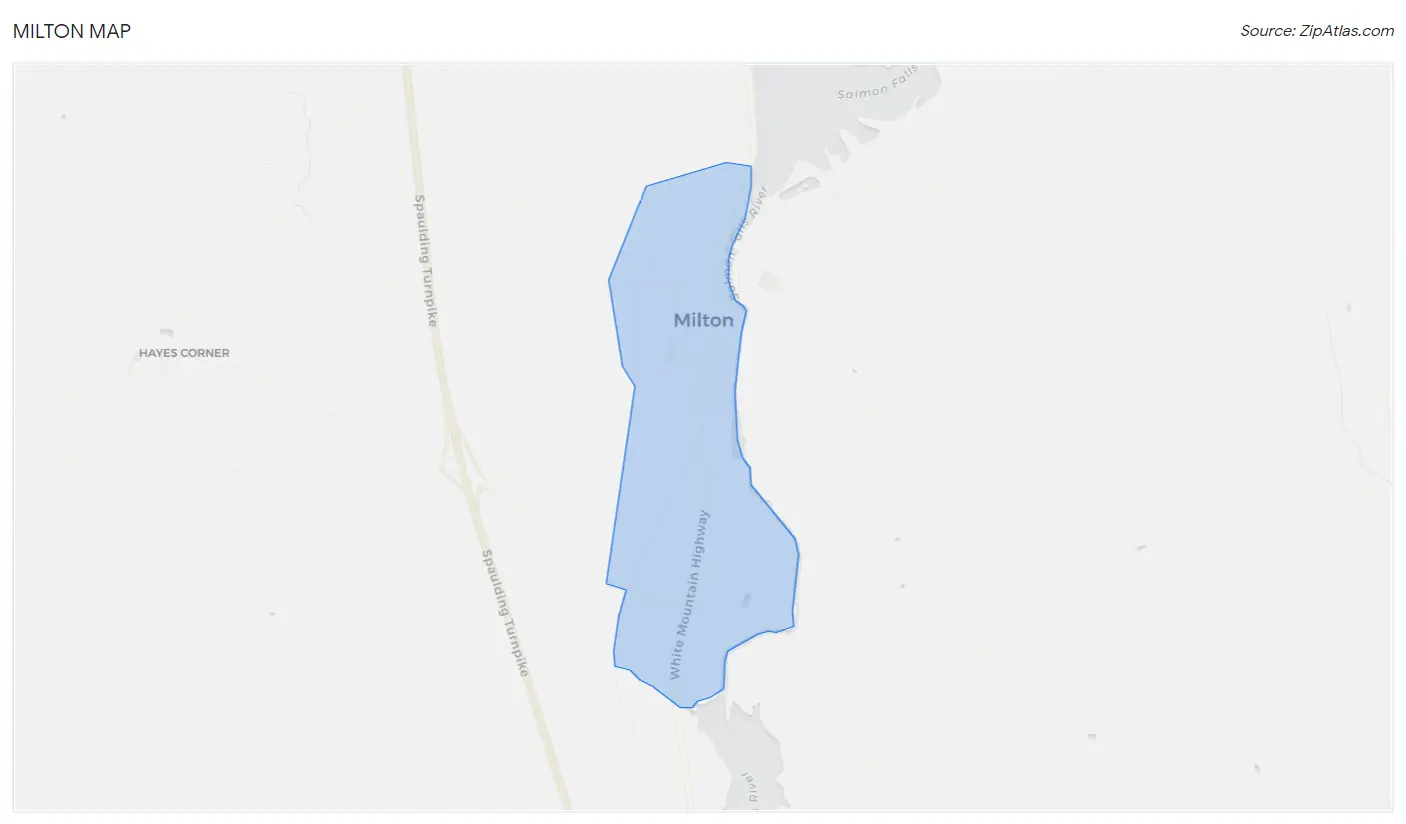
Milton Map
Milton Overview
$37,440
PER CAPITA INCOME
$43,750
AVG HOUSEHOLD INCOME
0.46
INEQUALITY / GINI INDEX
349
TOTAL POPULATION
175
MALE POPULATION
174
FEMALE POPULATION
100.57
MALES / 100 FEMALES
99.43
FEMALES / 100 MALES
61.7
MEDIAN AGE
2.7
AVG FAMILY SIZE
1.7
AVG HOUSEHOLD SIZE
229
LABOR FORCE [ PEOPLE ]
70.0%
PERCENT IN LABOR FORCE
Milton Zip Codes
Milton Area Codes
Income in Milton
Income Overview in Milton
| Characteristic | Number | Measure |
| Per Capita Income | 349 | $37,440 |
| Median Family Income | 80 | $0 |
| Mean Family Income | 80 | $102,371 |
| Median Household Income | 203 | $43,750 |
| Mean Household Income | 203 | $62,781 |
| Income Deficit | 80 | $0 |
| Wage / Income Gap (%) | 349 | 0.00% |
| Wage / Income Gap ($) | 349 | 100.00¢ per $1 |
| Gini / Inequality Index | 349 | 0.46 |
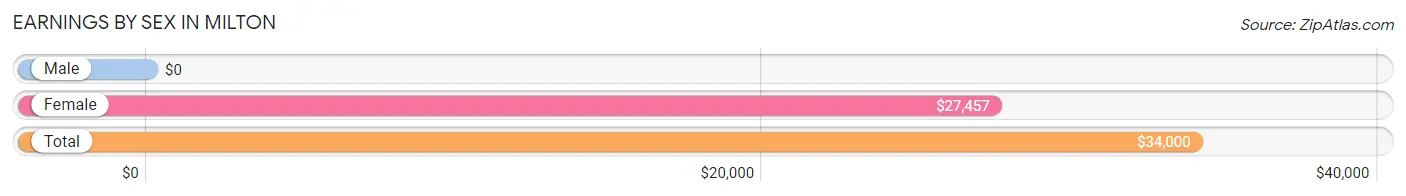
Earnings by Sex in Milton
| Sex | Number | Average Earnings |
| Male | 139 (57.4%) | $0 |
| Female | 103 (42.6%) | $27,457 |
| Total | 242 (100.0%) | $34,000 |
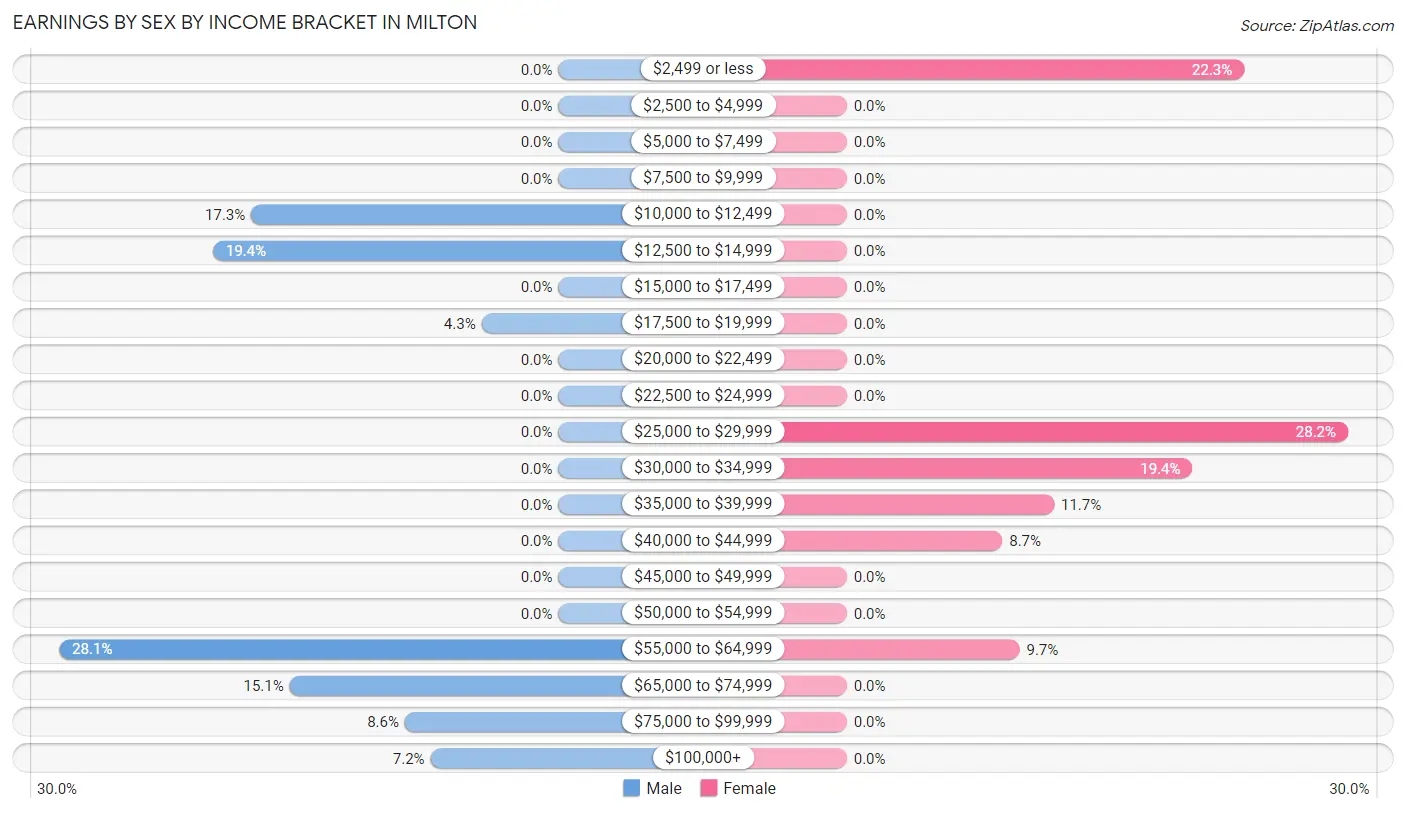
Earnings by Sex by Income Bracket in Milton
The most common earnings brackets in Milton are $55,000 to $64,999 for men (39 | 28.1%) and $25,000 to $29,999 for women (29 | 28.2%).
| Income | Male | Female |
| $2,499 or less | 0 (0.0%) | 23 (22.3%) |
| $2,500 to $4,999 | 0 (0.0%) | 0 (0.0%) |
| $5,000 to $7,499 | 0 (0.0%) | 0 (0.0%) |
| $7,500 to $9,999 | 0 (0.0%) | 0 (0.0%) |
| $10,000 to $12,499 | 24 (17.3%) | 0 (0.0%) |
| $12,500 to $14,999 | 27 (19.4%) | 0 (0.0%) |
| $15,000 to $17,499 | 0 (0.0%) | 0 (0.0%) |
| $17,500 to $19,999 | 6 (4.3%) | 0 (0.0%) |
| $20,000 to $22,499 | 0 (0.0%) | 0 (0.0%) |
| $22,500 to $24,999 | 0 (0.0%) | 0 (0.0%) |
| $25,000 to $29,999 | 0 (0.0%) | 29 (28.2%) |
| $30,000 to $34,999 | 0 (0.0%) | 20 (19.4%) |
| $35,000 to $39,999 | 0 (0.0%) | 12 (11.7%) |
| $40,000 to $44,999 | 0 (0.0%) | 9 (8.7%) |
| $45,000 to $49,999 | 0 (0.0%) | 0 (0.0%) |
| $50,000 to $54,999 | 0 (0.0%) | 0 (0.0%) |
| $55,000 to $64,999 | 39 (28.1%) | 10 (9.7%) |
| $65,000 to $74,999 | 21 (15.1%) | 0 (0.0%) |
| $75,000 to $99,999 | 12 (8.6%) | 0 (0.0%) |
| $100,000+ | 10 (7.2%) | 0 (0.0%) |
| Total | 139 (100.0%) | 103 (100.0%) |
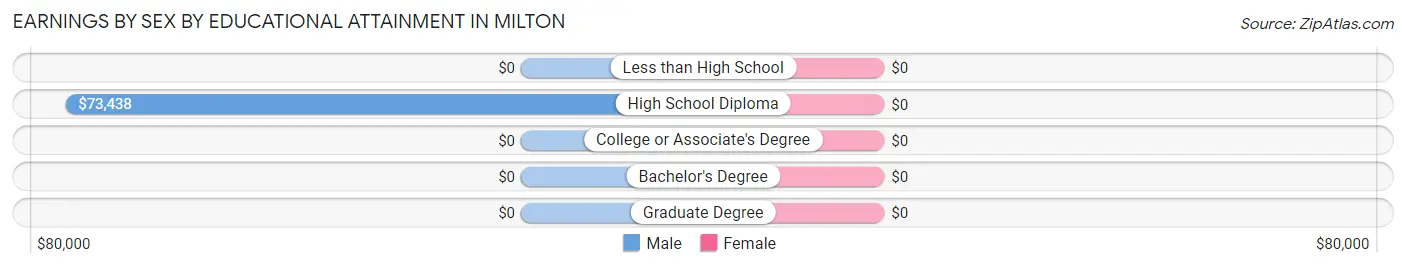
Earnings by Sex by Educational Attainment in Milton
| Educational Attainment | Male Income | Female Income |
| Less than High School | - | - |
| High School Diploma | $73,438 | $0 |
| College or Associate's Degree | - | - |
| Bachelor's Degree | - | - |
| Graduate Degree | - | - |
| Total | - | - |
Family Income in Milton
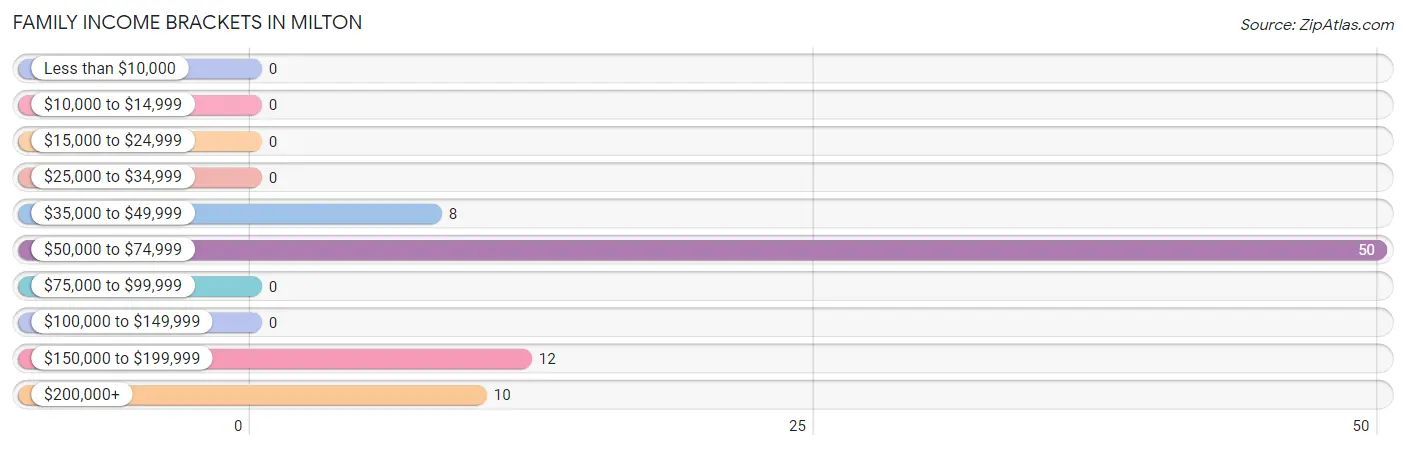
Family Income Brackets in Milton
According to the Milton family income data, there are 50 families falling into the $50,000 to $74,999 income range, which is the most common income bracket and makes up 62.5% of all families.
| Income Bracket | # Families | % Families |
| Less than $10,000 | 0 | 0.0% |
| $10,000 to $14,999 | 0 | 0.0% |
| $15,000 to $24,999 | 0 | 0.0% |
| $25,000 to $34,999 | 0 | 0.0% |
| $35,000 to $49,999 | 8 | 10.0% |
| $50,000 to $74,999 | 50 | 62.5% |
| $75,000 to $99,999 | 0 | 0.0% |
| $100,000 to $149,999 | 0 | 0.0% |
| $150,000 to $199,999 | 12 | 15.0% |
| $200,000+ | 10 | 12.5% |
Family Income by Famaliy Size in Milton
| Income Bracket | # Families | Median Income |
| 2-Person Families | 45 (56.2%) | $0 |
| 3-Person Families | 23 (28.7%) | $0 |
| 4-Person Families | 12 (15.0%) | $0 |
| 5-Person Families | 0 (0.0%) | $0 |
| 6-Person Families | 0 (0.0%) | $0 |
| 7+ Person Families | 0 (0.0%) | $0 |
| Total | 80 (100.0%) | $0 |
Family Income by Number of Earners in Milton
| Number of Earners | # Families | Median Income |
| No Earners | 0 (0.0%) | $0 |
| 1 Earner | 35 (43.8%) | $0 |
| 2 Earners | 33 (41.2%) | $0 |
| 3+ Earners | 12 (15.0%) | $0 |
| Total | 80 (100.0%) | $0 |
Household Income in Milton
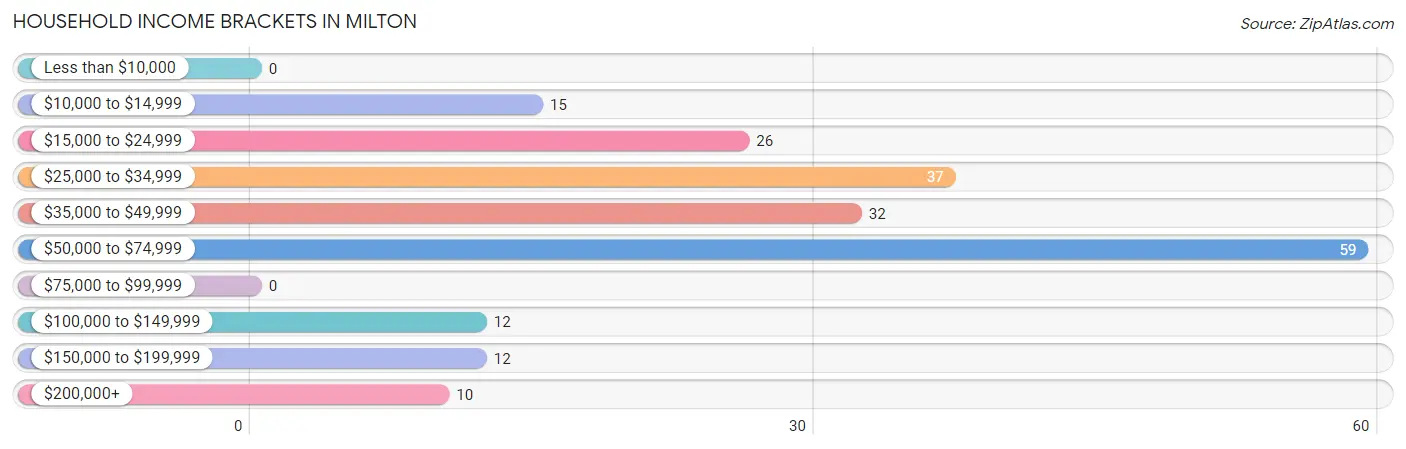
Household Income Brackets in Milton
With 59 households falling in the category, the $50,000 to $74,999 income range is the most frequent in Milton, accounting for 29.1% of all households.
| Income Bracket | # Households | % Households |
| Less than $10,000 | 0 | 0.0% |
| $10,000 to $14,999 | 15 | 7.4% |
| $15,000 to $24,999 | 26 | 12.8% |
| $25,000 to $34,999 | 37 | 18.2% |
| $35,000 to $49,999 | 32 | 15.8% |
| $50,000 to $74,999 | 59 | 29.1% |
| $75,000 to $99,999 | 0 | 0.0% |
| $100,000 to $149,999 | 12 | 5.9% |
| $150,000 to $199,999 | 12 | 5.9% |
| $200,000+ | 10 | 4.9% |
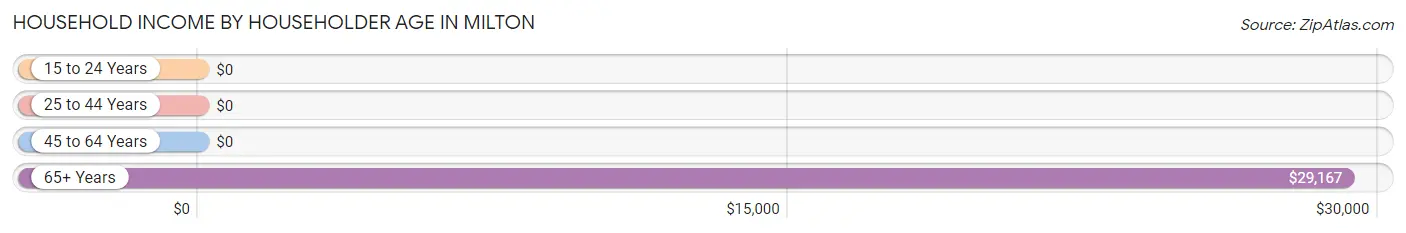
Household Income by Householder Age in Milton
The median household income in Milton is $43,750, with the highest median household income of $29,167 found in the 65+ years age bracket for the primary householder. A total of 104 households (51.2%) fall into this category.
| Income Bracket | # Households | Median Income |
| 15 to 24 Years | 0 (0.0%) | $0 |
| 25 to 44 Years | 9 (4.4%) | $0 |
| 45 to 64 Years | 90 (44.3%) | $0 |
| 65+ Years | 104 (51.2%) | $29,167 |
| Total | 203 (100.0%) | $43,750 |
Poverty in Milton
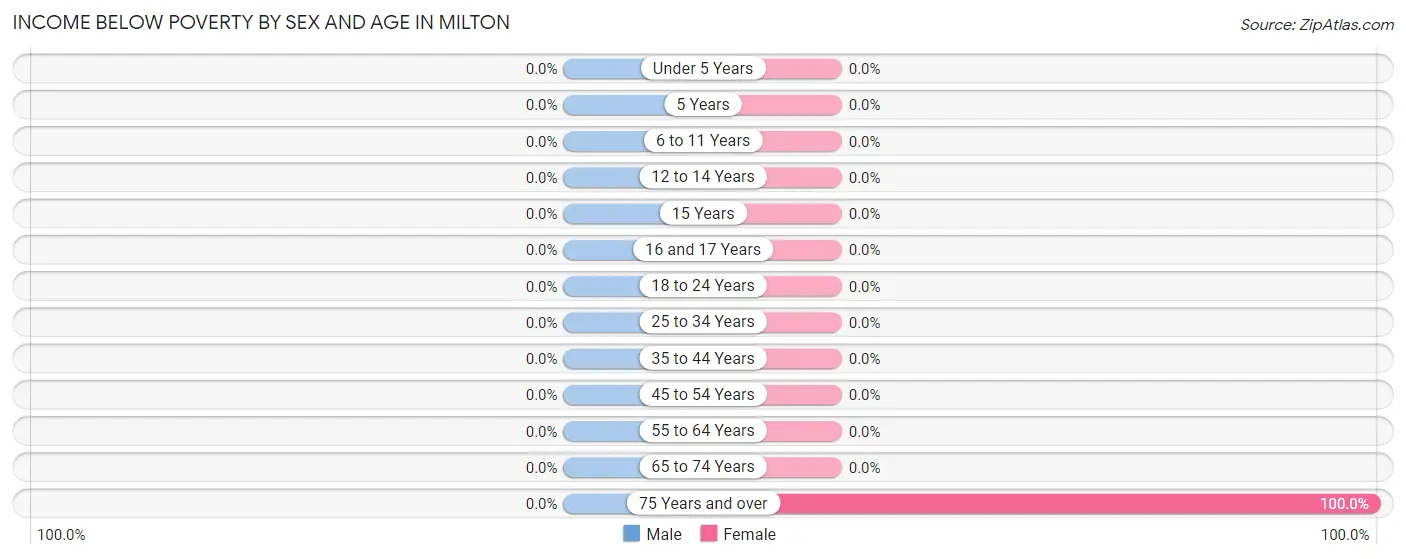
Income Below Poverty by Sex and Age in Milton
| Age Bracket | Male | Female |
| Under 5 Years | 0 (0.0%) | 0 (0.0%) |
| 5 Years | 0 (0.0%) | 0 (0.0%) |
| 6 to 11 Years | 0 (0.0%) | 0 (0.0%) |
| 12 to 14 Years | 0 (0.0%) | 0 (0.0%) |
| 15 Years | 0 (0.0%) | 0 (0.0%) |
| 16 and 17 Years | 0 (0.0%) | 0 (0.0%) |
| 18 to 24 Years | 0 (0.0%) | 0 (0.0%) |
| 25 to 34 Years | 0 (0.0%) | 0 (0.0%) |
| 35 to 44 Years | 0 (0.0%) | 0 (0.0%) |
| 45 to 54 Years | 0 (0.0%) | 0 (0.0%) |
| 55 to 64 Years | 0 (0.0%) | 0 (0.0%) |
| 65 to 74 Years | 0 (0.0%) | 0 (0.0%) |
| 75 Years and over | 0 (0.0%) | 15 (100.0%) |
| Total | 0 (0.0%) | 15 (8.6%) |
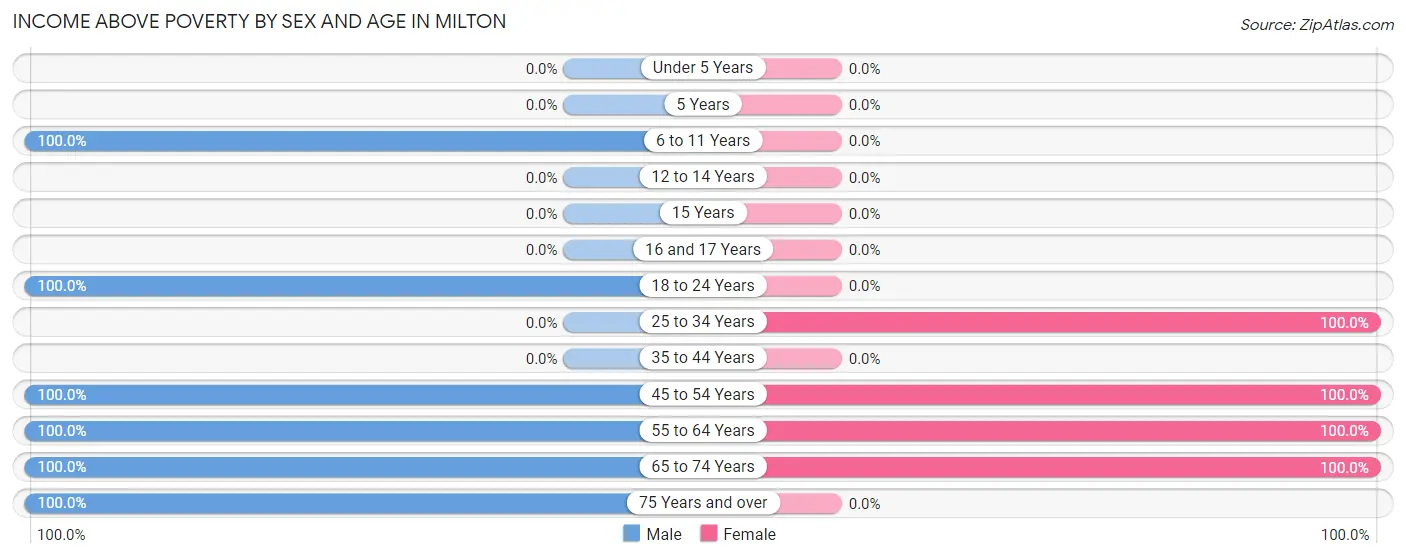
Income Above Poverty by Sex and Age in Milton
According to the poverty statistics in Milton, males aged 6 to 11 years and females aged 25 to 34 years are the age groups that are most secure financially, with 100.0% of males and 100.0% of females in these age groups living above the poverty line.
| Age Bracket | Male | Female |
| Under 5 Years | 0 (0.0%) | 0 (0.0%) |
| 5 Years | 0 (0.0%) | 0 (0.0%) |
| 6 to 11 Years | 22 (100.0%) | 0 (0.0%) |
| 12 to 14 Years | 0 (0.0%) | 0 (0.0%) |
| 15 Years | 0 (0.0%) | 0 (0.0%) |
| 16 and 17 Years | 0 (0.0%) | 0 (0.0%) |
| 18 to 24 Years | 16 (100.0%) | 0 (0.0%) |
| 25 to 34 Years | 0 (0.0%) | 25 (100.0%) |
| 35 to 44 Years | 0 (0.0%) | 0 (0.0%) |
| 45 to 54 Years | 46 (100.0%) | 35 (100.0%) |
| 55 to 64 Years | 21 (100.0%) | 45 (100.0%) |
| 65 to 74 Years | 60 (100.0%) | 54 (100.0%) |
| 75 Years and over | 10 (100.0%) | 0 (0.0%) |
| Total | 175 (100.0%) | 159 (91.4%) |
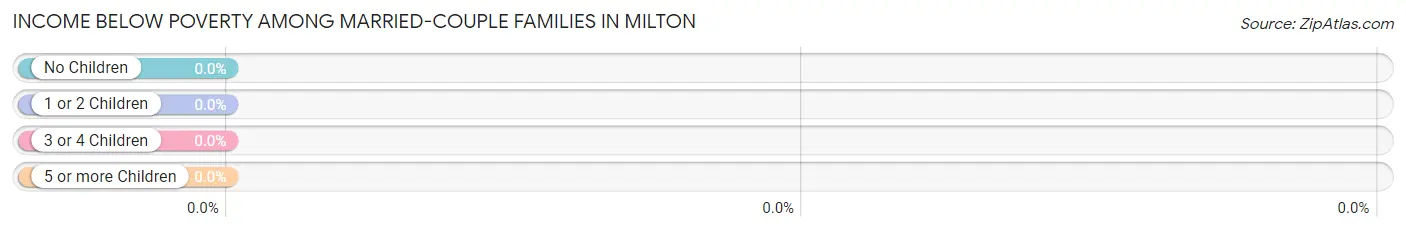
Income Below Poverty Among Married-Couple Families in Milton
| Children | Above Poverty | Below Poverty |
| No Children | 49 (100.0%) | 0 (0.0%) |
| 1 or 2 Children | 23 (100.0%) | 0 (0.0%) |
| 3 or 4 Children | 0 (0.0%) | 0 (0.0%) |
| 5 or more Children | 0 (0.0%) | 0 (0.0%) |
| Total | 72 (100.0%) | 0 (0.0%) |
Income Below Poverty Among Single-Parent Households in Milton
| Children | Single Father | Single Mother |
| No Children | 0 (0.0%) | 0 (0.0%) |
| 1 or 2 Children | 0 (0.0%) | 0 (0.0%) |
| 3 or 4 Children | 0 (0.0%) | 0 (0.0%) |
| 5 or more Children | 0 (0.0%) | 0 (0.0%) |
| Total | 0 (0.0%) | 0 (0.0%) |
Income Below Poverty Among Married-Couple vs Single-Parent Households in Milton
| Children | Married-Couple Families | Single-Parent Households |
| No Children | 0 (0.0%) | 0 (0.0%) |
| 1 or 2 Children | 0 (0.0%) | 0 (0.0%) |
| 3 or 4 Children | 0 (0.0%) | 0 (0.0%) |
| 5 or more Children | 0 (0.0%) | 0 (0.0%) |
| Total | 0 (0.0%) | 0 (0.0%) |
Race in Milton
The most populous races in Milton are , and White / Caucasian (349 | 100.0%).
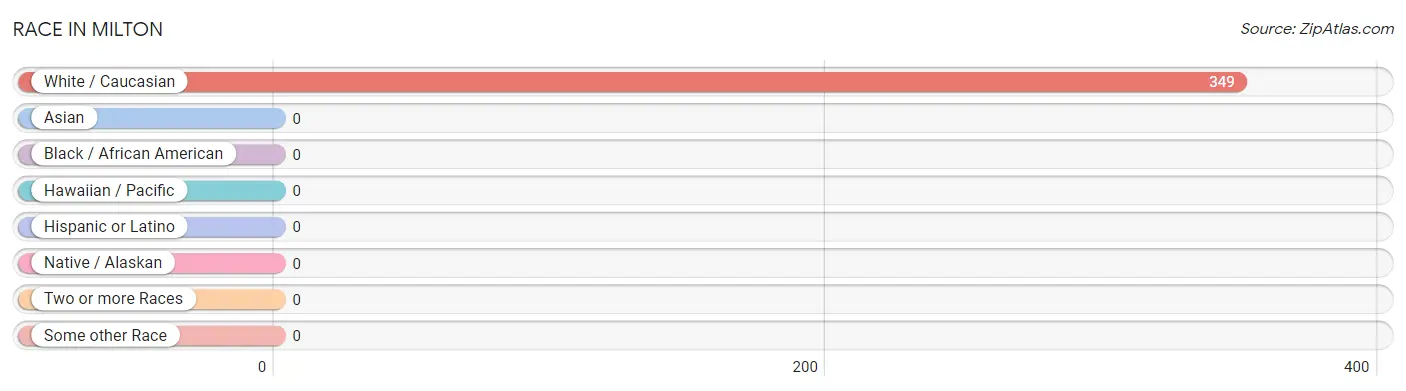
| Race | # Population | % Population |
| Asian | 0 | 0.0% |
| Black / African American | 0 | 0.0% |
| Hawaiian / Pacific | 0 | 0.0% |
| Hispanic or Latino | 0 | 0.0% |
| Native / Alaskan | 0 | 0.0% |
| White / Caucasian | 349 | 100.0% |
| Two or more Races | 0 | 0.0% |
| Some other Race | 0 | 0.0% |
| Total | 349 | 100.0% |
Ancestry in Milton
The most populous ancestries reported in Milton are French Canadian (46 | 13.2%), Italian (45 | 12.9%), Scottish (45 | 12.9%), English (43 | 12.3%), and Irish (43 | 12.3%), together accounting for 63.6% of all Milton residents.
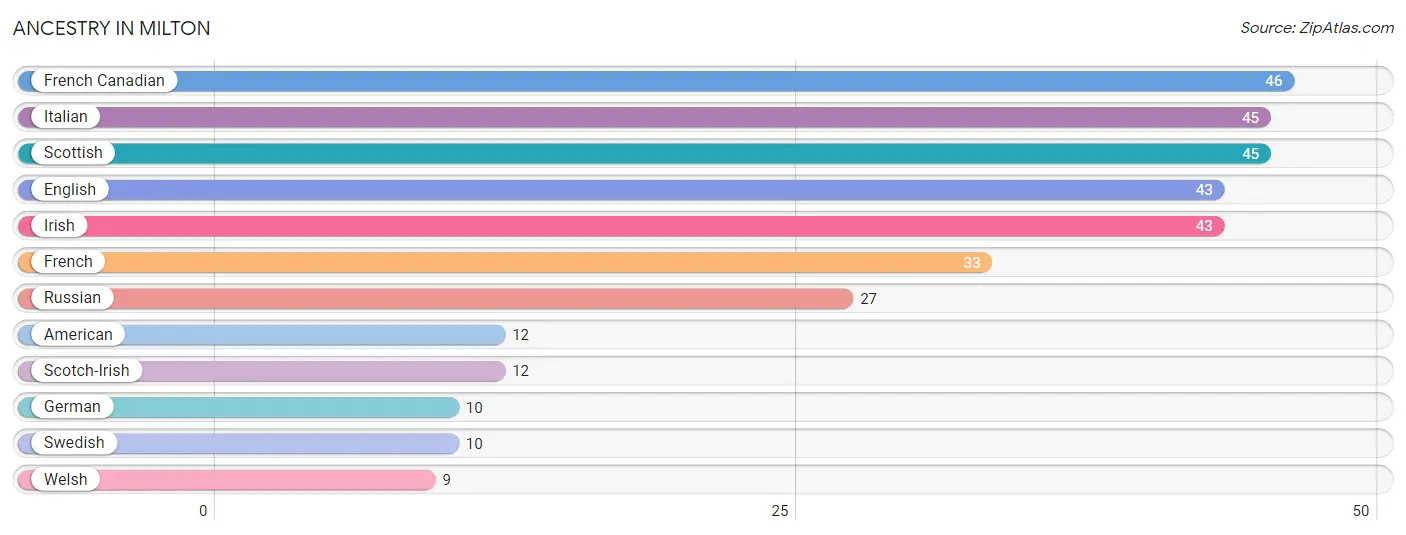
| Ancestry | # Population | % Population |
| American | 12 | 3.4% |
| English | 43 | 12.3% |
| French | 33 | 9.5% |
| French Canadian | 46 | 13.2% |
| German | 10 | 2.9% |
| Irish | 43 | 12.3% |
| Italian | 45 | 12.9% |
| Russian | 27 | 7.7% |
| Scotch-Irish | 12 | 3.4% |
| Scottish | 45 | 12.9% |
| Swedish | 10 | 2.9% |
| Welsh | 9 | 2.6% | View All 12 Rows |
Immigrants in Milton
The most numerous immigrant groups reported in Milton came from , and Canada (17 | 4.9%), together accounting for 4.9% of all Milton residents.

| Immigration Origin | # Population | % Population |
| Canada | 17 | 4.9% | View All 1 Rows |
Sex and Age in Milton
Sex and Age in Milton
The most populous age groups in Milton are 70 to 74 Years (33 | 18.9%) for men and 45 to 49 Years (35 | 20.1%) for women.
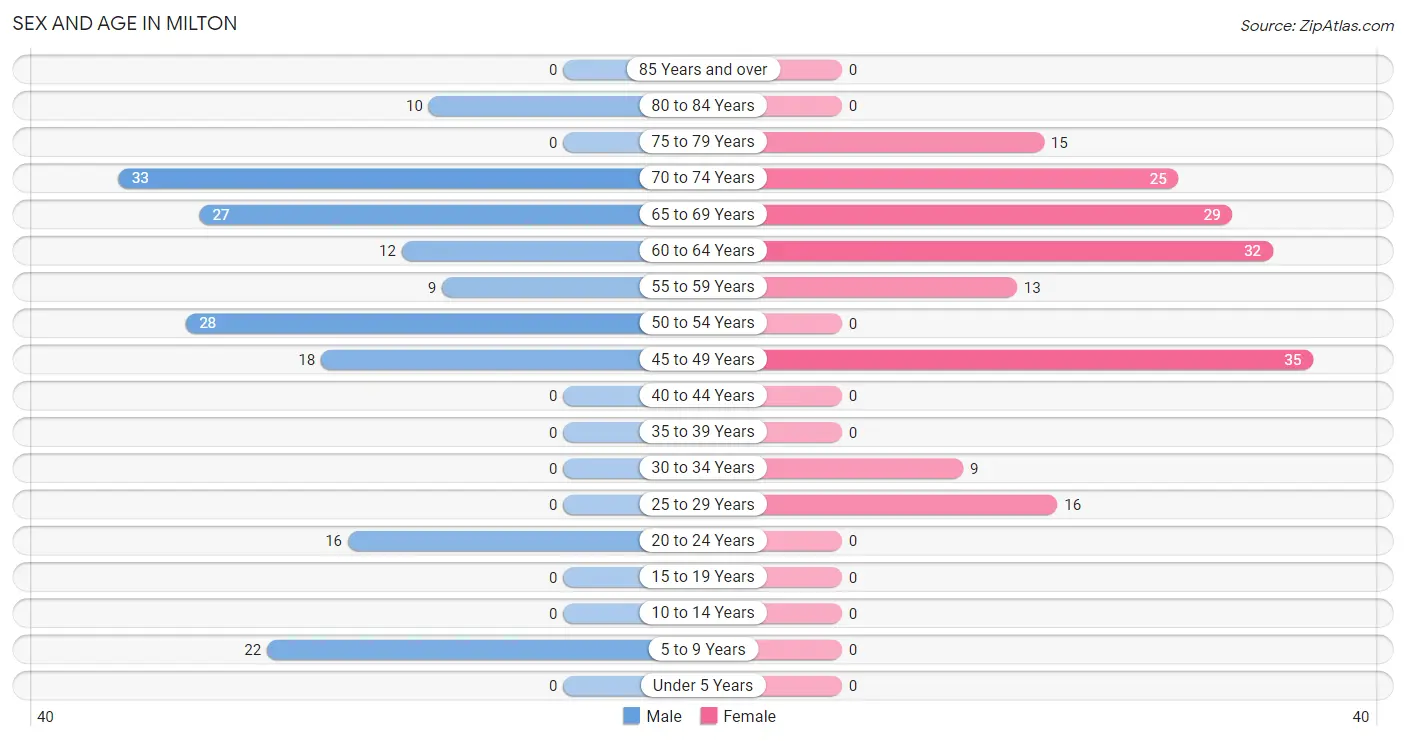
| Age Bracket | Male | Female |
| Under 5 Years | 0 (0.0%) | 0 (0.0%) |
| 5 to 9 Years | 22 (12.6%) | 0 (0.0%) |
| 10 to 14 Years | 0 (0.0%) | 0 (0.0%) |
| 15 to 19 Years | 0 (0.0%) | 0 (0.0%) |
| 20 to 24 Years | 16 (9.1%) | 0 (0.0%) |
| 25 to 29 Years | 0 (0.0%) | 16 (9.2%) |
| 30 to 34 Years | 0 (0.0%) | 9 (5.2%) |
| 35 to 39 Years | 0 (0.0%) | 0 (0.0%) |
| 40 to 44 Years | 0 (0.0%) | 0 (0.0%) |
| 45 to 49 Years | 18 (10.3%) | 35 (20.1%) |
| 50 to 54 Years | 28 (16.0%) | 0 (0.0%) |
| 55 to 59 Years | 9 (5.1%) | 13 (7.5%) |
| 60 to 64 Years | 12 (6.9%) | 32 (18.4%) |
| 65 to 69 Years | 27 (15.4%) | 29 (16.7%) |
| 70 to 74 Years | 33 (18.9%) | 25 (14.4%) |
| 75 to 79 Years | 0 (0.0%) | 15 (8.6%) |
| 80 to 84 Years | 10 (5.7%) | 0 (0.0%) |
| 85 Years and over | 0 (0.0%) | 0 (0.0%) |
| Total | 175 (100.0%) | 174 (100.0%) |
Families and Households in Milton
Median Family Size in Milton
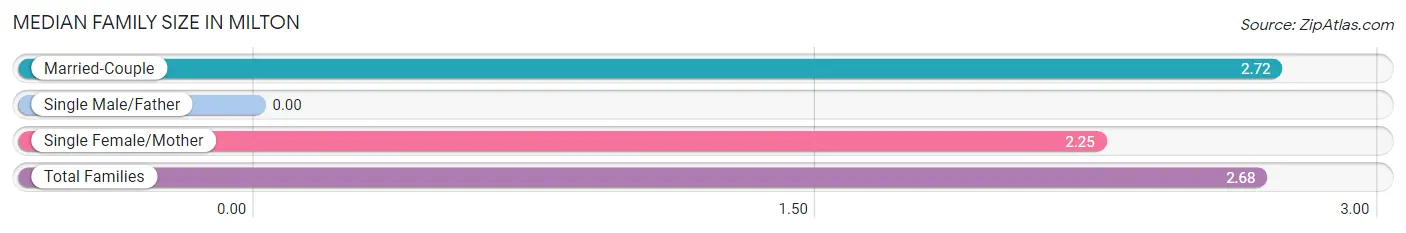
| Family Type | # Families | Family Size |
| Married-Couple | 72 (90.0%) | 2.72 |
| Single Male/Father | 0 (0.0%) | - |
| Single Female/Mother | 8 (10.0%) | 2.25 |
| Total Families | 80 (100.0%) | 2.68 |
Median Household Size in Milton
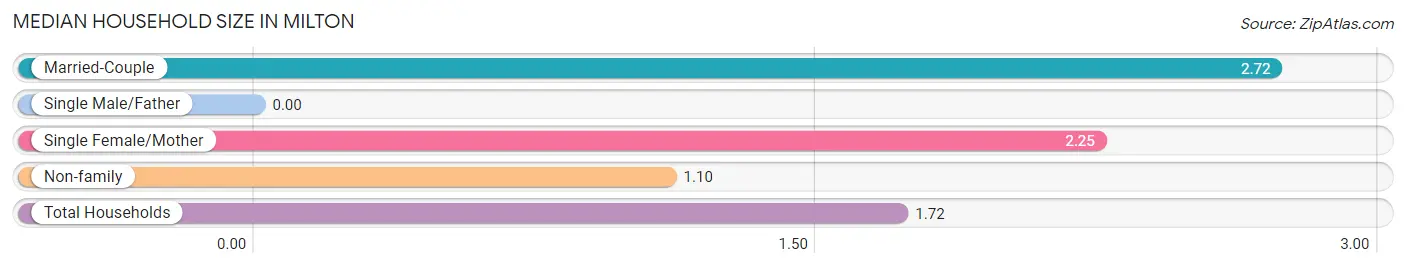
| Household Type | # Households | Household Size |
| Married-Couple | 72 (35.5%) | 2.72 |
| Single Male/Father | 0 (0.0%) | - |
| Single Female/Mother | 8 (3.9%) | 2.25 |
| Non-family | 123 (60.6%) | 1.10 |
| Total Households | 203 (100.0%) | 1.72 |
Household Size by Marriage Status in Milton
Out of a total of 203 households in Milton, 80 (39.4%) are family households, while 123 (60.6%) are nonfamily households. The most numerous type of family households are 2-person households, comprising 45, and the most common type of nonfamily households are 1-person households, comprising 111.
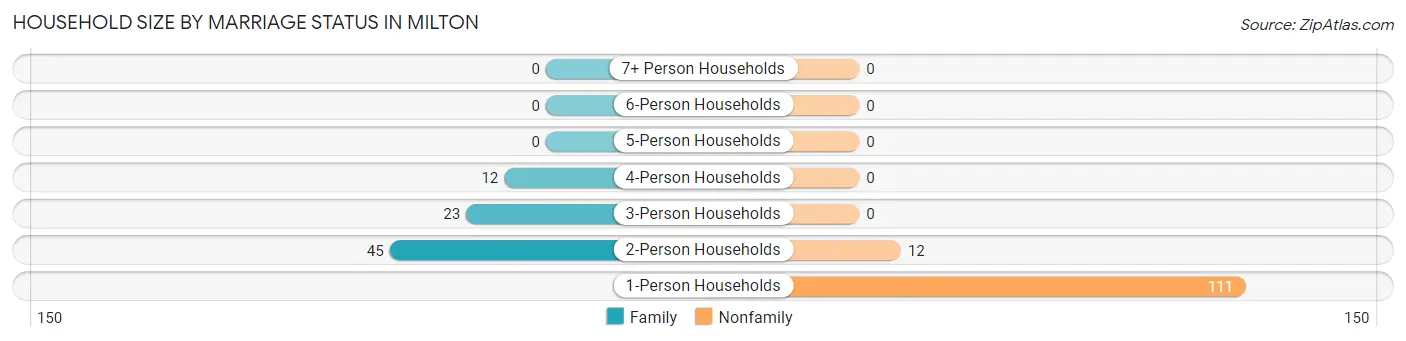
| Household Size | Family Households | Nonfamily Households |
| 1-Person Households | - | 111 (54.7%) |
| 2-Person Households | 45 (22.2%) | 12 (5.9%) |
| 3-Person Households | 23 (11.3%) | 0 (0.0%) |
| 4-Person Households | 12 (5.9%) | 0 (0.0%) |
| 5-Person Households | 0 (0.0%) | 0 (0.0%) |
| 6-Person Households | 0 (0.0%) | 0 (0.0%) |
| 7+ Person Households | 0 (0.0%) | 0 (0.0%) |
| Total | 80 (39.4%) | 123 (60.6%) |
Female Fertility in Milton
Fertility by Age in Milton
| Age Bracket | Women with Births | Births / 1,000 Women |
| 15 to 19 years | 0 (0.0%) | 0.0 |
| 20 to 34 years | 0 (0.0%) | 0.0 |
| 35 to 50 years | 0 (0.0%) | 0.0 |
| Total | 0 (0.0%) | 0.0 |
Fertility by Age by Marriage Status in Milton
| Age Bracket | Married | Unmarried |
| 15 to 19 years | 0 (0.0%) | 0 (0.0%) |
| 20 to 34 years | 0 (0.0%) | 0 (0.0%) |
| 35 to 50 years | 0 (0.0%) | 0 (0.0%) |
| Total | 0 (0.0%) | 0 (0.0%) |
Fertility by Education in Milton
| Educational Attainment | Women with Births | Births / 1,000 Women |
| Less than High School | 0 (0.0%) | 0.0 |
| High School Diploma | 0 (0.0%) | 0.0 |
| College or Associate's Degree | 0 (0.0%) | 0.0 |
| Bachelor's Degree | 0 (0.0%) | 0.0 |
| Graduate Degree | 0 (0.0%) | 0.0 |
| Total | 0 (0.0%) | 0.0 |
Fertility by Education by Marriage Status in Milton
| Educational Attainment | Married | Unmarried |
| Less than High School | 0 (0.0%) | 0 (0.0%) |
| High School Diploma | 0 (0.0%) | 0 (0.0%) |
| College or Associate's Degree | 0 (0.0%) | 0 (0.0%) |
| Bachelor's Degree | 0 (0.0%) | 0 (0.0%) |
| Graduate Degree | 0 (0.0%) | 0 (0.0%) |
| Total | 0 (0.0%) | 0 (0.0%) |
Employment Characteristics in Milton
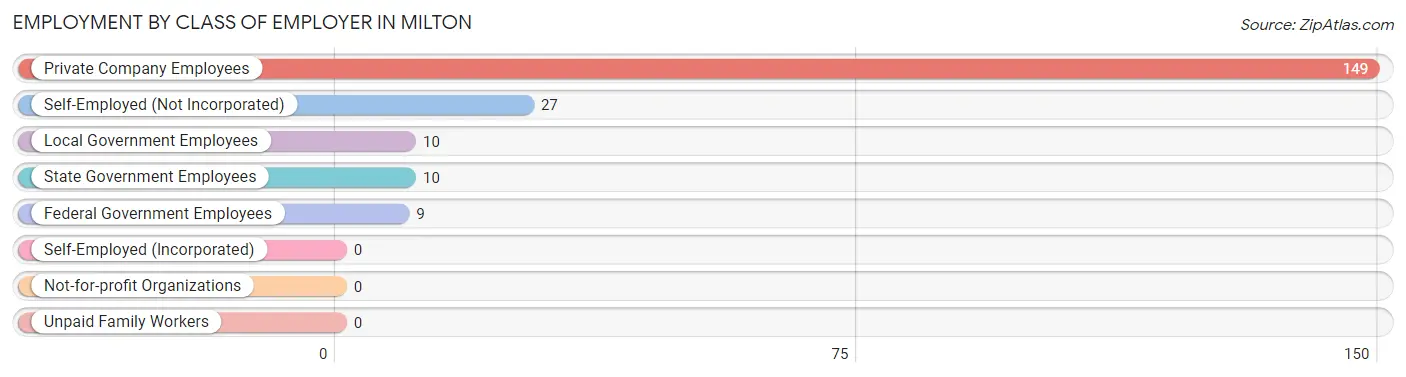
Employment by Class of Employer in Milton
Among the 205 employed individuals in Milton, private company employees (149 | 72.7%), self-employed (not incorporated) (27 | 13.2%), and local government employees (10 | 4.9%) make up the most common classes of employment.
| Employer Class | # Employees | % Employees |
| Private Company Employees | 149 | 72.7% |
| Self-Employed (Incorporated) | 0 | 0.0% |
| Self-Employed (Not Incorporated) | 27 | 13.2% |
| Not-for-profit Organizations | 0 | 0.0% |
| Local Government Employees | 10 | 4.9% |
| State Government Employees | 10 | 4.9% |
| Federal Government Employees | 9 | 4.4% |
| Unpaid Family Workers | 0 | 0.0% |
| Total | 205 | 100.0% |
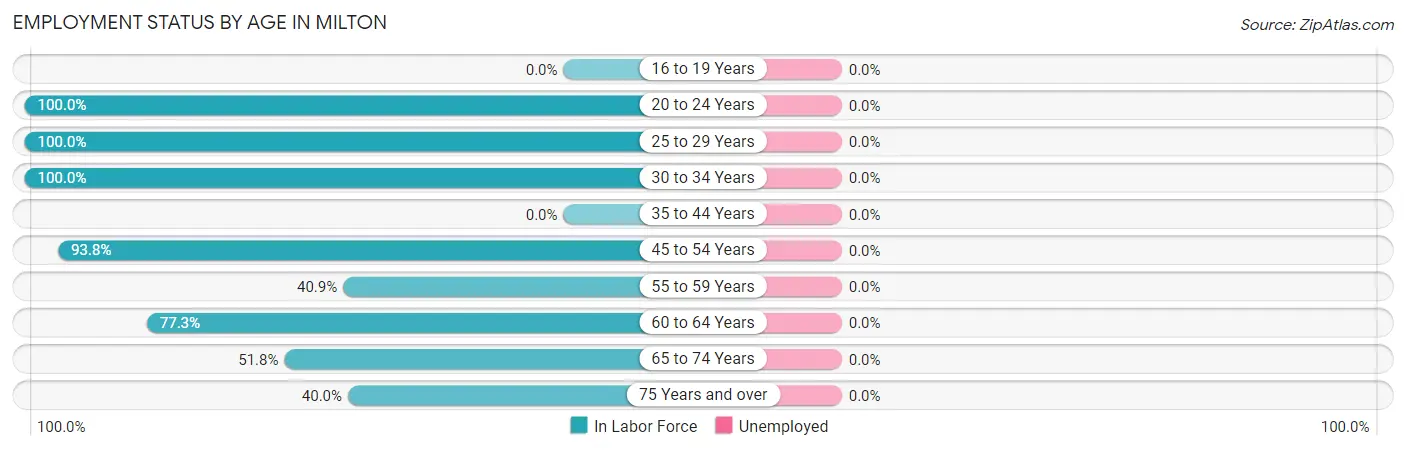
Employment Status by Age in Milton
| Age Bracket | In Labor Force | Unemployed |
| 16 to 19 Years | 0 (0.0%) | 0 (0.0%) |
| 20 to 24 Years | 16 (100.0%) | 0 (0.0%) |
| 25 to 29 Years | 16 (100.0%) | 0 (0.0%) |
| 30 to 34 Years | 9 (100.0%) | 0 (0.0%) |
| 35 to 44 Years | 0 (0.0%) | 0 (0.0%) |
| 45 to 54 Years | 76 (93.8%) | 0 (0.0%) |
| 55 to 59 Years | 9 (40.9%) | 0 (0.0%) |
| 60 to 64 Years | 34 (77.3%) | 0 (0.0%) |
| 65 to 74 Years | 59 (51.8%) | 0 (0.0%) |
| 75 Years and over | 10 (40.0%) | 0 (0.0%) |
| Total | 229 (70.0%) | 0 (0.0%) |
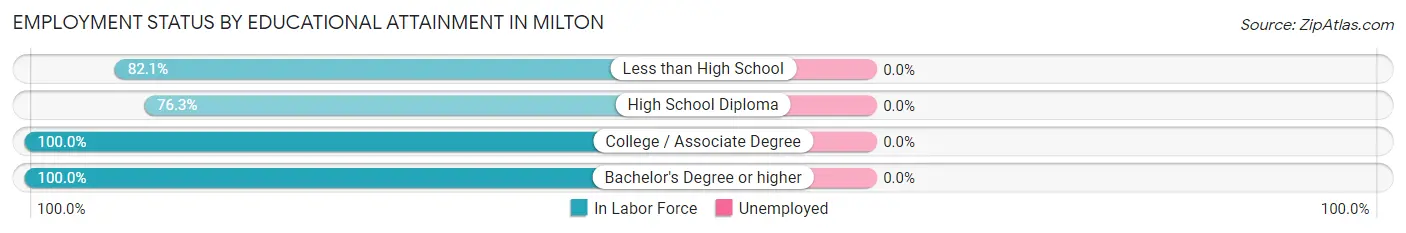
Employment Status by Educational Attainment in Milton
| Educational Attainment | In Labor Force | Unemployed |
| Less than High School | 23 (82.1%) | 0 (0.0%) |
| High School Diploma | 74 (76.3%) | 0 (0.0%) |
| College / Associate Degree | 28 (100.0%) | 0 (0.0%) |
| Bachelor's Degree or higher | 19 (100.0%) | 0 (0.0%) |
| Total | 144 (83.7%) | 0 (0.0%) |
Employment Occupations by Sex in Milton
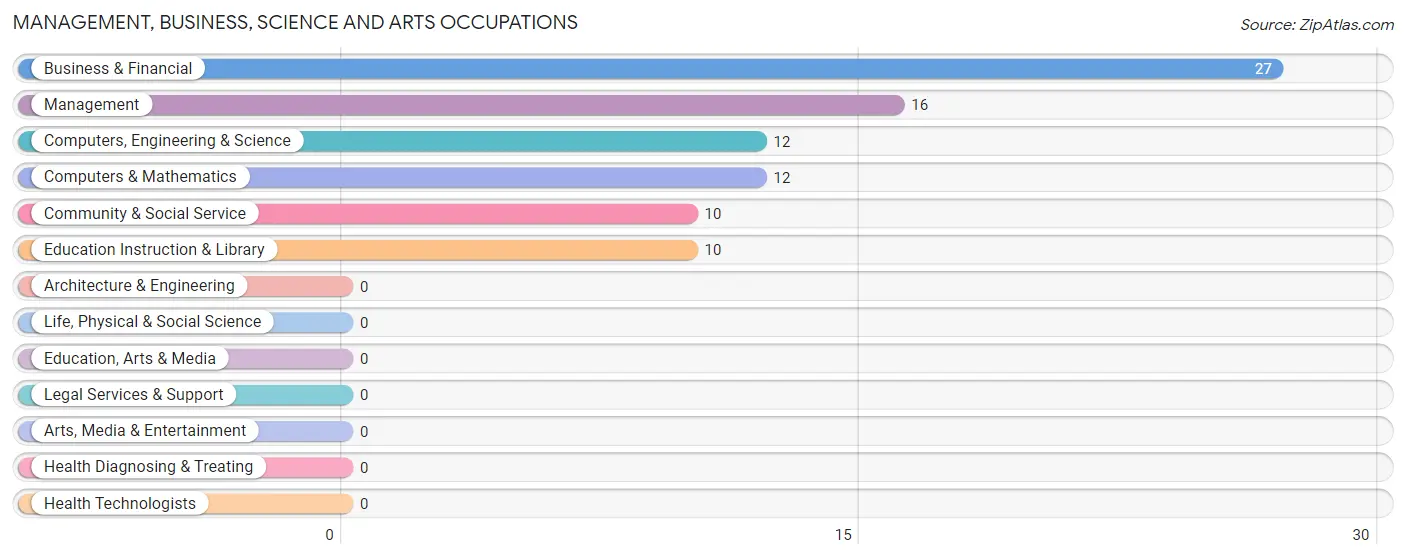
Management, Business, Science and Arts Occupations
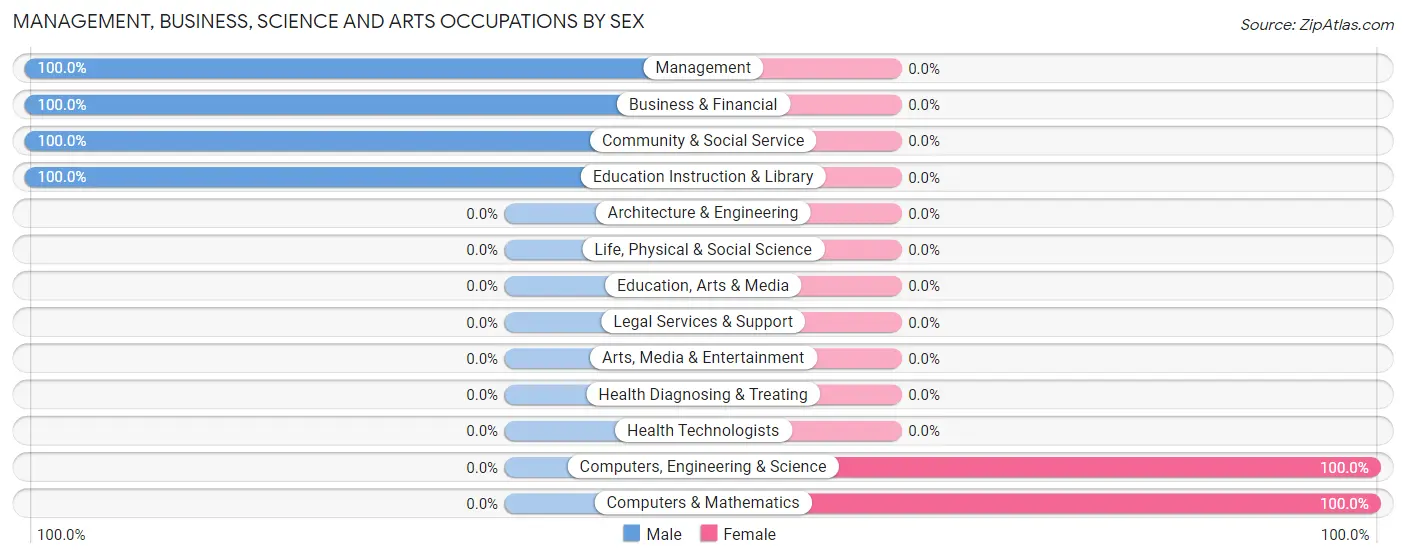
The most common Management, Business, Science and Arts occupations in Milton are Business & Financial (27 | 11.8%), Management (16 | 7.0%), Computers, Engineering & Science (12 | 5.2%), Computers & Mathematics (12 | 5.2%), and Community & Social Service (10 | 4.4%).
Management, Business, Science and Arts Occupations by Sex
Within the Management, Business, Science and Arts occupations in Milton, the most male-oriented occupations are Management (100.0%), Business & Financial (100.0%), and Community & Social Service (100.0%), while the most female-oriented occupations are Computers, Engineering & Science (100.0%), and Computers & Mathematics (100.0%).
| Occupation | Male | Female |
| Management | 16 (100.0%) | 0 (0.0%) |
| Business & Financial | 27 (100.0%) | 0 (0.0%) |
| Computers, Engineering & Science | 0 (0.0%) | 12 (100.0%) |
| Computers & Mathematics | 0 (0.0%) | 12 (100.0%) |
| Architecture & Engineering | 0 (0.0%) | 0 (0.0%) |
| Life, Physical & Social Science | 0 (0.0%) | 0 (0.0%) |
| Community & Social Service | 10 (100.0%) | 0 (0.0%) |
| Education, Arts & Media | 0 (0.0%) | 0 (0.0%) |
| Legal Services & Support | 0 (0.0%) | 0 (0.0%) |
| Education Instruction & Library | 10 (100.0%) | 0 (0.0%) |
| Arts, Media & Entertainment | 0 (0.0%) | 0 (0.0%) |
| Health Diagnosing & Treating | 0 (0.0%) | 0 (0.0%) |
| Health Technologists | 0 (0.0%) | 0 (0.0%) |
| Total (Category) | 53 (81.5%) | 12 (18.5%) |
| Total (Overall) | 139 (60.7%) | 90 (39.3%) |
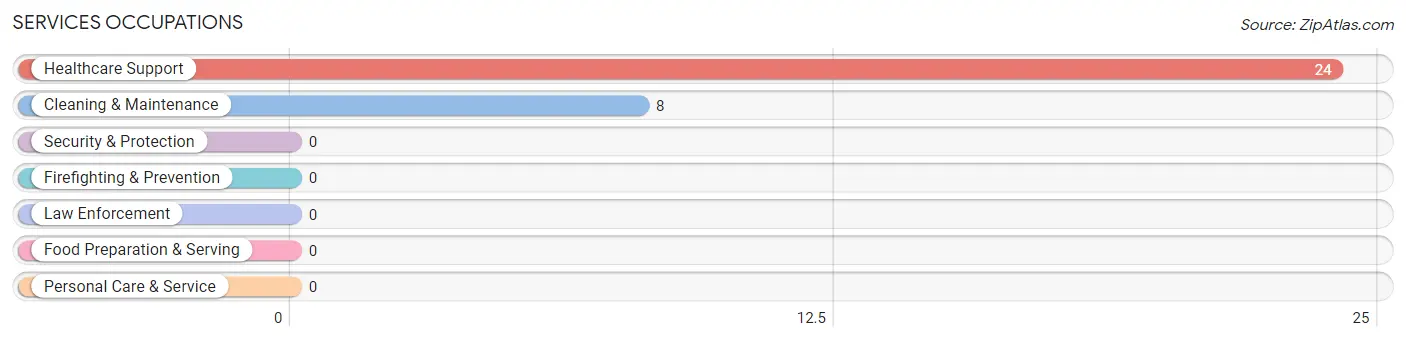
Services Occupations
The most common Services occupations in Milton are Healthcare Support (24 | 10.5%), and Cleaning & Maintenance (8 | 3.5%).
Services Occupations by Sex
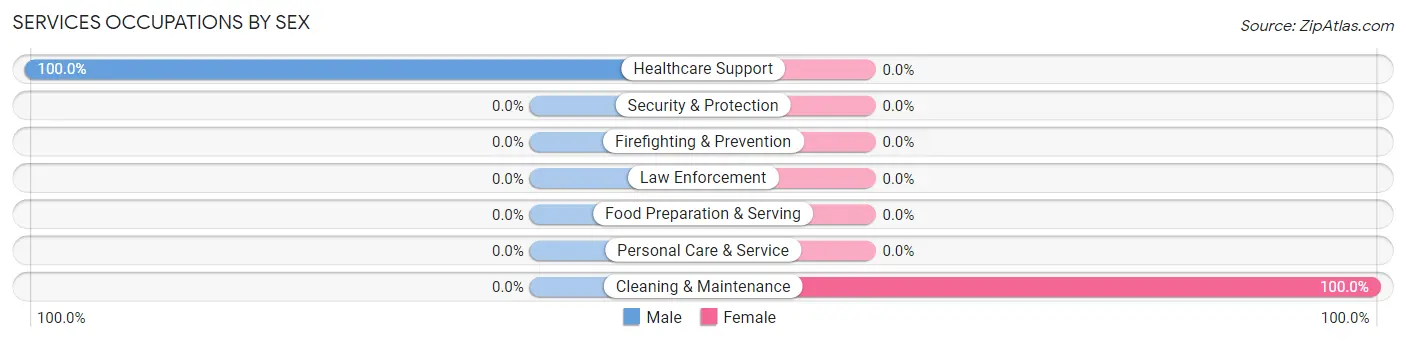
| Occupation | Male | Female |
| Healthcare Support | 24 (100.0%) | 0 (0.0%) |
| Security & Protection | 0 (0.0%) | 0 (0.0%) |
| Firefighting & Prevention | 0 (0.0%) | 0 (0.0%) |
| Law Enforcement | 0 (0.0%) | 0 (0.0%) |
| Food Preparation & Serving | 0 (0.0%) | 0 (0.0%) |
| Cleaning & Maintenance | 0 (0.0%) | 8 (100.0%) |
| Personal Care & Service | 0 (0.0%) | 0 (0.0%) |
| Total (Category) | 24 (75.0%) | 8 (25.0%) |
| Total (Overall) | 139 (60.7%) | 90 (39.3%) |
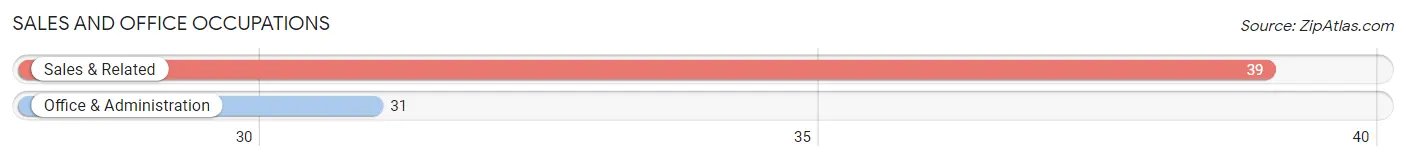
Sales and Office Occupations
The most common Sales and Office occupations in Milton are Sales & Related (39 | 17.0%), and Office & Administration (31 | 13.5%).
Sales and Office Occupations by Sex
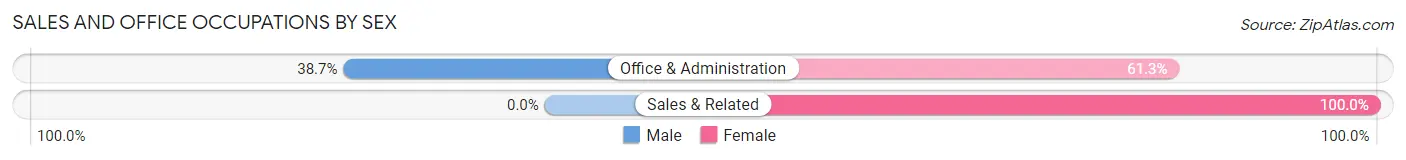
| Occupation | Male | Female |
| Sales & Related | 0 (0.0%) | 39 (100.0%) |
| Office & Administration | 12 (38.7%) | 19 (61.3%) |
| Total (Category) | 12 (17.1%) | 58 (82.9%) |
| Total (Overall) | 139 (60.7%) | 90 (39.3%) |
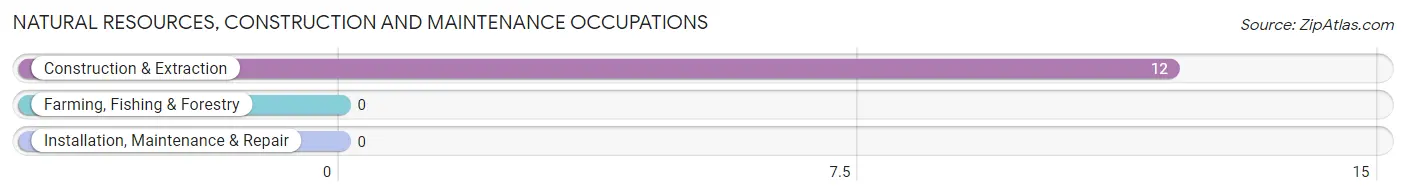
Natural Resources, Construction and Maintenance Occupations
The most common Natural Resources, Construction and Maintenance occupations in Milton are , and Construction & Extraction (12 | 5.2%).
Natural Resources, Construction and Maintenance Occupations by Sex
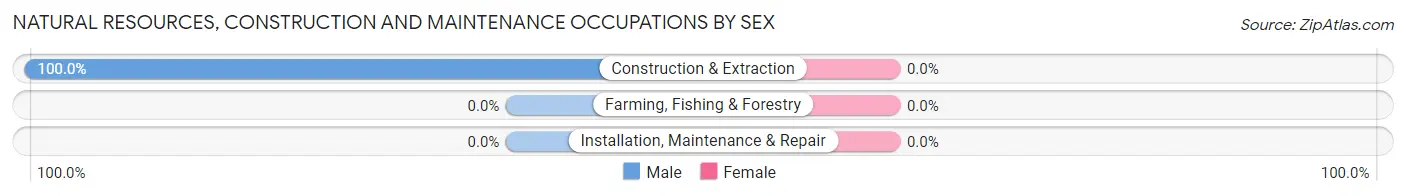
| Occupation | Male | Female |
| Farming, Fishing & Forestry | 0 (0.0%) | 0 (0.0%) |
| Construction & Extraction | 12 (100.0%) | 0 (0.0%) |
| Installation, Maintenance & Repair | 0 (0.0%) | 0 (0.0%) |
| Total (Category) | 12 (100.0%) | 0 (0.0%) |
| Total (Overall) | 139 (60.7%) | 90 (39.3%) |
Production, Transportation and Moving Occupations
The most common Production, Transportation and Moving occupations in Milton are Production (35 | 15.3%), and Material Moving (15 | 6.6%).
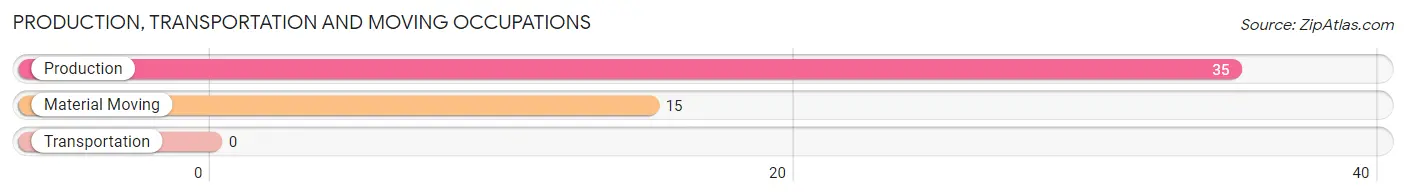
Production, Transportation and Moving Occupations by Sex
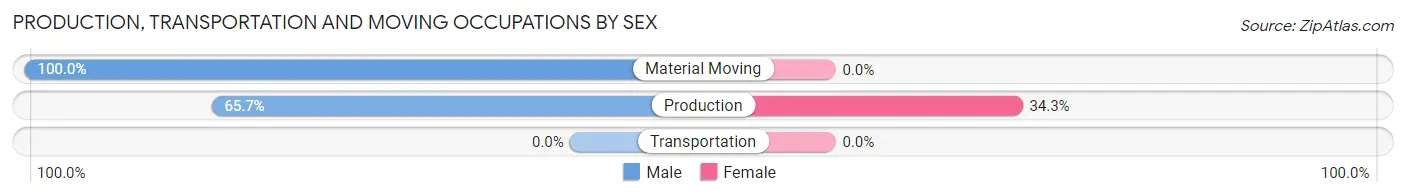
| Occupation | Male | Female |
| Production | 23 (65.7%) | 12 (34.3%) |
| Transportation | 0 (0.0%) | 0 (0.0%) |
| Material Moving | 15 (100.0%) | 0 (0.0%) |
| Total (Category) | 38 (76.0%) | 12 (24.0%) |
| Total (Overall) | 139 (60.7%) | 90 (39.3%) |
Employment Industries by Sex in Milton
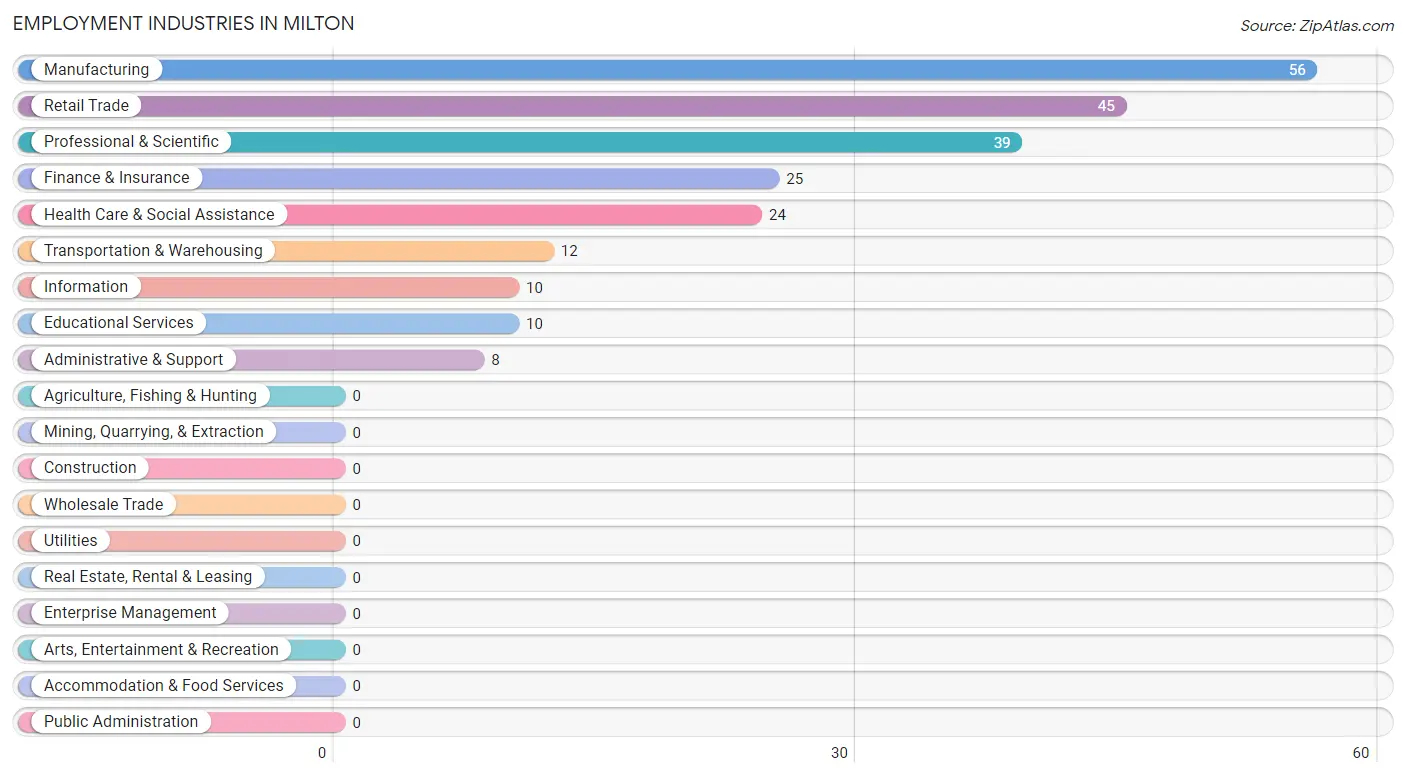
Employment Industries in Milton
The major employment industries in Milton include Manufacturing (56 | 24.4%), Retail Trade (45 | 19.7%), Professional & Scientific (39 | 17.0%), Finance & Insurance (25 | 10.9%), and Health Care & Social Assistance (24 | 10.5%).
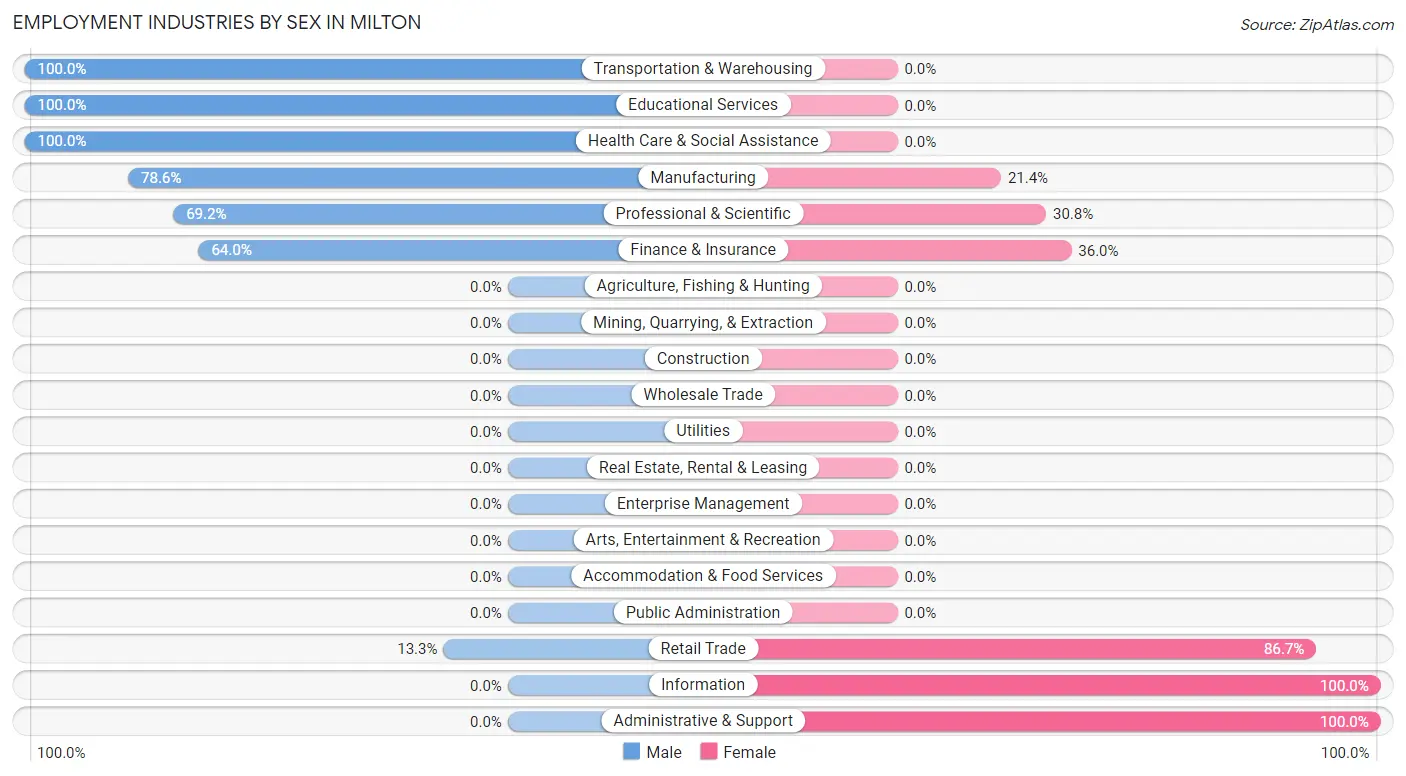
Employment Industries by Sex in Milton
The Milton industries that see more men than women are Transportation & Warehousing (100.0%), Educational Services (100.0%), and Health Care & Social Assistance (100.0%), whereas the industries that tend to have a higher number of women are Information (100.0%), Administrative & Support (100.0%), and Retail Trade (86.7%).
| Industry | Male | Female |
| Agriculture, Fishing & Hunting | 0 (0.0%) | 0 (0.0%) |
| Mining, Quarrying, & Extraction | 0 (0.0%) | 0 (0.0%) |
| Construction | 0 (0.0%) | 0 (0.0%) |
| Manufacturing | 44 (78.6%) | 12 (21.4%) |
| Wholesale Trade | 0 (0.0%) | 0 (0.0%) |
| Retail Trade | 6 (13.3%) | 39 (86.7%) |
| Transportation & Warehousing | 12 (100.0%) | 0 (0.0%) |
| Utilities | 0 (0.0%) | 0 (0.0%) |
| Information | 0 (0.0%) | 10 (100.0%) |
| Finance & Insurance | 16 (64.0%) | 9 (36.0%) |
| Real Estate, Rental & Leasing | 0 (0.0%) | 0 (0.0%) |
| Professional & Scientific | 27 (69.2%) | 12 (30.8%) |
| Enterprise Management | 0 (0.0%) | 0 (0.0%) |
| Administrative & Support | 0 (0.0%) | 8 (100.0%) |
| Educational Services | 10 (100.0%) | 0 (0.0%) |
| Health Care & Social Assistance | 24 (100.0%) | 0 (0.0%) |
| Arts, Entertainment & Recreation | 0 (0.0%) | 0 (0.0%) |
| Accommodation & Food Services | 0 (0.0%) | 0 (0.0%) |
| Public Administration | 0 (0.0%) | 0 (0.0%) |
| Total | 139 (60.7%) | 90 (39.3%) |
Education in Milton
School Enrollment in Milton
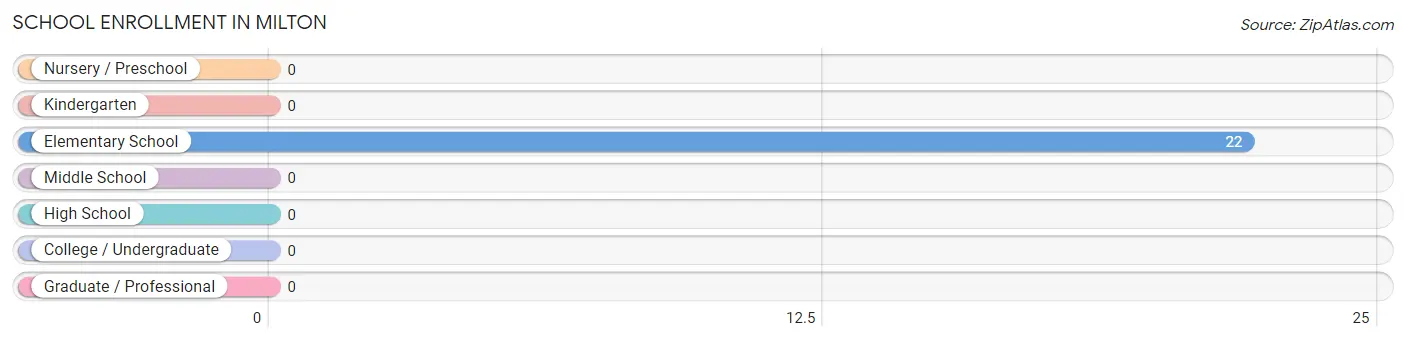
| School Level | # Students | % Students |
| Nursery / Preschool | 0 | 0.0% |
| Kindergarten | 0 | 0.0% |
| Elementary School | 22 | 100.0% |
| Middle School | 0 | 0.0% |
| High School | 0 | 0.0% |
| College / Undergraduate | 0 | 0.0% |
| Graduate / Professional | 0 | 0.0% |
| Total | 22 | 100.0% |
School Enrollment by Age by Funding Source in Milton
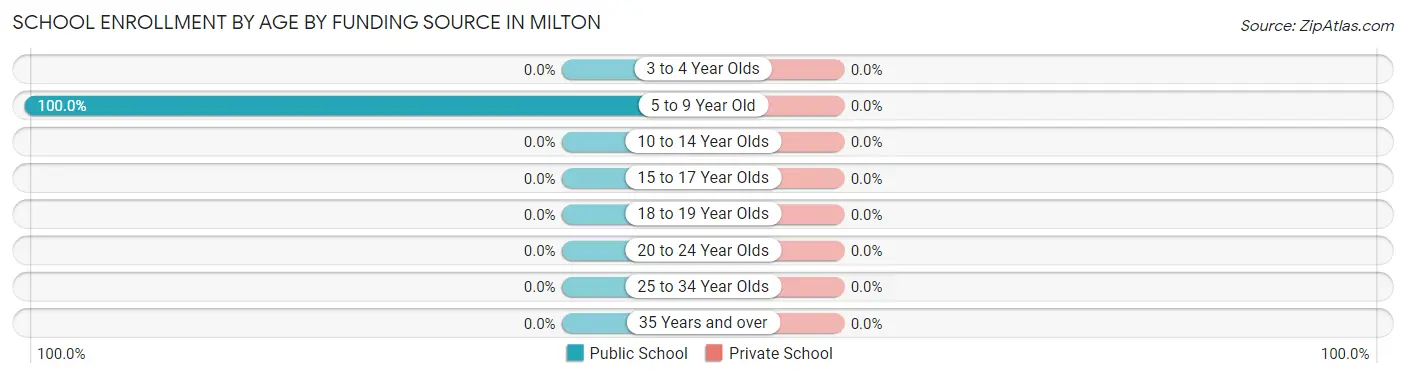
| Age Bracket | Public School | Private School |
| 3 to 4 Year Olds | 0 (0.0%) | 0 (0.0%) |
| 5 to 9 Year Old | 22 (100.0%) | 0 (0.0%) |
| 10 to 14 Year Olds | 0 (0.0%) | 0 (0.0%) |
| 15 to 17 Year Olds | 0 (0.0%) | 0 (0.0%) |
| 18 to 19 Year Olds | 0 (0.0%) | 0 (0.0%) |
| 20 to 24 Year Olds | 0 (0.0%) | 0 (0.0%) |
| 25 to 34 Year Olds | 0 (0.0%) | 0 (0.0%) |
| 35 Years and over | 0 (0.0%) | 0 (0.0%) |
| Total | 22 (100.0%) | 0 (0.0%) |
Educational Attainment by Field of Study in Milton
Business (27 | 33.8%), liberal arts & history (24 | 30.0%), bio, nature & agricultural (20 | 25.0%), and arts & humanities (9 | 11.3%) are the most common fields of study among 80 individuals in Milton who have obtained a bachelor's degree or higher.
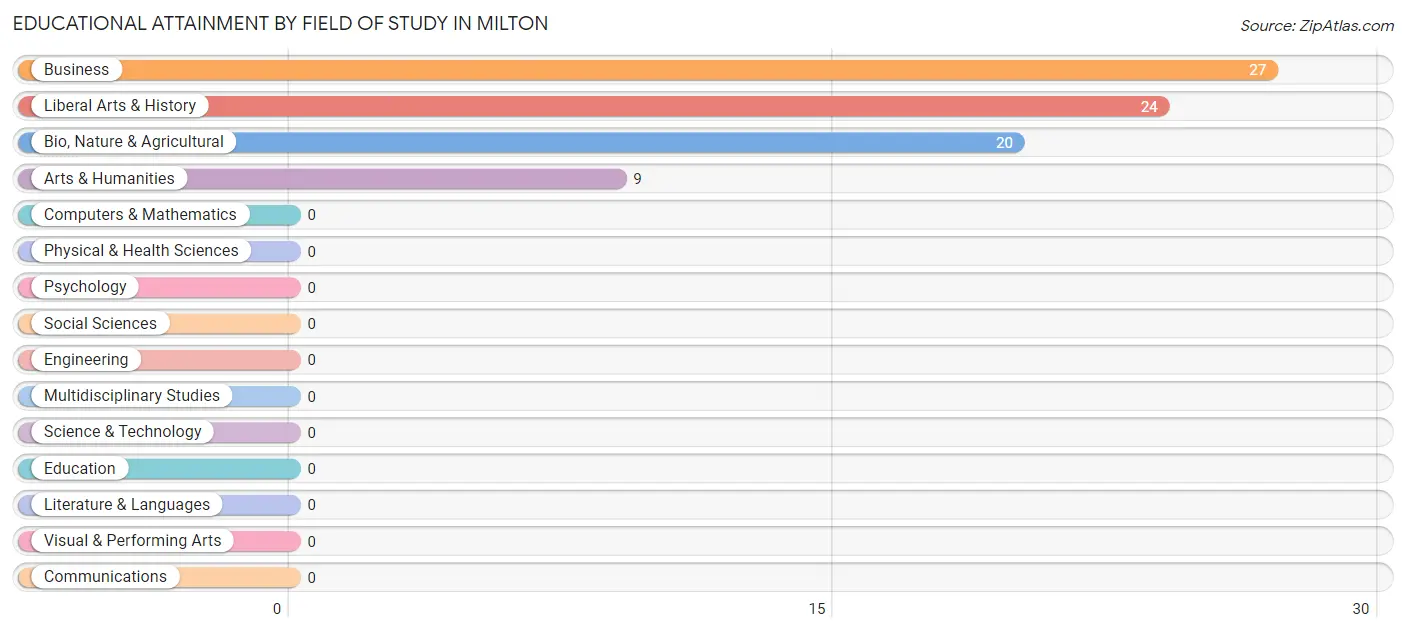
| Field of Study | # Graduates | % Graduates |
| Computers & Mathematics | 0 | 0.0% |
| Bio, Nature & Agricultural | 20 | 25.0% |
| Physical & Health Sciences | 0 | 0.0% |
| Psychology | 0 | 0.0% |
| Social Sciences | 0 | 0.0% |
| Engineering | 0 | 0.0% |
| Multidisciplinary Studies | 0 | 0.0% |
| Science & Technology | 0 | 0.0% |
| Business | 27 | 33.8% |
| Education | 0 | 0.0% |
| Literature & Languages | 0 | 0.0% |
| Liberal Arts & History | 24 | 30.0% |
| Visual & Performing Arts | 0 | 0.0% |
| Communications | 0 | 0.0% |
| Arts & Humanities | 9 | 11.3% |
| Total | 80 | 100.0% |
Transportation & Commute in Milton
Vehicle Availability by Sex in Milton
The most prevalent vehicle ownership categories in Milton are males with 2 vehicles (62, accounting for 53.9%) and females with 2 vehicles (35, making up 68.9%).
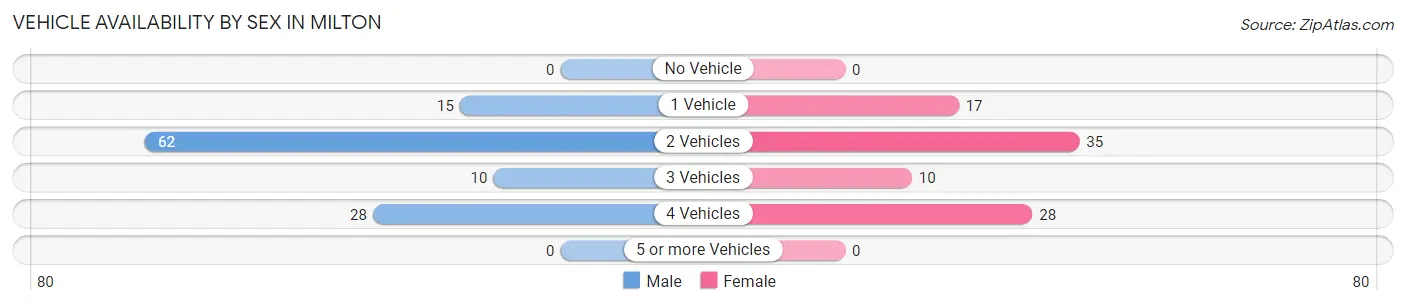
| Vehicles Available | Male | Female |
| No Vehicle | 0 (0.0%) | 0 (0.0%) |
| 1 Vehicle | 15 (13.0%) | 17 (18.9%) |
| 2 Vehicles | 62 (53.9%) | 35 (38.9%) |
| 3 Vehicles | 10 (8.7%) | 10 (11.1%) |
| 4 Vehicles | 28 (24.3%) | 28 (31.1%) |
| 5 or more Vehicles | 0 (0.0%) | 0 (0.0%) |
| Total | 115 (100.0%) | 90 (100.0%) |
Commute Time in Milton
The most frequently occuring commute durations in Milton are 15 to 19 minutes (54 commuters, 28.0%), 30 to 34 minutes (54 commuters, 28.0%), and 5 to 9 minutes (28 commuters, 14.5%).
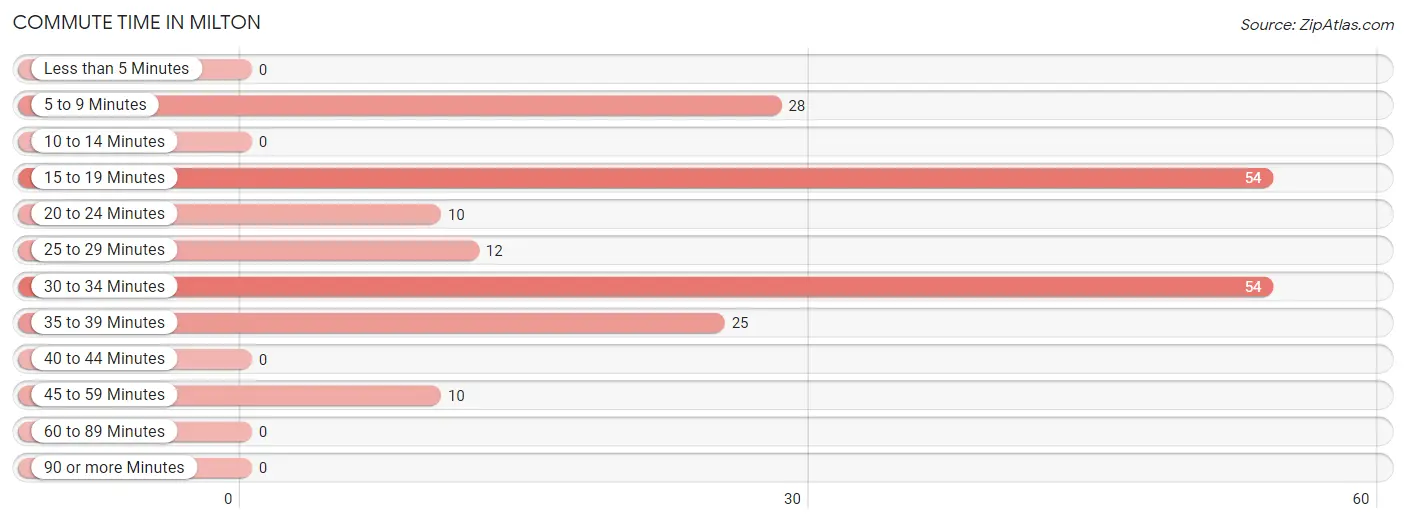
| Commute Time | # Commuters | % Commuters |
| Less than 5 Minutes | 0 | 0.0% |
| 5 to 9 Minutes | 28 | 14.5% |
| 10 to 14 Minutes | 0 | 0.0% |
| 15 to 19 Minutes | 54 | 28.0% |
| 20 to 24 Minutes | 10 | 5.2% |
| 25 to 29 Minutes | 12 | 6.2% |
| 30 to 34 Minutes | 54 | 28.0% |
| 35 to 39 Minutes | 25 | 13.0% |
| 40 to 44 Minutes | 0 | 0.0% |
| 45 to 59 Minutes | 10 | 5.2% |
| 60 to 89 Minutes | 0 | 0.0% |
| 90 or more Minutes | 0 | 0.0% |
Commute Time by Sex in Milton
The most common commute times in Milton are 30 to 34 minutes (45 commuters, 39.1%) for males and 15 to 19 minutes (31 commuters, 39.7%) for females.
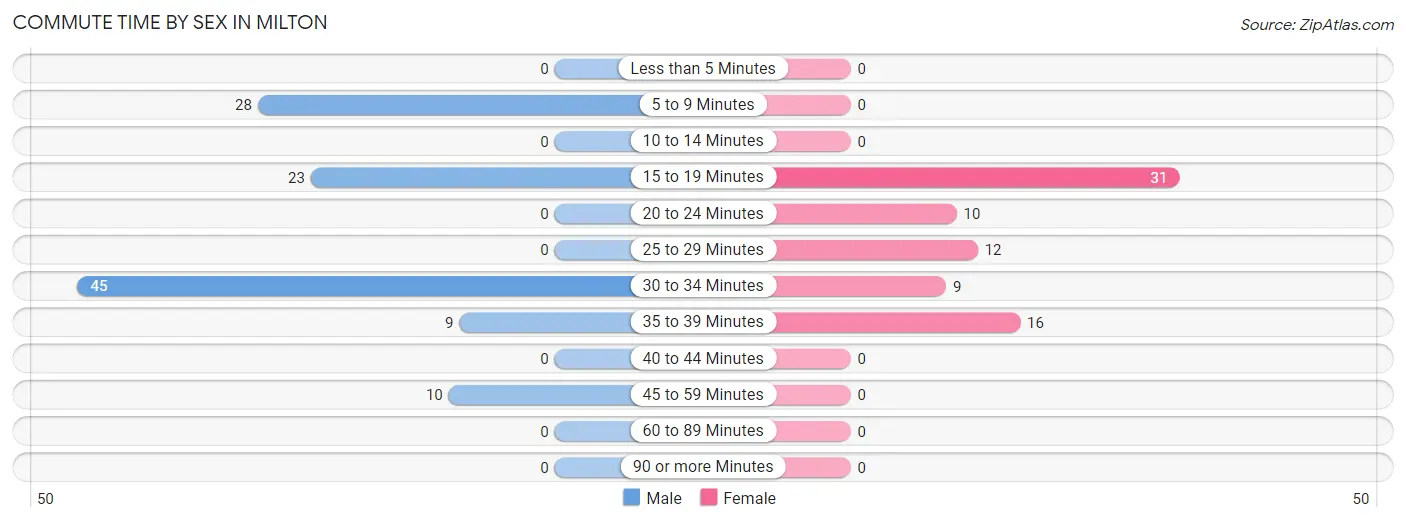
| Commute Time | Male | Female |
| Less than 5 Minutes | 0 (0.0%) | 0 (0.0%) |
| 5 to 9 Minutes | 28 (24.3%) | 0 (0.0%) |
| 10 to 14 Minutes | 0 (0.0%) | 0 (0.0%) |
| 15 to 19 Minutes | 23 (20.0%) | 31 (39.7%) |
| 20 to 24 Minutes | 0 (0.0%) | 10 (12.8%) |
| 25 to 29 Minutes | 0 (0.0%) | 12 (15.4%) |
| 30 to 34 Minutes | 45 (39.1%) | 9 (11.5%) |
| 35 to 39 Minutes | 9 (7.8%) | 16 (20.5%) |
| 40 to 44 Minutes | 0 (0.0%) | 0 (0.0%) |
| 45 to 59 Minutes | 10 (8.7%) | 0 (0.0%) |
| 60 to 89 Minutes | 0 (0.0%) | 0 (0.0%) |
| 90 or more Minutes | 0 (0.0%) | 0 (0.0%) |
Time of Departure to Work by Sex in Milton
The most frequent times of departure to work in Milton are 12:00 AM to 4:59 AM (40, 34.8%) for males and 9:00 AM to 9:59 AM (23, 29.5%) for females.
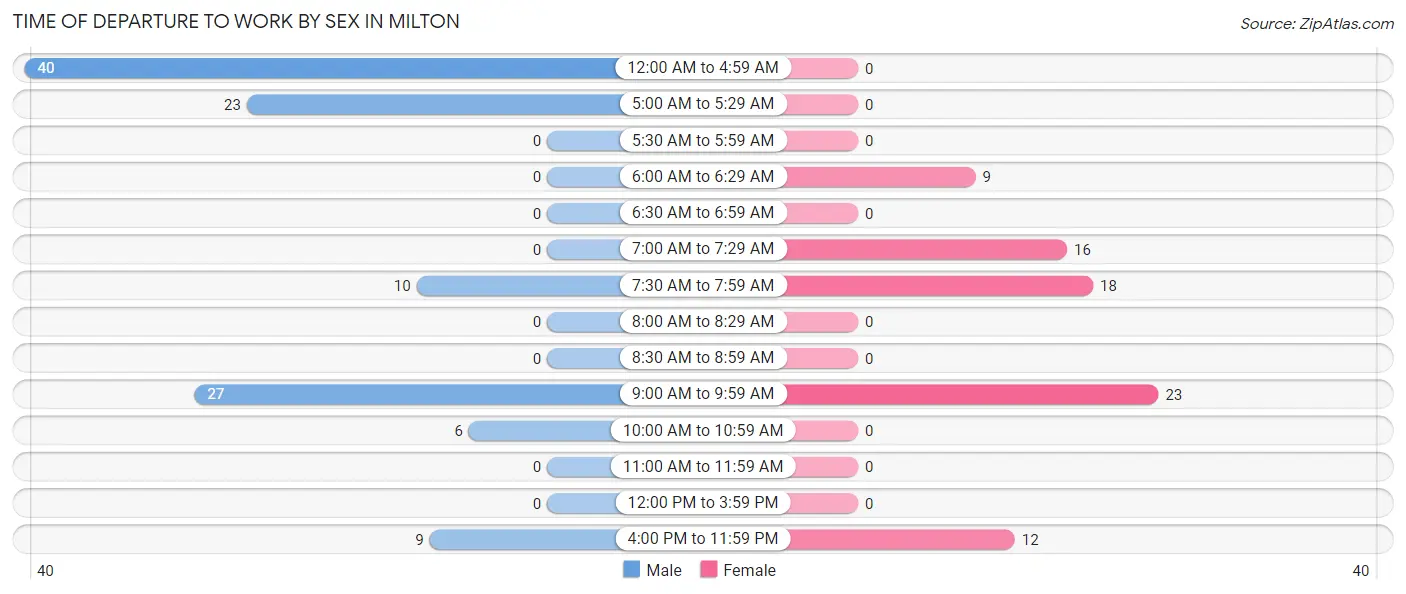
| Time of Departure | Male | Female |
| 12:00 AM to 4:59 AM | 40 (34.8%) | 0 (0.0%) |
| 5:00 AM to 5:29 AM | 23 (20.0%) | 0 (0.0%) |
| 5:30 AM to 5:59 AM | 0 (0.0%) | 0 (0.0%) |
| 6:00 AM to 6:29 AM | 0 (0.0%) | 9 (11.5%) |
| 6:30 AM to 6:59 AM | 0 (0.0%) | 0 (0.0%) |
| 7:00 AM to 7:29 AM | 0 (0.0%) | 16 (20.5%) |
| 7:30 AM to 7:59 AM | 10 (8.7%) | 18 (23.1%) |
| 8:00 AM to 8:29 AM | 0 (0.0%) | 0 (0.0%) |
| 8:30 AM to 8:59 AM | 0 (0.0%) | 0 (0.0%) |
| 9:00 AM to 9:59 AM | 27 (23.5%) | 23 (29.5%) |
| 10:00 AM to 10:59 AM | 6 (5.2%) | 0 (0.0%) |
| 11:00 AM to 11:59 AM | 0 (0.0%) | 0 (0.0%) |
| 12:00 PM to 3:59 PM | 0 (0.0%) | 0 (0.0%) |
| 4:00 PM to 11:59 PM | 9 (7.8%) | 12 (15.4%) |
| Total | 115 (100.0%) | 78 (100.0%) |
Housing Occupancy in Milton
Occupancy by Ownership in Milton
Of the total 203 dwellings in Milton, owner-occupied units account for 151 (74.4%), while renter-occupied units make up 52 (25.6%).
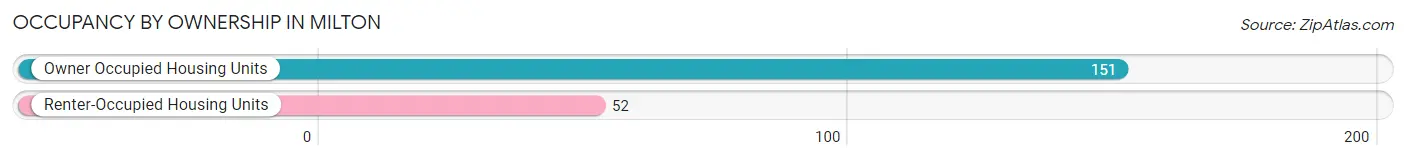
| Occupancy | # Housing Units | % Housing Units |
| Owner Occupied Housing Units | 151 | 74.4% |
| Renter-Occupied Housing Units | 52 | 25.6% |
| Total Occupied Housing Units | 203 | 100.0% |
Occupancy by Household Size in Milton
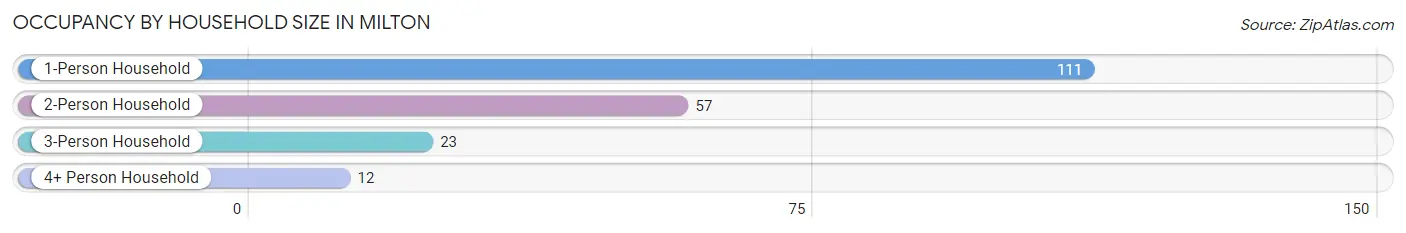
| Household Size | # Housing Units | % Housing Units |
| 1-Person Household | 111 | 54.7% |
| 2-Person Household | 57 | 28.1% |
| 3-Person Household | 23 | 11.3% |
| 4+ Person Household | 12 | 5.9% |
| Total Housing Units | 203 | 100.0% |
Occupancy by Ownership by Household Size in Milton
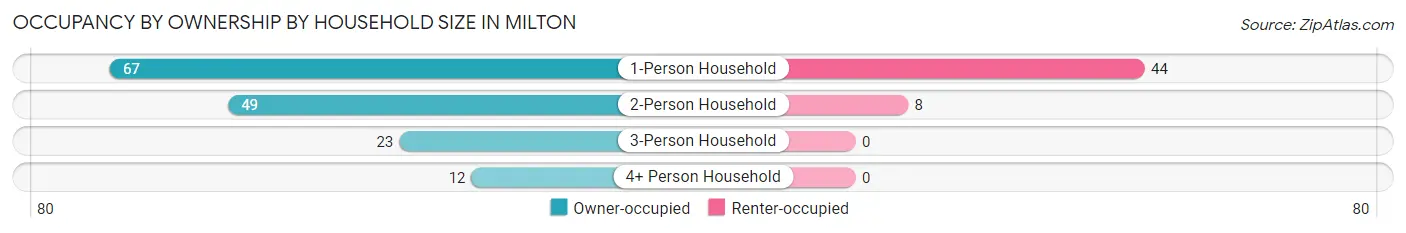
| Household Size | Owner-occupied | Renter-occupied |
| 1-Person Household | 67 (60.4%) | 44 (39.6%) |
| 2-Person Household | 49 (86.0%) | 8 (14.0%) |
| 3-Person Household | 23 (100.0%) | 0 (0.0%) |
| 4+ Person Household | 12 (100.0%) | 0 (0.0%) |
| Total Housing Units | 151 (74.4%) | 52 (25.6%) |
Occupancy by Educational Attainment in Milton
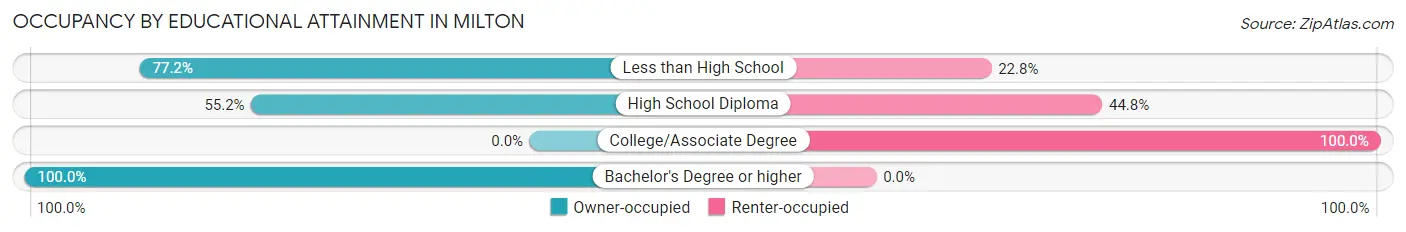
| Household Size | Owner-occupied | Renter-occupied |
| Less than High School | 44 (77.2%) | 13 (22.8%) |
| High School Diploma | 37 (55.2%) | 30 (44.8%) |
| College/Associate Degree | 0 (0.0%) | 9 (100.0%) |
| Bachelor's Degree or higher | 70 (100.0%) | 0 (0.0%) |
Occupancy by Age of Householder in Milton
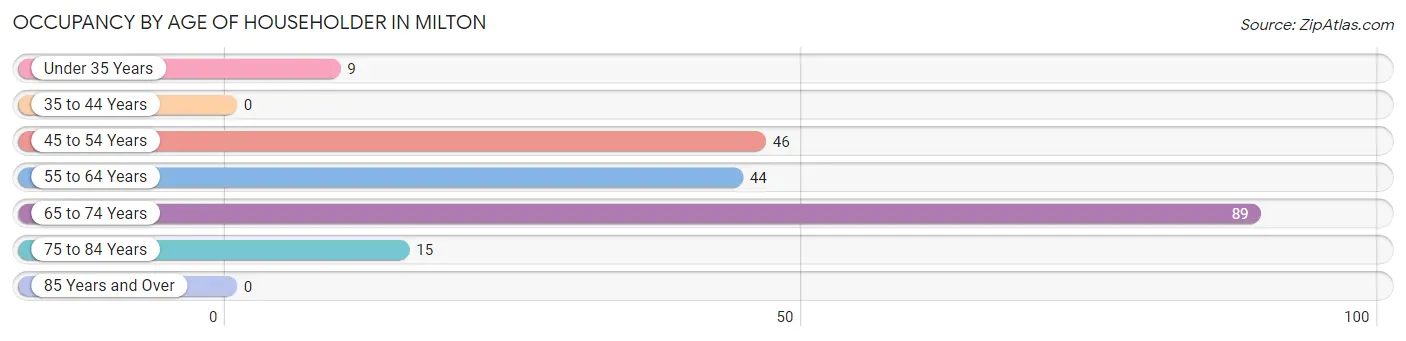
| Age Bracket | # Households | % Households |
| Under 35 Years | 9 | 4.4% |
| 35 to 44 Years | 0 | 0.0% |
| 45 to 54 Years | 46 | 22.7% |
| 55 to 64 Years | 44 | 21.7% |
| 65 to 74 Years | 89 | 43.8% |
| 75 to 84 Years | 15 | 7.4% |
| 85 Years and Over | 0 | 0.0% |
| Total | 203 | 100.0% |
Housing Finances in Milton
Median Income by Occupancy in Milton
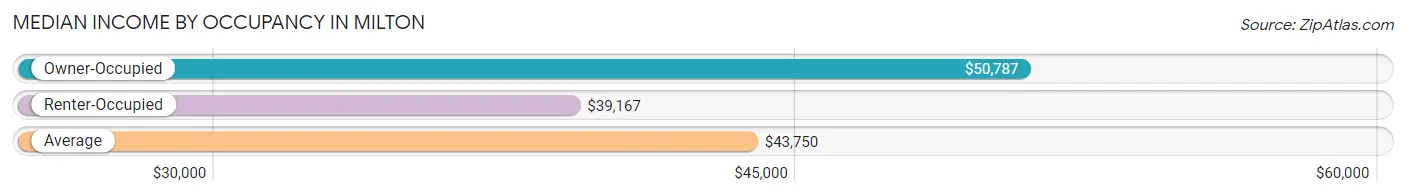
| Occupancy Type | # Households | Median Income |
| Owner-Occupied | 151 (74.4%) | $50,787 |
| Renter-Occupied | 52 (25.6%) | $39,167 |
| Average | 203 (100.0%) | $43,750 |
Occupancy by Householder Income Bracket in Milton
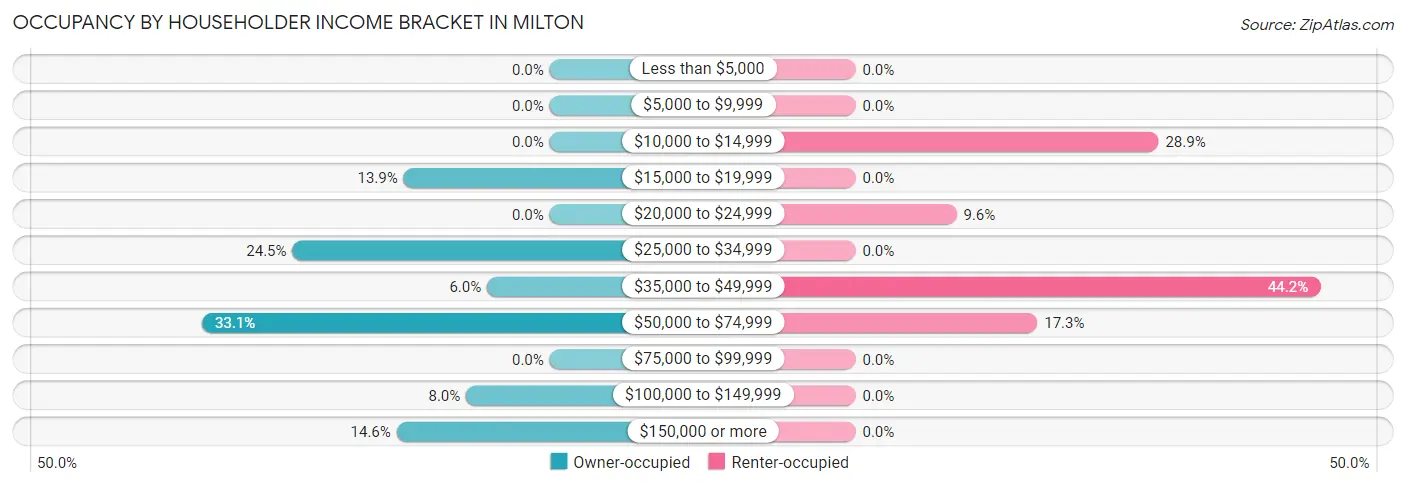
| Income Bracket | Owner-occupied | Renter-occupied |
| Less than $5,000 | 0 (0.0%) | 0 (0.0%) |
| $5,000 to $9,999 | 0 (0.0%) | 0 (0.0%) |
| $10,000 to $14,999 | 0 (0.0%) | 15 (28.8%) |
| $15,000 to $19,999 | 21 (13.9%) | 0 (0.0%) |
| $20,000 to $24,999 | 0 (0.0%) | 5 (9.6%) |
| $25,000 to $34,999 | 37 (24.5%) | 0 (0.0%) |
| $35,000 to $49,999 | 9 (6.0%) | 23 (44.2%) |
| $50,000 to $74,999 | 50 (33.1%) | 9 (17.3%) |
| $75,000 to $99,999 | 0 (0.0%) | 0 (0.0%) |
| $100,000 to $149,999 | 12 (8.0%) | 0 (0.0%) |
| $150,000 or more | 22 (14.6%) | 0 (0.0%) |
| Total | 151 (100.0%) | 52 (100.0%) |
Monthly Housing Cost Tiers in Milton
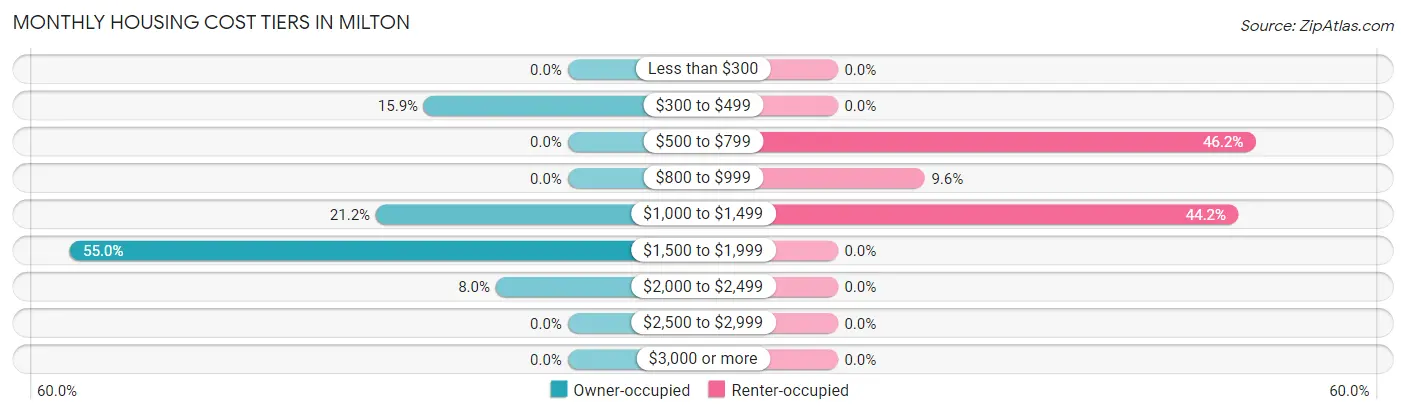
| Monthly Cost | Owner-occupied | Renter-occupied |
| Less than $300 | 0 (0.0%) | 0 (0.0%) |
| $300 to $499 | 24 (15.9%) | 0 (0.0%) |
| $500 to $799 | 0 (0.0%) | 24 (46.2%) |
| $800 to $999 | 0 (0.0%) | 5 (9.6%) |
| $1,000 to $1,499 | 32 (21.2%) | 23 (44.2%) |
| $1,500 to $1,999 | 83 (55.0%) | 0 (0.0%) |
| $2,000 to $2,499 | 12 (8.0%) | 0 (0.0%) |
| $2,500 to $2,999 | 0 (0.0%) | 0 (0.0%) |
| $3,000 or more | 0 (0.0%) | 0 (0.0%) |
| Total | 151 (100.0%) | 52 (100.0%) |
Physical Housing Characteristics in Milton
Housing Structures in Milton
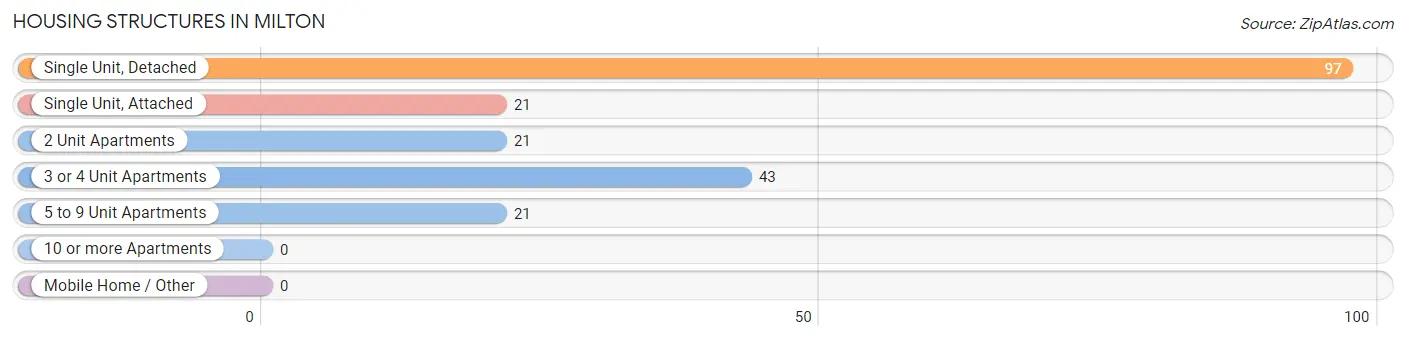
| Structure Type | # Housing Units | % Housing Units |
| Single Unit, Detached | 97 | 47.8% |
| Single Unit, Attached | 21 | 10.3% |
| 2 Unit Apartments | 21 | 10.3% |
| 3 or 4 Unit Apartments | 43 | 21.2% |
| 5 to 9 Unit Apartments | 21 | 10.3% |
| 10 or more Apartments | 0 | 0.0% |
| Mobile Home / Other | 0 | 0.0% |
| Total | 203 | 100.0% |
Housing Structures by Occupancy in Milton
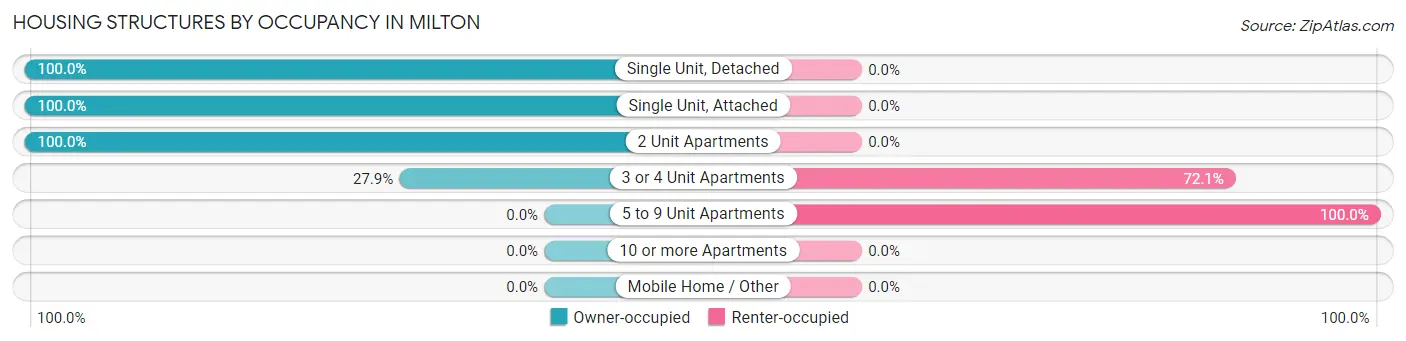
| Structure Type | Owner-occupied | Renter-occupied |
| Single Unit, Detached | 97 (100.0%) | 0 (0.0%) |
| Single Unit, Attached | 21 (100.0%) | 0 (0.0%) |
| 2 Unit Apartments | 21 (100.0%) | 0 (0.0%) |
| 3 or 4 Unit Apartments | 12 (27.9%) | 31 (72.1%) |
| 5 to 9 Unit Apartments | 0 (0.0%) | 21 (100.0%) |
| 10 or more Apartments | 0 (0.0%) | 0 (0.0%) |
| Mobile Home / Other | 0 (0.0%) | 0 (0.0%) |
| Total | 151 (74.4%) | 52 (25.6%) |
Housing Structures by Number of Rooms in Milton
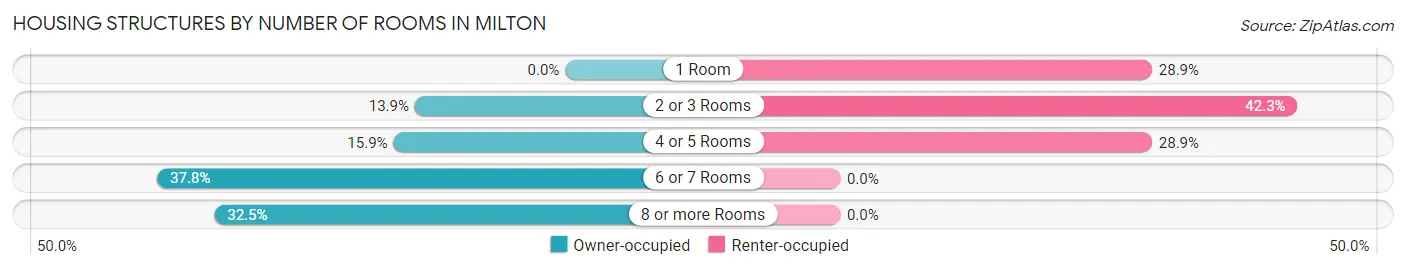
| Number of Rooms | Owner-occupied | Renter-occupied |
| 1 Room | 0 (0.0%) | 15 (28.8%) |
| 2 or 3 Rooms | 21 (13.9%) | 22 (42.3%) |
| 4 or 5 Rooms | 24 (15.9%) | 15 (28.8%) |
| 6 or 7 Rooms | 57 (37.8%) | 0 (0.0%) |
| 8 or more Rooms | 49 (32.5%) | 0 (0.0%) |
| Total | 151 (100.0%) | 52 (100.0%) |
Housing Structure by Heating Type in Milton
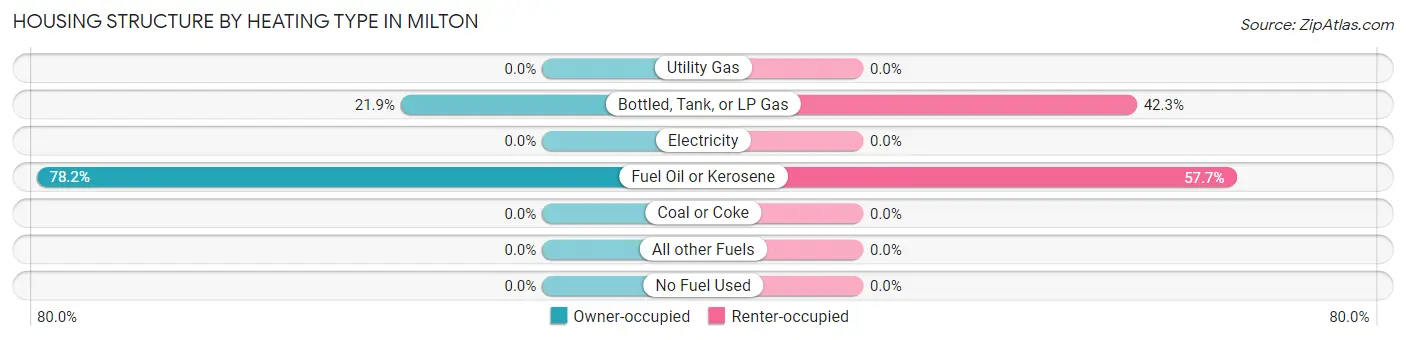
| Heating Type | Owner-occupied | Renter-occupied |
| Utility Gas | 0 (0.0%) | 0 (0.0%) |
| Bottled, Tank, or LP Gas | 33 (21.8%) | 22 (42.3%) |
| Electricity | 0 (0.0%) | 0 (0.0%) |
| Fuel Oil or Kerosene | 118 (78.1%) | 30 (57.7%) |
| Coal or Coke | 0 (0.0%) | 0 (0.0%) |
| All other Fuels | 0 (0.0%) | 0 (0.0%) |
| No Fuel Used | 0 (0.0%) | 0 (0.0%) |
| Total | 151 (100.0%) | 52 (100.0%) |
Household Vehicle Usage in Milton
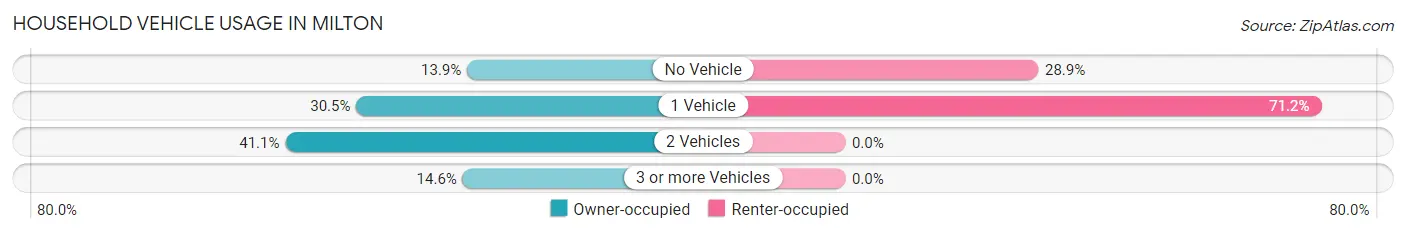
| Vehicles per Household | Owner-occupied | Renter-occupied |
| No Vehicle | 21 (13.9%) | 15 (28.8%) |
| 1 Vehicle | 46 (30.5%) | 37 (71.2%) |
| 2 Vehicles | 62 (41.1%) | 0 (0.0%) |
| 3 or more Vehicles | 22 (14.6%) | 0 (0.0%) |
| Total | 151 (100.0%) | 52 (100.0%) |
Real Estate & Mortgages in Milton
Real Estate and Mortgage Overview in Milton
| Characteristic | Without Mortgage | With Mortgage |
| Housing Units | 61 | 90 |
| Median Property Value | - | - |
| Median Household Income | - | - |
| Monthly Housing Costs | - | - |
| Real Estate Taxes | - | - |
Property Value by Mortgage Status in Milton
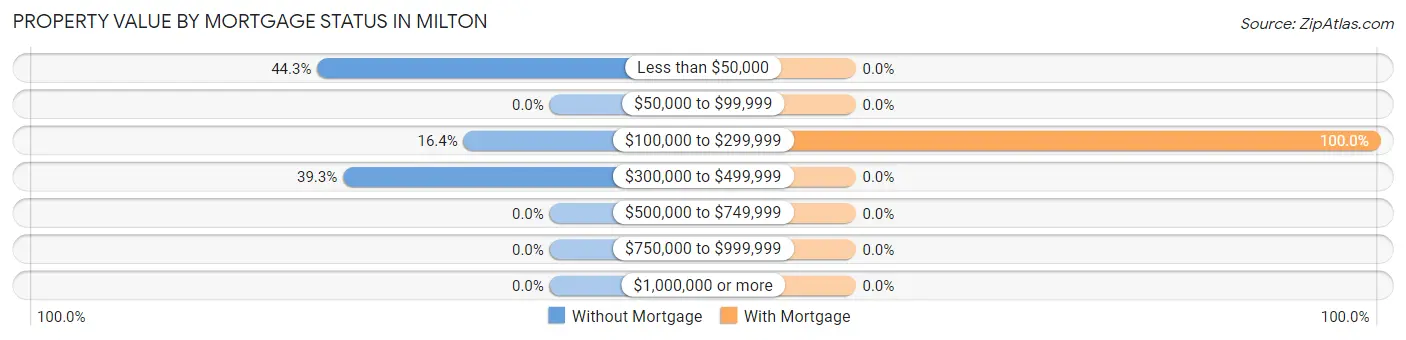
| Property Value | Without Mortgage | With Mortgage |
| Less than $50,000 | 27 (44.3%) | 0 (0.0%) |
| $50,000 to $99,999 | 0 (0.0%) | 0 (0.0%) |
| $100,000 to $299,999 | 10 (16.4%) | 90 (100.0%) |
| $300,000 to $499,999 | 24 (39.3%) | 0 (0.0%) |
| $500,000 to $749,999 | 0 (0.0%) | 0 (0.0%) |
| $750,000 to $999,999 | 0 (0.0%) | 0 (0.0%) |
| $1,000,000 or more | 0 (0.0%) | 0 (0.0%) |
| Total | 61 (100.0%) | 90 (100.0%) |
Household Income by Mortgage Status in Milton
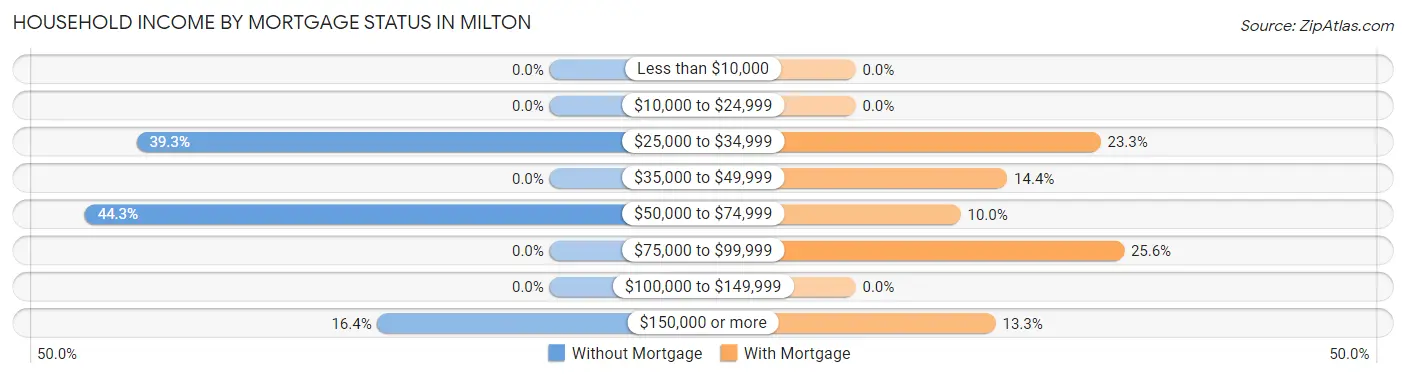
| Household Income | Without Mortgage | With Mortgage |
| Less than $10,000 | 0 (0.0%) | 0 (0.0%) |
| $10,000 to $24,999 | 0 (0.0%) | 0 (0.0%) |
| $25,000 to $34,999 | 24 (39.3%) | 21 (23.3%) |
| $35,000 to $49,999 | 0 (0.0%) | 13 (14.4%) |
| $50,000 to $74,999 | 27 (44.3%) | 9 (10.0%) |
| $75,000 to $99,999 | 0 (0.0%) | 23 (25.6%) |
| $100,000 to $149,999 | 0 (0.0%) | 0 (0.0%) |
| $150,000 or more | 10 (16.4%) | 12 (13.3%) |
| Total | 61 (100.0%) | 90 (100.0%) |
Property Value to Household Income Ratio in Milton
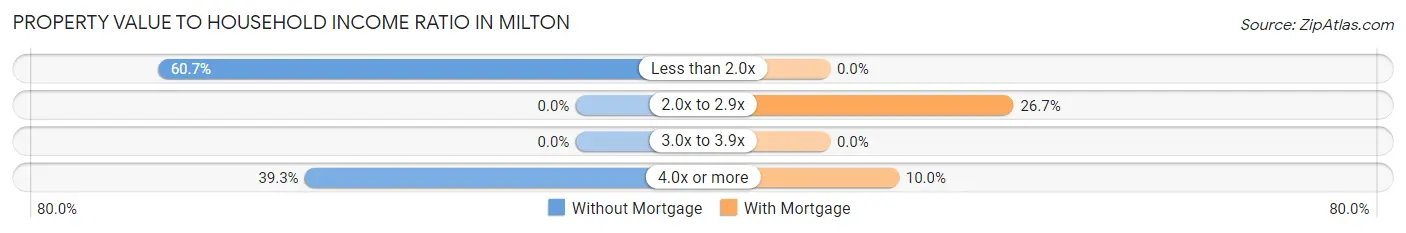
| Value-to-Income Ratio | Without Mortgage | With Mortgage |
| Less than 2.0x | 37 (60.7%) | 0 (0.0%) |
| 2.0x to 2.9x | 0 (0.0%) | 24 (26.7%) |
| 3.0x to 3.9x | 0 (0.0%) | 0 (0.0%) |
| 4.0x or more | 24 (39.3%) | 9 (10.0%) |
| Total | 61 (100.0%) | 90 (100.0%) |
Real Estate Taxes by Mortgage Status in Milton
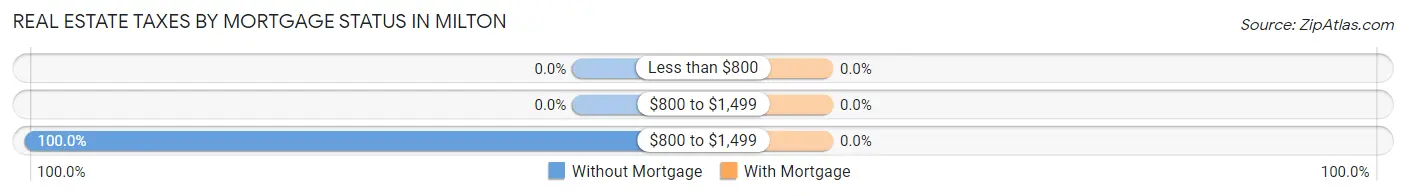
| Property Taxes | Without Mortgage | With Mortgage |
| Less than $800 | 0 (0.0%) | 0 (0.0%) |
| $800 to $1,499 | 0 (0.0%) | 0 (0.0%) |
| $800 to $1,499 | 61 (100.0%) | 0 (0.0%) |
| Total | 61 (100.0%) | 90 (100.0%) |
Health & Disability in Milton
Health Insurance Coverage by Age in Milton
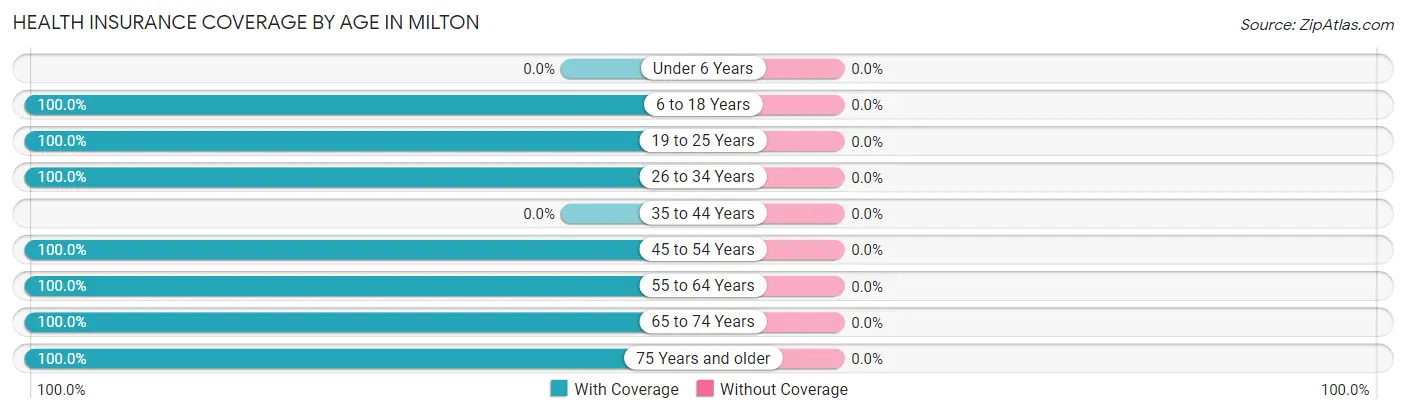
| Age Bracket | With Coverage | Without Coverage |
| Under 6 Years | 0 (0.0%) | 0 (0.0%) |
| 6 to 18 Years | 22 (100.0%) | 0 (0.0%) |
| 19 to 25 Years | 32 (100.0%) | 0 (0.0%) |
| 26 to 34 Years | 9 (100.0%) | 0 (0.0%) |
| 35 to 44 Years | 0 (0.0%) | 0 (0.0%) |
| 45 to 54 Years | 81 (100.0%) | 0 (0.0%) |
| 55 to 64 Years | 66 (100.0%) | 0 (0.0%) |
| 65 to 74 Years | 114 (100.0%) | 0 (0.0%) |
| 75 Years and older | 25 (100.0%) | 0 (0.0%) |
| Total | 349 (100.0%) | 0 (0.0%) |
Health Insurance Coverage by Citizenship Status in Milton
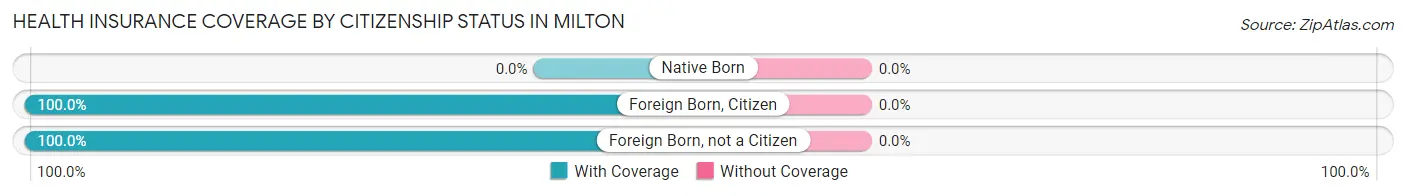
| Citizenship Status | With Coverage | Without Coverage |
| Native Born | 0 (0.0%) | 0 (0.0%) |
| Foreign Born, Citizen | 22 (100.0%) | 0 (0.0%) |
| Foreign Born, not a Citizen | 32 (100.0%) | 0 (0.0%) |
Health Insurance Coverage by Household Income in Milton
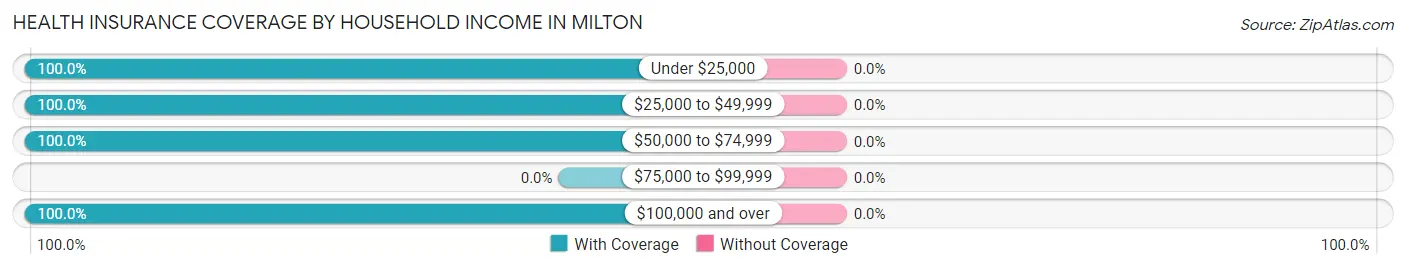
| Household Income | With Coverage | Without Coverage |
| Under $25,000 | 41 (100.0%) | 0 (0.0%) |
| $25,000 to $49,999 | 79 (100.0%) | 0 (0.0%) |
| $50,000 to $74,999 | 129 (100.0%) | 0 (0.0%) |
| $75,000 to $99,999 | 0 (0.0%) | 0 (0.0%) |
| $100,000 and over | 100 (100.0%) | 0 (0.0%) |
Public vs Private Health Insurance Coverage by Age in Milton
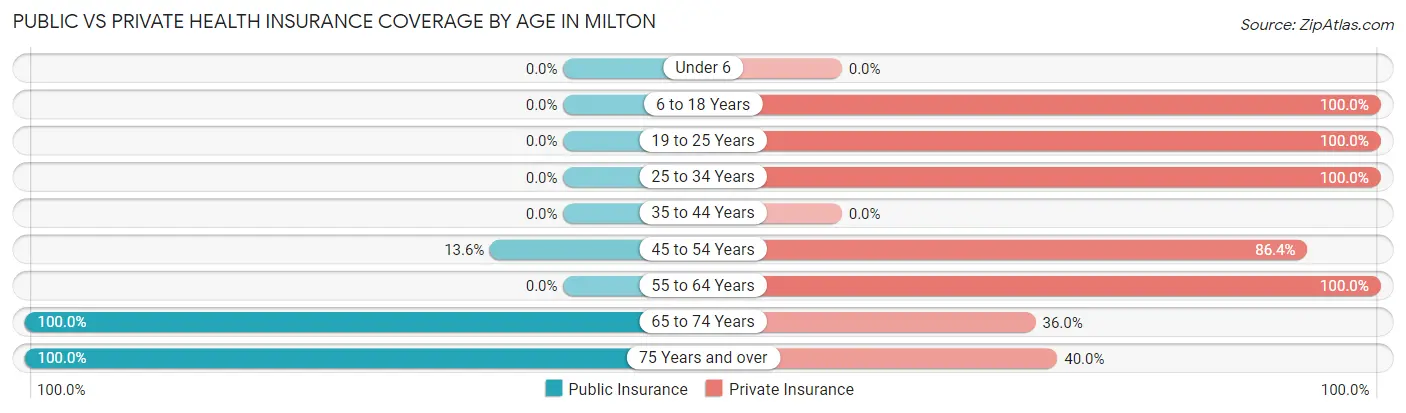
| Age Bracket | Public Insurance | Private Insurance |
| Under 6 | 0 (0.0%) | 0 (0.0%) |
| 6 to 18 Years | 0 (0.0%) | 22 (100.0%) |
| 19 to 25 Years | 0 (0.0%) | 32 (100.0%) |
| 25 to 34 Years | 0 (0.0%) | 9 (100.0%) |
| 35 to 44 Years | 0 (0.0%) | 0 (0.0%) |
| 45 to 54 Years | 11 (13.6%) | 70 (86.4%) |
| 55 to 64 Years | 0 (0.0%) | 66 (100.0%) |
| 65 to 74 Years | 114 (100.0%) | 41 (36.0%) |
| 75 Years and over | 25 (100.0%) | 10 (40.0%) |
| Total | 150 (43.0%) | 250 (71.6%) |
Disability Status by Sex by Age in Milton
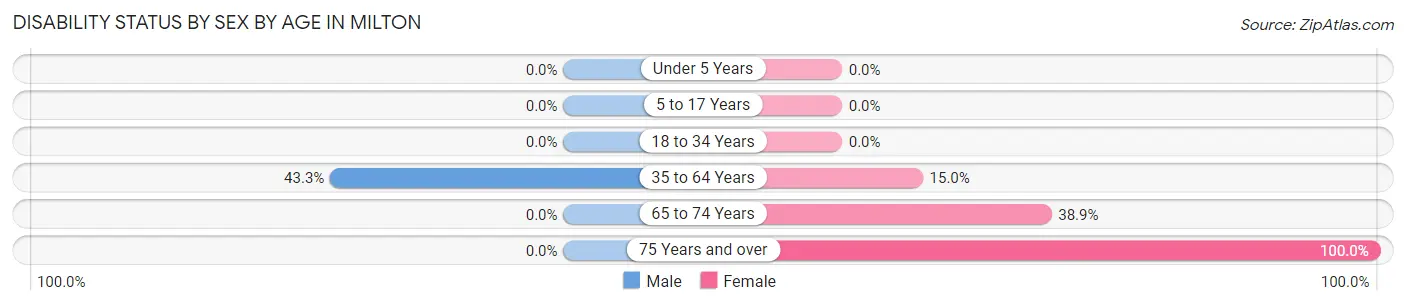
| Age Bracket | Male | Female |
| Under 5 Years | 0 (0.0%) | 0 (0.0%) |
| 5 to 17 Years | 0 (0.0%) | 0 (0.0%) |
| 18 to 34 Years | 0 (0.0%) | 0 (0.0%) |
| 35 to 64 Years | 29 (43.3%) | 12 (15.0%) |
| 65 to 74 Years | 0 (0.0%) | 21 (38.9%) |
| 75 Years and over | 0 (0.0%) | 15 (100.0%) |
Disability Class by Sex by Age in Milton
Disability Class: Hearing Difficulty
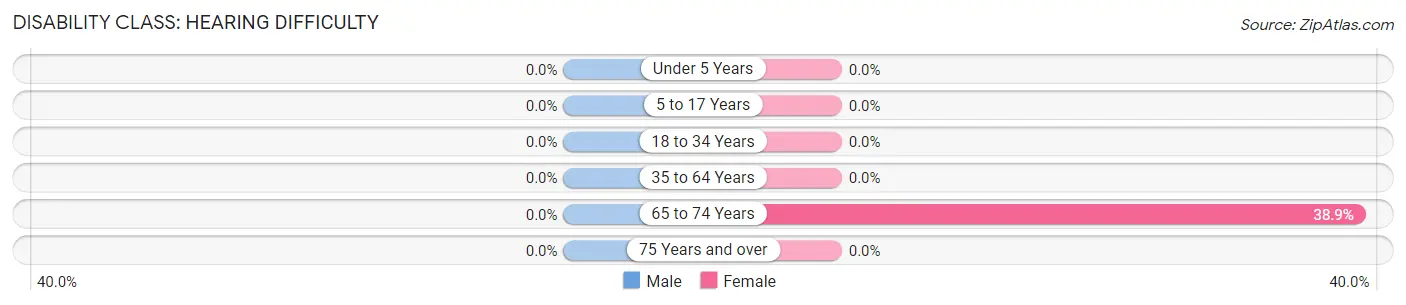
| Age Bracket | Male | Female |
| Under 5 Years | 0 (0.0%) | 0 (0.0%) |
| 5 to 17 Years | 0 (0.0%) | 0 (0.0%) |
| 18 to 34 Years | 0 (0.0%) | 0 (0.0%) |
| 35 to 64 Years | 0 (0.0%) | 0 (0.0%) |
| 65 to 74 Years | 0 (0.0%) | 21 (38.9%) |
| 75 Years and over | 0 (0.0%) | 0 (0.0%) |
Disability Class: Vision Difficulty
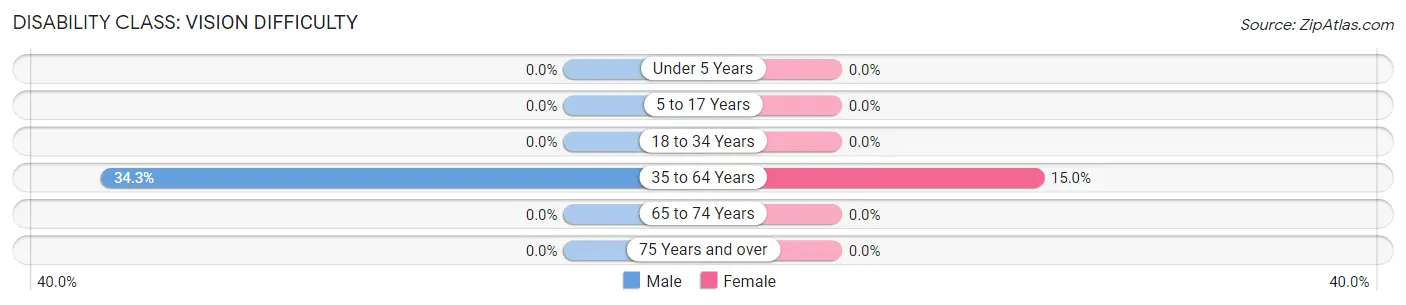
| Age Bracket | Male | Female |
| Under 5 Years | 0 (0.0%) | 0 (0.0%) |
| 5 to 17 Years | 0 (0.0%) | 0 (0.0%) |
| 18 to 34 Years | 0 (0.0%) | 0 (0.0%) |
| 35 to 64 Years | 23 (34.3%) | 12 (15.0%) |
| 65 to 74 Years | 0 (0.0%) | 0 (0.0%) |
| 75 Years and over | 0 (0.0%) | 0 (0.0%) |
Disability Class: Cognitive Difficulty
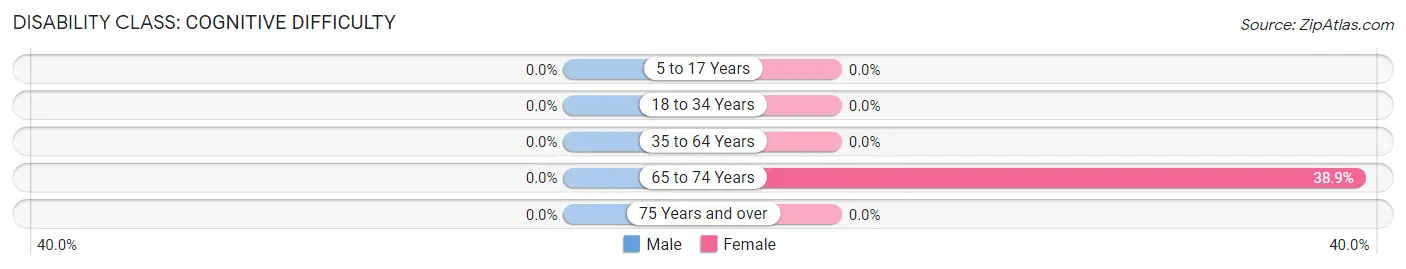
| Age Bracket | Male | Female |
| 5 to 17 Years | 0 (0.0%) | 0 (0.0%) |
| 18 to 34 Years | 0 (0.0%) | 0 (0.0%) |
| 35 to 64 Years | 0 (0.0%) | 0 (0.0%) |
| 65 to 74 Years | 0 (0.0%) | 21 (38.9%) |
| 75 Years and over | 0 (0.0%) | 0 (0.0%) |
Disability Class: Ambulatory Difficulty
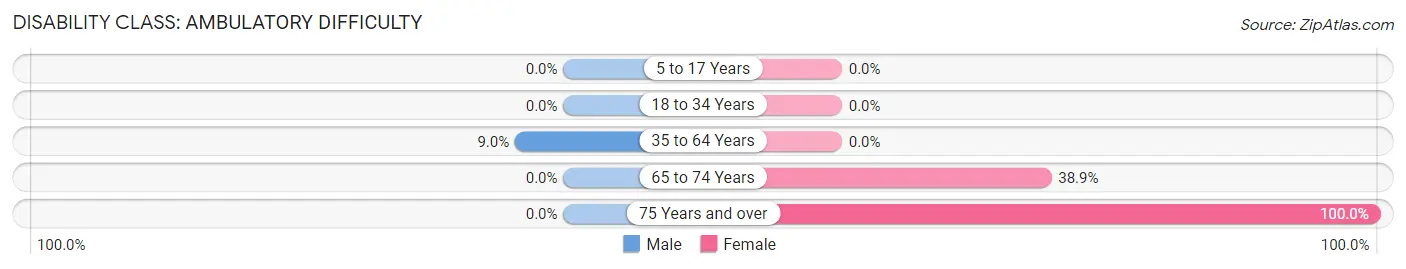
| Age Bracket | Male | Female |
| 5 to 17 Years | 0 (0.0%) | 0 (0.0%) |
| 18 to 34 Years | 0 (0.0%) | 0 (0.0%) |
| 35 to 64 Years | 6 (9.0%) | 0 (0.0%) |
| 65 to 74 Years | 0 (0.0%) | 21 (38.9%) |
| 75 Years and over | 0 (0.0%) | 15 (100.0%) |
Disability Class: Self-Care Difficulty
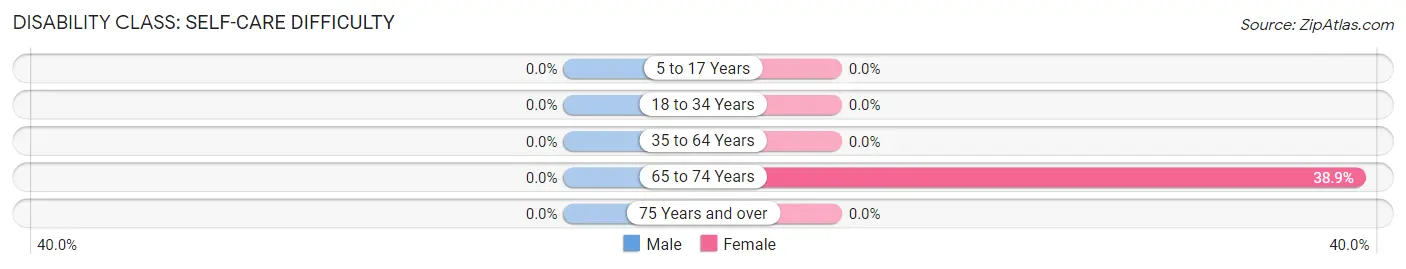
| Age Bracket | Male | Female |
| 5 to 17 Years | 0 (0.0%) | 0 (0.0%) |
| 18 to 34 Years | 0 (0.0%) | 0 (0.0%) |
| 35 to 64 Years | 0 (0.0%) | 0 (0.0%) |
| 65 to 74 Years | 0 (0.0%) | 21 (38.9%) |
| 75 Years and over | 0 (0.0%) | 0 (0.0%) |
Technology Access in Milton
Computing Device Access in Milton
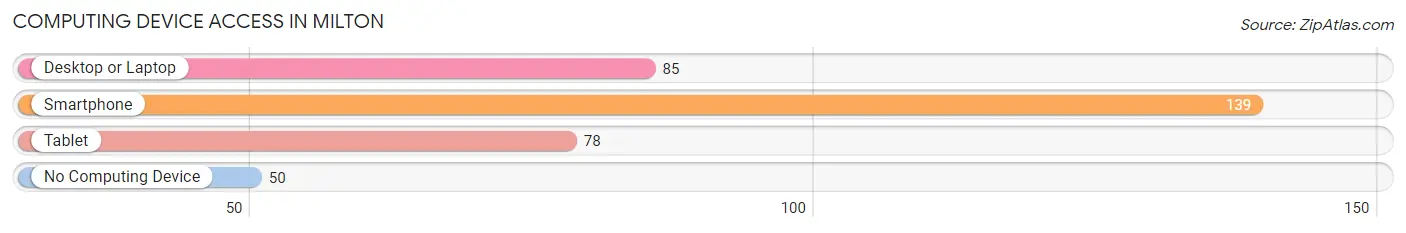
| Device Type | # Households | % Households |
| Desktop or Laptop | 85 | 41.9% |
| Smartphone | 139 | 68.5% |
| Tablet | 78 | 38.4% |
| No Computing Device | 50 | 24.6% |
| Total | 203 | 100.0% |
Internet Access in Milton
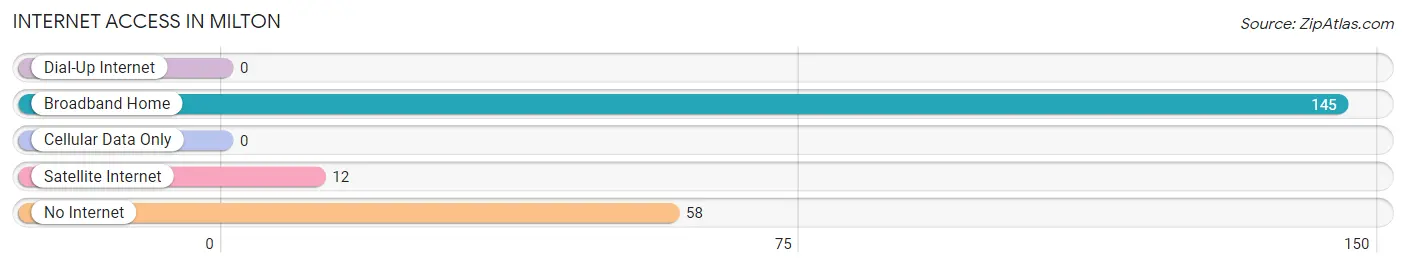
| Internet Type | # Households | % Households |
| Dial-Up Internet | 0 | 0.0% |
| Broadband Home | 145 | 71.4% |
| Cellular Data Only | 0 | 0.0% |
| Satellite Internet | 12 | 5.9% |
| No Internet | 58 | 28.6% |
| Total | 203 | 100.0% |
Milton Summary
Milton is a town located in Strafford County, New Hampshire, United States. The population was 2,128 at the 2010 census. It is situated on the Salmon Falls River, which forms the boundary between New Hampshire and Maine.
Geography
Milton is located in southeastern New Hampshire, in the southeastern corner of Strafford County. It is bordered to the east by Maine, to the south by Rochester, to the west by Wakefield, and to the north by Middleton. According to the United States Census Bureau, the town has a total area of 24.2sqmi, of which 23.9sqmi is land and 0.3sqmi is water.
The highest point in Milton is the summit of Milton Hill, at 590ft above sea level. The town is drained by the Salmon Falls River, which forms the boundary between New Hampshire and Maine.
History
Milton was first settled in 1763 by a group of settlers from Dover, New Hampshire. The town was originally known as "New Durham Parish", and was incorporated in 1794. The town was named after the English poet John Milton.
In the 19th century, Milton was a center of the lumber industry, with several sawmills located along the Salmon Falls River. The town also had a gristmill, a tannery, and a shoe factory.
Economy
Milton's economy is largely based on agriculture and tourism. The town is home to several farms, including the Milton Creamery, which produces artisanal cheeses. The town is also home to several small businesses, including a general store, a bakery, and a restaurant.
Tourism is an important part of the local economy. The town is home to several historic sites, including the Milton Mills Historic District, the Milton Three Ponds Historic District, and the Milton Town Hall. The town is also home to several parks, including the Milton Town Forest and the Milton Town Beach.
Demographics
As of the census of 2010, there were 2,128 people, 845 households, and 590 families residing in the town. The population density was 88.7 people per square mile (34.3/km2). There were 902 housing units at an average density of 37.8 per square mile (14.6/km2). The racial makeup of the town was 97.2% White, 0.3% African American, 0.3% Native American, 0.3% Asian, 0.2% from other races, and 1.7% from two or more races. Hispanic or Latino of any race were 0.9% of the population.
There were 845 households, out of which 32.2% had children under the age of 18 living with them, 54.2% were married couples living together, 9.7% had a female householder with no husband present, and 30.7% were non-families. 24.2% of all households were made up of individuals, and 9.2% had someone living alone who was 65 years of age or older. The average household size was 2.51 and the average family size was 2.97.
In the town, the population was spread out, with 24.7% under the age of 18, 6.2% from 18 to 24, 28.2% from 25 to 44, 28.2% from 45 to 64, and 12.7% who were 65 years of age or older. The median age was 39 years. For every 100 females, there were 97.2 males. For every 100 females age 18 and over, there were 95.2 males.
The median income for a household in the town was $50,000, and the median income for a family was $58,750. Males had a median income of $40,000 versus $30,000 for females. The per capita income for the town was $23,945. About 4.2% of families and 5.7% of the population were below the poverty line, including 6.2% of those under age 18 and 5.2% of those age 65 or over.
Common Questions
What is Per Capita Income in Milton?
Per Capita income in Milton is $37,440.
What is the Median Household income in Milton?
Median Household Income in Milton is $43,750.
What is Inequality or Gini Index in Milton?
Inequality or Gini Index in Milton is 0.46.
What is the Total Population of Milton?
Total Population of Milton is 349.
What is the Total Male Population of Milton?
Total Male Population of Milton is 175.
What is the Total Female Population of Milton?
Total Female Population of Milton is 174.
What is the Ratio of Males per 100 Females in Milton?
There are 100.57 Males per 100 Females in Milton.
What is the Ratio of Females per 100 Males in Milton?
There are 99.43 Females per 100 Males in Milton.
What is the Median Population Age in Milton?
Median Population Age in Milton is 61.7 Years.
What is the Average Family Size in Milton
Average Family Size in Milton is 2.7 People.
What is the Average Household Size in Milton
Average Household Size in Milton is 1.7 People.
How Large is the Labor Force in Milton?
There are 229 People in the Labor Forcein in Milton.
What is the Percentage of People in the Labor Force in Milton?
70.0% of People are in the Labor Force in Milton.