Walpole, NH Map & Demographics
Walpole Map
Walpole Overview
$62,177
PER CAPITA INCOME
$154,188
AVG FAMILY INCOME
0.52
INEQUALITY / GINI INDEX
465
TOTAL POPULATION
248
MALE POPULATION
217
FEMALE POPULATION
114.29
MALES / 100 FEMALES
87.50
FEMALES / 100 MALES
61.2
MEDIAN AGE
2.6
AVG FAMILY SIZE
1.6
AVG HOUSEHOLD SIZE
189
LABOR FORCE [ PEOPLE ]
44.2%
PERCENT IN LABOR FORCE
Walpole Zip Codes
Walpole Area Codes
Income in Walpole
Income Overview in Walpole
| Characteristic | Number | Measure |
| Per Capita Income | 465 | $62,177 |
| Median Family Income | 97 | $154,188 |
| Mean Family Income | 97 | $176,796 |
| Median Household Income | 299 | $0 |
| Mean Household Income | 299 | $99,387 |
| Income Deficit | 97 | $0 |
| Wage / Income Gap (%) | 465 | 0.00% |
| Wage / Income Gap ($) | 465 | 100.00¢ per $1 |
| Gini / Inequality Index | 465 | 0.52 |
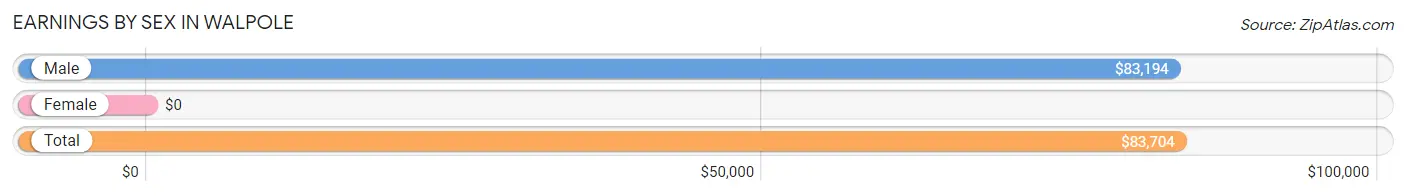
Earnings by Sex in Walpole
| Sex | Number | Average Earnings |
| Male | 139 (66.2%) | $83,194 |
| Female | 71 (33.8%) | $0 |
| Total | 210 (100.0%) | $83,704 |
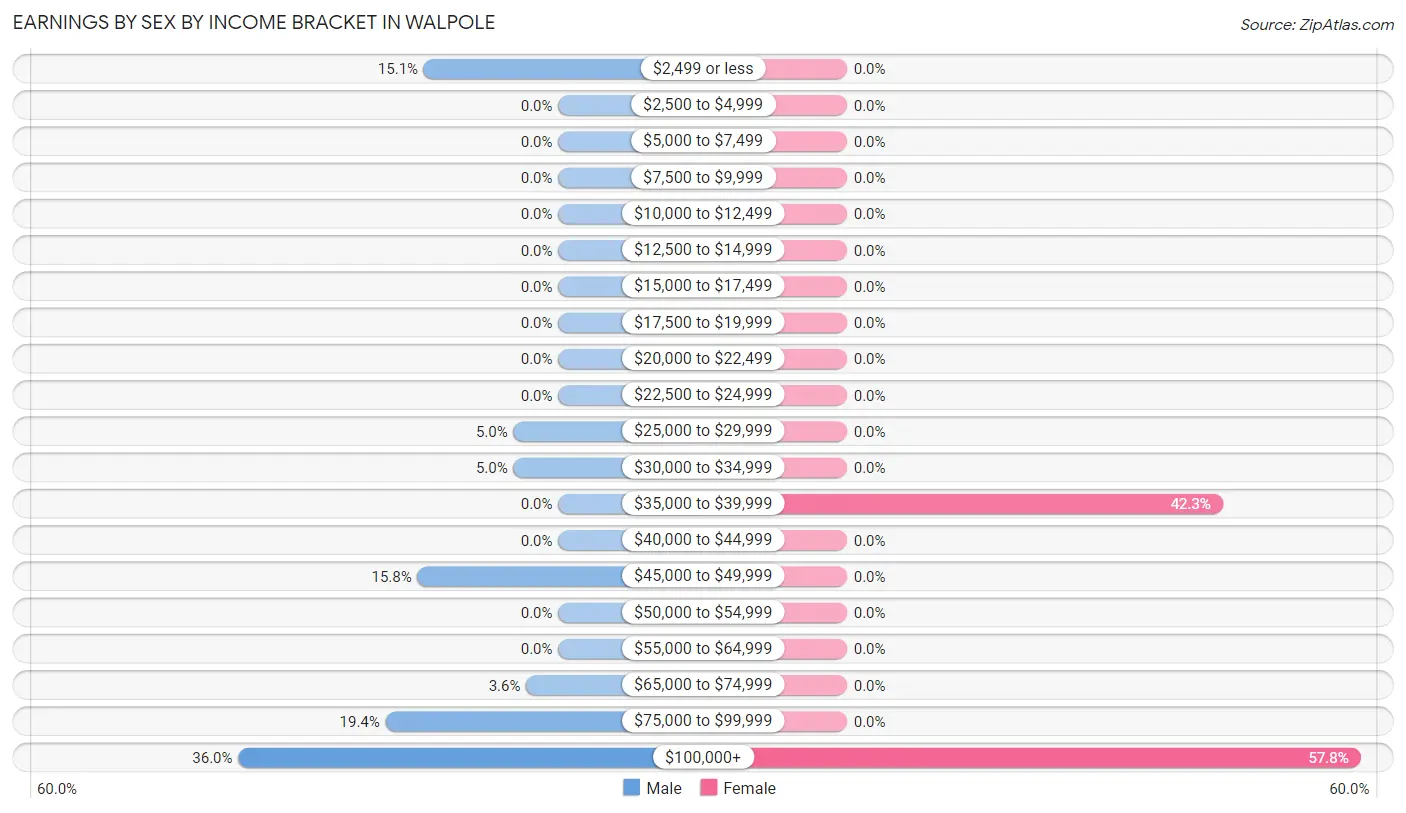
Earnings by Sex by Income Bracket in Walpole
The most common earnings brackets in Walpole are $100,000+ for men (50 | 36.0%) and $100,000+ for women (41 | 57.8%).
| Income | Male | Female |
| $2,499 or less | 21 (15.1%) | 0 (0.0%) |
| $2,500 to $4,999 | 0 (0.0%) | 0 (0.0%) |
| $5,000 to $7,499 | 0 (0.0%) | 0 (0.0%) |
| $7,500 to $9,999 | 0 (0.0%) | 0 (0.0%) |
| $10,000 to $12,499 | 0 (0.0%) | 0 (0.0%) |
| $12,500 to $14,999 | 0 (0.0%) | 0 (0.0%) |
| $15,000 to $17,499 | 0 (0.0%) | 0 (0.0%) |
| $17,500 to $19,999 | 0 (0.0%) | 0 (0.0%) |
| $20,000 to $22,499 | 0 (0.0%) | 0 (0.0%) |
| $22,500 to $24,999 | 0 (0.0%) | 0 (0.0%) |
| $25,000 to $29,999 | 7 (5.0%) | 0 (0.0%) |
| $30,000 to $34,999 | 7 (5.0%) | 0 (0.0%) |
| $35,000 to $39,999 | 0 (0.0%) | 30 (42.2%) |
| $40,000 to $44,999 | 0 (0.0%) | 0 (0.0%) |
| $45,000 to $49,999 | 22 (15.8%) | 0 (0.0%) |
| $50,000 to $54,999 | 0 (0.0%) | 0 (0.0%) |
| $55,000 to $64,999 | 0 (0.0%) | 0 (0.0%) |
| $65,000 to $74,999 | 5 (3.6%) | 0 (0.0%) |
| $75,000 to $99,999 | 27 (19.4%) | 0 (0.0%) |
| $100,000+ | 50 (36.0%) | 41 (57.8%) |
| Total | 139 (100.0%) | 71 (100.0%) |
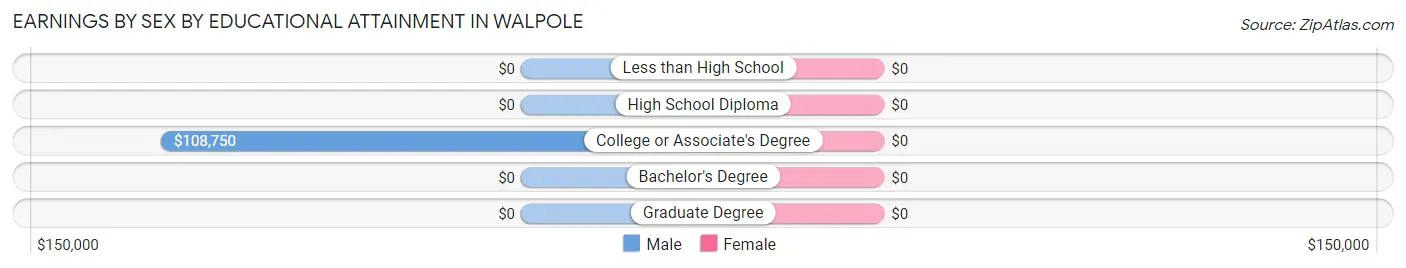
Earnings by Sex by Educational Attainment in Walpole
| Educational Attainment | Male Income | Female Income |
| Less than High School | - | - |
| High School Diploma | - | - |
| College or Associate's Degree | $108,750 | $0 |
| Bachelor's Degree | - | - |
| Graduate Degree | - | - |
| Total | $84,167 | $0 |
Family Income in Walpole
Family Income Brackets in Walpole
According to the Walpole family income data, there are 52 families falling into the $150,000 to $199,999 income range, which is the most common income bracket and makes up 53.6% of all families.
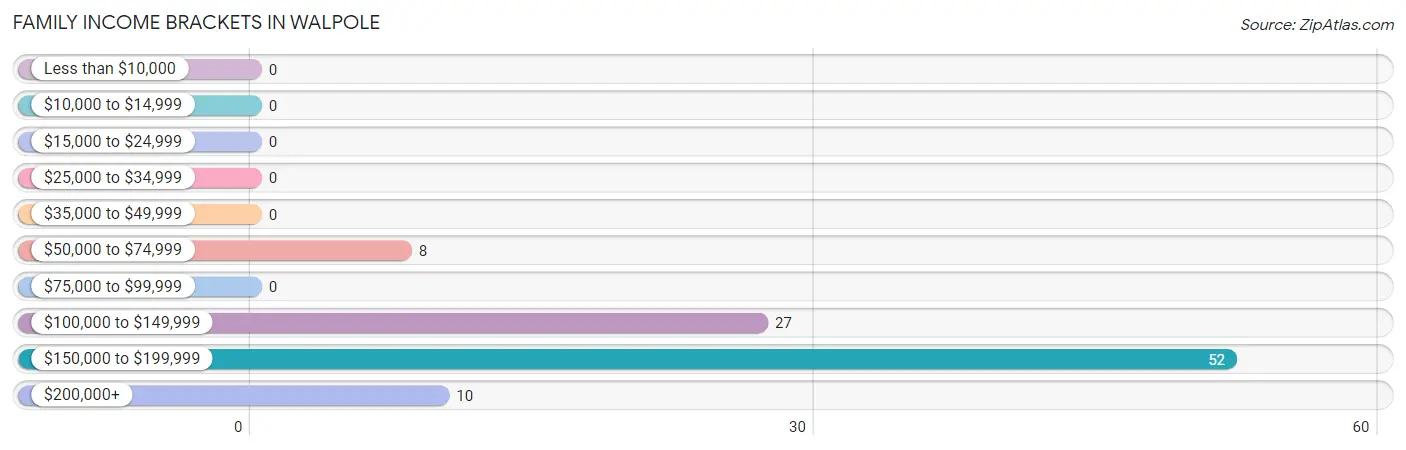
| Income Bracket | # Families | % Families |
| Less than $10,000 | 0 | 0.0% |
| $10,000 to $14,999 | 0 | 0.0% |
| $15,000 to $24,999 | 0 | 0.0% |
| $25,000 to $34,999 | 0 | 0.0% |
| $35,000 to $49,999 | 0 | 0.0% |
| $50,000 to $74,999 | 8 | 8.2% |
| $75,000 to $99,999 | 0 | 0.0% |
| $100,000 to $149,999 | 27 | 27.8% |
| $150,000 to $199,999 | 52 | 53.6% |
| $200,000+ | 10 | 10.3% |
Family Income by Famaliy Size in Walpole
2-person families (60 | 61.9%) account for the highest median family income in Walpole with $191,000 per family, while 2-person families (60 | 61.9%) have the highest median income of $95,500 per family member.
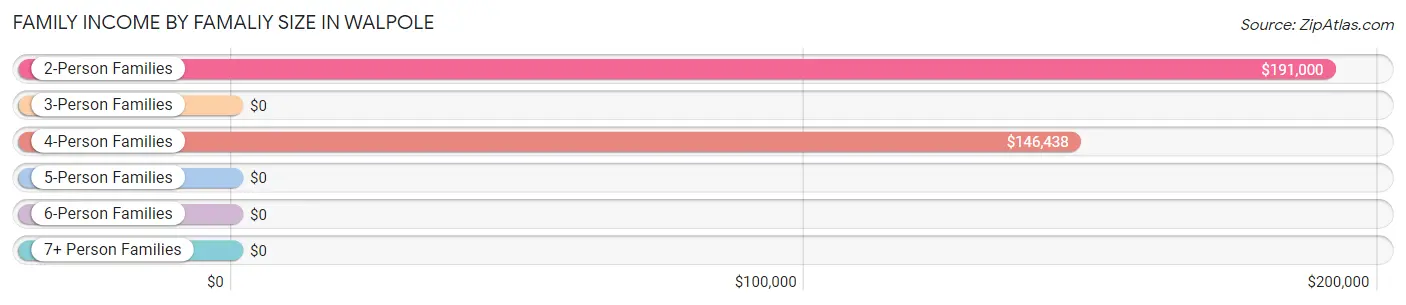
| Income Bracket | # Families | Median Income |
| 2-Person Families | 60 (61.9%) | $191,000 |
| 3-Person Families | 0 (0.0%) | $0 |
| 4-Person Families | 37 (38.1%) | $146,438 |
| 5-Person Families | 0 (0.0%) | $0 |
| 6-Person Families | 0 (0.0%) | $0 |
| 7+ Person Families | 0 (0.0%) | $0 |
| Total | 97 (100.0%) | $154,188 |
Family Income by Number of Earners in Walpole
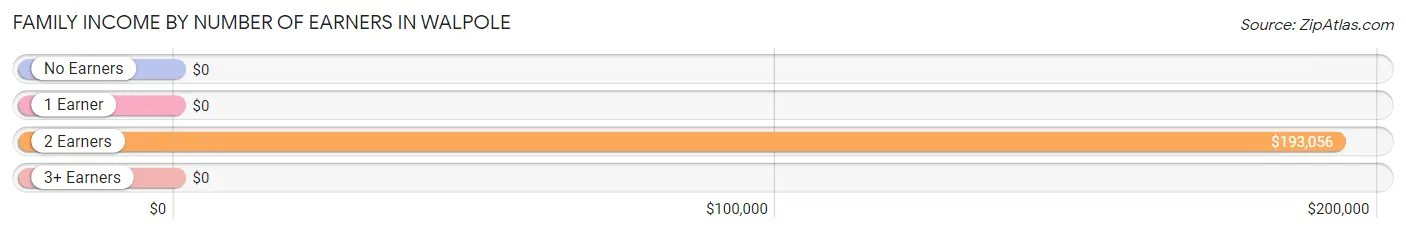
| Number of Earners | # Families | Median Income |
| No Earners | 28 (28.9%) | $0 |
| 1 Earner | 0 (0.0%) | $0 |
| 2 Earners | 62 (63.9%) | $193,056 |
| 3+ Earners | 7 (7.2%) | $0 |
| Total | 97 (100.0%) | $154,188 |
Household Income in Walpole
Household Income Brackets in Walpole
With 78 households falling in the category, the less than $10,000 income range is the most frequent in Walpole, accounting for 26.1% of all households.
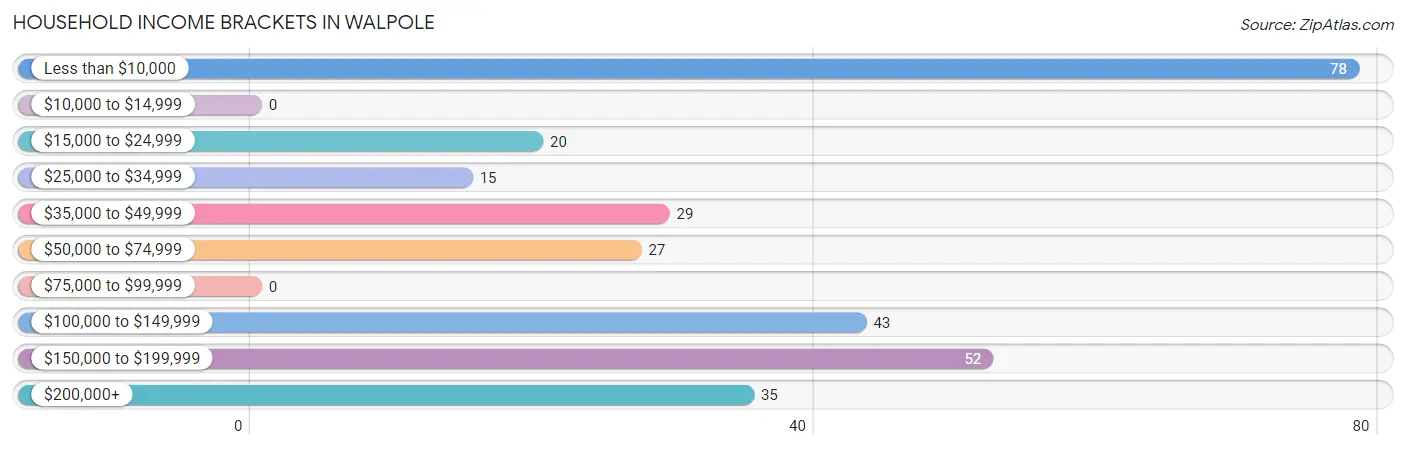
| Income Bracket | # Households | % Households |
| Less than $10,000 | 78 | 26.1% |
| $10,000 to $14,999 | 0 | 0.0% |
| $15,000 to $24,999 | 20 | 6.7% |
| $25,000 to $34,999 | 15 | 5.0% |
| $35,000 to $49,999 | 29 | 9.7% |
| $50,000 to $74,999 | 27 | 9.0% |
| $75,000 to $99,999 | 0 | 0.0% |
| $100,000 to $149,999 | 43 | 14.4% |
| $150,000 to $199,999 | 52 | 17.4% |
| $200,000+ | 35 | 11.7% |
Household Income by Householder Age in Walpole
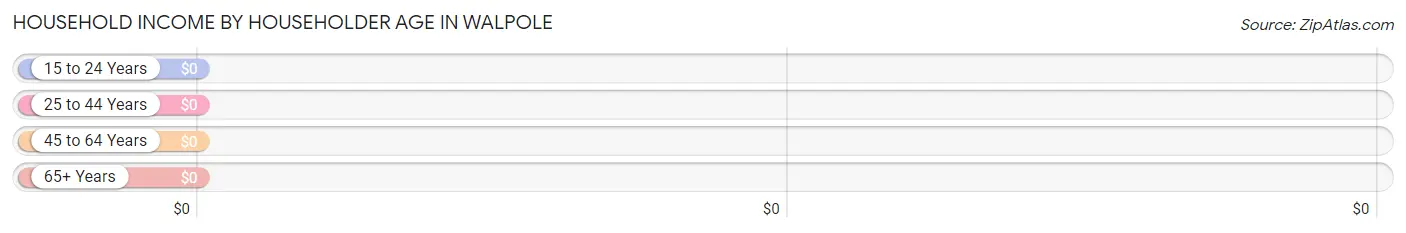
| Income Bracket | # Households | Median Income |
| 15 to 24 Years | 0 (0.0%) | $0 |
| 25 to 44 Years | 5 (1.7%) | $0 |
| 45 to 64 Years | 146 (48.8%) | $0 |
| 65+ Years | 148 (49.5%) | $0 |
| Total | 299 (100.0%) | $0 |
Poverty in Walpole
Income Below Poverty by Sex and Age in Walpole
With 8.5% poverty level for males and 26.3% for females among the residents of Walpole, 75 year old and over males and 75 year old and over females are the most vulnerable to poverty, with 21 males (44.7%) and 57 females (62.0%) in their respective age groups living below the poverty level.
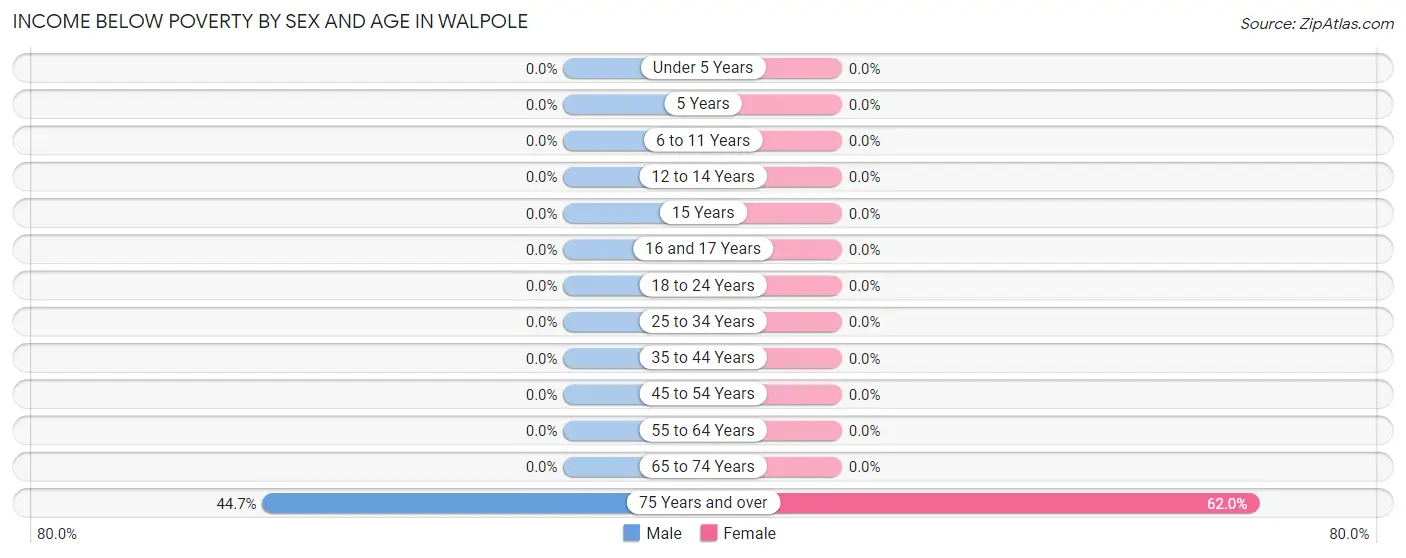
| Age Bracket | Male | Female |
| Under 5 Years | 0 (0.0%) | 0 (0.0%) |
| 5 Years | 0 (0.0%) | 0 (0.0%) |
| 6 to 11 Years | 0 (0.0%) | 0 (0.0%) |
| 12 to 14 Years | 0 (0.0%) | 0 (0.0%) |
| 15 Years | 0 (0.0%) | 0 (0.0%) |
| 16 and 17 Years | 0 (0.0%) | 0 (0.0%) |
| 18 to 24 Years | 0 (0.0%) | 0 (0.0%) |
| 25 to 34 Years | 0 (0.0%) | 0 (0.0%) |
| 35 to 44 Years | 0 (0.0%) | 0 (0.0%) |
| 45 to 54 Years | 0 (0.0%) | 0 (0.0%) |
| 55 to 64 Years | 0 (0.0%) | 0 (0.0%) |
| 65 to 74 Years | 0 (0.0%) | 0 (0.0%) |
| 75 Years and over | 21 (44.7%) | 57 (62.0%) |
| Total | 21 (8.5%) | 57 (26.3%) |
Income Above Poverty by Sex and Age in Walpole
According to the poverty statistics in Walpole, males aged 12 to 14 years and females aged 15 years are the age groups that are most secure financially, with 100.0% of males and 100.0% of females in these age groups living above the poverty line.
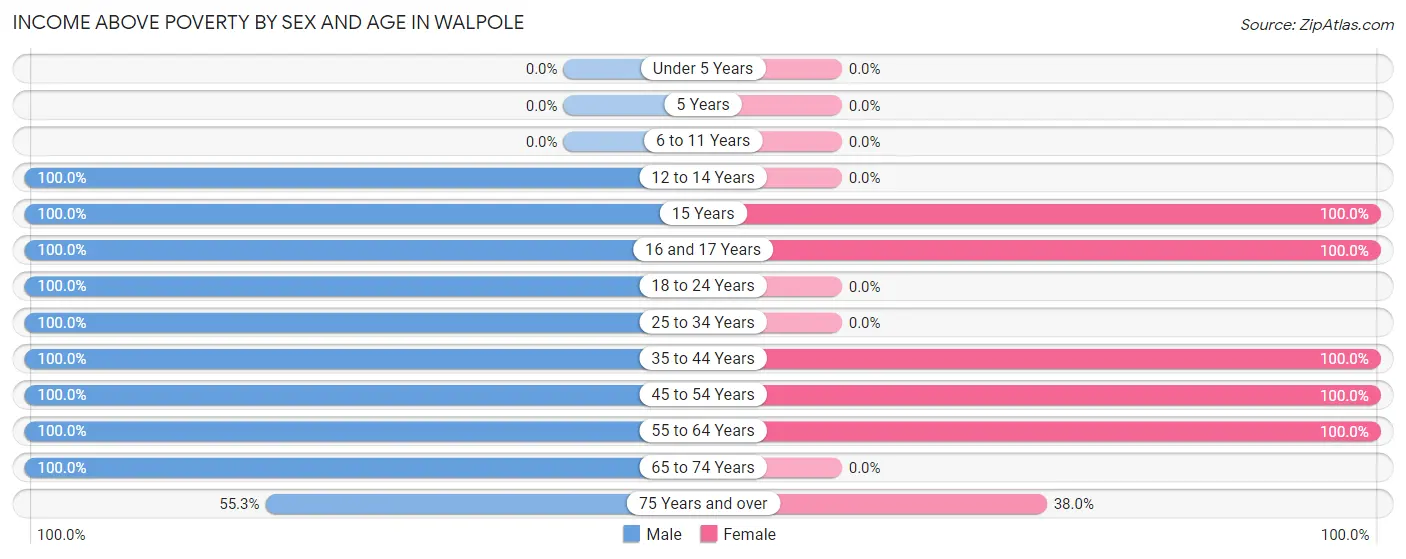
| Age Bracket | Male | Female |
| Under 5 Years | 0 (0.0%) | 0 (0.0%) |
| 5 Years | 0 (0.0%) | 0 (0.0%) |
| 6 to 11 Years | 0 (0.0%) | 0 (0.0%) |
| 12 to 14 Years | 17 (100.0%) | 0 (0.0%) |
| 15 Years | 13 (100.0%) | 7 (100.0%) |
| 16 and 17 Years | 13 (100.0%) | 19 (100.0%) |
| 18 to 24 Years | 8 (100.0%) | 0 (0.0%) |
| 25 to 34 Years | 5 (100.0%) | 0 (0.0%) |
| 35 to 44 Years | 5 (100.0%) | 24 (100.0%) |
| 45 to 54 Years | 47 (100.0%) | 40 (100.0%) |
| 55 to 64 Years | 52 (100.0%) | 35 (100.0%) |
| 65 to 74 Years | 41 (100.0%) | 0 (0.0%) |
| 75 Years and over | 26 (55.3%) | 35 (38.0%) |
| Total | 227 (91.5%) | 160 (73.7%) |
Income Below Poverty Among Married-Couple Families in Walpole
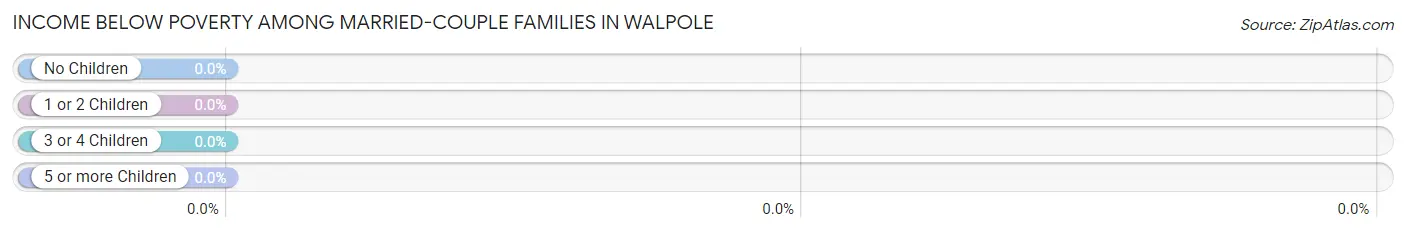
| Children | Above Poverty | Below Poverty |
| No Children | 60 (100.0%) | 0 (0.0%) |
| 1 or 2 Children | 37 (100.0%) | 0 (0.0%) |
| 3 or 4 Children | 0 (0.0%) | 0 (0.0%) |
| 5 or more Children | 0 (0.0%) | 0 (0.0%) |
| Total | 97 (100.0%) | 0 (0.0%) |
Income Below Poverty Among Single-Parent Households in Walpole
| Children | Single Father | Single Mother |
| No Children | 0 (0.0%) | 0 (0.0%) |
| 1 or 2 Children | 0 (0.0%) | 0 (0.0%) |
| 3 or 4 Children | 0 (0.0%) | 0 (0.0%) |
| 5 or more Children | 0 (0.0%) | 0 (0.0%) |
| Total | 0 (0.0%) | 0 (0.0%) |
Income Below Poverty Among Married-Couple vs Single-Parent Households in Walpole
| Children | Married-Couple Families | Single-Parent Households |
| No Children | 0 (0.0%) | 0 (0.0%) |
| 1 or 2 Children | 0 (0.0%) | 0 (0.0%) |
| 3 or 4 Children | 0 (0.0%) | 0 (0.0%) |
| 5 or more Children | 0 (0.0%) | 0 (0.0%) |
| Total | 0 (0.0%) | 0 (0.0%) |
Race in Walpole
The most populous races in Walpole are , and White / Caucasian (465 | 100.0%).
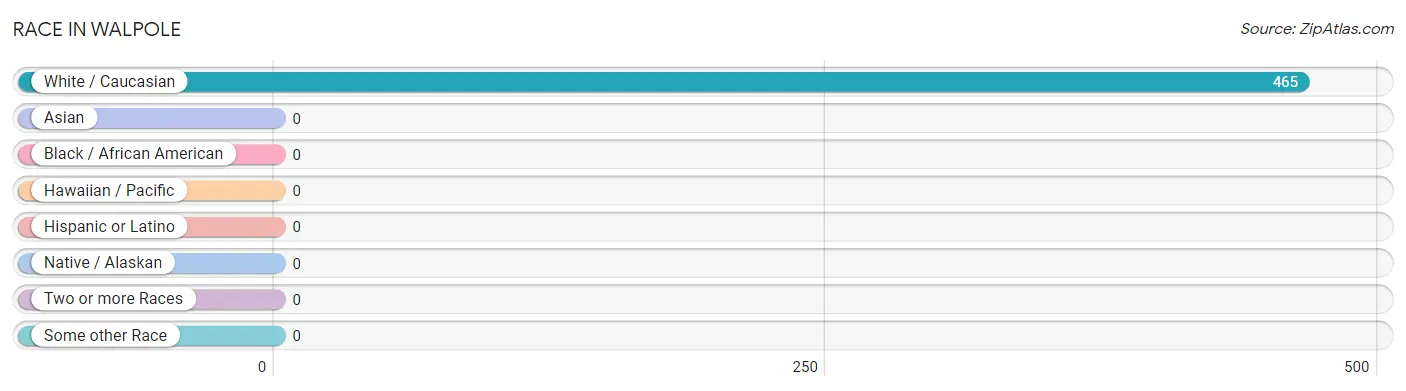
| Race | # Population | % Population |
| Asian | 0 | 0.0% |
| Black / African American | 0 | 0.0% |
| Hawaiian / Pacific | 0 | 0.0% |
| Hispanic or Latino | 0 | 0.0% |
| Native / Alaskan | 0 | 0.0% |
| White / Caucasian | 465 | 100.0% |
| Two or more Races | 0 | 0.0% |
| Some other Race | 0 | 0.0% |
| Total | 465 | 100.0% |
Ancestry in Walpole
The most populous ancestries reported in Walpole are English (126 | 27.1%), German (81 | 17.4%), Italian (74 | 15.9%), French Canadian (71 | 15.3%), and Scottish (41 | 8.8%), together accounting for 84.5% of all Walpole residents.
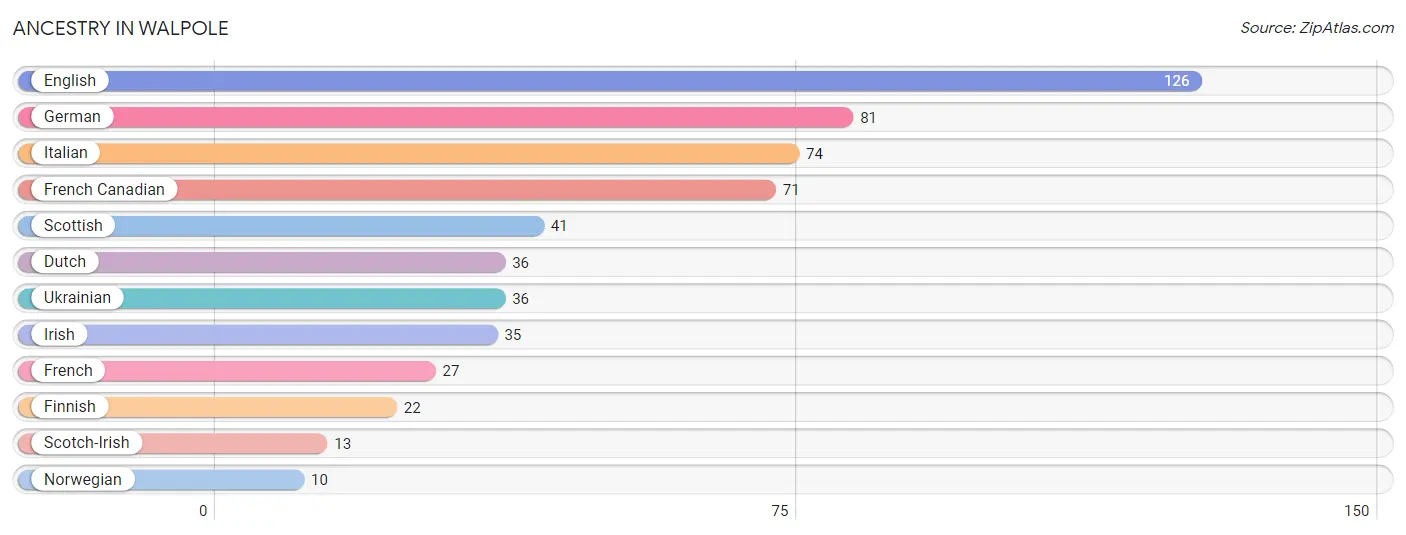
| Ancestry | # Population | % Population |
| Dutch | 36 | 7.7% |
| English | 126 | 27.1% |
| Finnish | 22 | 4.7% |
| French | 27 | 5.8% |
| French Canadian | 71 | 15.3% |
| German | 81 | 17.4% |
| Irish | 35 | 7.5% |
| Italian | 74 | 15.9% |
| Norwegian | 10 | 2.1% |
| Scotch-Irish | 13 | 2.8% |
| Scottish | 41 | 8.8% |
| Ukrainian | 36 | 7.7% | View All 12 Rows |
Immigrants in Walpole
The most numerous immigrant groups reported in Walpole came from Europe (21 | 4.5%), Netherlands (21 | 4.5%), and Western Europe (21 | 4.5%), together accounting for 13.6% of all Walpole residents.
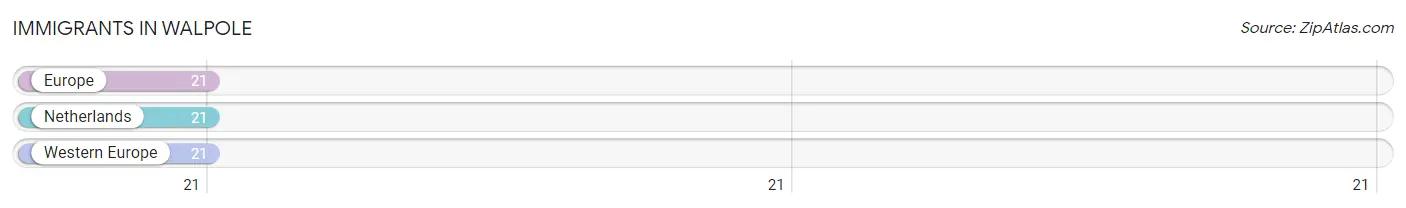
| Immigration Origin | # Population | % Population |
| Europe | 21 | 4.5% |
| Netherlands | 21 | 4.5% |
| Western Europe | 21 | 4.5% | View All 3 Rows |
Sex and Age in Walpole
Sex and Age in Walpole
The most populous age groups in Walpole are 50 to 54 Years (47 | 19.0%) for men and 85 Years and over (77 | 35.5%) for women.
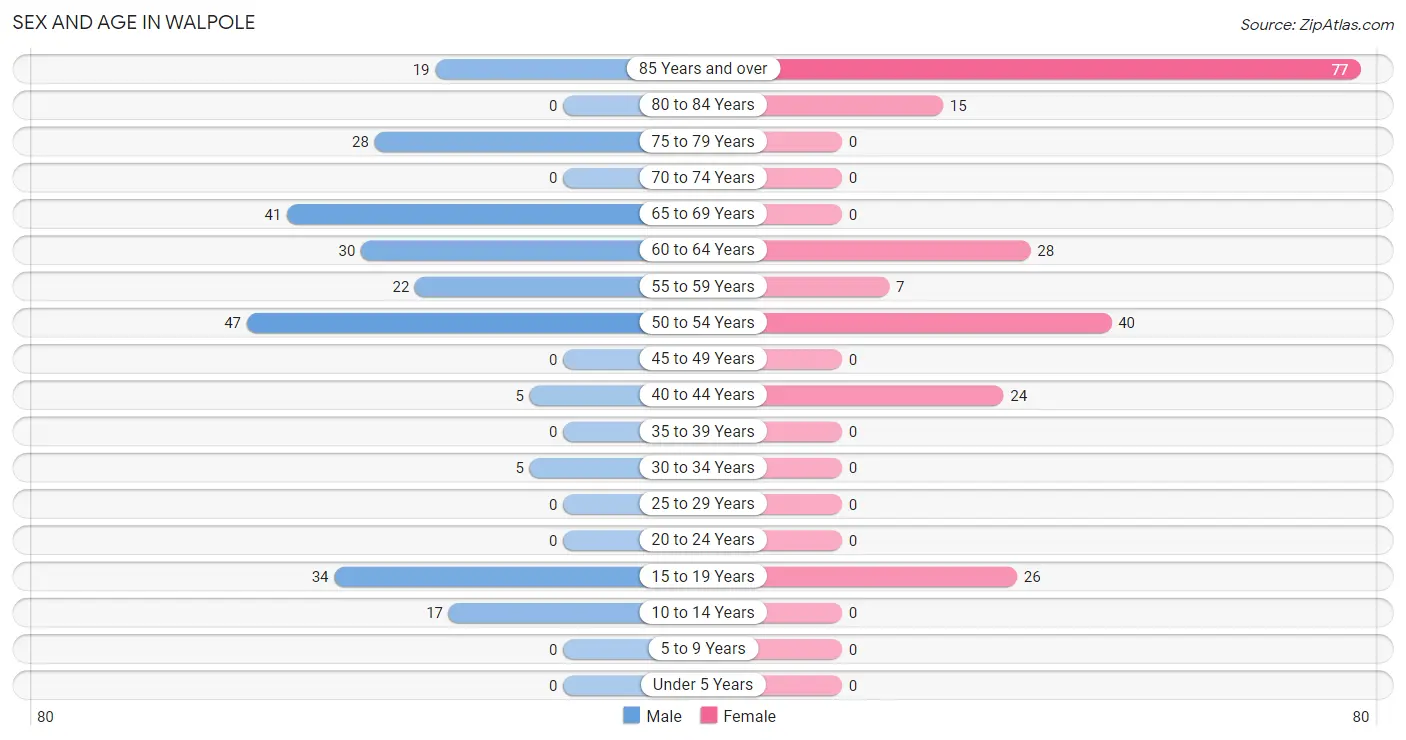
| Age Bracket | Male | Female |
| Under 5 Years | 0 (0.0%) | 0 (0.0%) |
| 5 to 9 Years | 0 (0.0%) | 0 (0.0%) |
| 10 to 14 Years | 17 (6.9%) | 0 (0.0%) |
| 15 to 19 Years | 34 (13.7%) | 26 (12.0%) |
| 20 to 24 Years | 0 (0.0%) | 0 (0.0%) |
| 25 to 29 Years | 0 (0.0%) | 0 (0.0%) |
| 30 to 34 Years | 5 (2.0%) | 0 (0.0%) |
| 35 to 39 Years | 0 (0.0%) | 0 (0.0%) |
| 40 to 44 Years | 5 (2.0%) | 24 (11.1%) |
| 45 to 49 Years | 0 (0.0%) | 0 (0.0%) |
| 50 to 54 Years | 47 (19.0%) | 40 (18.4%) |
| 55 to 59 Years | 22 (8.9%) | 7 (3.2%) |
| 60 to 64 Years | 30 (12.1%) | 28 (12.9%) |
| 65 to 69 Years | 41 (16.5%) | 0 (0.0%) |
| 70 to 74 Years | 0 (0.0%) | 0 (0.0%) |
| 75 to 79 Years | 28 (11.3%) | 0 (0.0%) |
| 80 to 84 Years | 0 (0.0%) | 15 (6.9%) |
| 85 Years and over | 19 (7.7%) | 77 (35.5%) |
| Total | 248 (100.0%) | 217 (100.0%) |
Families and Households in Walpole
Median Family Size in Walpole
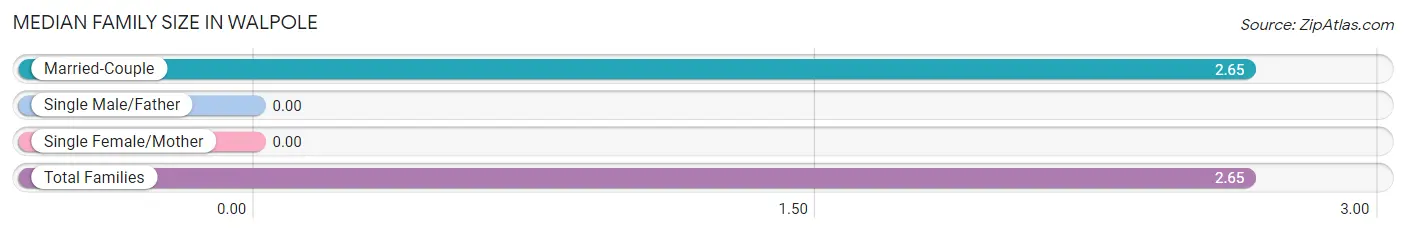
| Family Type | # Families | Family Size |
| Married-Couple | 97 (100.0%) | 2.65 |
| Single Male/Father | 0 (0.0%) | - |
| Single Female/Mother | 0 (0.0%) | - |
| Total Families | 97 (100.0%) | 2.65 |
Median Household Size in Walpole
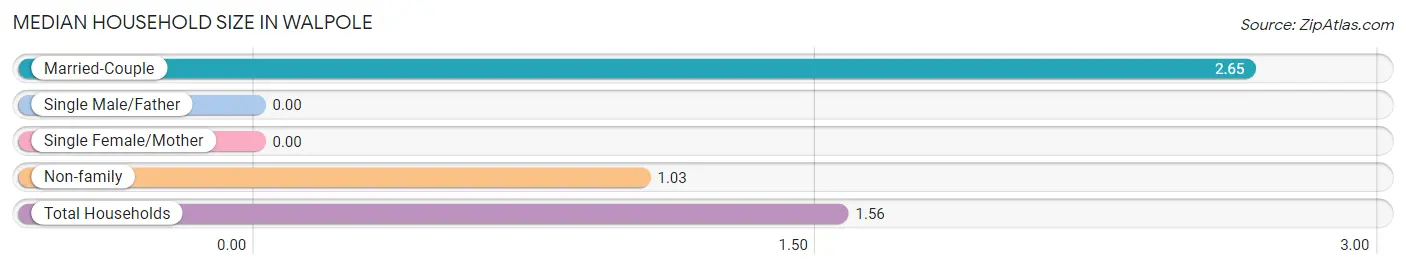
| Household Type | # Households | Household Size |
| Married-Couple | 97 (32.4%) | 2.65 |
| Single Male/Father | 0 (0.0%) | - |
| Single Female/Mother | 0 (0.0%) | - |
| Non-family | 202 (67.6%) | 1.03 |
| Total Households | 299 (100.0%) | 1.56 |
Household Size by Marriage Status in Walpole
Out of a total of 299 households in Walpole, 97 (32.4%) are family households, while 202 (67.6%) are nonfamily households. The most numerous type of family households are 2-person households, comprising 60, and the most common type of nonfamily households are 1-person households, comprising 195.
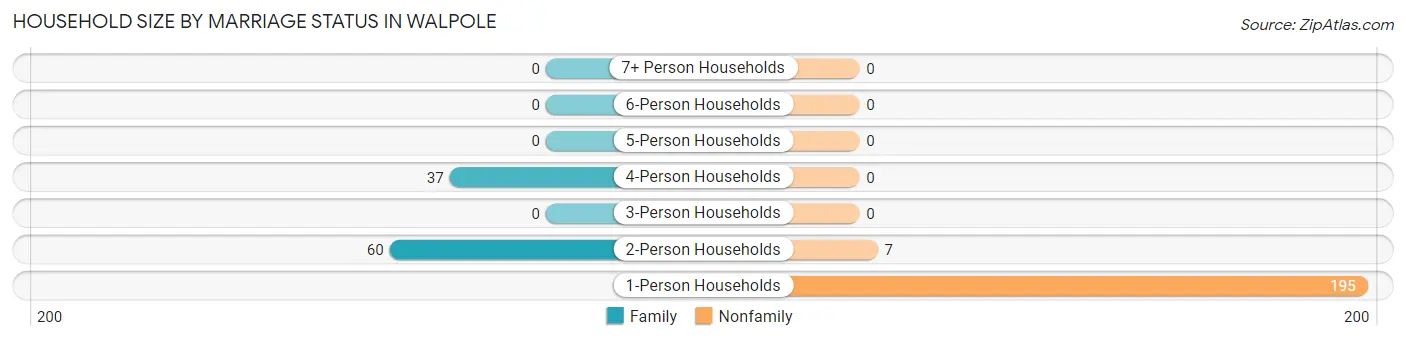
| Household Size | Family Households | Nonfamily Households |
| 1-Person Households | - | 195 (65.2%) |
| 2-Person Households | 60 (20.1%) | 7 (2.3%) |
| 3-Person Households | 0 (0.0%) | 0 (0.0%) |
| 4-Person Households | 37 (12.4%) | 0 (0.0%) |
| 5-Person Households | 0 (0.0%) | 0 (0.0%) |
| 6-Person Households | 0 (0.0%) | 0 (0.0%) |
| 7+ Person Households | 0 (0.0%) | 0 (0.0%) |
| Total | 97 (32.4%) | 202 (67.6%) |
Female Fertility in Walpole
Fertility by Age in Walpole
| Age Bracket | Women with Births | Births / 1,000 Women |
| 15 to 19 years | 0 (0.0%) | 0.0 |
| 20 to 34 years | 0 (0.0%) | 0.0 |
| 35 to 50 years | 0 (0.0%) | 0.0 |
| Total | 0 (0.0%) | 0.0 |
Fertility by Age by Marriage Status in Walpole
| Age Bracket | Married | Unmarried |
| 15 to 19 years | 0 (0.0%) | 0 (0.0%) |
| 20 to 34 years | 0 (0.0%) | 0 (0.0%) |
| 35 to 50 years | 0 (0.0%) | 0 (0.0%) |
| Total | 0 (0.0%) | 0 (0.0%) |
Fertility by Education in Walpole
| Educational Attainment | Women with Births | Births / 1,000 Women |
| Less than High School | 0 (0.0%) | 0.0 |
| High School Diploma | 0 (0.0%) | 0.0 |
| College or Associate's Degree | 0 (0.0%) | 0.0 |
| Bachelor's Degree | 0 (0.0%) | 0.0 |
| Graduate Degree | 0 (0.0%) | 0.0 |
| Total | 0 (0.0%) | 0.0 |
Fertility by Education by Marriage Status in Walpole
| Educational Attainment | Married | Unmarried |
| Less than High School | 0 (0.0%) | 0 (0.0%) |
| High School Diploma | 0 (0.0%) | 0 (0.0%) |
| College or Associate's Degree | 0 (0.0%) | 0 (0.0%) |
| Bachelor's Degree | 0 (0.0%) | 0 (0.0%) |
| Graduate Degree | 0 (0.0%) | 0 (0.0%) |
| Total | 0 (0.0%) | 0 (0.0%) |
Employment Characteristics in Walpole
Employment by Class of Employer in Walpole
Among the 189 employed individuals in Walpole, private company employees (122 | 64.5%), self-employed (not incorporated) (33 | 17.5%), and not-for-profit organizations (29 | 15.3%) make up the most common classes of employment.
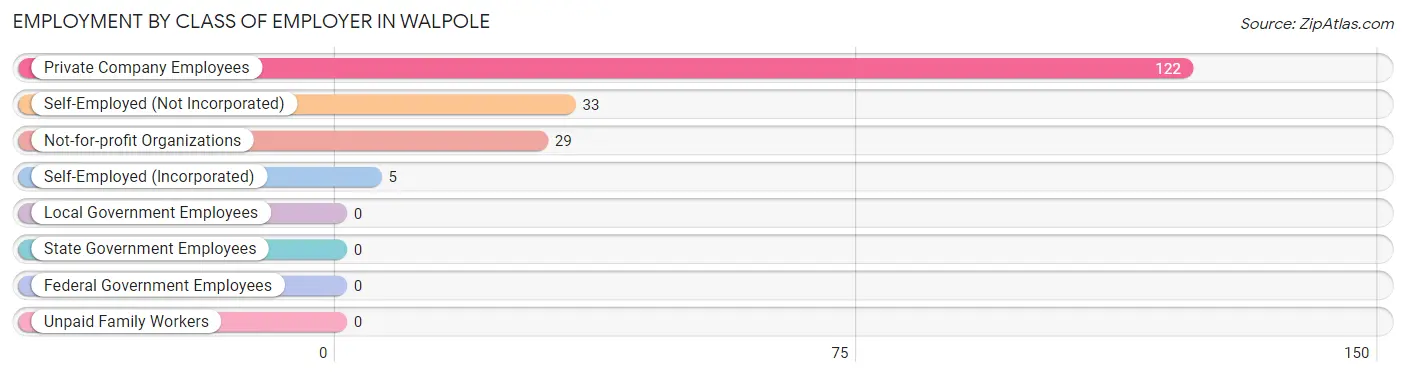
| Employer Class | # Employees | % Employees |
| Private Company Employees | 122 | 64.5% |
| Self-Employed (Incorporated) | 5 | 2.6% |
| Self-Employed (Not Incorporated) | 33 | 17.5% |
| Not-for-profit Organizations | 29 | 15.3% |
| Local Government Employees | 0 | 0.0% |
| State Government Employees | 0 | 0.0% |
| Federal Government Employees | 0 | 0.0% |
| Unpaid Family Workers | 0 | 0.0% |
| Total | 189 | 100.0% |
Employment Status by Age in Walpole
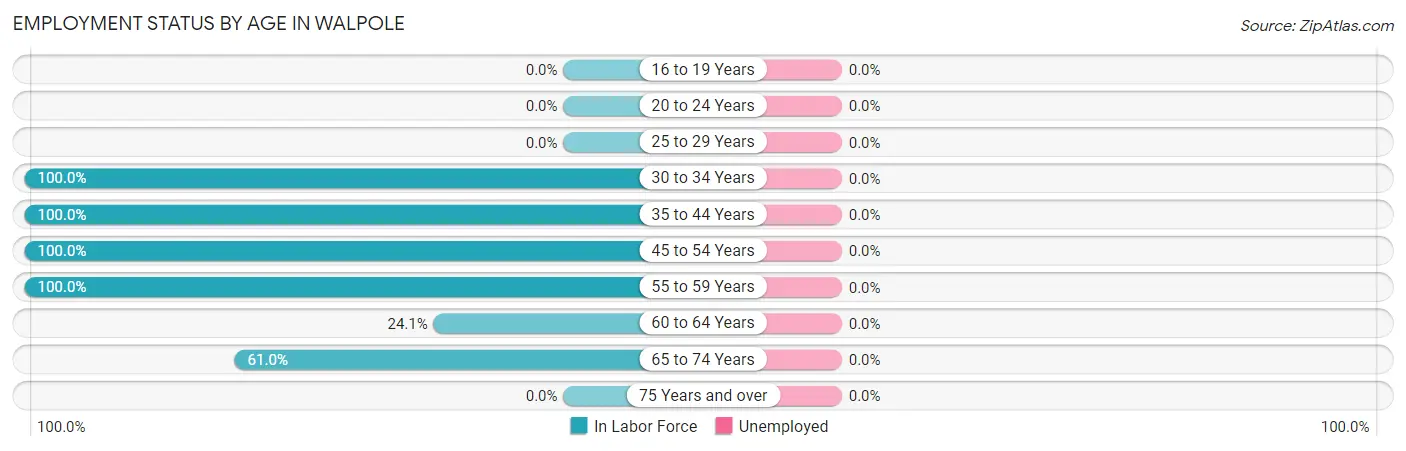
| Age Bracket | In Labor Force | Unemployed |
| 16 to 19 Years | 0 (0.0%) | 0 (0.0%) |
| 20 to 24 Years | 0 (0.0%) | 0 (0.0%) |
| 25 to 29 Years | 0 (0.0%) | 0 (0.0%) |
| 30 to 34 Years | 5 (100.0%) | 0 (0.0%) |
| 35 to 44 Years | 29 (100.0%) | 0 (0.0%) |
| 45 to 54 Years | 87 (100.0%) | 0 (0.0%) |
| 55 to 59 Years | 29 (100.0%) | 0 (0.0%) |
| 60 to 64 Years | 14 (24.1%) | 0 (0.0%) |
| 65 to 74 Years | 25 (61.0%) | 0 (0.0%) |
| 75 Years and over | 0 (0.0%) | 0 (0.0%) |
| Total | 189 (44.2%) | 0 (0.0%) |
Employment Status by Educational Attainment in Walpole
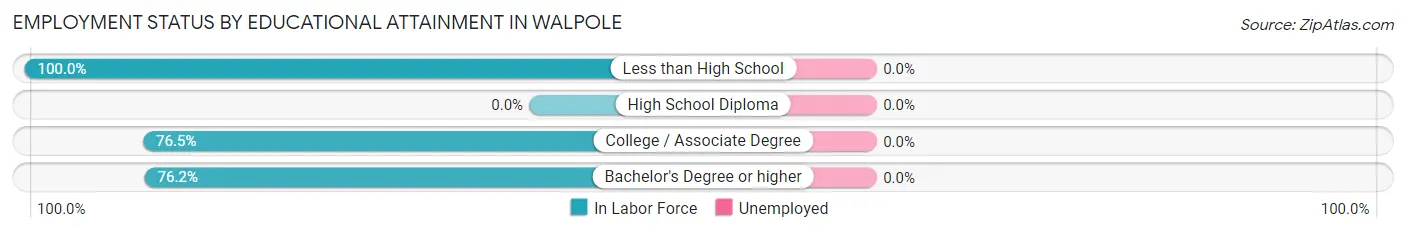
| Educational Attainment | In Labor Force | Unemployed |
| Less than High School | 22 (100.0%) | 0 (0.0%) |
| High School Diploma | 0 (0.0%) | 0 (0.0%) |
| College / Associate Degree | 65 (76.5%) | 0 (0.0%) |
| Bachelor's Degree or higher | 77 (76.2%) | 0 (0.0%) |
| Total | 164 (78.8%) | 0 (0.0%) |
Employment Occupations by Sex in Walpole
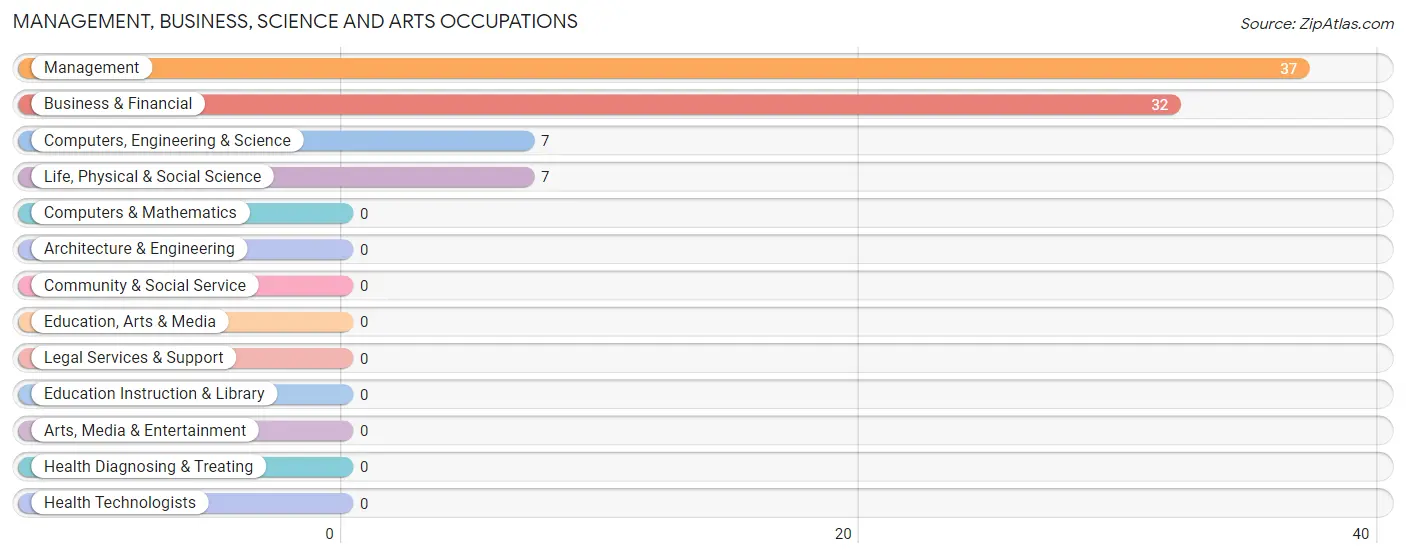
Management, Business, Science and Arts Occupations
The most common Management, Business, Science and Arts occupations in Walpole are Management (37 | 19.6%), Business & Financial (32 | 16.9%), Computers, Engineering & Science (7 | 3.7%), and Life, Physical & Social Science (7 | 3.7%).
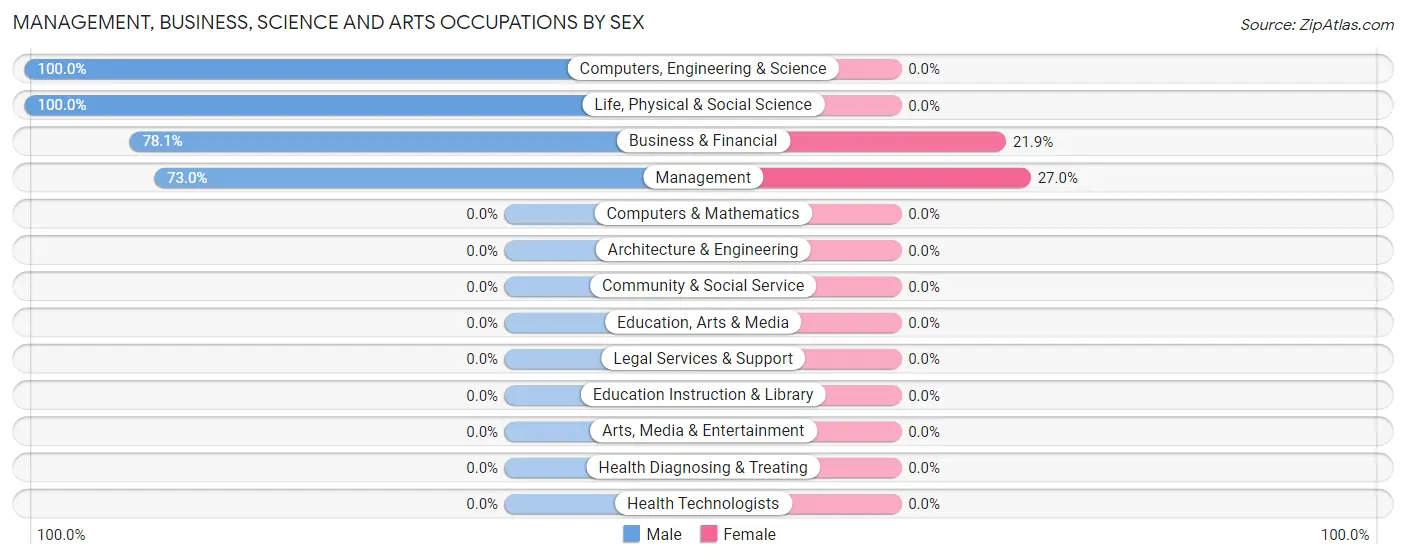
Management, Business, Science and Arts Occupations by Sex
Within the Management, Business, Science and Arts occupations in Walpole, the most male-oriented occupations are Computers, Engineering & Science (100.0%), Life, Physical & Social Science (100.0%), and Business & Financial (78.1%), while the most female-oriented occupations are Management (27.0%), and Business & Financial (21.9%).
| Occupation | Male | Female |
| Management | 27 (73.0%) | 10 (27.0%) |
| Business & Financial | 25 (78.1%) | 7 (21.9%) |
| Computers, Engineering & Science | 7 (100.0%) | 0 (0.0%) |
| Computers & Mathematics | 0 (0.0%) | 0 (0.0%) |
| Architecture & Engineering | 0 (0.0%) | 0 (0.0%) |
| Life, Physical & Social Science | 7 (100.0%) | 0 (0.0%) |
| Community & Social Service | 0 (0.0%) | 0 (0.0%) |
| Education, Arts & Media | 0 (0.0%) | 0 (0.0%) |
| Legal Services & Support | 0 (0.0%) | 0 (0.0%) |
| Education Instruction & Library | 0 (0.0%) | 0 (0.0%) |
| Arts, Media & Entertainment | 0 (0.0%) | 0 (0.0%) |
| Health Diagnosing & Treating | 0 (0.0%) | 0 (0.0%) |
| Health Technologists | 0 (0.0%) | 0 (0.0%) |
| Total (Category) | 59 (77.6%) | 17 (22.4%) |
| Total (Overall) | 118 (62.4%) | 71 (37.6%) |
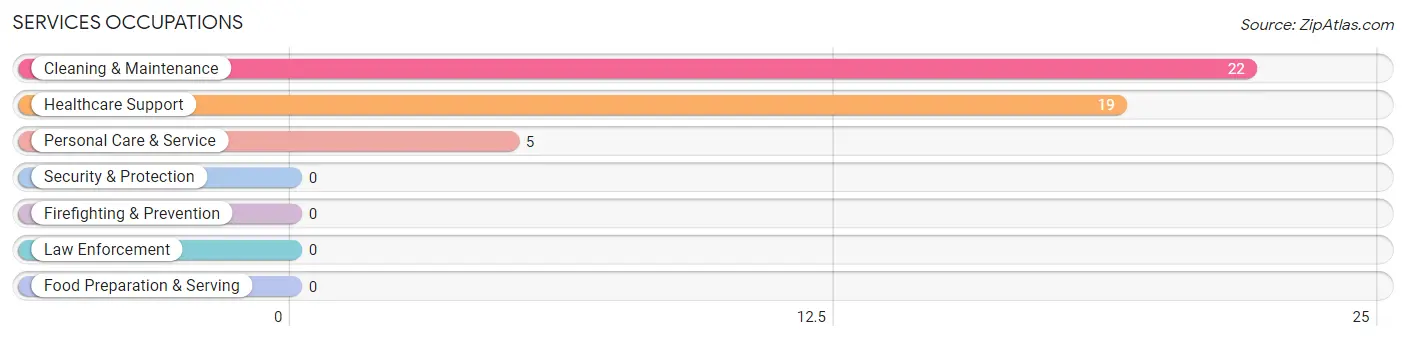
Services Occupations
The most common Services occupations in Walpole are Cleaning & Maintenance (22 | 11.6%), Healthcare Support (19 | 10.1%), and Personal Care & Service (5 | 2.6%).
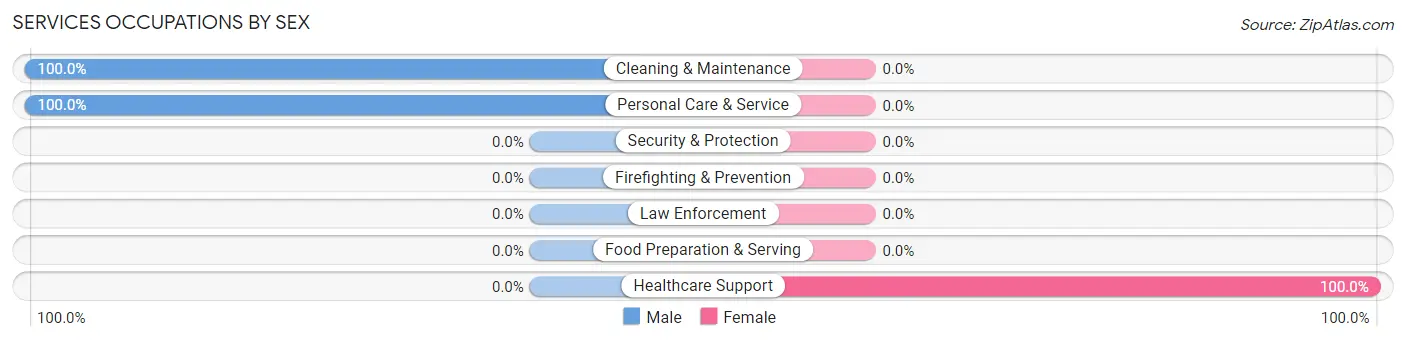
Services Occupations by Sex
| Occupation | Male | Female |
| Healthcare Support | 0 (0.0%) | 19 (100.0%) |
| Security & Protection | 0 (0.0%) | 0 (0.0%) |
| Firefighting & Prevention | 0 (0.0%) | 0 (0.0%) |
| Law Enforcement | 0 (0.0%) | 0 (0.0%) |
| Food Preparation & Serving | 0 (0.0%) | 0 (0.0%) |
| Cleaning & Maintenance | 22 (100.0%) | 0 (0.0%) |
| Personal Care & Service | 5 (100.0%) | 0 (0.0%) |
| Total (Category) | 27 (58.7%) | 19 (41.3%) |
| Total (Overall) | 118 (62.4%) | 71 (37.6%) |
Sales and Office Occupations
The most common Sales and Office occupations in Walpole are Sales & Related (20 | 10.6%), and Office & Administration (11 | 5.8%).
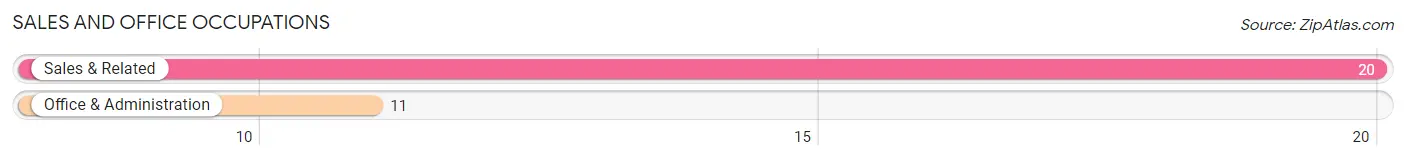
Sales and Office Occupations by Sex

| Occupation | Male | Female |
| Sales & Related | 20 (100.0%) | 0 (0.0%) |
| Office & Administration | 0 (0.0%) | 11 (100.0%) |
| Total (Category) | 20 (64.5%) | 11 (35.5%) |
| Total (Overall) | 118 (62.4%) | 71 (37.6%) |
Natural Resources, Construction and Maintenance Occupations
The most common Natural Resources, Construction and Maintenance occupations in Walpole are Construction & Extraction (7 | 3.7%), and Installation, Maintenance & Repair (5 | 2.6%).
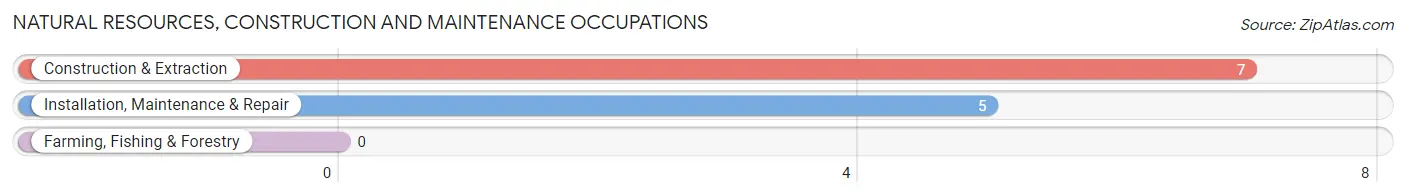
Natural Resources, Construction and Maintenance Occupations by Sex

| Occupation | Male | Female |
| Farming, Fishing & Forestry | 0 (0.0%) | 0 (0.0%) |
| Construction & Extraction | 7 (100.0%) | 0 (0.0%) |
| Installation, Maintenance & Repair | 5 (100.0%) | 0 (0.0%) |
| Total (Category) | 12 (100.0%) | 0 (0.0%) |
| Total (Overall) | 118 (62.4%) | 71 (37.6%) |
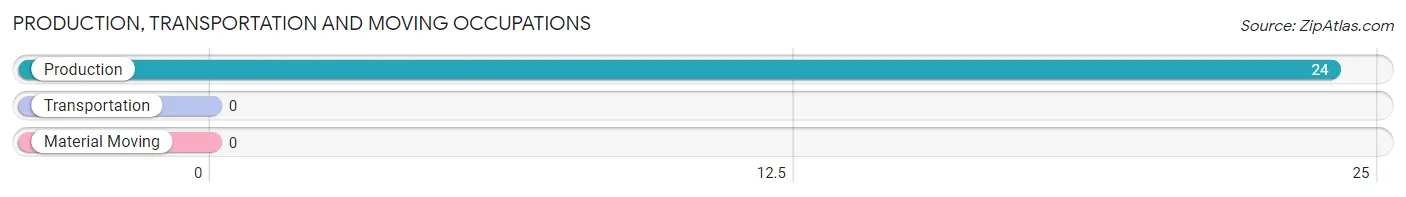
Production, Transportation and Moving Occupations
The most common Production, Transportation and Moving occupations in Walpole are , and Production (24 | 12.7%).
Production, Transportation and Moving Occupations by Sex
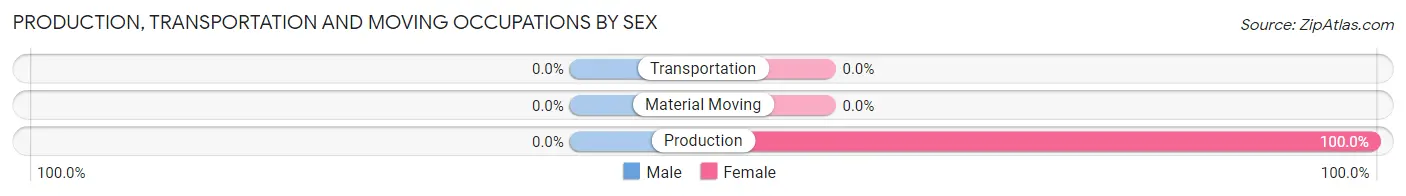
| Occupation | Male | Female |
| Production | 0 (0.0%) | 24 (100.0%) |
| Transportation | 0 (0.0%) | 0 (0.0%) |
| Material Moving | 0 (0.0%) | 0 (0.0%) |
| Total (Category) | 0 (0.0%) | 24 (100.0%) |
| Total (Overall) | 118 (62.4%) | 71 (37.6%) |
Employment Industries by Sex in Walpole
Employment Industries in Walpole
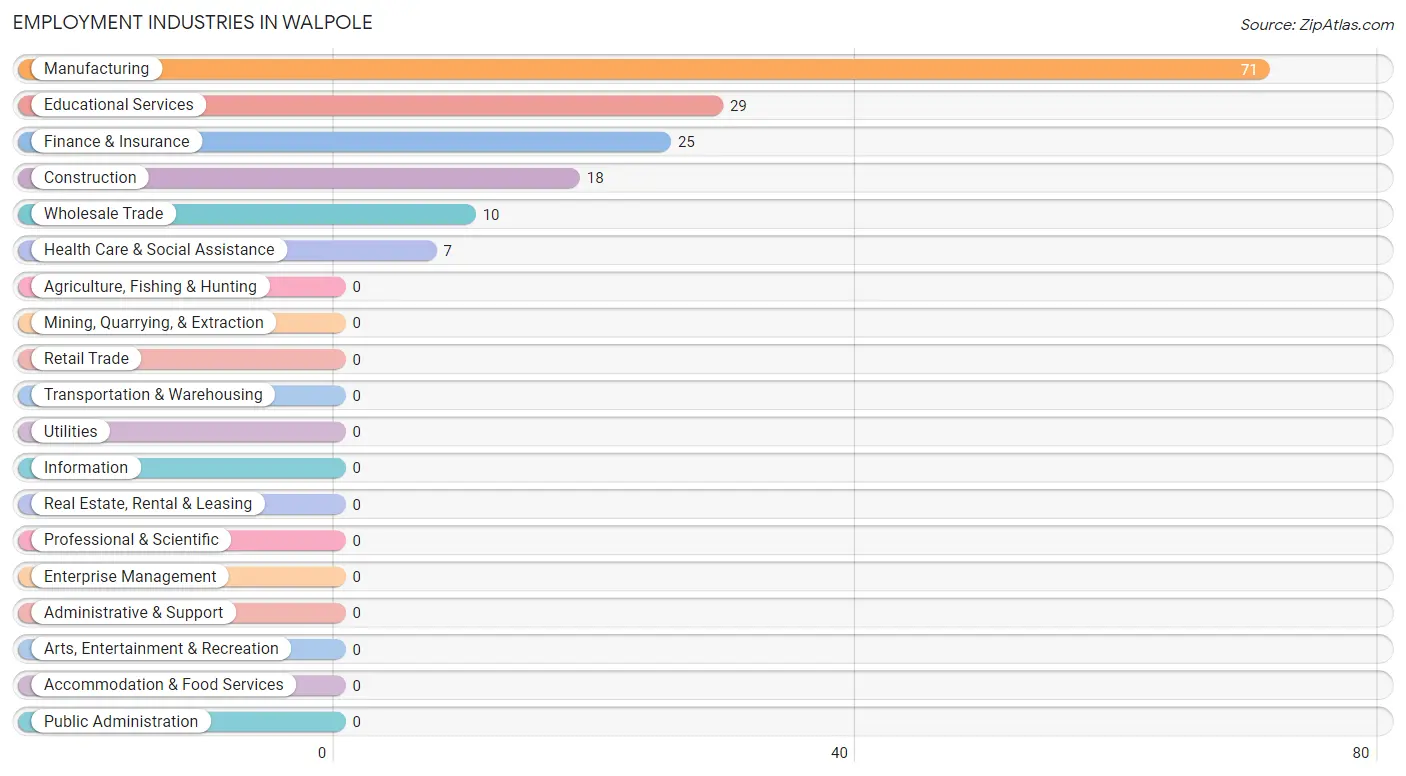
The major employment industries in Walpole include Manufacturing (71 | 37.6%), Educational Services (29 | 15.3%), Finance & Insurance (25 | 13.2%), Construction (18 | 9.5%), and Wholesale Trade (10 | 5.3%).
Employment Industries by Sex in Walpole
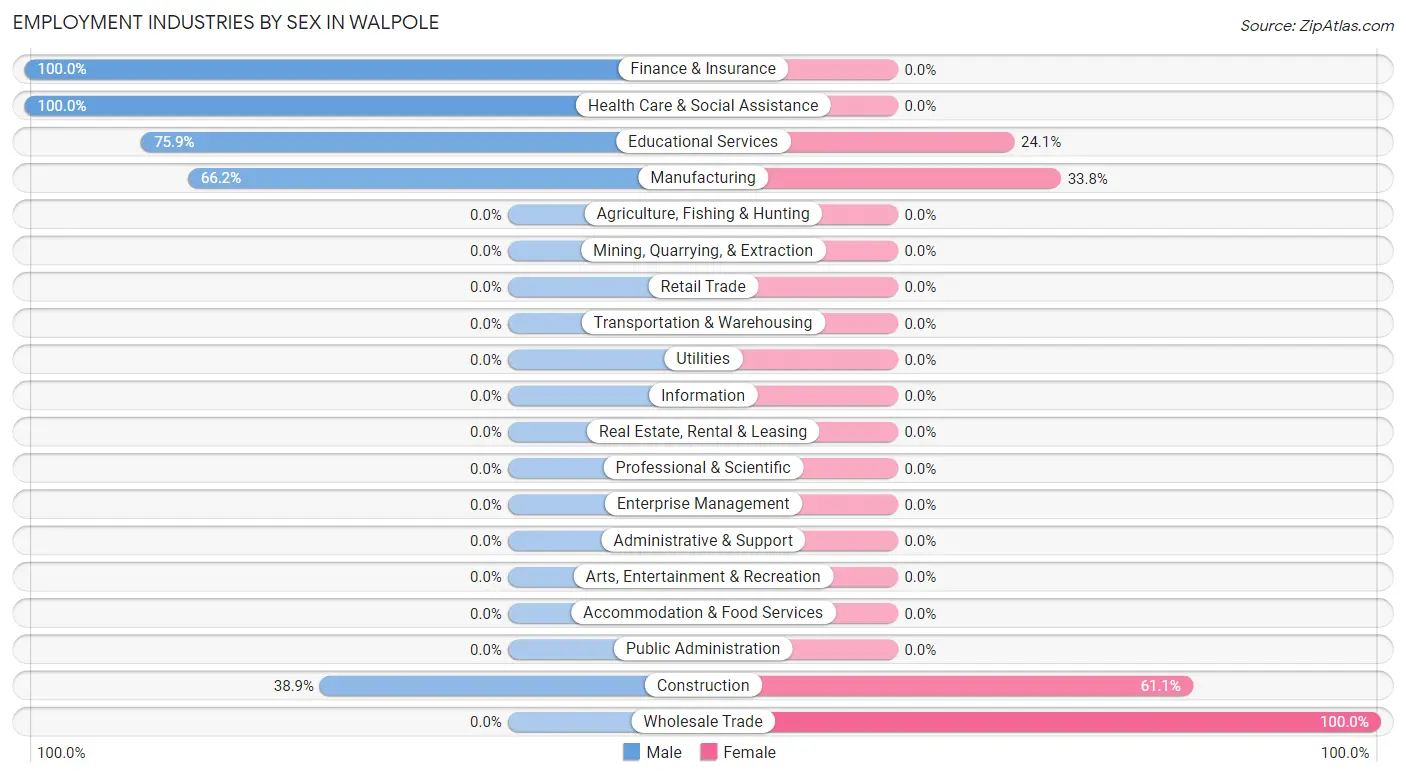
The Walpole industries that see more men than women are Finance & Insurance (100.0%), Health Care & Social Assistance (100.0%), and Educational Services (75.9%), whereas the industries that tend to have a higher number of women are Wholesale Trade (100.0%), Construction (61.1%), and Manufacturing (33.8%).
| Industry | Male | Female |
| Agriculture, Fishing & Hunting | 0 (0.0%) | 0 (0.0%) |
| Mining, Quarrying, & Extraction | 0 (0.0%) | 0 (0.0%) |
| Construction | 7 (38.9%) | 11 (61.1%) |
| Manufacturing | 47 (66.2%) | 24 (33.8%) |
| Wholesale Trade | 0 (0.0%) | 10 (100.0%) |
| Retail Trade | 0 (0.0%) | 0 (0.0%) |
| Transportation & Warehousing | 0 (0.0%) | 0 (0.0%) |
| Utilities | 0 (0.0%) | 0 (0.0%) |
| Information | 0 (0.0%) | 0 (0.0%) |
| Finance & Insurance | 25 (100.0%) | 0 (0.0%) |
| Real Estate, Rental & Leasing | 0 (0.0%) | 0 (0.0%) |
| Professional & Scientific | 0 (0.0%) | 0 (0.0%) |
| Enterprise Management | 0 (0.0%) | 0 (0.0%) |
| Administrative & Support | 0 (0.0%) | 0 (0.0%) |
| Educational Services | 22 (75.9%) | 7 (24.1%) |
| Health Care & Social Assistance | 7 (100.0%) | 0 (0.0%) |
| Arts, Entertainment & Recreation | 0 (0.0%) | 0 (0.0%) |
| Accommodation & Food Services | 0 (0.0%) | 0 (0.0%) |
| Public Administration | 0 (0.0%) | 0 (0.0%) |
| Total | 118 (62.4%) | 71 (37.6%) |
Education in Walpole
School Enrollment in Walpole
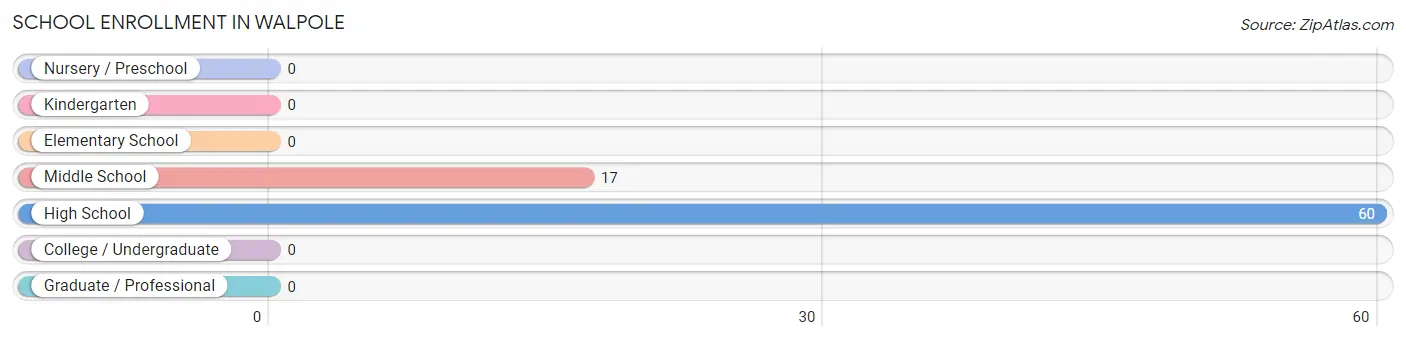
The most common levels of schooling among the 77 students in Walpole are high school (60 | 77.9%), and middle school (17 | 22.1%).
| School Level | # Students | % Students |
| Nursery / Preschool | 0 | 0.0% |
| Kindergarten | 0 | 0.0% |
| Elementary School | 0 | 0.0% |
| Middle School | 17 | 22.1% |
| High School | 60 | 77.9% |
| College / Undergraduate | 0 | 0.0% |
| Graduate / Professional | 0 | 0.0% |
| Total | 77 | 100.0% |
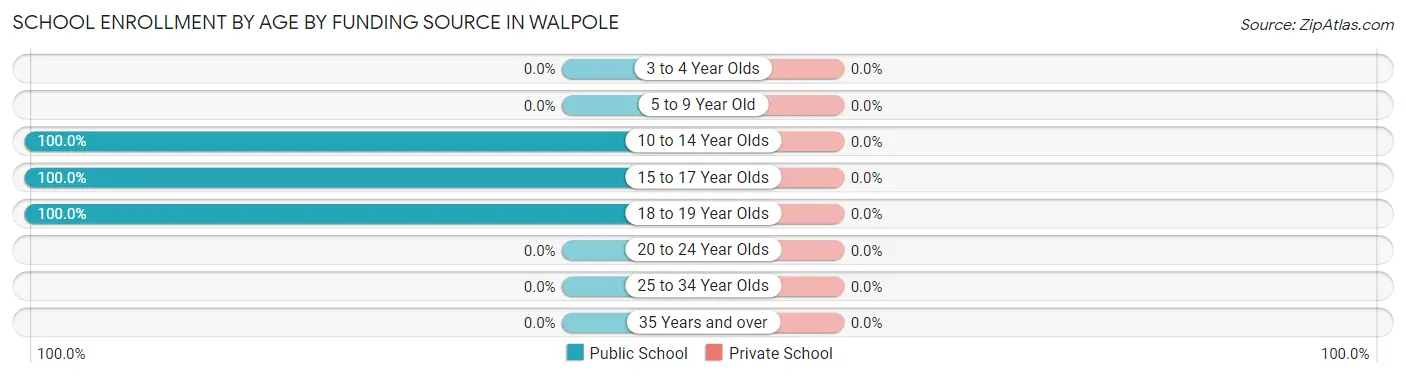
School Enrollment by Age by Funding Source in Walpole
| Age Bracket | Public School | Private School |
| 3 to 4 Year Olds | 0 (0.0%) | 0 (0.0%) |
| 5 to 9 Year Old | 0 (0.0%) | 0 (0.0%) |
| 10 to 14 Year Olds | 17 (100.0%) | 0 (0.0%) |
| 15 to 17 Year Olds | 52 (100.0%) | 0 (0.0%) |
| 18 to 19 Year Olds | 8 (100.0%) | 0 (0.0%) |
| 20 to 24 Year Olds | 0 (0.0%) | 0 (0.0%) |
| 25 to 34 Year Olds | 0 (0.0%) | 0 (0.0%) |
| 35 Years and over | 0 (0.0%) | 0 (0.0%) |
| Total | 77 (100.0%) | 0 (0.0%) |
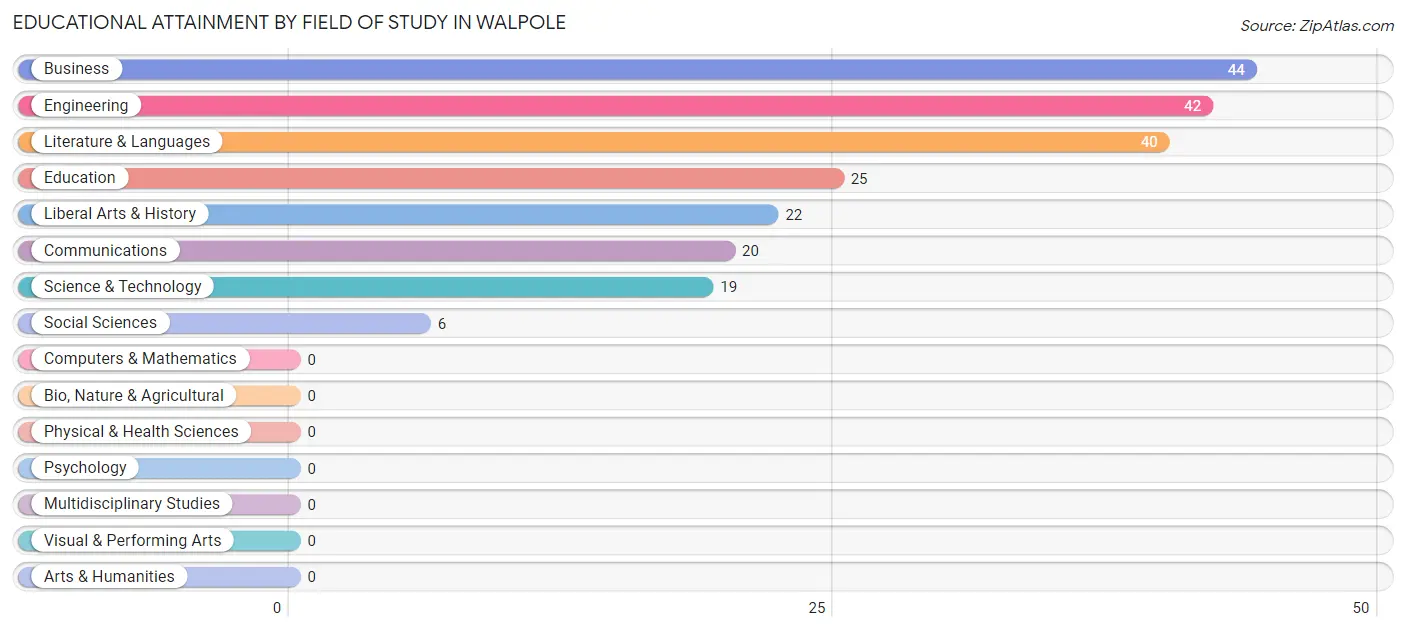
Educational Attainment by Field of Study in Walpole
Business (44 | 20.2%), engineering (42 | 19.3%), literature & languages (40 | 18.3%), education (25 | 11.5%), and liberal arts & history (22 | 10.1%) are the most common fields of study among 218 individuals in Walpole who have obtained a bachelor's degree or higher.
| Field of Study | # Graduates | % Graduates |
| Computers & Mathematics | 0 | 0.0% |
| Bio, Nature & Agricultural | 0 | 0.0% |
| Physical & Health Sciences | 0 | 0.0% |
| Psychology | 0 | 0.0% |
| Social Sciences | 6 | 2.8% |
| Engineering | 42 | 19.3% |
| Multidisciplinary Studies | 0 | 0.0% |
| Science & Technology | 19 | 8.7% |
| Business | 44 | 20.2% |
| Education | 25 | 11.5% |
| Literature & Languages | 40 | 18.3% |
| Liberal Arts & History | 22 | 10.1% |
| Visual & Performing Arts | 0 | 0.0% |
| Communications | 20 | 9.2% |
| Arts & Humanities | 0 | 0.0% |
| Total | 218 | 100.0% |
Transportation & Commute in Walpole
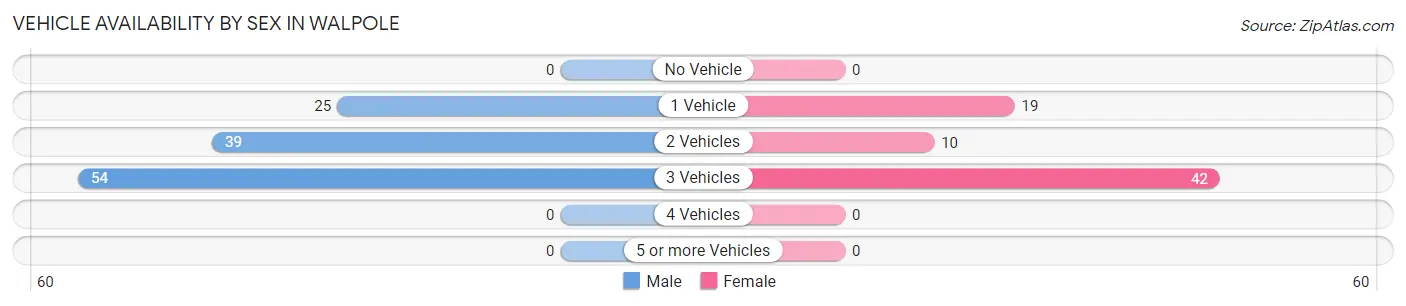
Vehicle Availability by Sex in Walpole
The most prevalent vehicle ownership categories in Walpole are males with 3 vehicles (54, accounting for 45.8%) and females with 3 vehicles (42, making up 76.1%).
| Vehicles Available | Male | Female |
| No Vehicle | 0 (0.0%) | 0 (0.0%) |
| 1 Vehicle | 25 (21.2%) | 19 (26.8%) |
| 2 Vehicles | 39 (33.1%) | 10 (14.1%) |
| 3 Vehicles | 54 (45.8%) | 42 (59.2%) |
| 4 Vehicles | 0 (0.0%) | 0 (0.0%) |
| 5 or more Vehicles | 0 (0.0%) | 0 (0.0%) |
| Total | 118 (100.0%) | 71 (100.0%) |
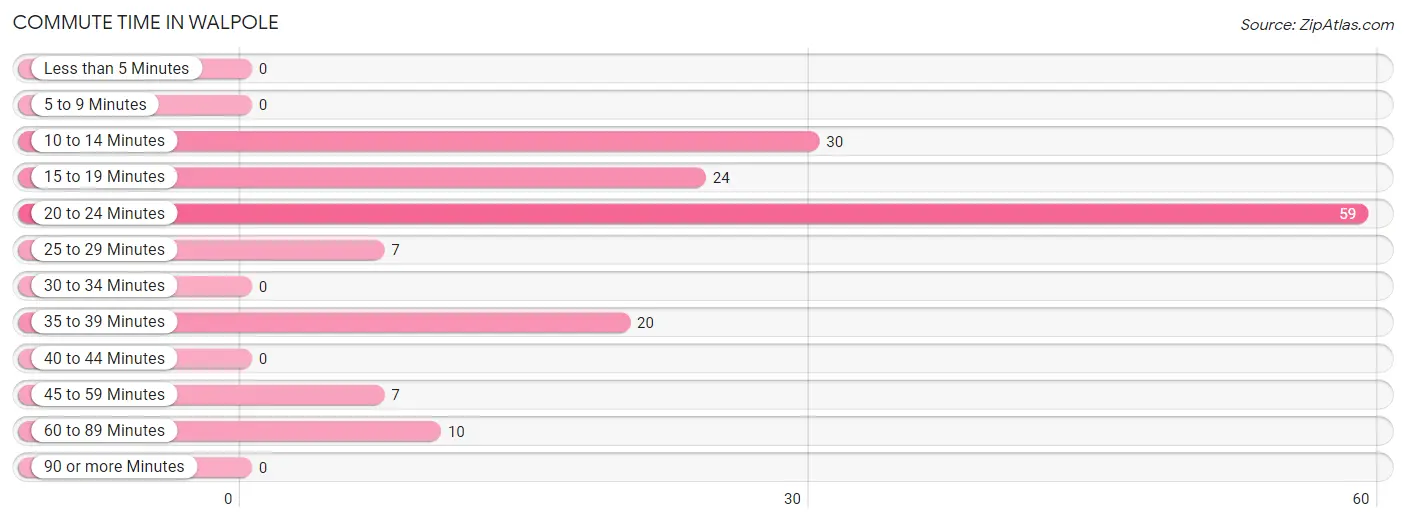
Commute Time in Walpole
The most frequently occuring commute durations in Walpole are 20 to 24 minutes (59 commuters, 37.6%), 10 to 14 minutes (30 commuters, 19.1%), and 15 to 19 minutes (24 commuters, 15.3%).
| Commute Time | # Commuters | % Commuters |
| Less than 5 Minutes | 0 | 0.0% |
| 5 to 9 Minutes | 0 | 0.0% |
| 10 to 14 Minutes | 30 | 19.1% |
| 15 to 19 Minutes | 24 | 15.3% |
| 20 to 24 Minutes | 59 | 37.6% |
| 25 to 29 Minutes | 7 | 4.5% |
| 30 to 34 Minutes | 0 | 0.0% |
| 35 to 39 Minutes | 20 | 12.7% |
| 40 to 44 Minutes | 0 | 0.0% |
| 45 to 59 Minutes | 7 | 4.5% |
| 60 to 89 Minutes | 10 | 6.4% |
| 90 or more Minutes | 0 | 0.0% |
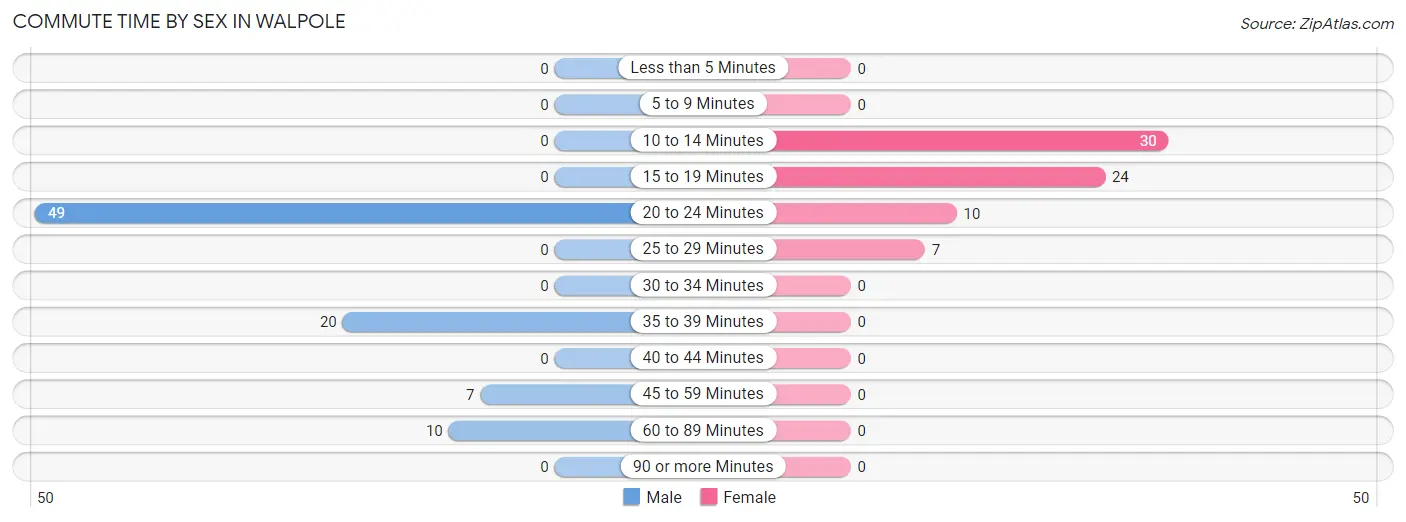
Commute Time by Sex in Walpole
The most common commute times in Walpole are 20 to 24 minutes (49 commuters, 57.0%) for males and 10 to 14 minutes (30 commuters, 42.2%) for females.
| Commute Time | Male | Female |
| Less than 5 Minutes | 0 (0.0%) | 0 (0.0%) |
| 5 to 9 Minutes | 0 (0.0%) | 0 (0.0%) |
| 10 to 14 Minutes | 0 (0.0%) | 30 (42.2%) |
| 15 to 19 Minutes | 0 (0.0%) | 24 (33.8%) |
| 20 to 24 Minutes | 49 (57.0%) | 10 (14.1%) |
| 25 to 29 Minutes | 0 (0.0%) | 7 (9.9%) |
| 30 to 34 Minutes | 0 (0.0%) | 0 (0.0%) |
| 35 to 39 Minutes | 20 (23.3%) | 0 (0.0%) |
| 40 to 44 Minutes | 0 (0.0%) | 0 (0.0%) |
| 45 to 59 Minutes | 7 (8.1%) | 0 (0.0%) |
| 60 to 89 Minutes | 10 (11.6%) | 0 (0.0%) |
| 90 or more Minutes | 0 (0.0%) | 0 (0.0%) |
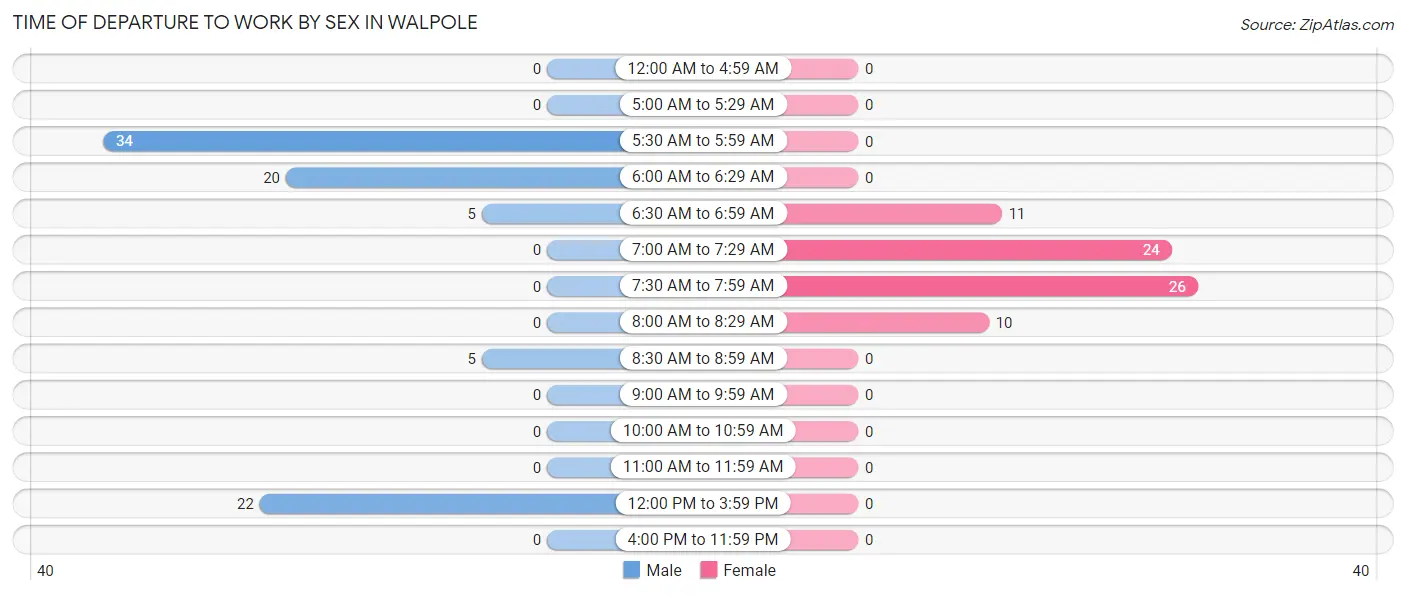
Time of Departure to Work by Sex in Walpole
The most frequent times of departure to work in Walpole are 5:30 AM to 5:59 AM (34, 39.5%) for males and 7:30 AM to 7:59 AM (26, 36.6%) for females.
| Time of Departure | Male | Female |
| 12:00 AM to 4:59 AM | 0 (0.0%) | 0 (0.0%) |
| 5:00 AM to 5:29 AM | 0 (0.0%) | 0 (0.0%) |
| 5:30 AM to 5:59 AM | 34 (39.5%) | 0 (0.0%) |
| 6:00 AM to 6:29 AM | 20 (23.3%) | 0 (0.0%) |
| 6:30 AM to 6:59 AM | 5 (5.8%) | 11 (15.5%) |
| 7:00 AM to 7:29 AM | 0 (0.0%) | 24 (33.8%) |
| 7:30 AM to 7:59 AM | 0 (0.0%) | 26 (36.6%) |
| 8:00 AM to 8:29 AM | 0 (0.0%) | 10 (14.1%) |
| 8:30 AM to 8:59 AM | 5 (5.8%) | 0 (0.0%) |
| 9:00 AM to 9:59 AM | 0 (0.0%) | 0 (0.0%) |
| 10:00 AM to 10:59 AM | 0 (0.0%) | 0 (0.0%) |
| 11:00 AM to 11:59 AM | 0 (0.0%) | 0 (0.0%) |
| 12:00 PM to 3:59 PM | 22 (25.6%) | 0 (0.0%) |
| 4:00 PM to 11:59 PM | 0 (0.0%) | 0 (0.0%) |
| Total | 86 (100.0%) | 71 (100.0%) |
Housing Occupancy in Walpole
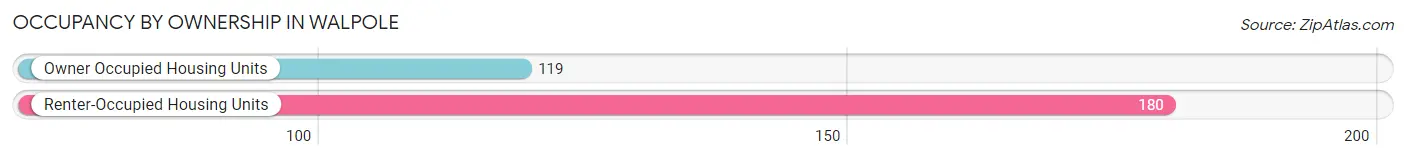
Occupancy by Ownership in Walpole
Of the total 299 dwellings in Walpole, owner-occupied units account for 119 (39.8%), while renter-occupied units make up 180 (60.2%).
| Occupancy | # Housing Units | % Housing Units |
| Owner Occupied Housing Units | 119 | 39.8% |
| Renter-Occupied Housing Units | 180 | 60.2% |
| Total Occupied Housing Units | 299 | 100.0% |
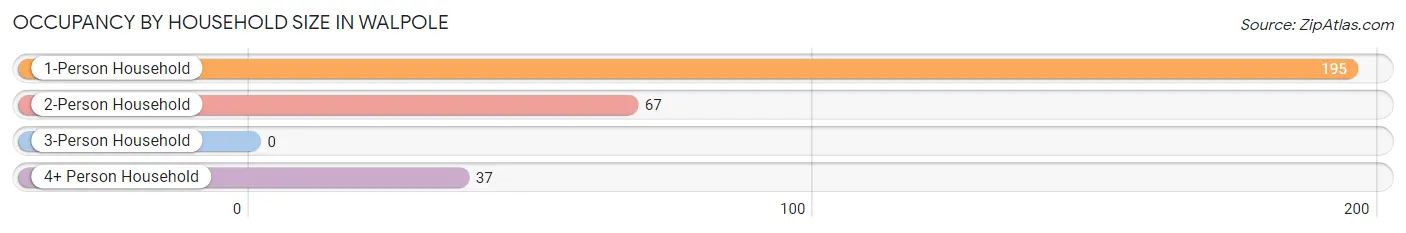
Occupancy by Household Size in Walpole
| Household Size | # Housing Units | % Housing Units |
| 1-Person Household | 195 | 65.2% |
| 2-Person Household | 67 | 22.4% |
| 3-Person Household | 0 | 0.0% |
| 4+ Person Household | 37 | 12.4% |
| Total Housing Units | 299 | 100.0% |
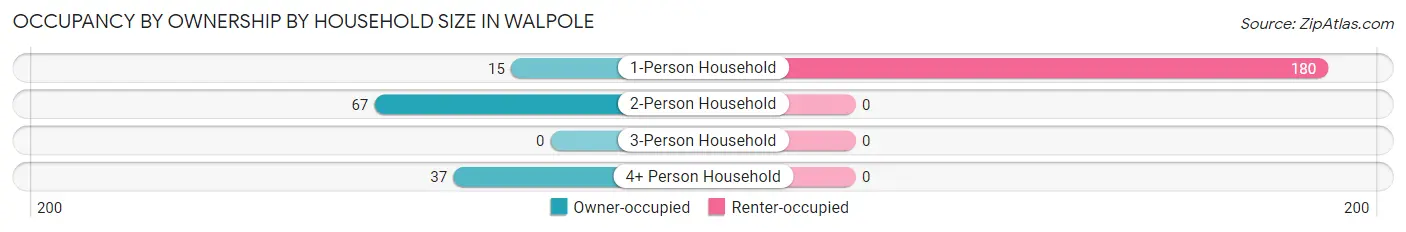
Occupancy by Ownership by Household Size in Walpole
| Household Size | Owner-occupied | Renter-occupied |
| 1-Person Household | 15 (7.7%) | 180 (92.3%) |
| 2-Person Household | 67 (100.0%) | 0 (0.0%) |
| 3-Person Household | 0 (0.0%) | 0 (0.0%) |
| 4+ Person Household | 37 (100.0%) | 0 (0.0%) |
| Total Housing Units | 119 (39.8%) | 180 (60.2%) |
Occupancy by Educational Attainment in Walpole
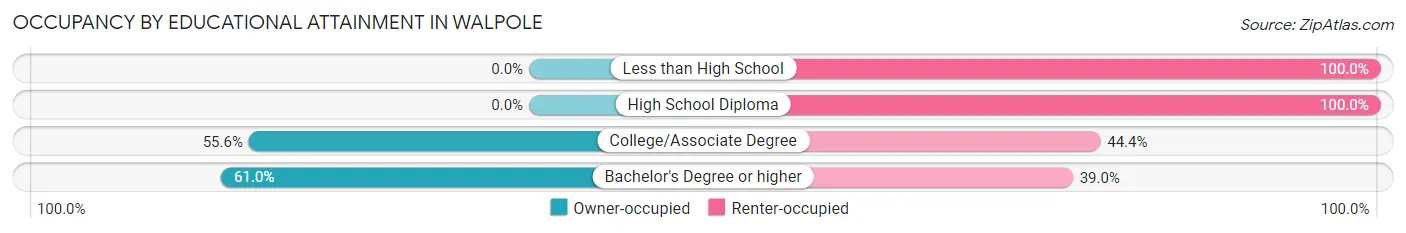
| Household Size | Owner-occupied | Renter-occupied |
| Less than High School | 0 (0.0%) | 79 (100.0%) |
| High School Diploma | 0 (0.0%) | 21 (100.0%) |
| College/Associate Degree | 25 (55.6%) | 20 (44.4%) |
| Bachelor's Degree or higher | 94 (61.0%) | 60 (39.0%) |
Occupancy by Age of Householder in Walpole
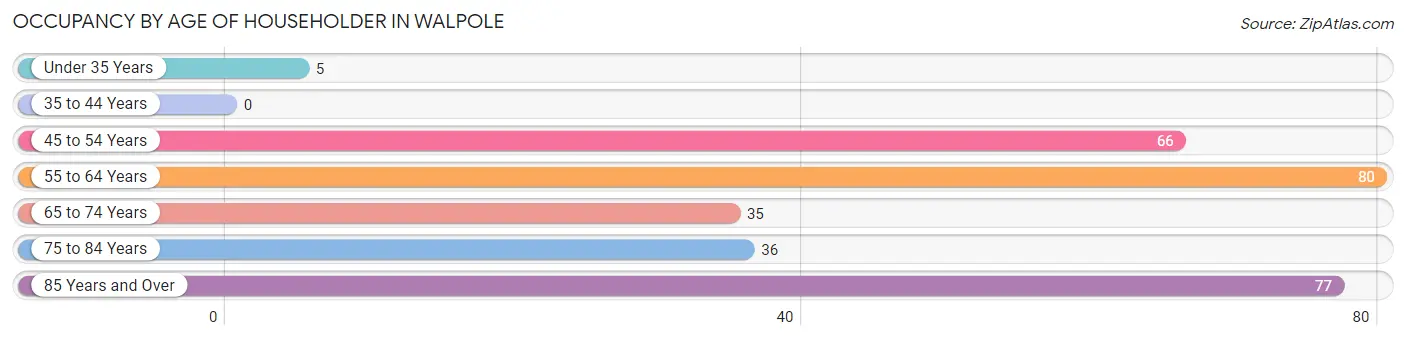
| Age Bracket | # Households | % Households |
| Under 35 Years | 5 | 1.7% |
| 35 to 44 Years | 0 | 0.0% |
| 45 to 54 Years | 66 | 22.1% |
| 55 to 64 Years | 80 | 26.8% |
| 65 to 74 Years | 35 | 11.7% |
| 75 to 84 Years | 36 | 12.0% |
| 85 Years and Over | 77 | 25.8% |
| Total | 299 | 100.0% |
Housing Finances in Walpole
Median Income by Occupancy in Walpole
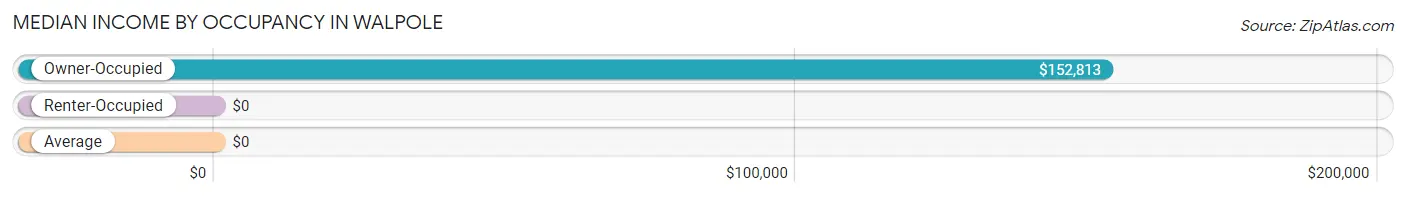
| Occupancy Type | # Households | Median Income |
| Owner-Occupied | 119 (39.8%) | $152,813 |
| Renter-Occupied | 180 (60.2%) | $0 |
| Average | 299 (100.0%) | $0 |
Occupancy by Householder Income Bracket in Walpole
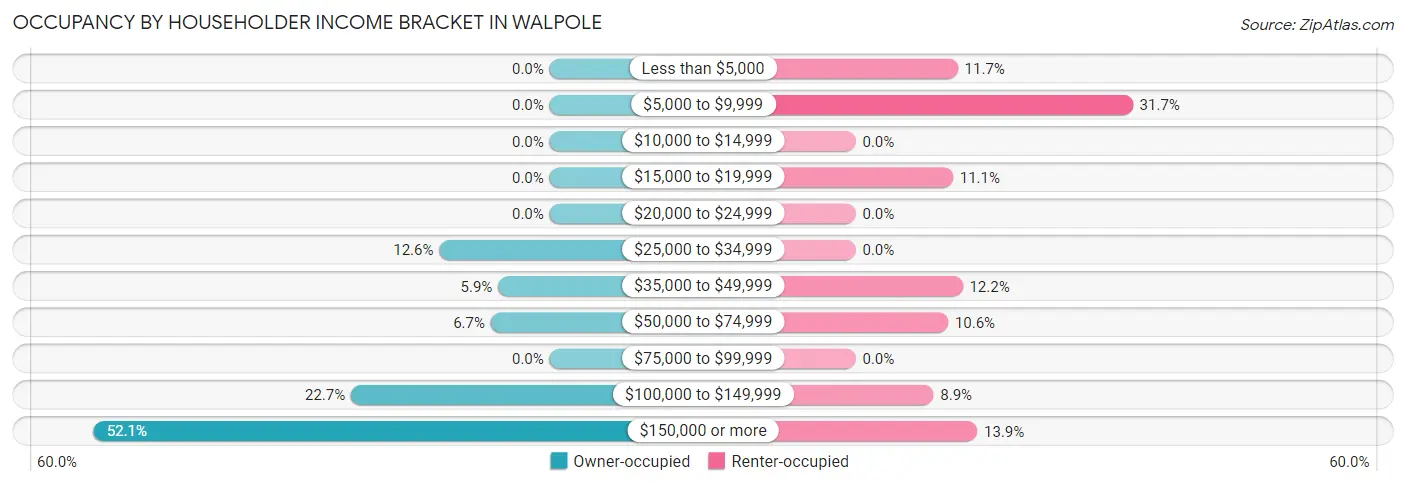
| Income Bracket | Owner-occupied | Renter-occupied |
| Less than $5,000 | 0 (0.0%) | 21 (11.7%) |
| $5,000 to $9,999 | 0 (0.0%) | 57 (31.7%) |
| $10,000 to $14,999 | 0 (0.0%) | 0 (0.0%) |
| $15,000 to $19,999 | 0 (0.0%) | 20 (11.1%) |
| $20,000 to $24,999 | 0 (0.0%) | 0 (0.0%) |
| $25,000 to $34,999 | 15 (12.6%) | 0 (0.0%) |
| $35,000 to $49,999 | 7 (5.9%) | 22 (12.2%) |
| $50,000 to $74,999 | 8 (6.7%) | 19 (10.6%) |
| $75,000 to $99,999 | 0 (0.0%) | 0 (0.0%) |
| $100,000 to $149,999 | 27 (22.7%) | 16 (8.9%) |
| $150,000 or more | 62 (52.1%) | 25 (13.9%) |
| Total | 119 (100.0%) | 180 (100.0%) |
Monthly Housing Cost Tiers in Walpole
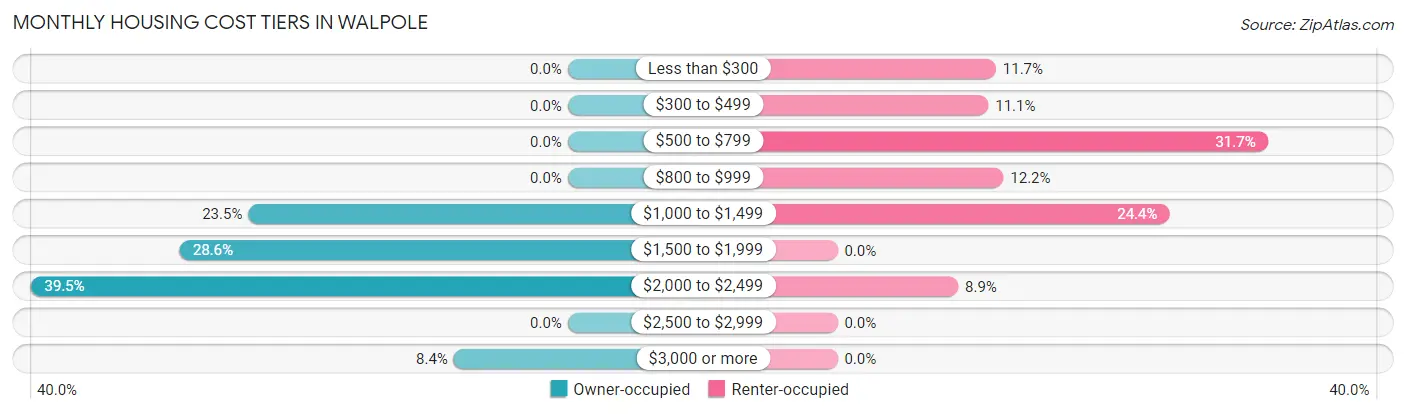
| Monthly Cost | Owner-occupied | Renter-occupied |
| Less than $300 | 0 (0.0%) | 21 (11.7%) |
| $300 to $499 | 0 (0.0%) | 20 (11.1%) |
| $500 to $799 | 0 (0.0%) | 57 (31.7%) |
| $800 to $999 | 0 (0.0%) | 22 (12.2%) |
| $1,000 to $1,499 | 28 (23.5%) | 44 (24.4%) |
| $1,500 to $1,999 | 34 (28.6%) | 0 (0.0%) |
| $2,000 to $2,499 | 47 (39.5%) | 16 (8.9%) |
| $2,500 to $2,999 | 0 (0.0%) | 0 (0.0%) |
| $3,000 or more | 10 (8.4%) | 0 (0.0%) |
| Total | 119 (100.0%) | 180 (100.0%) |
Physical Housing Characteristics in Walpole
Housing Structures in Walpole
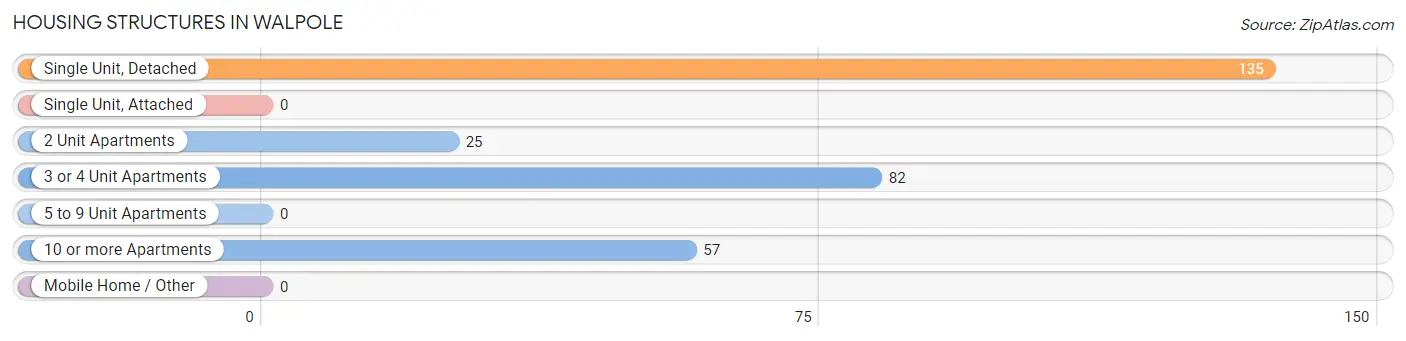
| Structure Type | # Housing Units | % Housing Units |
| Single Unit, Detached | 135 | 45.2% |
| Single Unit, Attached | 0 | 0.0% |
| 2 Unit Apartments | 25 | 8.4% |
| 3 or 4 Unit Apartments | 82 | 27.4% |
| 5 to 9 Unit Apartments | 0 | 0.0% |
| 10 or more Apartments | 57 | 19.1% |
| Mobile Home / Other | 0 | 0.0% |
| Total | 299 | 100.0% |
Housing Structures by Occupancy in Walpole
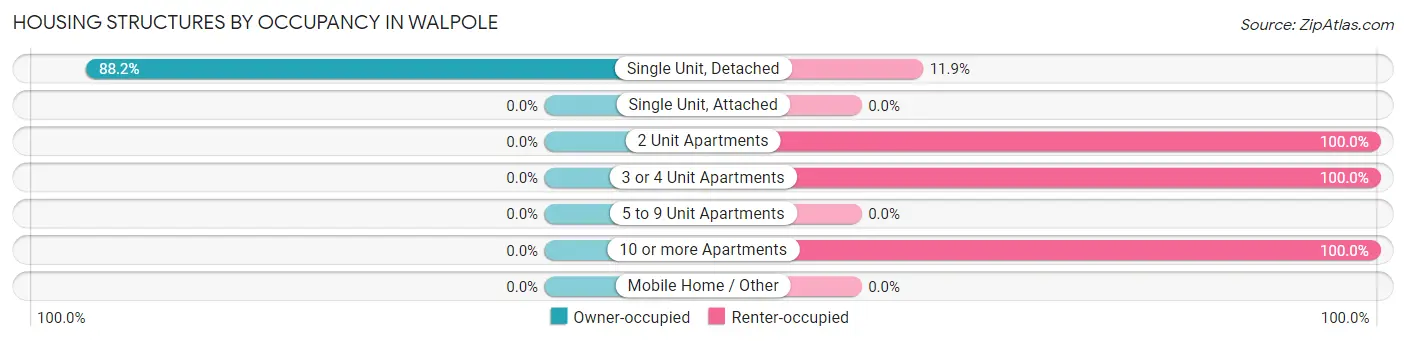
| Structure Type | Owner-occupied | Renter-occupied |
| Single Unit, Detached | 119 (88.1%) | 16 (11.8%) |
| Single Unit, Attached | 0 (0.0%) | 0 (0.0%) |
| 2 Unit Apartments | 0 (0.0%) | 25 (100.0%) |
| 3 or 4 Unit Apartments | 0 (0.0%) | 82 (100.0%) |
| 5 to 9 Unit Apartments | 0 (0.0%) | 0 (0.0%) |
| 10 or more Apartments | 0 (0.0%) | 57 (100.0%) |
| Mobile Home / Other | 0 (0.0%) | 0 (0.0%) |
| Total | 119 (39.8%) | 180 (60.2%) |
Housing Structures by Number of Rooms in Walpole
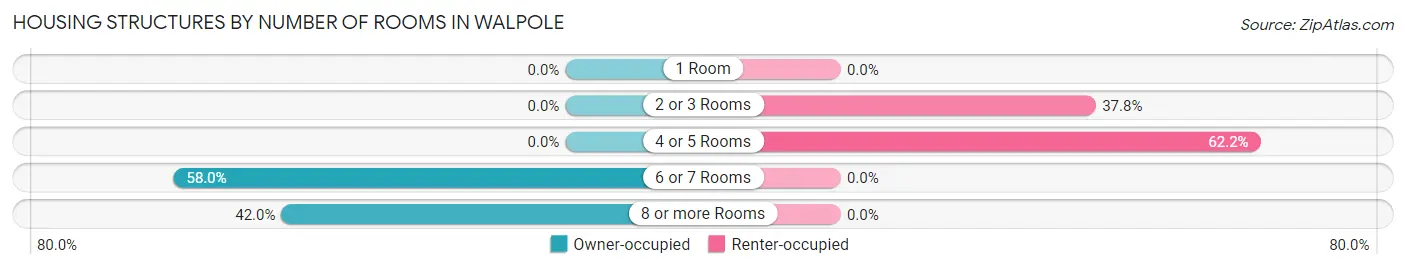
| Number of Rooms | Owner-occupied | Renter-occupied |
| 1 Room | 0 (0.0%) | 0 (0.0%) |
| 2 or 3 Rooms | 0 (0.0%) | 68 (37.8%) |
| 4 or 5 Rooms | 0 (0.0%) | 112 (62.2%) |
| 6 or 7 Rooms | 69 (58.0%) | 0 (0.0%) |
| 8 or more Rooms | 50 (42.0%) | 0 (0.0%) |
| Total | 119 (100.0%) | 180 (100.0%) |
Housing Structure by Heating Type in Walpole
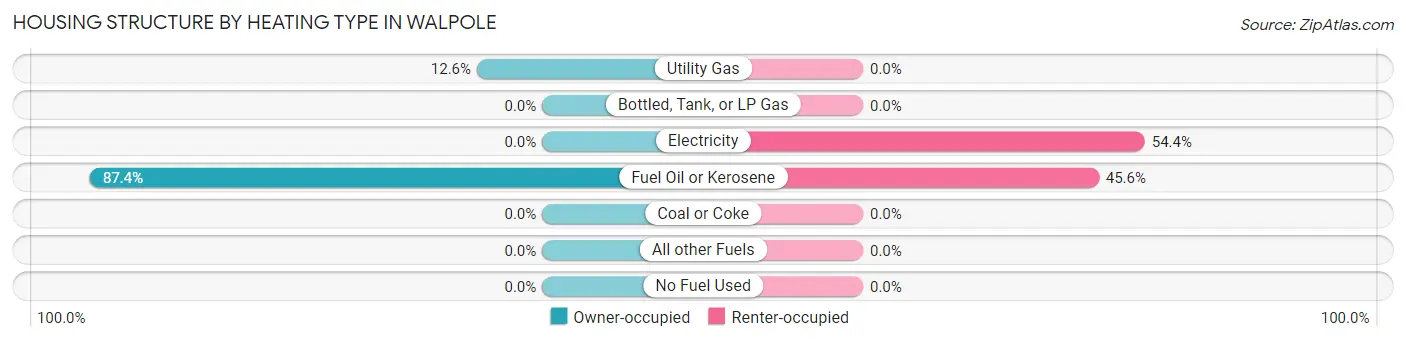
| Heating Type | Owner-occupied | Renter-occupied |
| Utility Gas | 15 (12.6%) | 0 (0.0%) |
| Bottled, Tank, or LP Gas | 0 (0.0%) | 0 (0.0%) |
| Electricity | 0 (0.0%) | 98 (54.4%) |
| Fuel Oil or Kerosene | 104 (87.4%) | 82 (45.6%) |
| Coal or Coke | 0 (0.0%) | 0 (0.0%) |
| All other Fuels | 0 (0.0%) | 0 (0.0%) |
| No Fuel Used | 0 (0.0%) | 0 (0.0%) |
| Total | 119 (100.0%) | 180 (100.0%) |
Household Vehicle Usage in Walpole
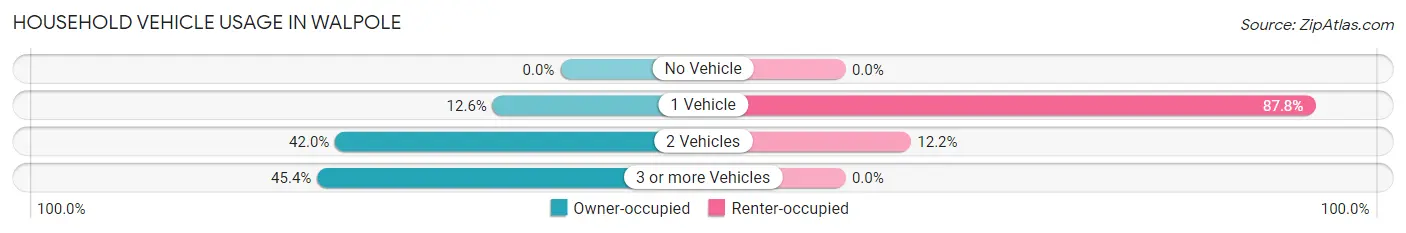
| Vehicles per Household | Owner-occupied | Renter-occupied |
| No Vehicle | 0 (0.0%) | 0 (0.0%) |
| 1 Vehicle | 15 (12.6%) | 158 (87.8%) |
| 2 Vehicles | 50 (42.0%) | 22 (12.2%) |
| 3 or more Vehicles | 54 (45.4%) | 0 (0.0%) |
| Total | 119 (100.0%) | 180 (100.0%) |
Real Estate & Mortgages in Walpole
Real Estate and Mortgage Overview in Walpole
| Characteristic | Without Mortgage | With Mortgage |
| Housing Units | 43 | 76 |
| Median Property Value | $467,500 | $312,500 |
| Median Household Income | - | - |
| Monthly Housing Costs | $1,277 | $10 |
| Real Estate Taxes | $9,188 | $0 |
Property Value by Mortgage Status in Walpole
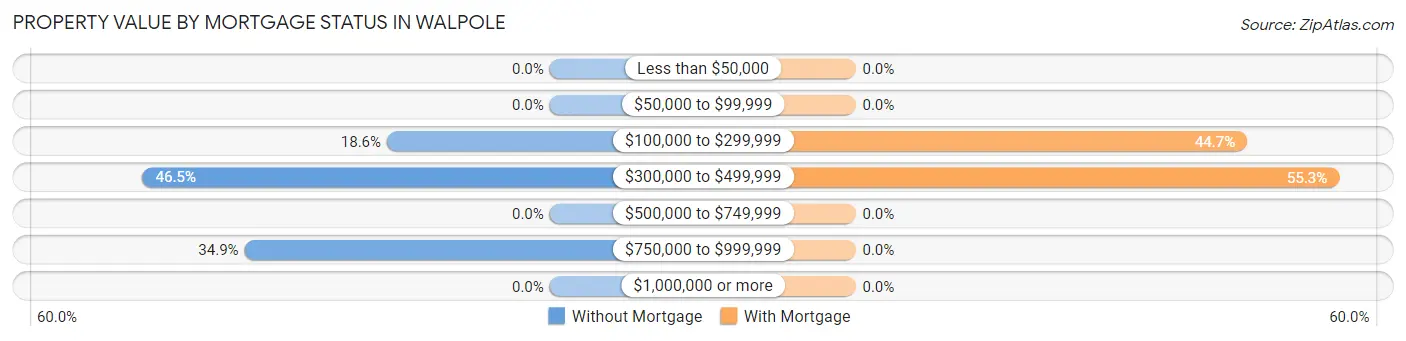
| Property Value | Without Mortgage | With Mortgage |
| Less than $50,000 | 0 (0.0%) | 0 (0.0%) |
| $50,000 to $99,999 | 0 (0.0%) | 0 (0.0%) |
| $100,000 to $299,999 | 8 (18.6%) | 34 (44.7%) |
| $300,000 to $499,999 | 20 (46.5%) | 42 (55.3%) |
| $500,000 to $749,999 | 0 (0.0%) | 0 (0.0%) |
| $750,000 to $999,999 | 15 (34.9%) | 0 (0.0%) |
| $1,000,000 or more | 0 (0.0%) | 0 (0.0%) |
| Total | 43 (100.0%) | 76 (100.0%) |
Household Income by Mortgage Status in Walpole
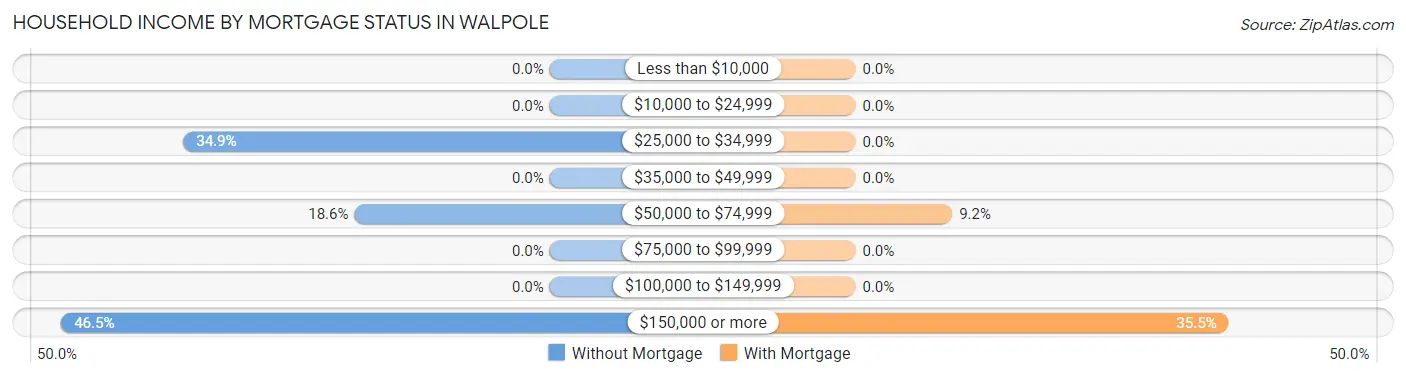
| Household Income | Without Mortgage | With Mortgage |
| Less than $10,000 | 0 (0.0%) | 0 (0.0%) |
| $10,000 to $24,999 | 0 (0.0%) | 0 (0.0%) |
| $25,000 to $34,999 | 15 (34.9%) | 0 (0.0%) |
| $35,000 to $49,999 | 0 (0.0%) | 0 (0.0%) |
| $50,000 to $74,999 | 8 (18.6%) | 7 (9.2%) |
| $75,000 to $99,999 | 0 (0.0%) | 0 (0.0%) |
| $100,000 to $149,999 | 0 (0.0%) | 0 (0.0%) |
| $150,000 or more | 20 (46.5%) | 27 (35.5%) |
| Total | 43 (100.0%) | 76 (100.0%) |
Property Value to Household Income Ratio in Walpole
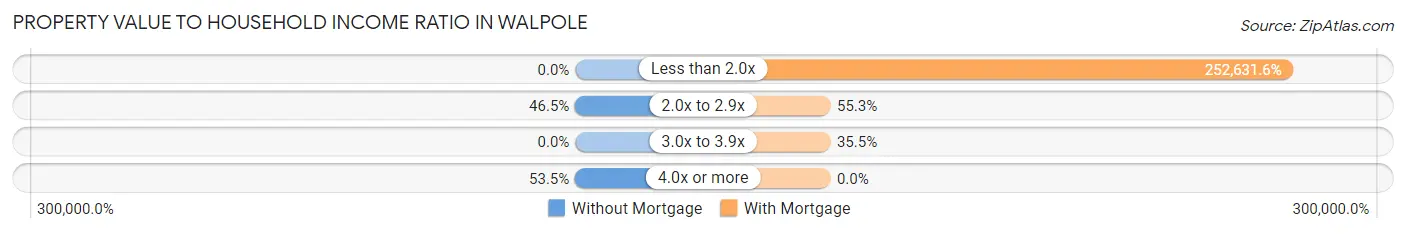
| Value-to-Income Ratio | Without Mortgage | With Mortgage |
| Less than 2.0x | 0 (0.0%) | 192,000 (252,631.6%) |
| 2.0x to 2.9x | 20 (46.5%) | 42 (55.3%) |
| 3.0x to 3.9x | 0 (0.0%) | 27 (35.5%) |
| 4.0x or more | 23 (53.5%) | 0 (0.0%) |
| Total | 43 (100.0%) | 76 (100.0%) |
Real Estate Taxes by Mortgage Status in Walpole
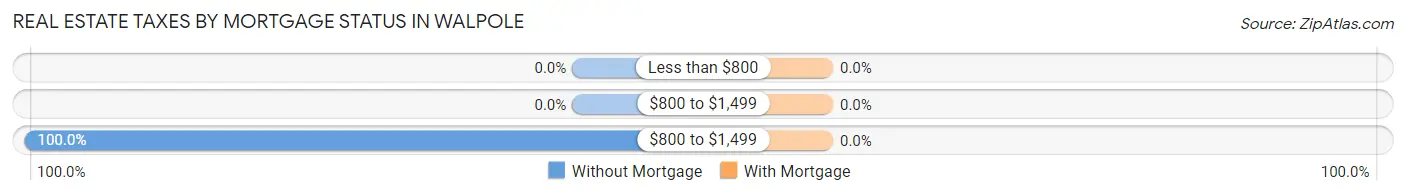
| Property Taxes | Without Mortgage | With Mortgage |
| Less than $800 | 0 (0.0%) | 0 (0.0%) |
| $800 to $1,499 | 0 (0.0%) | 0 (0.0%) |
| $800 to $1,499 | 43 (100.0%) | 0 (0.0%) |
| Total | 43 (100.0%) | 76 (100.0%) |
Health & Disability in Walpole
Health Insurance Coverage by Age in Walpole
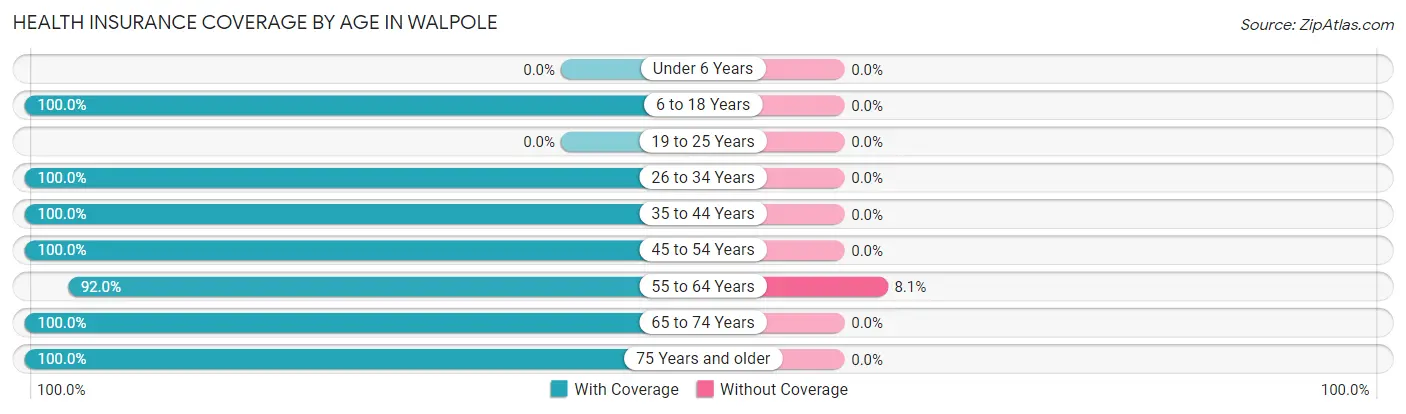
| Age Bracket | With Coverage | Without Coverage |
| Under 6 Years | 0 (0.0%) | 0 (0.0%) |
| 6 to 18 Years | 77 (100.0%) | 0 (0.0%) |
| 19 to 25 Years | 0 (0.0%) | 0 (0.0%) |
| 26 to 34 Years | 5 (100.0%) | 0 (0.0%) |
| 35 to 44 Years | 29 (100.0%) | 0 (0.0%) |
| 45 to 54 Years | 87 (100.0%) | 0 (0.0%) |
| 55 to 64 Years | 80 (91.9%) | 7 (8.1%) |
| 65 to 74 Years | 41 (100.0%) | 0 (0.0%) |
| 75 Years and older | 139 (100.0%) | 0 (0.0%) |
| Total | 458 (98.5%) | 7 (1.5%) |
Health Insurance Coverage by Citizenship Status in Walpole

| Citizenship Status | With Coverage | Without Coverage |
| Native Born | 0 (0.0%) | 0 (0.0%) |
| Foreign Born, Citizen | 77 (100.0%) | 0 (0.0%) |
| Foreign Born, not a Citizen | 0 (0.0%) | 0 (0.0%) |
Health Insurance Coverage by Household Income in Walpole
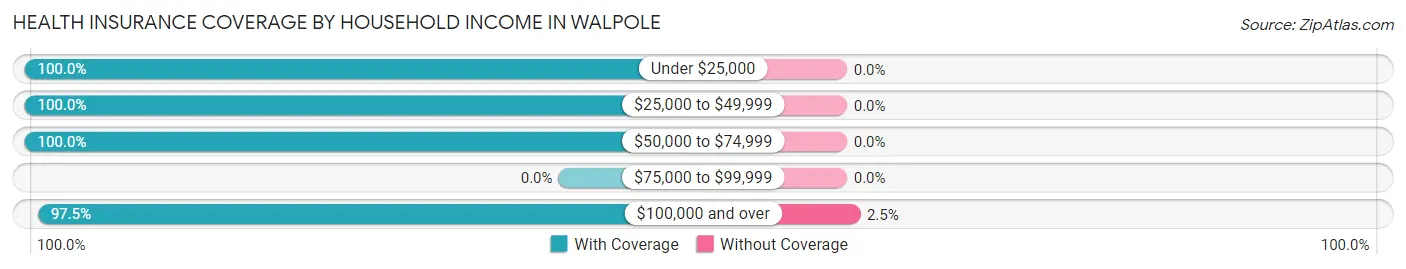
| Household Income | With Coverage | Without Coverage |
| Under $25,000 | 98 (100.0%) | 0 (0.0%) |
| $25,000 to $49,999 | 50 (100.0%) | 0 (0.0%) |
| $50,000 to $74,999 | 34 (100.0%) | 0 (0.0%) |
| $75,000 to $99,999 | 0 (0.0%) | 0 (0.0%) |
| $100,000 and over | 276 (97.5%) | 7 (2.5%) |
Public vs Private Health Insurance Coverage by Age in Walpole
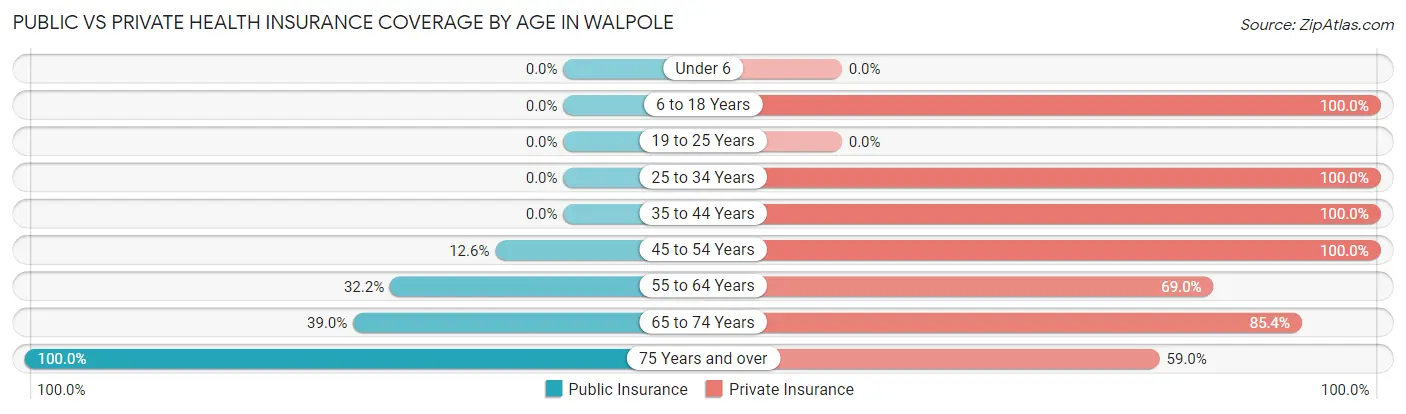
| Age Bracket | Public Insurance | Private Insurance |
| Under 6 | 0 (0.0%) | 0 (0.0%) |
| 6 to 18 Years | 0 (0.0%) | 77 (100.0%) |
| 19 to 25 Years | 0 (0.0%) | 0 (0.0%) |
| 25 to 34 Years | 0 (0.0%) | 5 (100.0%) |
| 35 to 44 Years | 0 (0.0%) | 29 (100.0%) |
| 45 to 54 Years | 11 (12.6%) | 87 (100.0%) |
| 55 to 64 Years | 28 (32.2%) | 60 (69.0%) |
| 65 to 74 Years | 16 (39.0%) | 35 (85.4%) |
| 75 Years and over | 139 (100.0%) | 82 (59.0%) |
| Total | 194 (41.7%) | 375 (80.6%) |
Disability Status by Sex by Age in Walpole
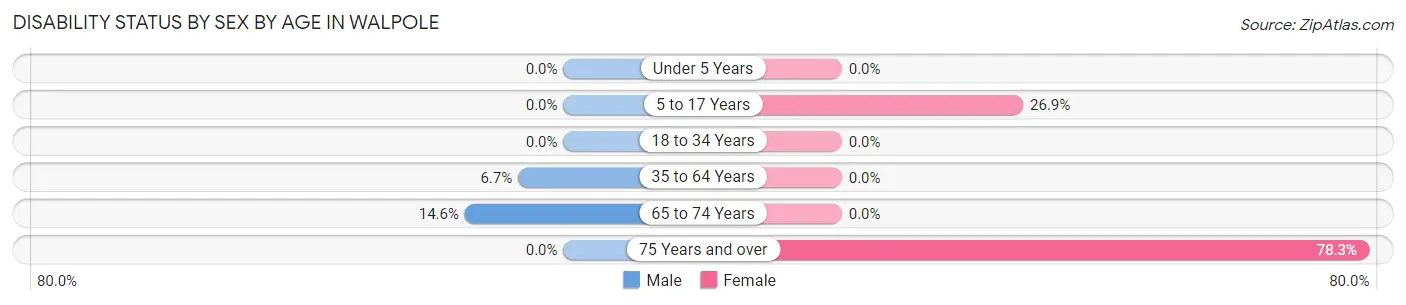
| Age Bracket | Male | Female |
| Under 5 Years | 0 (0.0%) | 0 (0.0%) |
| 5 to 17 Years | 0 (0.0%) | 7 (26.9%) |
| 18 to 34 Years | 0 (0.0%) | 0 (0.0%) |
| 35 to 64 Years | 7 (6.7%) | 0 (0.0%) |
| 65 to 74 Years | 6 (14.6%) | 0 (0.0%) |
| 75 Years and over | 0 (0.0%) | 72 (78.3%) |
Disability Class by Sex by Age in Walpole
Disability Class: Hearing Difficulty
| Age Bracket | Male | Female |
| Under 5 Years | 0 (0.0%) | 0 (0.0%) |
| 5 to 17 Years | 0 (0.0%) | 0 (0.0%) |
| 18 to 34 Years | 0 (0.0%) | 0 (0.0%) |
| 35 to 64 Years | 0 (0.0%) | 0 (0.0%) |
| 65 to 74 Years | 0 (0.0%) | 0 (0.0%) |
| 75 Years and over | 0 (0.0%) | 0 (0.0%) |
Disability Class: Vision Difficulty
| Age Bracket | Male | Female |
| Under 5 Years | 0 (0.0%) | 0 (0.0%) |
| 5 to 17 Years | 0 (0.0%) | 0 (0.0%) |
| 18 to 34 Years | 0 (0.0%) | 0 (0.0%) |
| 35 to 64 Years | 0 (0.0%) | 0 (0.0%) |
| 65 to 74 Years | 0 (0.0%) | 0 (0.0%) |
| 75 Years and over | 0 (0.0%) | 0 (0.0%) |
Disability Class: Cognitive Difficulty
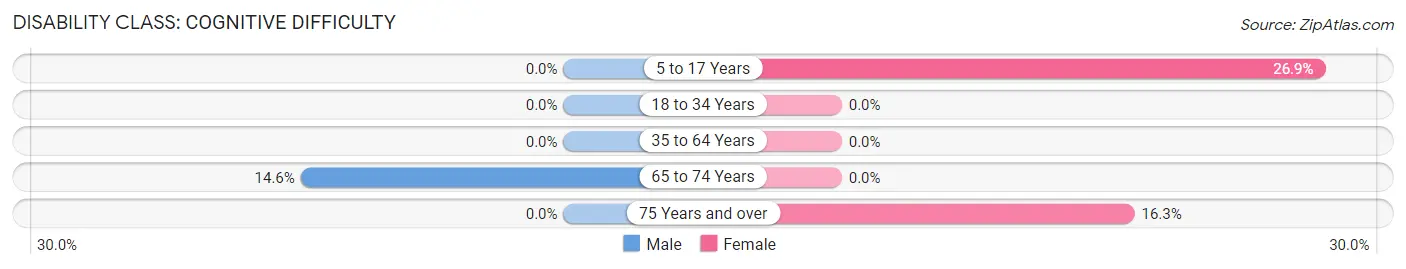
| Age Bracket | Male | Female |
| 5 to 17 Years | 0 (0.0%) | 7 (26.9%) |
| 18 to 34 Years | 0 (0.0%) | 0 (0.0%) |
| 35 to 64 Years | 0 (0.0%) | 0 (0.0%) |
| 65 to 74 Years | 6 (14.6%) | 0 (0.0%) |
| 75 Years and over | 0 (0.0%) | 15 (16.3%) |
Disability Class: Ambulatory Difficulty
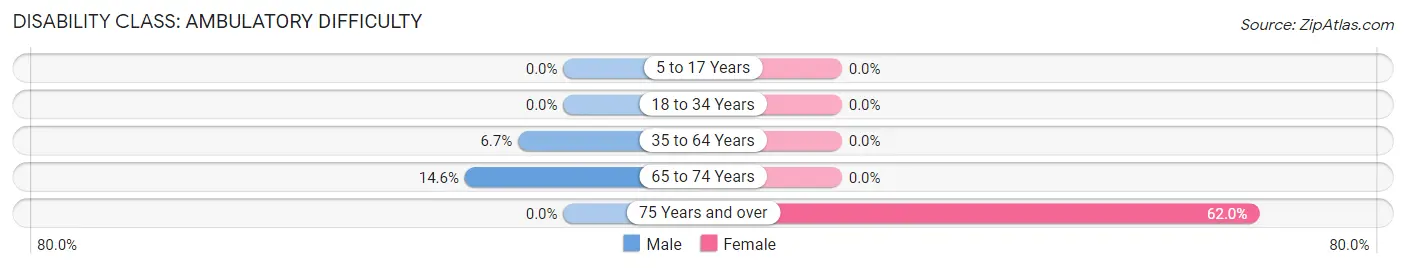
| Age Bracket | Male | Female |
| 5 to 17 Years | 0 (0.0%) | 0 (0.0%) |
| 18 to 34 Years | 0 (0.0%) | 0 (0.0%) |
| 35 to 64 Years | 7 (6.7%) | 0 (0.0%) |
| 65 to 74 Years | 6 (14.6%) | 0 (0.0%) |
| 75 Years and over | 0 (0.0%) | 57 (62.0%) |
Disability Class: Self-Care Difficulty
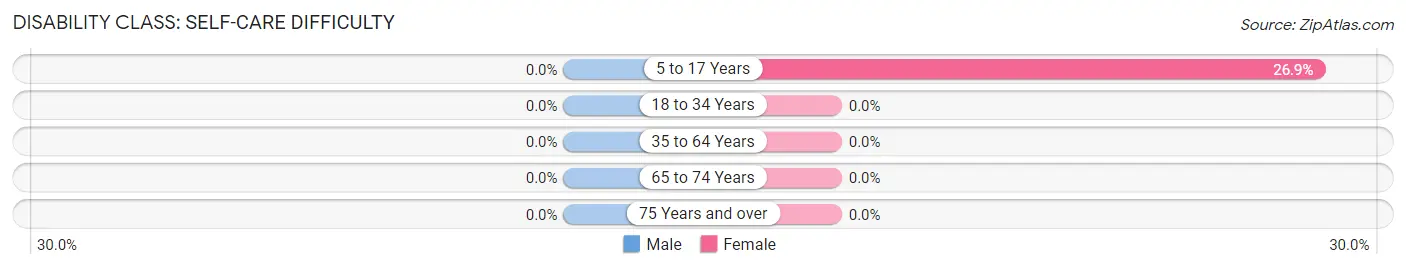
| Age Bracket | Male | Female |
| 5 to 17 Years | 0 (0.0%) | 7 (26.9%) |
| 18 to 34 Years | 0 (0.0%) | 0 (0.0%) |
| 35 to 64 Years | 0 (0.0%) | 0 (0.0%) |
| 65 to 74 Years | 0 (0.0%) | 0 (0.0%) |
| 75 Years and over | 0 (0.0%) | 0 (0.0%) |
Technology Access in Walpole
Computing Device Access in Walpole
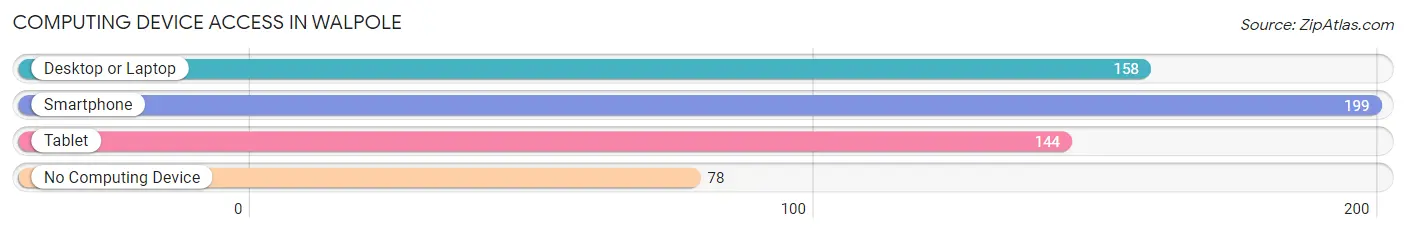
| Device Type | # Households | % Households |
| Desktop or Laptop | 158 | 52.8% |
| Smartphone | 199 | 66.6% |
| Tablet | 144 | 48.2% |
| No Computing Device | 78 | 26.1% |
| Total | 299 | 100.0% |
Internet Access in Walpole
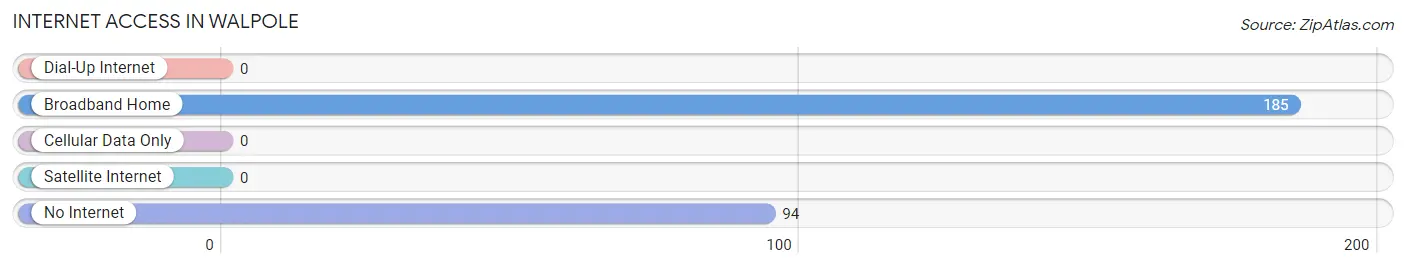
| Internet Type | # Households | % Households |
| Dial-Up Internet | 0 | 0.0% |
| Broadband Home | 185 | 61.9% |
| Cellular Data Only | 0 | 0.0% |
| Satellite Internet | 0 | 0.0% |
| No Internet | 94 | 31.4% |
| Total | 299 | 100.0% |
Walpole Summary
Walpole is a town located in Cheshire County, New Hampshire, United States. It is situated on the Connecticut River, which forms the border between New Hampshire and Vermont. As of the 2010 census, the town had a population of 3,737.
History
The area that is now Walpole was first settled in 1768 by a group of settlers from Massachusetts. The town was incorporated in 1781 and named after Sir Robert Walpole, the first Prime Minister of Great Britain.
In the 19th century, Walpole was an important center for the lumber industry. The town was home to several sawmills and gristmills, as well as a paper mill. The town also had a thriving shipbuilding industry, with several vessels being built in the local shipyards.
Geography
Walpole is located in southwestern New Hampshire, in the Connecticut River Valley. It is bordered by the towns of Alstead to the north, Westmoreland to the east, and Charlestown to the south. The town is situated on the Connecticut River, which forms the border between New Hampshire and Vermont.
The town has a total area of 24.2 square miles, of which 23.9 square miles is land and 0.3 square miles is water. The highest point in Walpole is the summit of Bald Hill, at 1,717 feet above sea level.
Economy
The economy of Walpole is largely based on tourism and agriculture. The town is home to several small farms, which produce a variety of crops, including apples, corn, and hay.
The town is also home to several small businesses, including a brewery, a winery, and a cider mill. There are also several restaurants and shops in the town.
Demographics
As of the 2010 census, there were 3,737 people, 1,541 households, and 1,039 families residing in the town. The population density was 156.2 people per square mile. There were 1,717 housing units, of which 1,541 were occupied.
The racial makeup of the town was 97.2% White, 0.5% African American, 0.3% Native American, 0.4% Asian, 0.1% Pacific Islander, 0.3% from other races, and 1.2% from two or more races. Hispanic or Latino of any race were 1.2% of the population.
The median age in the town was 44.7 years. About 22.3% of residents were under the age of 18, 6.2% were between the ages of 18 and 24, 22.7% were from 25 to 44, 33.2% were from 45 to 64, and 15.6% were 65 years of age or older. The gender makeup of the town was 48.3% male and 51.7% female.
The median income for a household in the town was $50,938, and the median income for a family was $62,917. The per capita income for the town was $27,845. About 5.2% of families and 8.2% of the population were below the poverty line, including 10.2% of those under age 18 and 5.2% of those age 65 or over.
Common Questions
What is Per Capita Income in Walpole?
Per Capita income in Walpole is $62,177.
What is the Median Family Income in Walpole?
Median Family Income in Walpole is $154,188.
What is Inequality or Gini Index in Walpole?
Inequality or Gini Index in Walpole is 0.52.
What is the Total Population of Walpole?
Total Population of Walpole is 465.
What is the Total Male Population of Walpole?
Total Male Population of Walpole is 248.
What is the Total Female Population of Walpole?
Total Female Population of Walpole is 217.
What is the Ratio of Males per 100 Females in Walpole?
There are 114.29 Males per 100 Females in Walpole.
What is the Ratio of Females per 100 Males in Walpole?
There are 87.50 Females per 100 Males in Walpole.
What is the Median Population Age in Walpole?
Median Population Age in Walpole is 61.2 Years.
What is the Average Family Size in Walpole
Average Family Size in Walpole is 2.6 People.
What is the Average Household Size in Walpole
Average Household Size in Walpole is 1.6 People.
How Large is the Labor Force in Walpole?
There are 189 People in the Labor Forcein in Walpole.
What is the Percentage of People in the Labor Force in Walpole?
44.2% of People are in the Labor Force in Walpole.