Bow Valley, NE Map & Demographics
Bow Valley Map
Bow Valley Overview
$57,664
PER CAPITA INCOME
$81,500
AVG FAMILY INCOME
$71,250
AVG HOUSEHOLD INCOME
53.2%
WAGE / INCOME GAP [ % ]
46.8¢/ $1
WAGE / INCOME GAP [ $ ]
0.57
INEQUALITY / GINI INDEX
86
TOTAL POPULATION
40
MALE POPULATION
46
FEMALE POPULATION
86.96
MALES / 100 FEMALES
115.00
FEMALES / 100 MALES
49.5
MEDIAN AGE
3.0
AVG FAMILY SIZE
2.0
AVG HOUSEHOLD SIZE
49
LABOR FORCE [ PEOPLE ]
65.3%
PERCENT IN LABOR FORCE
Income in Bow Valley
Income Overview in Bow Valley
Per Capita Income in Bow Valley is $57,664, while median incomes of families and households are $81,500 and $71,250 respectively.
| Characteristic | Number | Measure |
| Per Capita Income | 86 | $57,664 |
| Median Family Income | 22 | $81,500 |
| Mean Family Income | 22 | $84,118 |
| Median Household Income | 42 | $71,250 |
| Mean Household Income | 42 | $120,205 |
| Income Deficit | 22 | $0 |
| Wage / Income Gap (%) | 86 | 53.18% |
| Wage / Income Gap ($) | 86 | 46.82¢ per $1 |
| Gini / Inequality Index | 86 | 0.57 |
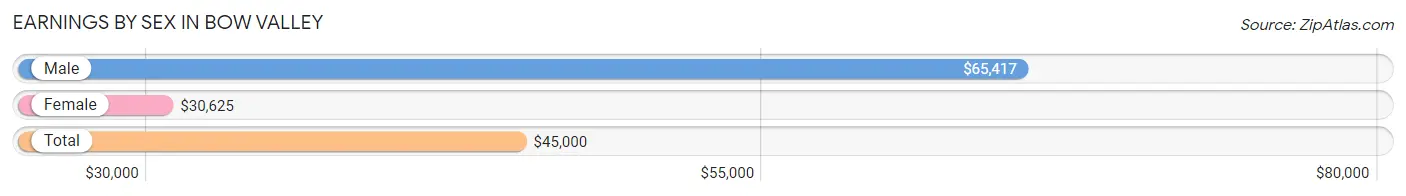
Earnings by Sex in Bow Valley
Average Earnings in Bow Valley are $45,000, $65,417 for men and $30,625 for women, a difference of 53.2%.
| Sex | Number | Average Earnings |
| Male | 27 (54.0%) | $65,417 |
| Female | 23 (46.0%) | $30,625 |
| Total | 50 (100.0%) | $45,000 |
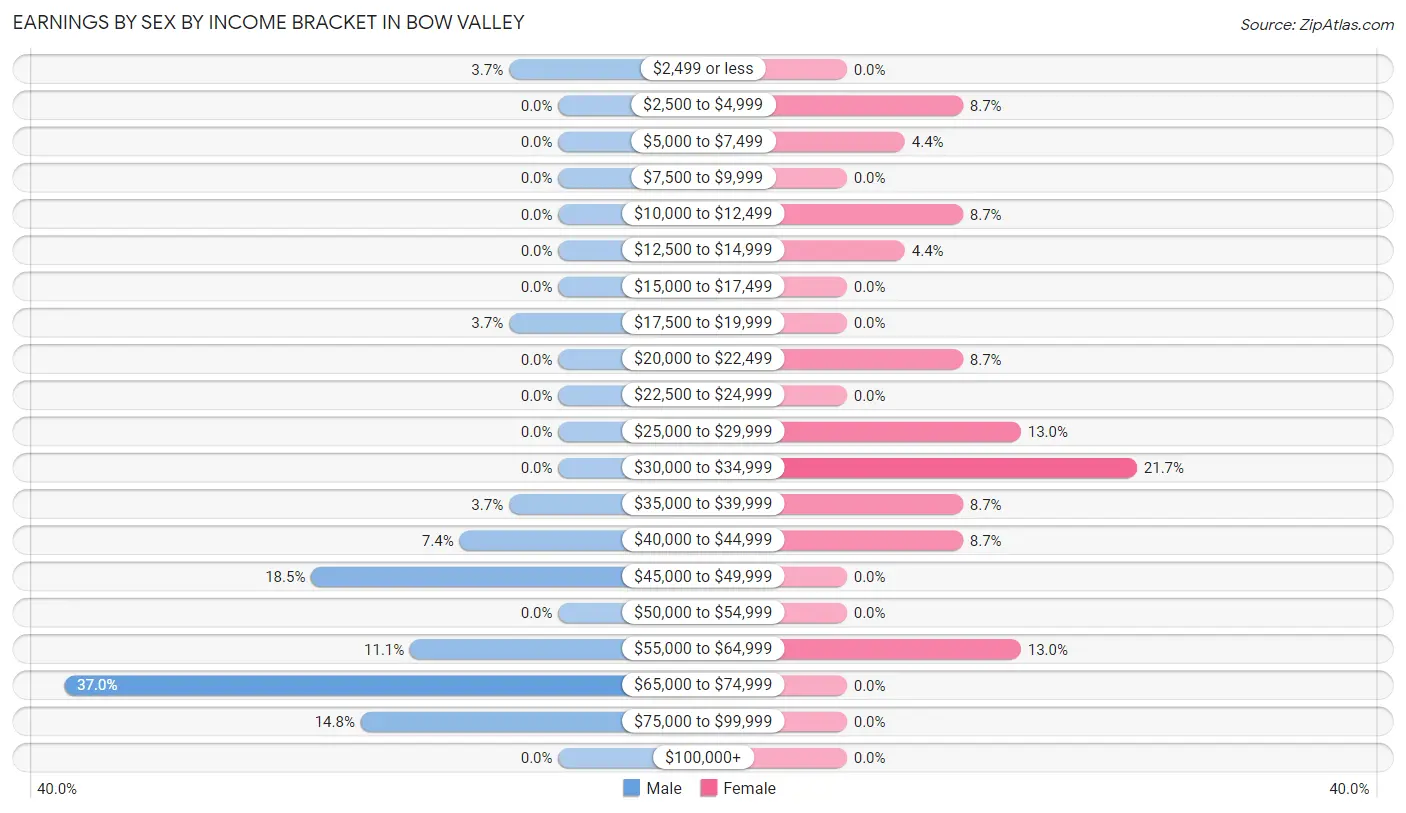
Earnings by Sex by Income Bracket in Bow Valley
The most common earnings brackets in Bow Valley are $65,000 to $74,999 for men (10 | 37.0%) and $30,000 to $34,999 for women (5 | 21.7%).
| Income | Male | Female |
| $2,499 or less | 1 (3.7%) | 0 (0.0%) |
| $2,500 to $4,999 | 0 (0.0%) | 2 (8.7%) |
| $5,000 to $7,499 | 0 (0.0%) | 1 (4.3%) |
| $7,500 to $9,999 | 0 (0.0%) | 0 (0.0%) |
| $10,000 to $12,499 | 0 (0.0%) | 2 (8.7%) |
| $12,500 to $14,999 | 0 (0.0%) | 1 (4.3%) |
| $15,000 to $17,499 | 0 (0.0%) | 0 (0.0%) |
| $17,500 to $19,999 | 1 (3.7%) | 0 (0.0%) |
| $20,000 to $22,499 | 0 (0.0%) | 2 (8.7%) |
| $22,500 to $24,999 | 0 (0.0%) | 0 (0.0%) |
| $25,000 to $29,999 | 0 (0.0%) | 3 (13.0%) |
| $30,000 to $34,999 | 0 (0.0%) | 5 (21.7%) |
| $35,000 to $39,999 | 1 (3.7%) | 2 (8.7%) |
| $40,000 to $44,999 | 2 (7.4%) | 2 (8.7%) |
| $45,000 to $49,999 | 5 (18.5%) | 0 (0.0%) |
| $50,000 to $54,999 | 0 (0.0%) | 0 (0.0%) |
| $55,000 to $64,999 | 3 (11.1%) | 3 (13.0%) |
| $65,000 to $74,999 | 10 (37.0%) | 0 (0.0%) |
| $75,000 to $99,999 | 4 (14.8%) | 0 (0.0%) |
| $100,000+ | 0 (0.0%) | 0 (0.0%) |
| Total | 27 (100.0%) | 23 (100.0%) |
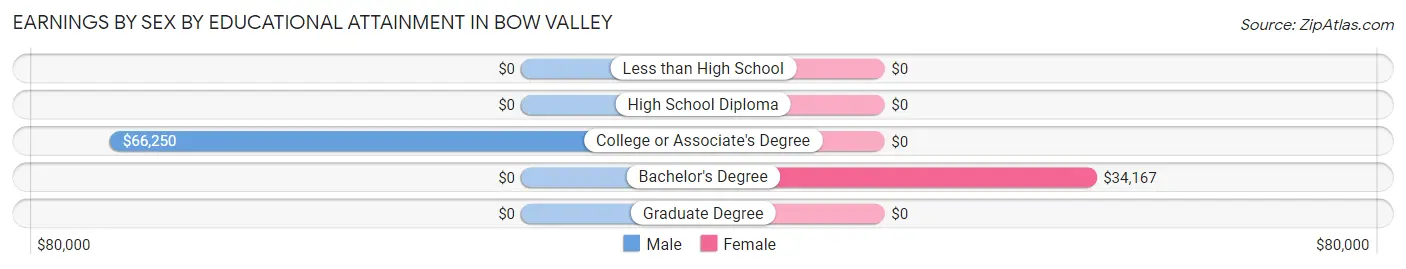
Earnings by Sex by Educational Attainment in Bow Valley
Average earnings in Bow Valley are $66,667 for men and $31,875 for women, a difference of 52.2%. Men with an educational attainment of college or associate's degree enjoy the highest average annual earnings of $66,250, while those with college or associate's degree education earn the least with $66,250. Women with an educational attainment of bachelor's degree earn the most with the average annual earnings of $34,167, while those with bachelor's degree education have the smallest earnings of $34,167.
| Educational Attainment | Male Income | Female Income |
| Less than High School | - | - |
| High School Diploma | - | - |
| College or Associate's Degree | $66,250 | $0 |
| Bachelor's Degree | - | - |
| Graduate Degree | - | - |
| Total | $66,667 | $31,875 |
Family Income in Bow Valley
Family Income Brackets in Bow Valley
According to the Bow Valley family income data, there are 8 families falling into the $75,000 to $99,999 income range, which is the most common income bracket and makes up 36.4% of all families.
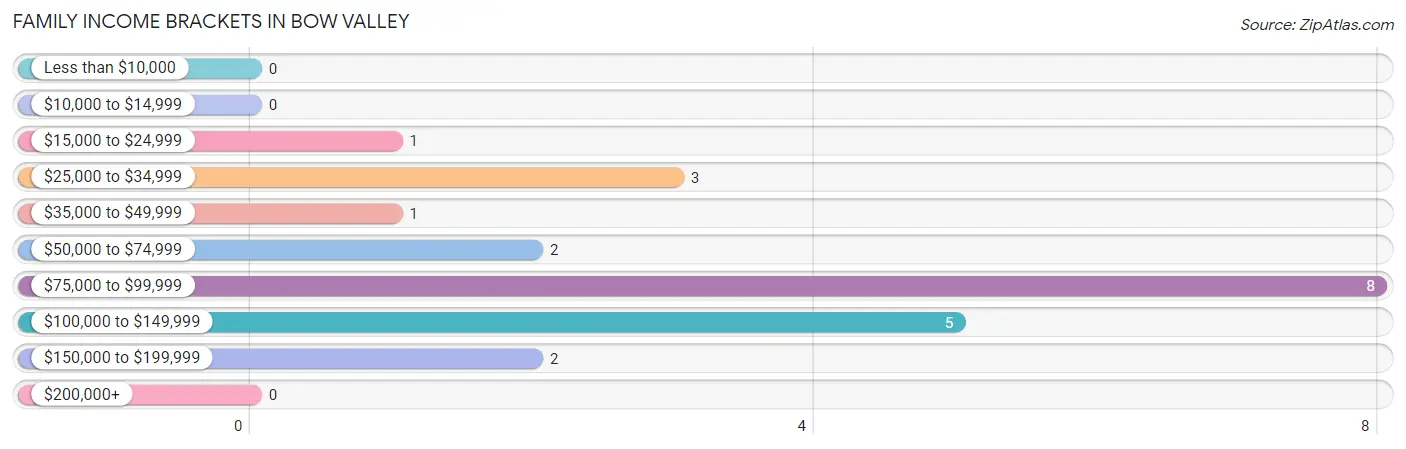
| Income Bracket | # Families | % Families |
| Less than $10,000 | 0 | 0.0% |
| $10,000 to $14,999 | 0 | 0.0% |
| $15,000 to $24,999 | 1 | 4.5% |
| $25,000 to $34,999 | 3 | 13.6% |
| $35,000 to $49,999 | 1 | 4.5% |
| $50,000 to $74,999 | 2 | 9.1% |
| $75,000 to $99,999 | 8 | 36.4% |
| $100,000 to $149,999 | 5 | 22.7% |
| $150,000 to $199,999 | 2 | 9.1% |
| $200,000+ | 0 | 0.0% |
Family Income by Famaliy Size in Bow Valley
2-person families (9 | 40.9%) account for the highest median family income in Bow Valley with $95,625 per family, while 2-person families (9 | 40.9%) have the highest median income of $47,812 per family member.
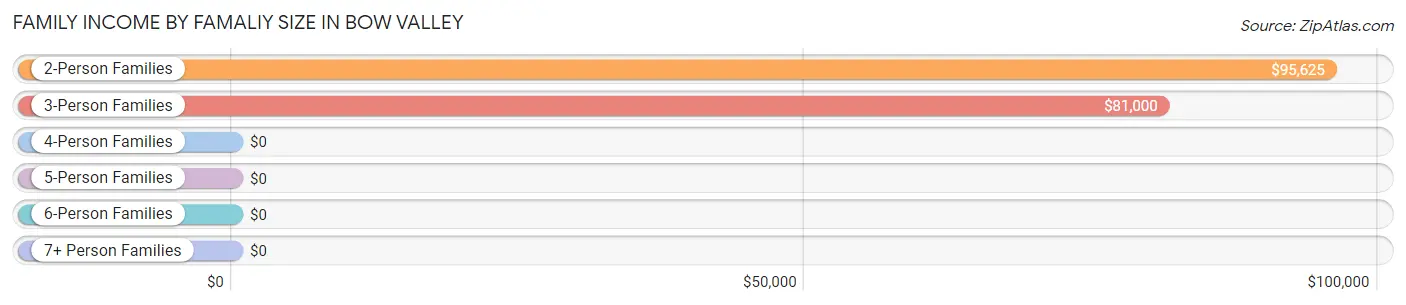
| Income Bracket | # Families | Median Income |
| 2-Person Families | 9 (40.9%) | $95,625 |
| 3-Person Families | 6 (27.3%) | $81,000 |
| 4-Person Families | 3 (13.6%) | $0 |
| 5-Person Families | 4 (18.2%) | $0 |
| 6-Person Families | 0 (0.0%) | $0 |
| 7+ Person Families | 0 (0.0%) | $0 |
| Total | 22 (100.0%) | $81,500 |
Family Income by Number of Earners in Bow Valley
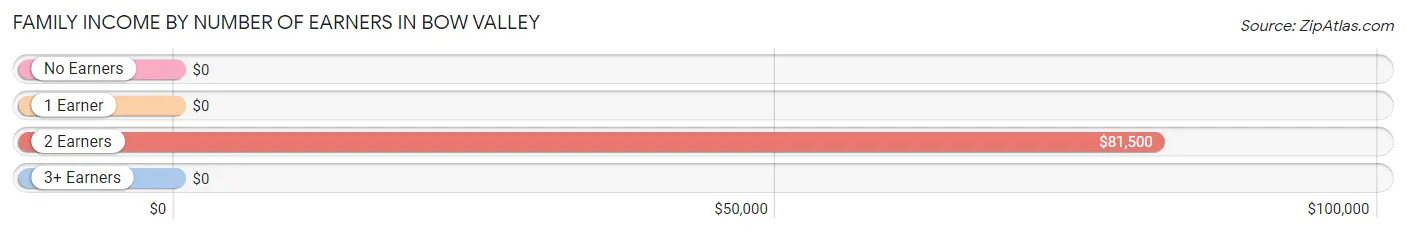
| Number of Earners | # Families | Median Income |
| No Earners | 3 (13.6%) | $0 |
| 1 Earner | 1 (4.5%) | $0 |
| 2 Earners | 14 (63.6%) | $81,500 |
| 3+ Earners | 4 (18.2%) | $0 |
| Total | 22 (100.0%) | $81,500 |
Household Income in Bow Valley
Household Income Brackets in Bow Valley
With 8 households falling in the category, the $50,000 to $74,999 income range is the most frequent in Bow Valley, accounting for 19.1% of all households.
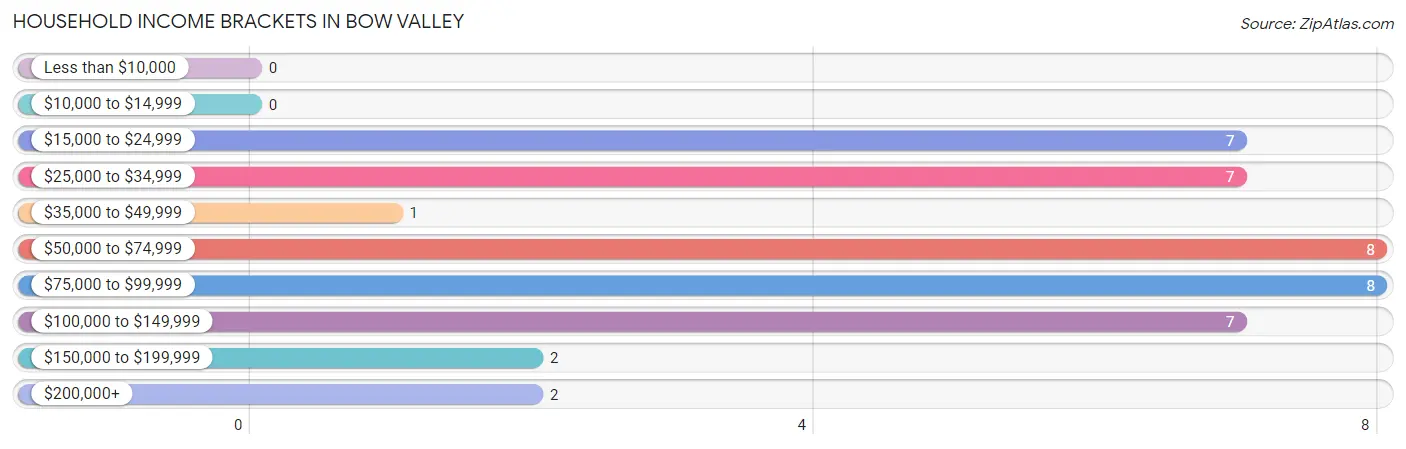
| Income Bracket | # Households | % Households |
| Less than $10,000 | 0 | 0.0% |
| $10,000 to $14,999 | 0 | 0.0% |
| $15,000 to $24,999 | 7 | 16.7% |
| $25,000 to $34,999 | 7 | 16.7% |
| $35,000 to $49,999 | 1 | 2.4% |
| $50,000 to $74,999 | 8 | 19.0% |
| $75,000 to $99,999 | 8 | 19.0% |
| $100,000 to $149,999 | 7 | 16.7% |
| $150,000 to $199,999 | 2 | 4.8% |
| $200,000+ | 2 | 4.8% |
Household Income by Householder Age in Bow Valley
The median household income in Bow Valley is $71,250, with the highest median household income of $96,250 found in the 45 to 64 years age bracket for the primary householder. A total of 16 households (38.1%) fall into this category.
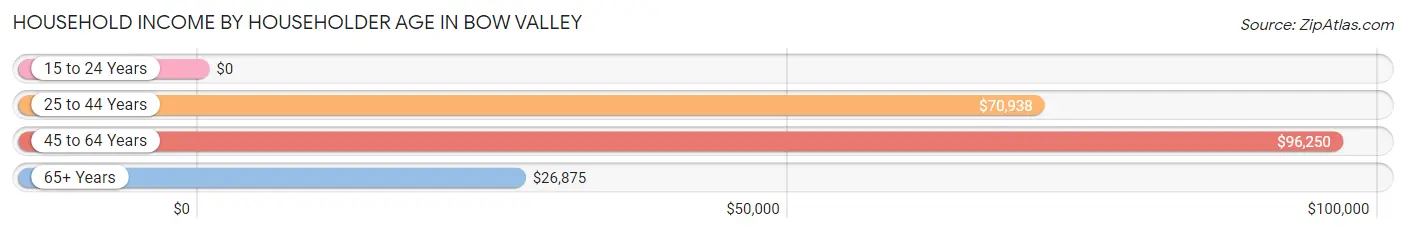
| Income Bracket | # Households | Median Income |
| 15 to 24 Years | 0 (0.0%) | $0 |
| 25 to 44 Years | 9 (21.4%) | $70,938 |
| 45 to 64 Years | 16 (38.1%) | $96,250 |
| 65+ Years | 17 (40.5%) | $26,875 |
| Total | 42 (100.0%) | $71,250 |
Poverty in Bow Valley
Income Below Poverty by Sex and Age in Bow Valley
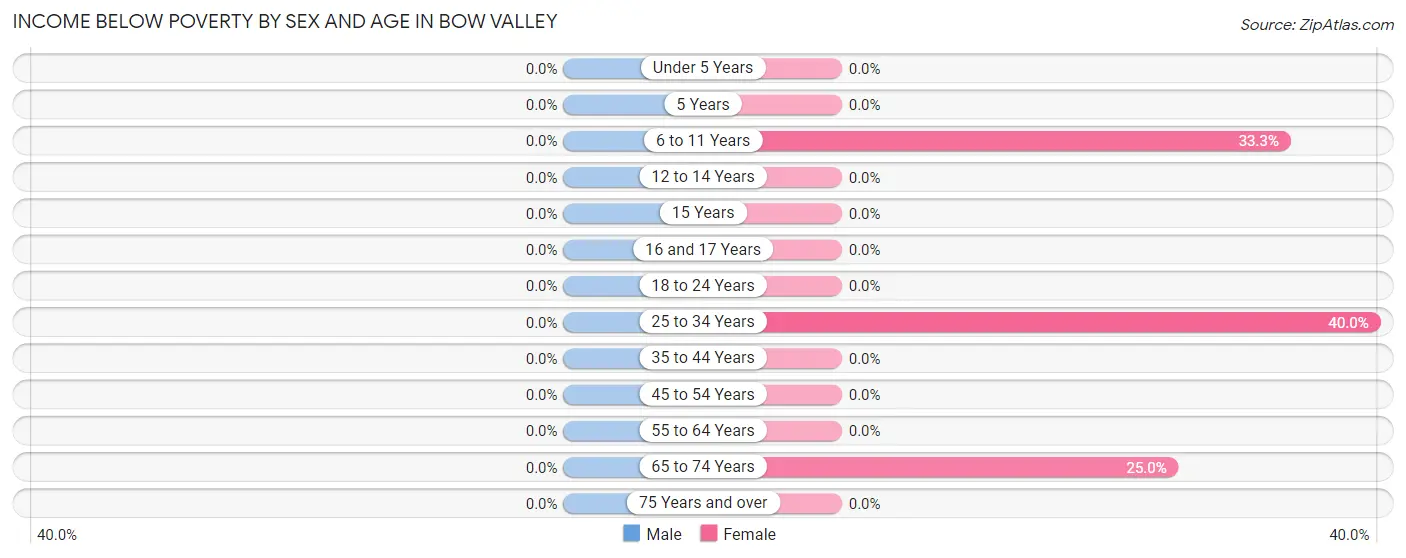
| Age Bracket | Male | Female |
| Under 5 Years | 0 (0.0%) | 0 (0.0%) |
| 5 Years | 0 (0.0%) | 0 (0.0%) |
| 6 to 11 Years | 0 (0.0%) | 1 (33.3%) |
| 12 to 14 Years | 0 (0.0%) | 0 (0.0%) |
| 15 Years | 0 (0.0%) | 0 (0.0%) |
| 16 and 17 Years | 0 (0.0%) | 0 (0.0%) |
| 18 to 24 Years | 0 (0.0%) | 0 (0.0%) |
| 25 to 34 Years | 0 (0.0%) | 2 (40.0%) |
| 35 to 44 Years | 0 (0.0%) | 0 (0.0%) |
| 45 to 54 Years | 0 (0.0%) | 0 (0.0%) |
| 55 to 64 Years | 0 (0.0%) | 0 (0.0%) |
| 65 to 74 Years | 0 (0.0%) | 1 (25.0%) |
| 75 Years and over | 0 (0.0%) | 0 (0.0%) |
| Total | 0 (0.0%) | 4 (8.7%) |
Income Above Poverty by Sex and Age in Bow Valley
According to the poverty statistics in Bow Valley, males aged 6 to 11 years and females aged under 5 years are the age groups that are most secure financially, with 100.0% of males and 100.0% of females in these age groups living above the poverty line.
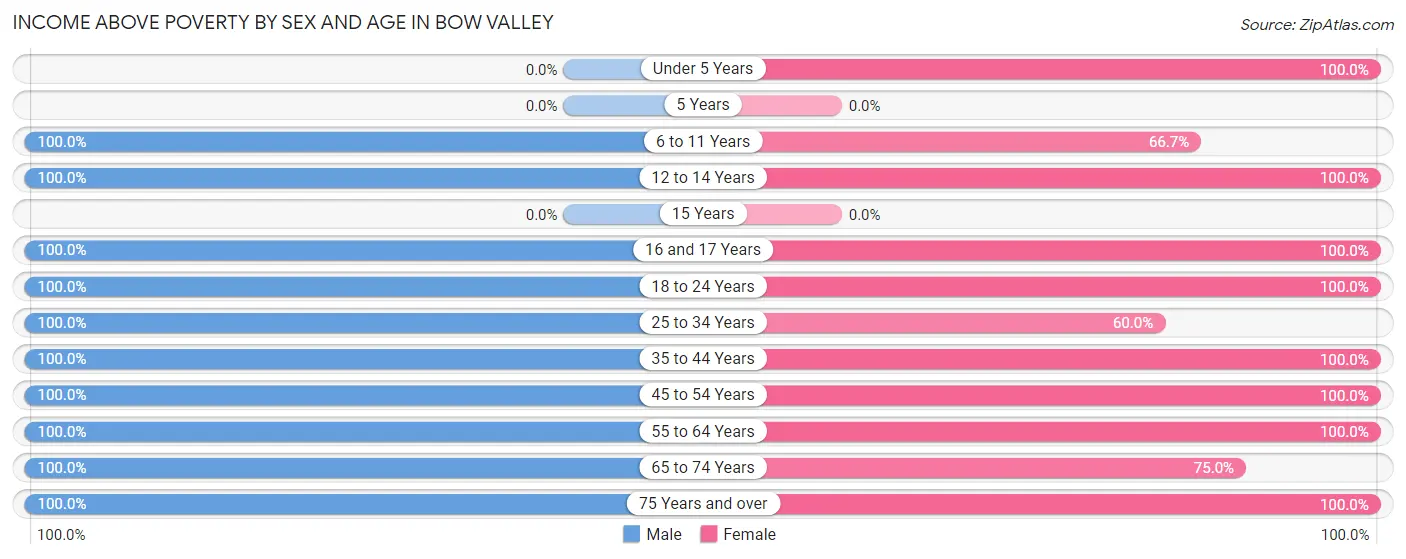
| Age Bracket | Male | Female |
| Under 5 Years | 0 (0.0%) | 3 (100.0%) |
| 5 Years | 0 (0.0%) | 0 (0.0%) |
| 6 to 11 Years | 2 (100.0%) | 2 (66.7%) |
| 12 to 14 Years | 1 (100.0%) | 2 (100.0%) |
| 15 Years | 0 (0.0%) | 0 (0.0%) |
| 16 and 17 Years | 3 (100.0%) | 3 (100.0%) |
| 18 to 24 Years | 2 (100.0%) | 2 (100.0%) |
| 25 to 34 Years | 6 (100.0%) | 3 (60.0%) |
| 35 to 44 Years | 2 (100.0%) | 1 (100.0%) |
| 45 to 54 Years | 8 (100.0%) | 8 (100.0%) |
| 55 to 64 Years | 8 (100.0%) | 7 (100.0%) |
| 65 to 74 Years | 6 (100.0%) | 3 (75.0%) |
| 75 Years and over | 2 (100.0%) | 8 (100.0%) |
| Total | 40 (100.0%) | 42 (91.3%) |
Income Below Poverty Among Married-Couple Families in Bow Valley
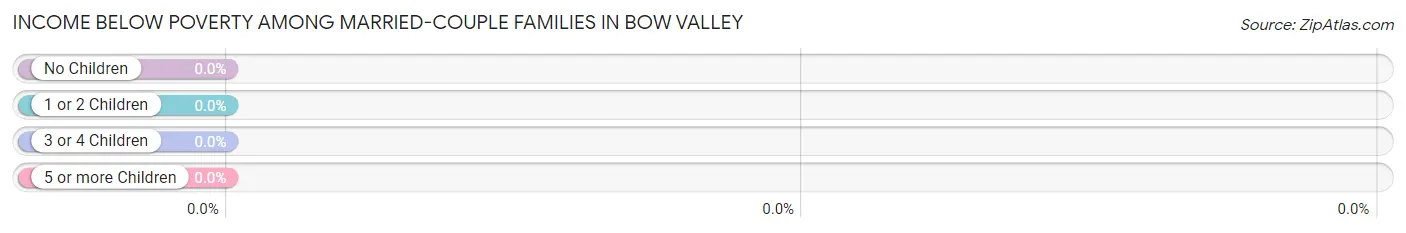
| Children | Above Poverty | Below Poverty |
| No Children | 12 (100.0%) | 0 (0.0%) |
| 1 or 2 Children | 9 (100.0%) | 0 (0.0%) |
| 3 or 4 Children | 0 (0.0%) | 0 (0.0%) |
| 5 or more Children | 0 (0.0%) | 0 (0.0%) |
| Total | 21 (100.0%) | 0 (0.0%) |
Income Below Poverty Among Single-Parent Households in Bow Valley
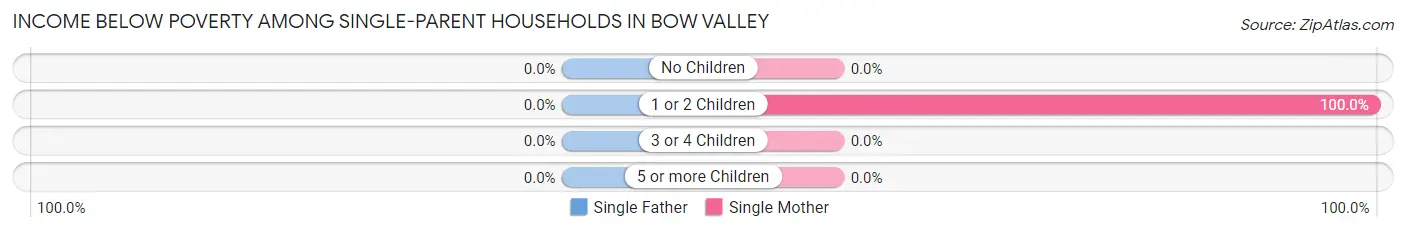
| Children | Single Father | Single Mother |
| No Children | 0 (0.0%) | 0 (0.0%) |
| 1 or 2 Children | 0 (0.0%) | 1 (100.0%) |
| 3 or 4 Children | 0 (0.0%) | 0 (0.0%) |
| 5 or more Children | 0 (0.0%) | 0 (0.0%) |
| Total | 0 (0.0%) | 1 (100.0%) |
Income Below Poverty Among Married-Couple vs Single-Parent Households in Bow Valley
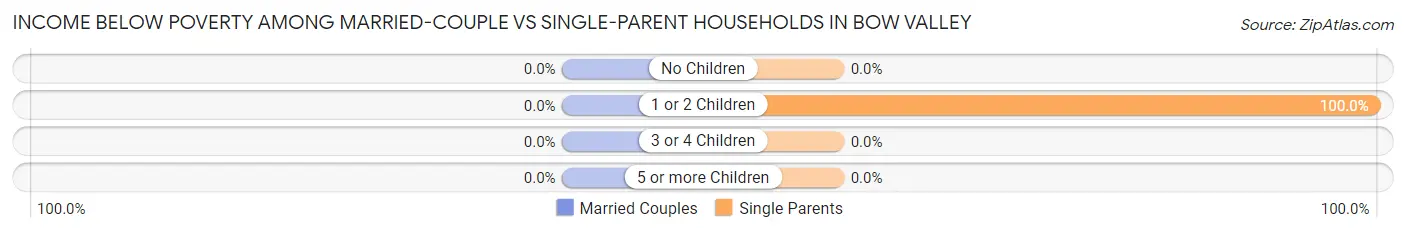
| Children | Married-Couple Families | Single-Parent Households |
| No Children | 0 (0.0%) | 0 (0.0%) |
| 1 or 2 Children | 0 (0.0%) | 1 (100.0%) |
| 3 or 4 Children | 0 (0.0%) | 0 (0.0%) |
| 5 or more Children | 0 (0.0%) | 0 (0.0%) |
| Total | 0 (0.0%) | 1 (100.0%) |
Race in Bow Valley
The most populous races in Bow Valley are , and White / Caucasian (86 | 100.0%).
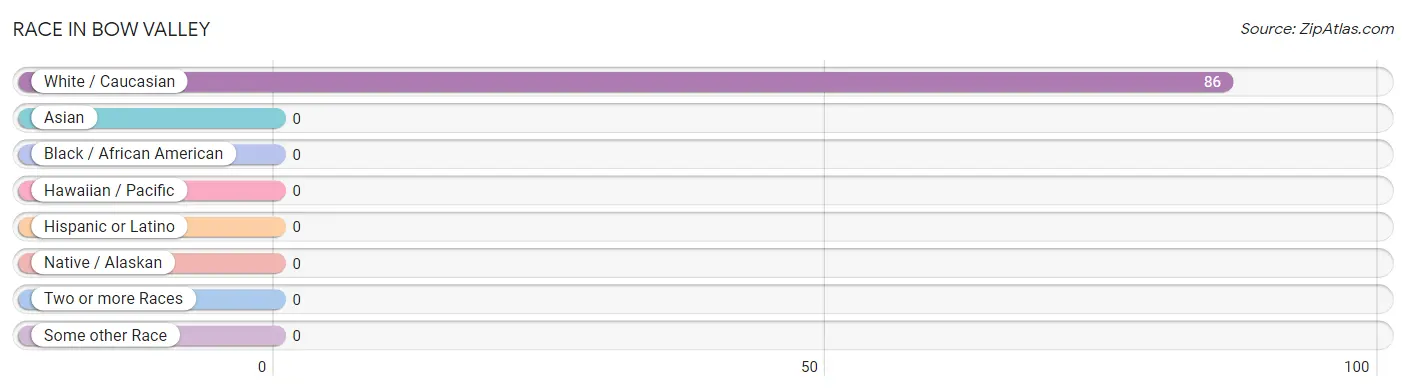
| Race | # Population | % Population |
| Asian | 0 | 0.0% |
| Black / African American | 0 | 0.0% |
| Hawaiian / Pacific | 0 | 0.0% |
| Hispanic or Latino | 0 | 0.0% |
| Native / Alaskan | 0 | 0.0% |
| White / Caucasian | 86 | 100.0% |
| Two or more Races | 0 | 0.0% |
| Some other Race | 0 | 0.0% |
| Total | 86 | 100.0% |
Ancestry in Bow Valley
The most populous ancestries reported in Bow Valley are German (55 | 63.9%), Czech (8 | 9.3%), and Norwegian (3 | 3.5%), together accounting for 76.7% of all Bow Valley residents.
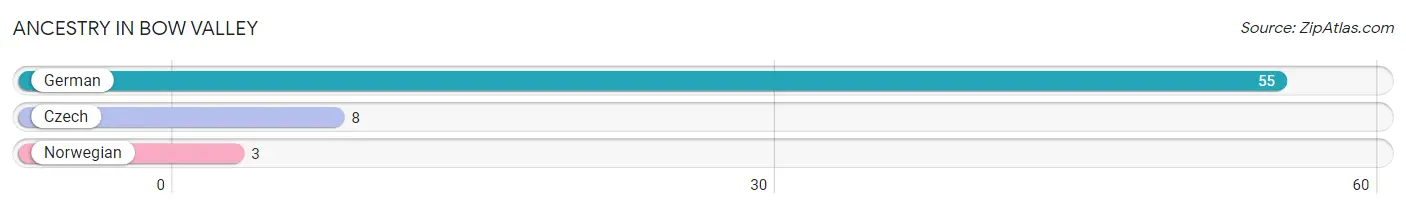
| Ancestry | # Population | % Population |
| Czech | 8 | 9.3% |
| German | 55 | 63.9% |
| Norwegian | 3 | 3.5% | View All 3 Rows |
Immigrants in Bow Valley

| Immigration Origin | # Population | % Population | View All 0 Rows |
Sex and Age in Bow Valley
Sex and Age in Bow Valley
The most populous age groups in Bow Valley are 45 to 49 Years (5 | 12.5%) for men and 85 Years and over (6 | 13.0%) for women.
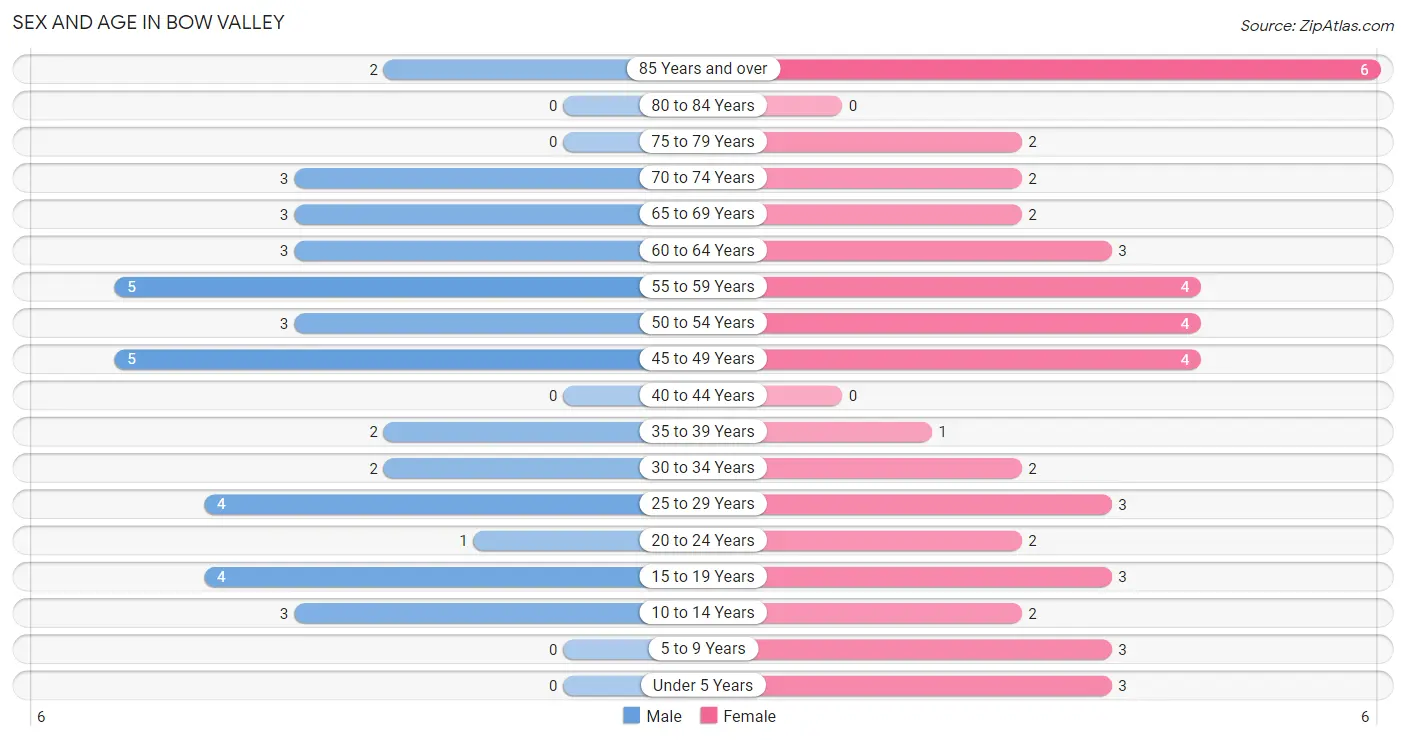
| Age Bracket | Male | Female |
| Under 5 Years | 0 (0.0%) | 3 (6.5%) |
| 5 to 9 Years | 0 (0.0%) | 3 (6.5%) |
| 10 to 14 Years | 3 (7.5%) | 2 (4.3%) |
| 15 to 19 Years | 4 (10.0%) | 3 (6.5%) |
| 20 to 24 Years | 1 (2.5%) | 2 (4.3%) |
| 25 to 29 Years | 4 (10.0%) | 3 (6.5%) |
| 30 to 34 Years | 2 (5.0%) | 2 (4.3%) |
| 35 to 39 Years | 2 (5.0%) | 1 (2.2%) |
| 40 to 44 Years | 0 (0.0%) | 0 (0.0%) |
| 45 to 49 Years | 5 (12.5%) | 4 (8.7%) |
| 50 to 54 Years | 3 (7.5%) | 4 (8.7%) |
| 55 to 59 Years | 5 (12.5%) | 4 (8.7%) |
| 60 to 64 Years | 3 (7.5%) | 3 (6.5%) |
| 65 to 69 Years | 3 (7.5%) | 2 (4.3%) |
| 70 to 74 Years | 3 (7.5%) | 2 (4.3%) |
| 75 to 79 Years | 0 (0.0%) | 2 (4.3%) |
| 80 to 84 Years | 0 (0.0%) | 0 (0.0%) |
| 85 Years and over | 2 (5.0%) | 6 (13.0%) |
| Total | 40 (100.0%) | 46 (100.0%) |
Families and Households in Bow Valley
Median Family Size in Bow Valley
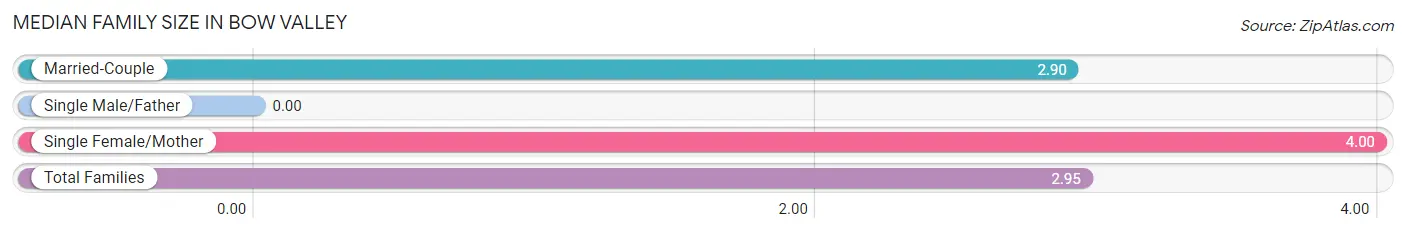
| Family Type | # Families | Family Size |
| Married-Couple | 21 (95.5%) | 2.90 |
| Single Male/Father | 0 (0.0%) | - |
| Single Female/Mother | 1 (4.5%) | 4.00 |
| Total Families | 22 (100.0%) | 2.95 |
Median Household Size in Bow Valley
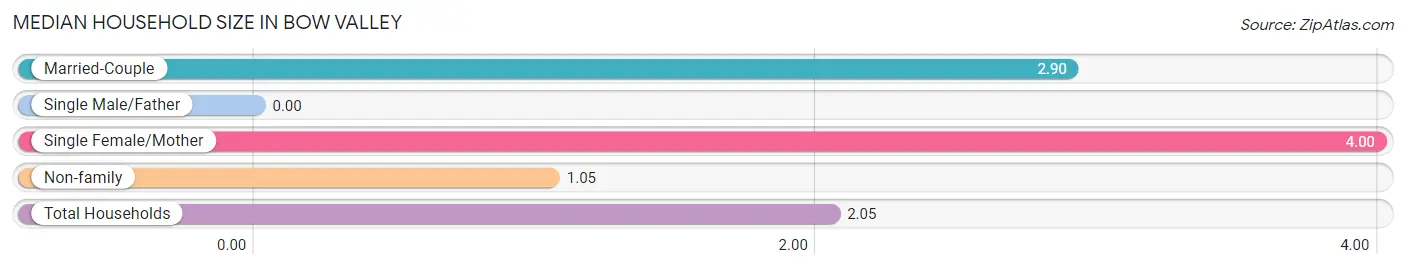
| Household Type | # Households | Household Size |
| Married-Couple | 21 (50.0%) | 2.90 |
| Single Male/Father | 0 (0.0%) | - |
| Single Female/Mother | 1 (2.4%) | 4.00 |
| Non-family | 20 (47.6%) | 1.05 |
| Total Households | 42 (100.0%) | 2.05 |
Household Size by Marriage Status in Bow Valley
Out of a total of 42 households in Bow Valley, 22 (52.4%) are family households, while 20 (47.6%) are nonfamily households. The most numerous type of family households are 2-person households, comprising 9, and the most common type of nonfamily households are 1-person households, comprising 18.
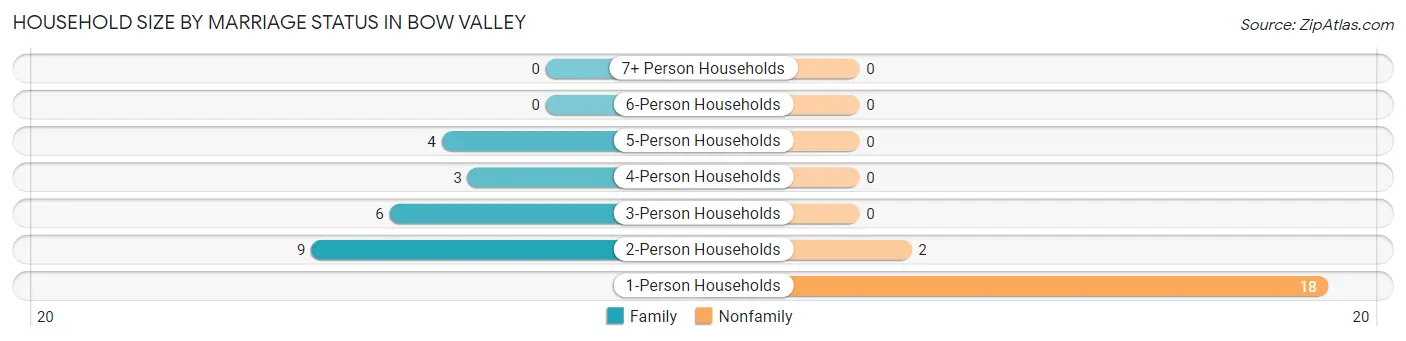
| Household Size | Family Households | Nonfamily Households |
| 1-Person Households | - | 18 (42.9%) |
| 2-Person Households | 9 (21.4%) | 2 (4.8%) |
| 3-Person Households | 6 (14.3%) | 0 (0.0%) |
| 4-Person Households | 3 (7.1%) | 0 (0.0%) |
| 5-Person Households | 4 (9.5%) | 0 (0.0%) |
| 6-Person Households | 0 (0.0%) | 0 (0.0%) |
| 7+ Person Households | 0 (0.0%) | 0 (0.0%) |
| Total | 22 (52.4%) | 20 (47.6%) |
Female Fertility in Bow Valley
Fertility by Age in Bow Valley
| Age Bracket | Women with Births | Births / 1,000 Women |
| 15 to 19 years | 0 (0.0%) | 0.0 |
| 20 to 34 years | 0 (0.0%) | 0.0 |
| 35 to 50 years | 0 (0.0%) | 0.0 |
| Total | 0 (0.0%) | 0.0 |
Fertility by Age by Marriage Status in Bow Valley
| Age Bracket | Married | Unmarried |
| 15 to 19 years | 0 (0.0%) | 0 (0.0%) |
| 20 to 34 years | 0 (0.0%) | 0 (0.0%) |
| 35 to 50 years | 0 (0.0%) | 0 (0.0%) |
| Total | 0 (0.0%) | 0 (0.0%) |
Fertility by Education in Bow Valley
| Educational Attainment | Women with Births | Births / 1,000 Women |
| Less than High School | 0 (0.0%) | 0.0 |
| High School Diploma | 0 (0.0%) | 0.0 |
| College or Associate's Degree | 0 (0.0%) | 0.0 |
| Bachelor's Degree | 0 (0.0%) | 0.0 |
| Graduate Degree | 0 (0.0%) | 0.0 |
| Total | 0 (0.0%) | 0.0 |
Fertility by Education by Marriage Status in Bow Valley
| Educational Attainment | Married | Unmarried |
| Less than High School | 0 (0.0%) | 0 (0.0%) |
| High School Diploma | 0 (0.0%) | 0 (0.0%) |
| College or Associate's Degree | 0 (0.0%) | 0 (0.0%) |
| Bachelor's Degree | 0 (0.0%) | 0 (0.0%) |
| Graduate Degree | 0 (0.0%) | 0 (0.0%) |
| Total | 0 (0.0%) | 0 (0.0%) |
Employment Characteristics in Bow Valley
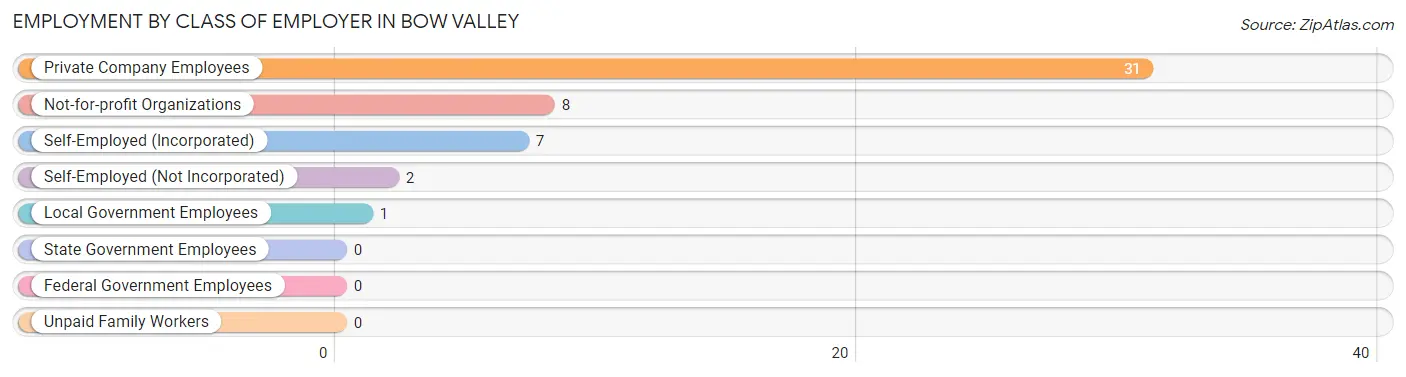
Employment by Class of Employer in Bow Valley
Among the 49 employed individuals in Bow Valley, private company employees (31 | 63.3%), not-for-profit organizations (8 | 16.3%), and self-employed (incorporated) (7 | 14.3%) make up the most common classes of employment.
| Employer Class | # Employees | % Employees |
| Private Company Employees | 31 | 63.3% |
| Self-Employed (Incorporated) | 7 | 14.3% |
| Self-Employed (Not Incorporated) | 2 | 4.1% |
| Not-for-profit Organizations | 8 | 16.3% |
| Local Government Employees | 1 | 2.0% |
| State Government Employees | 0 | 0.0% |
| Federal Government Employees | 0 | 0.0% |
| Unpaid Family Workers | 0 | 0.0% |
| Total | 49 | 100.0% |
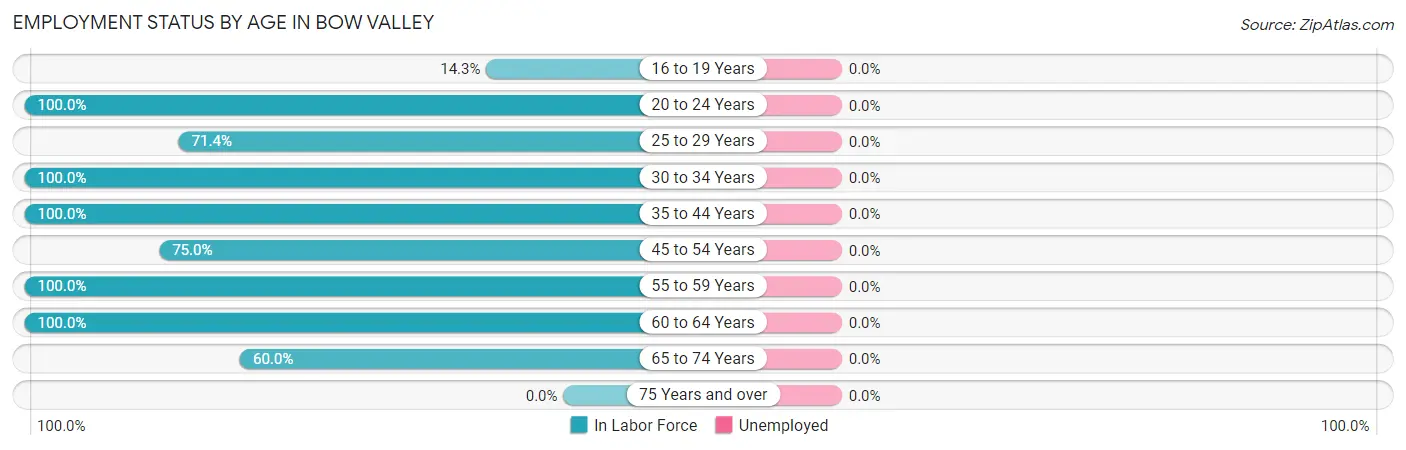
Employment Status by Age in Bow Valley
| Age Bracket | In Labor Force | Unemployed |
| 16 to 19 Years | 1 (14.3%) | 0 (0.0%) |
| 20 to 24 Years | 3 (100.0%) | 0 (0.0%) |
| 25 to 29 Years | 5 (71.4%) | 0 (0.0%) |
| 30 to 34 Years | 4 (100.0%) | 0 (0.0%) |
| 35 to 44 Years | 3 (100.0%) | 0 (0.0%) |
| 45 to 54 Years | 12 (75.0%) | 0 (0.0%) |
| 55 to 59 Years | 9 (100.0%) | 0 (0.0%) |
| 60 to 64 Years | 6 (100.0%) | 0 (0.0%) |
| 65 to 74 Years | 6 (60.0%) | 0 (0.0%) |
| 75 Years and over | 0 (0.0%) | 0 (0.0%) |
| Total | 49 (65.3%) | 0 (0.0%) |
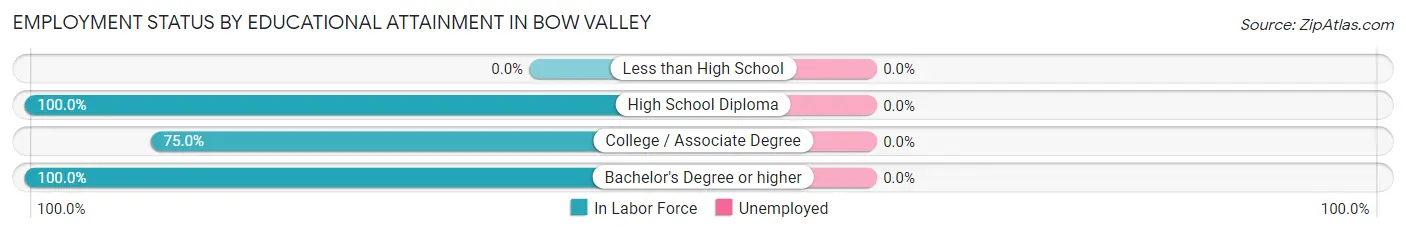
Employment Status by Educational Attainment in Bow Valley
| Educational Attainment | In Labor Force | Unemployed |
| Less than High School | 0 (0.0%) | 0 (0.0%) |
| High School Diploma | 5 (100.0%) | 0 (0.0%) |
| College / Associate Degree | 18 (75.0%) | 0 (0.0%) |
| Bachelor's Degree or higher | 16 (100.0%) | 0 (0.0%) |
| Total | 39 (86.7%) | 0 (0.0%) |
Employment Occupations by Sex in Bow Valley
Management, Business, Science and Arts Occupations
The most common Management, Business, Science and Arts occupations in Bow Valley are Health Diagnosing & Treating (5 | 10.2%), Management (2 | 4.1%), Business & Financial (2 | 4.1%), Health Technologists (2 | 4.1%), and Community & Social Service (1 | 2.0%).
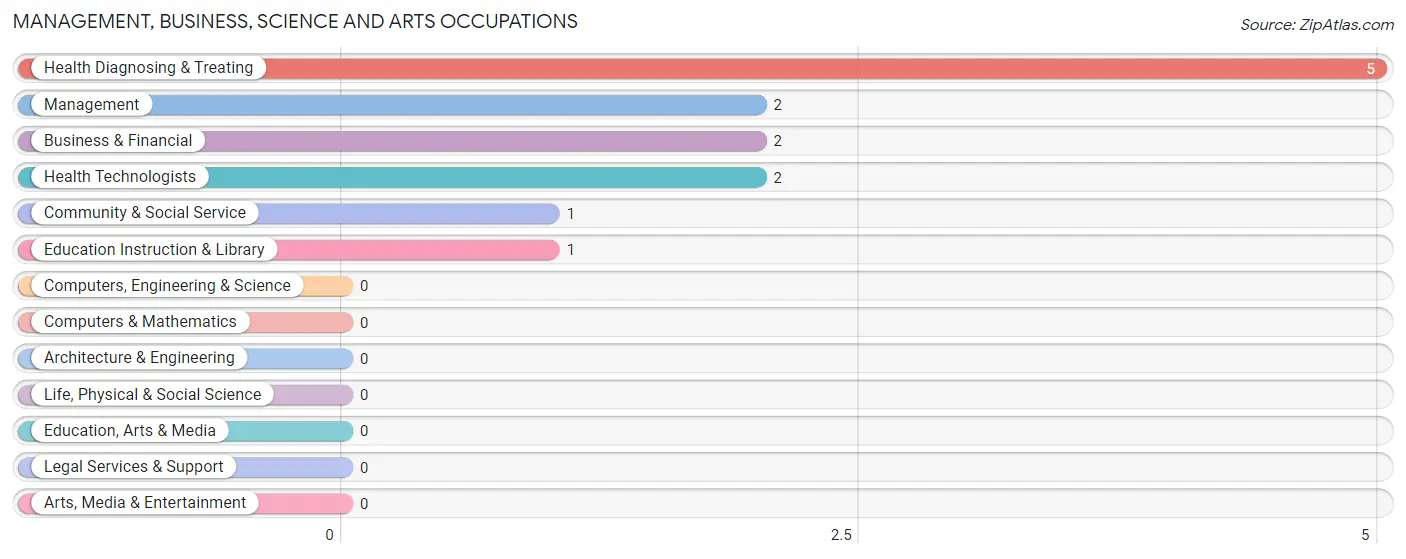
Management, Business, Science and Arts Occupations by Sex
Within the Management, Business, Science and Arts occupations in Bow Valley, the most male-oriented occupations are Management (100.0%), and Business & Financial (50.0%), while the most female-oriented occupations are Community & Social Service (100.0%), Education Instruction & Library (100.0%), and Health Diagnosing & Treating (100.0%).
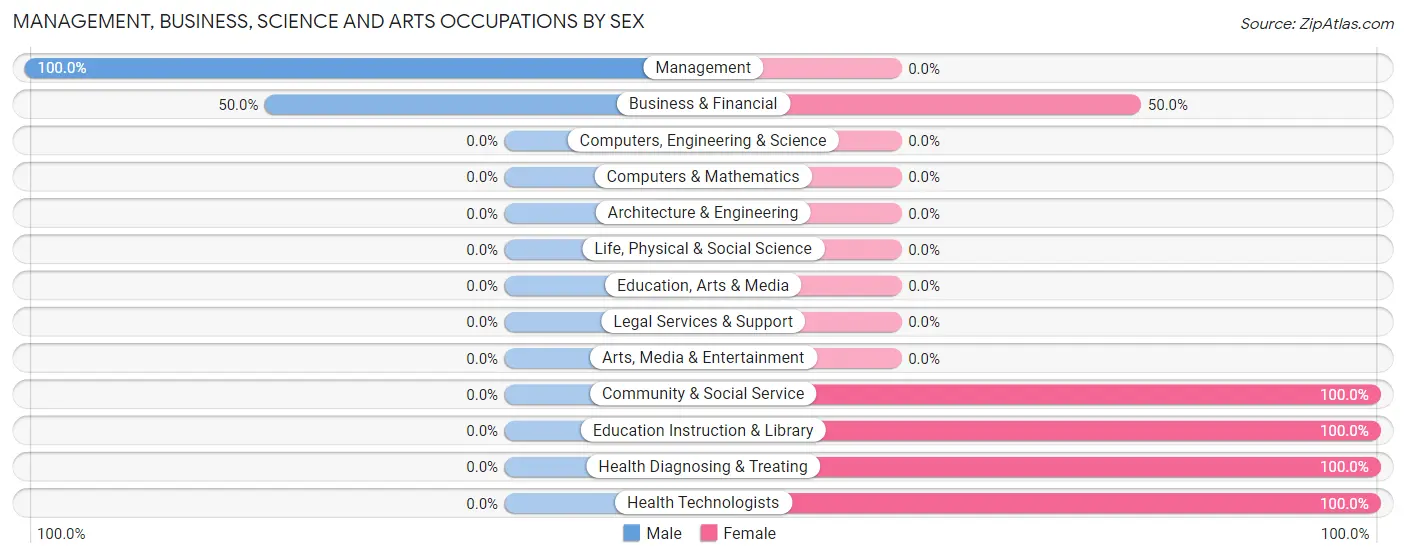
| Occupation | Male | Female |
| Management | 2 (100.0%) | 0 (0.0%) |
| Business & Financial | 1 (50.0%) | 1 (50.0%) |
| Computers, Engineering & Science | 0 (0.0%) | 0 (0.0%) |
| Computers & Mathematics | 0 (0.0%) | 0 (0.0%) |
| Architecture & Engineering | 0 (0.0%) | 0 (0.0%) |
| Life, Physical & Social Science | 0 (0.0%) | 0 (0.0%) |
| Community & Social Service | 0 (0.0%) | 1 (100.0%) |
| Education, Arts & Media | 0 (0.0%) | 0 (0.0%) |
| Legal Services & Support | 0 (0.0%) | 0 (0.0%) |
| Education Instruction & Library | 0 (0.0%) | 1 (100.0%) |
| Arts, Media & Entertainment | 0 (0.0%) | 0 (0.0%) |
| Health Diagnosing & Treating | 0 (0.0%) | 5 (100.0%) |
| Health Technologists | 0 (0.0%) | 2 (100.0%) |
| Total (Category) | 3 (30.0%) | 7 (70.0%) |
| Total (Overall) | 26 (53.1%) | 23 (46.9%) |
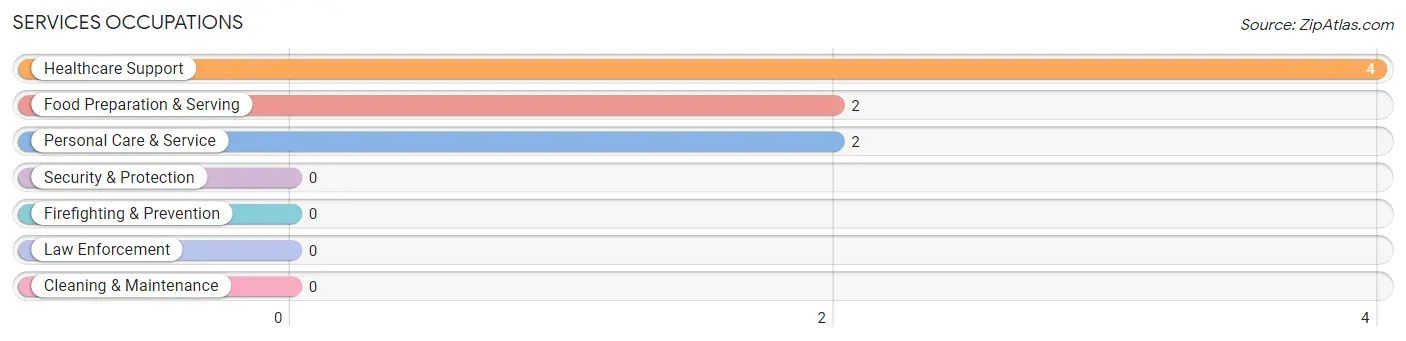
Services Occupations
The most common Services occupations in Bow Valley are Healthcare Support (4 | 8.2%), Food Preparation & Serving (2 | 4.1%), and Personal Care & Service (2 | 4.1%).
Services Occupations by Sex
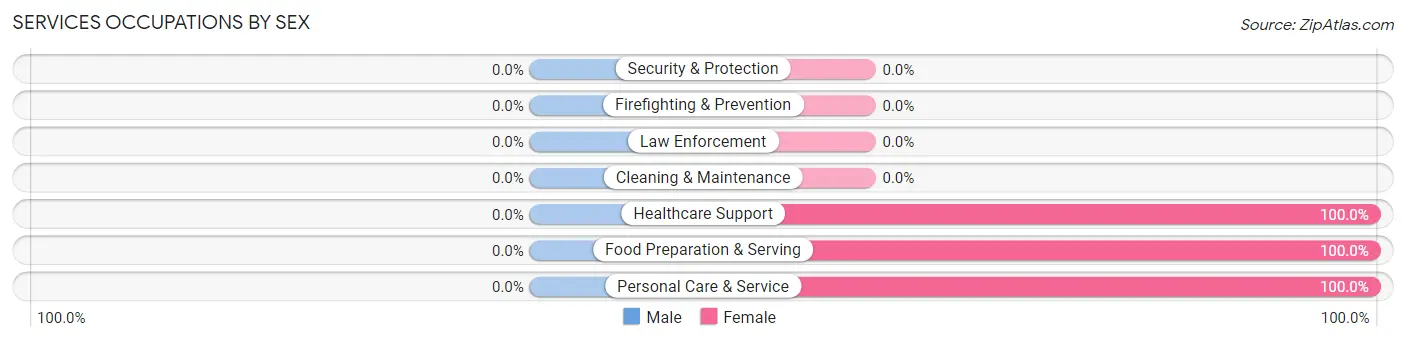
| Occupation | Male | Female |
| Healthcare Support | 0 (0.0%) | 4 (100.0%) |
| Security & Protection | 0 (0.0%) | 0 (0.0%) |
| Firefighting & Prevention | 0 (0.0%) | 0 (0.0%) |
| Law Enforcement | 0 (0.0%) | 0 (0.0%) |
| Food Preparation & Serving | 0 (0.0%) | 2 (100.0%) |
| Cleaning & Maintenance | 0 (0.0%) | 0 (0.0%) |
| Personal Care & Service | 0 (0.0%) | 2 (100.0%) |
| Total (Category) | 0 (0.0%) | 8 (100.0%) |
| Total (Overall) | 26 (53.1%) | 23 (46.9%) |
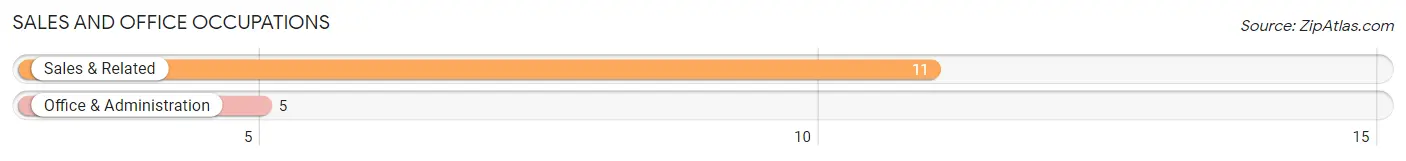
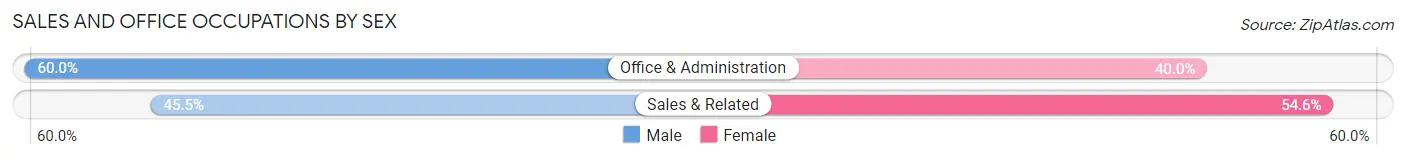
Sales and Office Occupations
The most common Sales and Office occupations in Bow Valley are Sales & Related (11 | 22.5%), and Office & Administration (5 | 10.2%).
Sales and Office Occupations by Sex
| Occupation | Male | Female |
| Sales & Related | 5 (45.5%) | 6 (54.5%) |
| Office & Administration | 3 (60.0%) | 2 (40.0%) |
| Total (Category) | 8 (50.0%) | 8 (50.0%) |
| Total (Overall) | 26 (53.1%) | 23 (46.9%) |
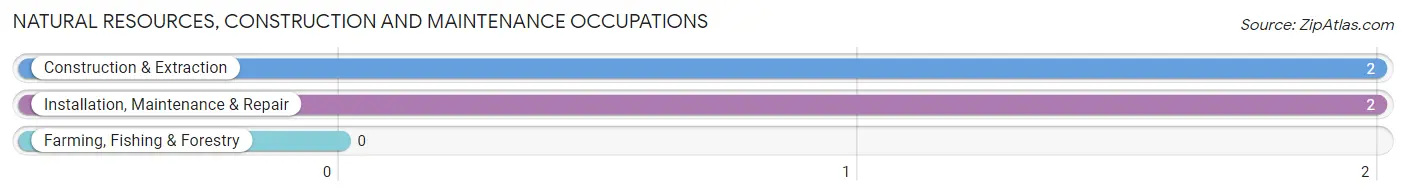
Natural Resources, Construction and Maintenance Occupations
The most common Natural Resources, Construction and Maintenance occupations in Bow Valley are Construction & Extraction (2 | 4.1%), and Installation, Maintenance & Repair (2 | 4.1%).
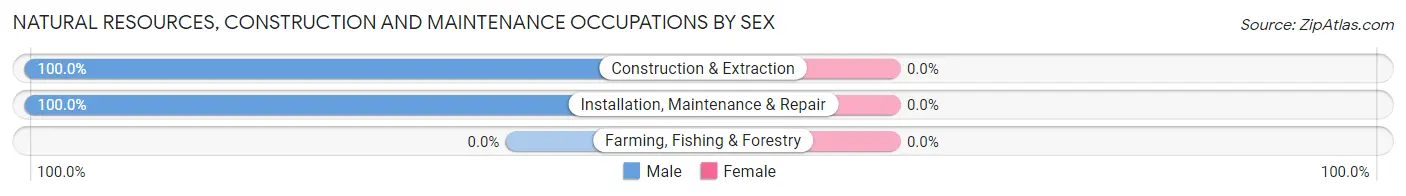
Natural Resources, Construction and Maintenance Occupations by Sex
| Occupation | Male | Female |
| Farming, Fishing & Forestry | 0 (0.0%) | 0 (0.0%) |
| Construction & Extraction | 2 (100.0%) | 0 (0.0%) |
| Installation, Maintenance & Repair | 2 (100.0%) | 0 (0.0%) |
| Total (Category) | 4 (100.0%) | 0 (0.0%) |
| Total (Overall) | 26 (53.1%) | 23 (46.9%) |
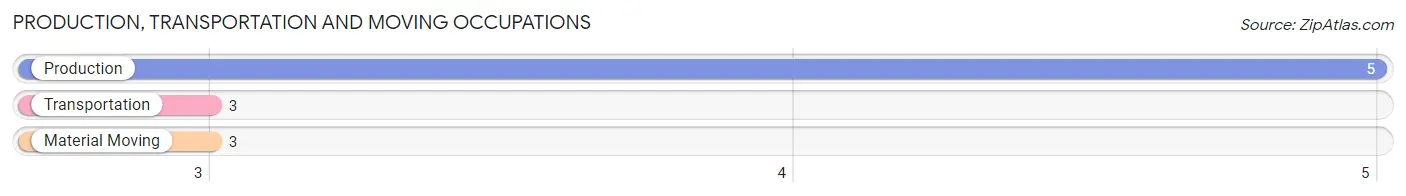
Production, Transportation and Moving Occupations
The most common Production, Transportation and Moving occupations in Bow Valley are Production (5 | 10.2%), Transportation (3 | 6.1%), and Material Moving (3 | 6.1%).
Production, Transportation and Moving Occupations by Sex
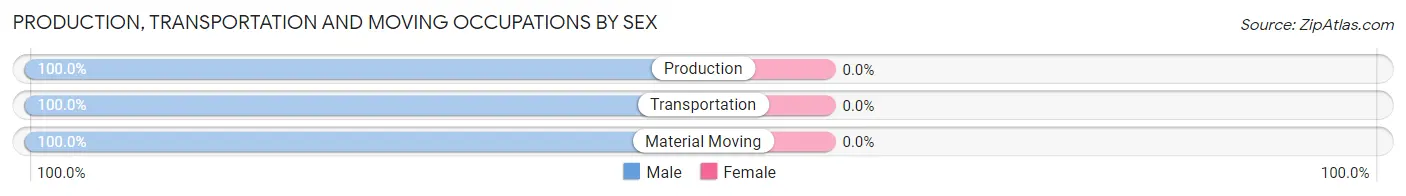
| Occupation | Male | Female |
| Production | 5 (100.0%) | 0 (0.0%) |
| Transportation | 3 (100.0%) | 0 (0.0%) |
| Material Moving | 3 (100.0%) | 0 (0.0%) |
| Total (Category) | 11 (100.0%) | 0 (0.0%) |
| Total (Overall) | 26 (53.1%) | 23 (46.9%) |
Employment Industries by Sex in Bow Valley
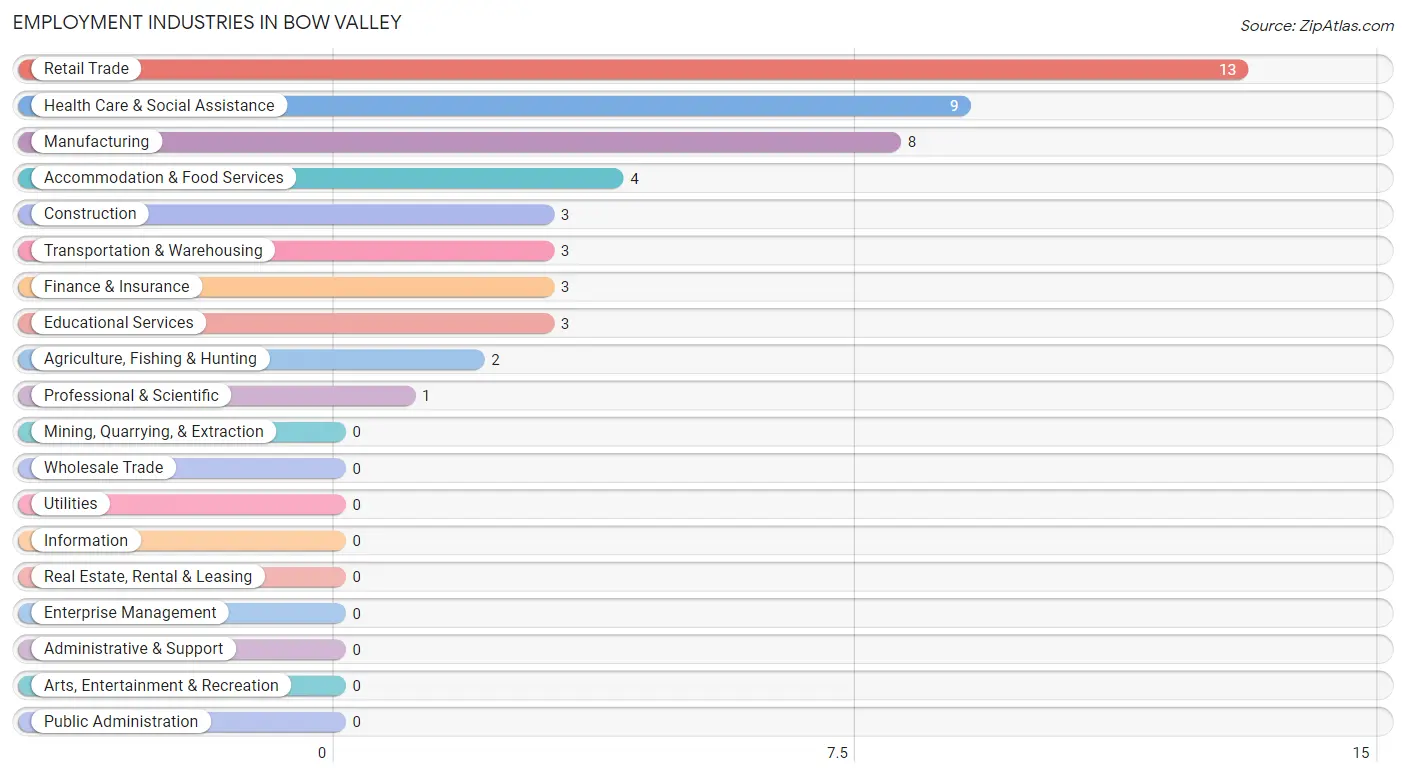
Employment Industries in Bow Valley
The major employment industries in Bow Valley include Retail Trade (13 | 26.5%), Health Care & Social Assistance (9 | 18.4%), Manufacturing (8 | 16.3%), Accommodation & Food Services (4 | 8.2%), and Construction (3 | 6.1%).
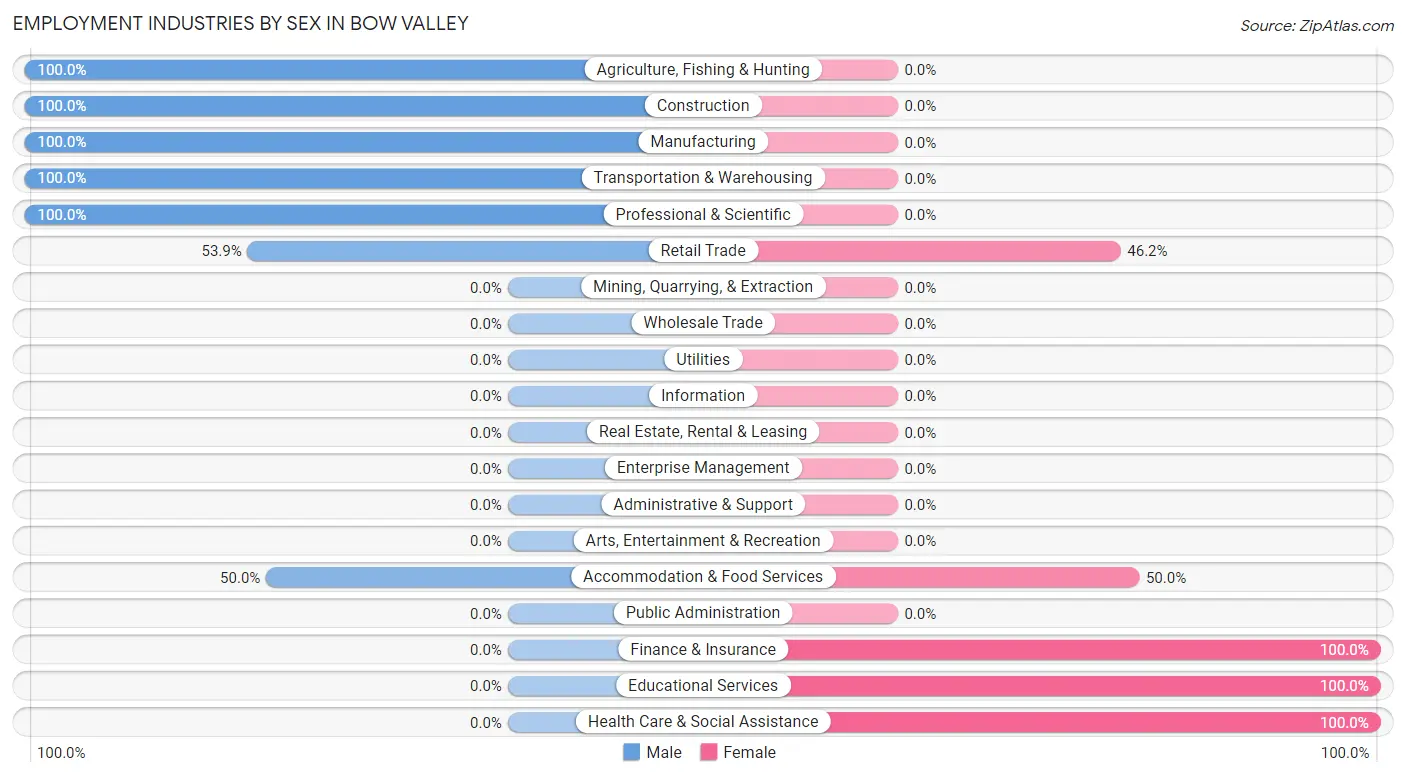
Employment Industries by Sex in Bow Valley
The Bow Valley industries that see more men than women are Agriculture, Fishing & Hunting (100.0%), Construction (100.0%), and Manufacturing (100.0%), whereas the industries that tend to have a higher number of women are Finance & Insurance (100.0%), Educational Services (100.0%), and Health Care & Social Assistance (100.0%).
| Industry | Male | Female |
| Agriculture, Fishing & Hunting | 2 (100.0%) | 0 (0.0%) |
| Mining, Quarrying, & Extraction | 0 (0.0%) | 0 (0.0%) |
| Construction | 3 (100.0%) | 0 (0.0%) |
| Manufacturing | 8 (100.0%) | 0 (0.0%) |
| Wholesale Trade | 0 (0.0%) | 0 (0.0%) |
| Retail Trade | 7 (53.8%) | 6 (46.2%) |
| Transportation & Warehousing | 3 (100.0%) | 0 (0.0%) |
| Utilities | 0 (0.0%) | 0 (0.0%) |
| Information | 0 (0.0%) | 0 (0.0%) |
| Finance & Insurance | 0 (0.0%) | 3 (100.0%) |
| Real Estate, Rental & Leasing | 0 (0.0%) | 0 (0.0%) |
| Professional & Scientific | 1 (100.0%) | 0 (0.0%) |
| Enterprise Management | 0 (0.0%) | 0 (0.0%) |
| Administrative & Support | 0 (0.0%) | 0 (0.0%) |
| Educational Services | 0 (0.0%) | 3 (100.0%) |
| Health Care & Social Assistance | 0 (0.0%) | 9 (100.0%) |
| Arts, Entertainment & Recreation | 0 (0.0%) | 0 (0.0%) |
| Accommodation & Food Services | 2 (50.0%) | 2 (50.0%) |
| Public Administration | 0 (0.0%) | 0 (0.0%) |
| Total | 26 (53.1%) | 23 (46.9%) |
Education in Bow Valley
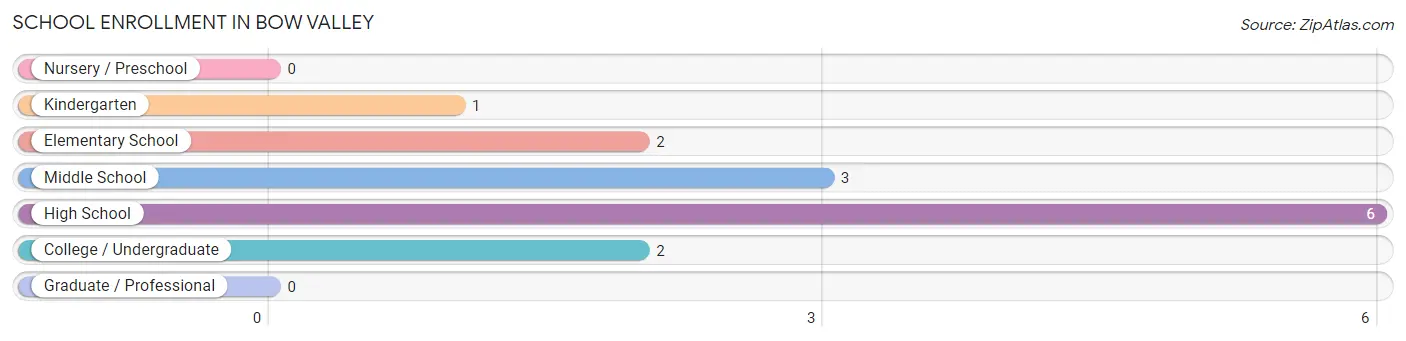
School Enrollment in Bow Valley
The most common levels of schooling among the 14 students in Bow Valley are high school (6 | 42.9%), middle school (3 | 21.4%), and elementary school (2 | 14.3%).
| School Level | # Students | % Students |
| Nursery / Preschool | 0 | 0.0% |
| Kindergarten | 1 | 7.1% |
| Elementary School | 2 | 14.3% |
| Middle School | 3 | 21.4% |
| High School | 6 | 42.9% |
| College / Undergraduate | 2 | 14.3% |
| Graduate / Professional | 0 | 0.0% |
| Total | 14 | 100.0% |
School Enrollment by Age by Funding Source in Bow Valley
Out of a total of 14 students who are enrolled in schools in Bow Valley, 5 (35.7%) attend a private institution, while the remaining 9 (64.3%) are enrolled in public schools. The age group of 5 to 9 year old has the highest likelihood of being enrolled in private schools, with 1 (100.0% in the age bracket) enrolled. Conversely, the age group of 20 to 24 year olds has the lowest likelihood of being enrolled in a private school, with 2 (100.0% in the age bracket) attending a public institution.
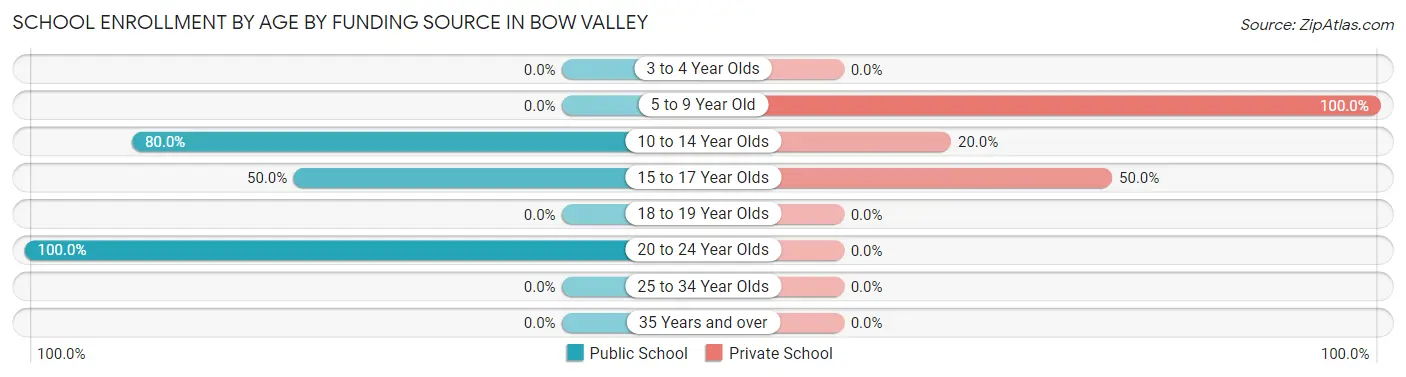
| Age Bracket | Public School | Private School |
| 3 to 4 Year Olds | 0 (0.0%) | 0 (0.0%) |
| 5 to 9 Year Old | 0 (0.0%) | 1 (100.0%) |
| 10 to 14 Year Olds | 4 (80.0%) | 1 (20.0%) |
| 15 to 17 Year Olds | 3 (50.0%) | 3 (50.0%) |
| 18 to 19 Year Olds | 0 (0.0%) | 0 (0.0%) |
| 20 to 24 Year Olds | 2 (100.0%) | 0 (0.0%) |
| 25 to 34 Year Olds | 0 (0.0%) | 0 (0.0%) |
| 35 Years and over | 0 (0.0%) | 0 (0.0%) |
| Total | 9 (64.3%) | 5 (35.7%) |
Educational Attainment by Field of Study in Bow Valley
Business (9 | 50.0%), social sciences (2 | 11.1%), literature & languages (2 | 11.1%), visual & performing arts (2 | 11.1%), and arts & humanities (2 | 11.1%) are the most common fields of study among 18 individuals in Bow Valley who have obtained a bachelor's degree or higher.
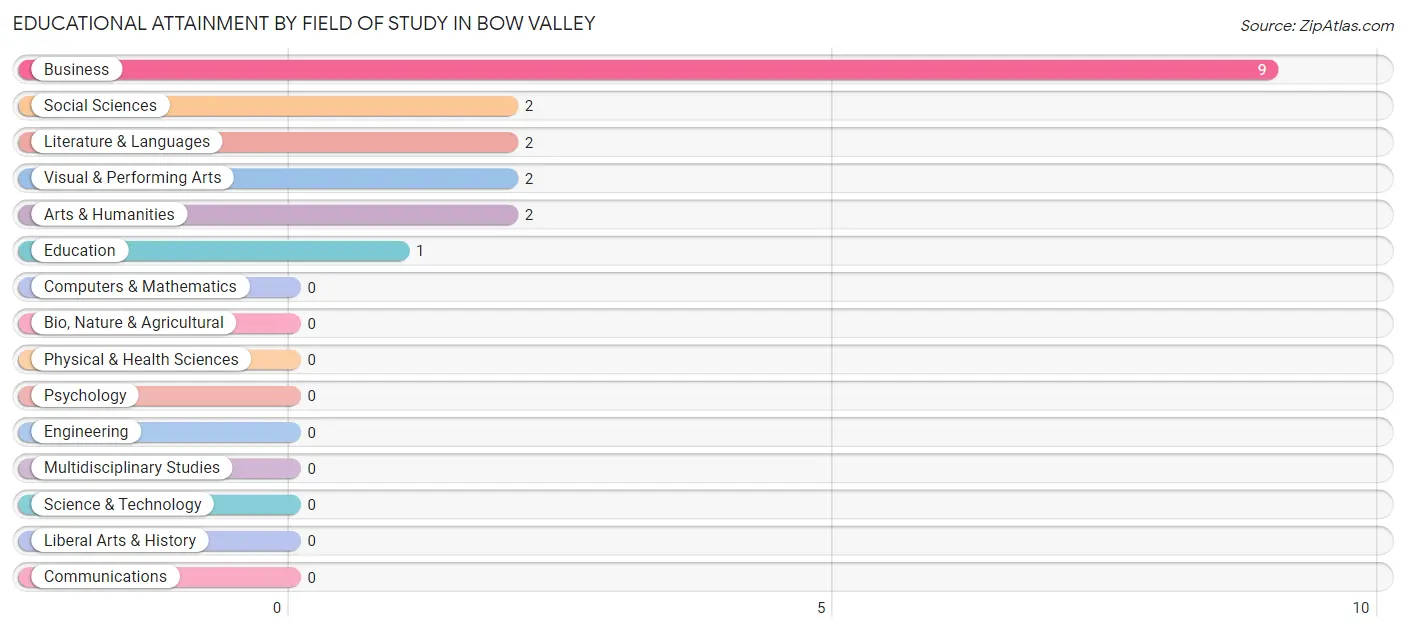
| Field of Study | # Graduates | % Graduates |
| Computers & Mathematics | 0 | 0.0% |
| Bio, Nature & Agricultural | 0 | 0.0% |
| Physical & Health Sciences | 0 | 0.0% |
| Psychology | 0 | 0.0% |
| Social Sciences | 2 | 11.1% |
| Engineering | 0 | 0.0% |
| Multidisciplinary Studies | 0 | 0.0% |
| Science & Technology | 0 | 0.0% |
| Business | 9 | 50.0% |
| Education | 1 | 5.6% |
| Literature & Languages | 2 | 11.1% |
| Liberal Arts & History | 0 | 0.0% |
| Visual & Performing Arts | 2 | 11.1% |
| Communications | 0 | 0.0% |
| Arts & Humanities | 2 | 11.1% |
| Total | 18 | 100.0% |
Transportation & Commute in Bow Valley
Vehicle Availability by Sex in Bow Valley
The most prevalent vehicle ownership categories in Bow Valley are males with 2 vehicles (11, accounting for 42.3%) and females with 2 vehicles (6, making up 47.8%).
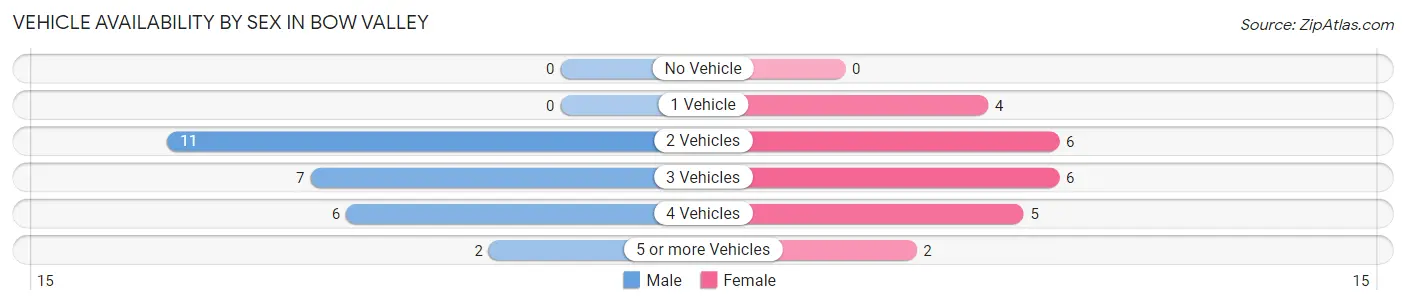
| Vehicles Available | Male | Female |
| No Vehicle | 0 (0.0%) | 0 (0.0%) |
| 1 Vehicle | 0 (0.0%) | 4 (17.4%) |
| 2 Vehicles | 11 (42.3%) | 6 (26.1%) |
| 3 Vehicles | 7 (26.9%) | 6 (26.1%) |
| 4 Vehicles | 6 (23.1%) | 5 (21.7%) |
| 5 or more Vehicles | 2 (7.7%) | 2 (8.7%) |
| Total | 26 (100.0%) | 23 (100.0%) |
Commute Time in Bow Valley
The most frequently occuring commute durations in Bow Valley are 15 to 19 minutes (11 commuters, 23.4%), 20 to 24 minutes (9 commuters, 19.2%), and 30 to 34 minutes (9 commuters, 19.2%).
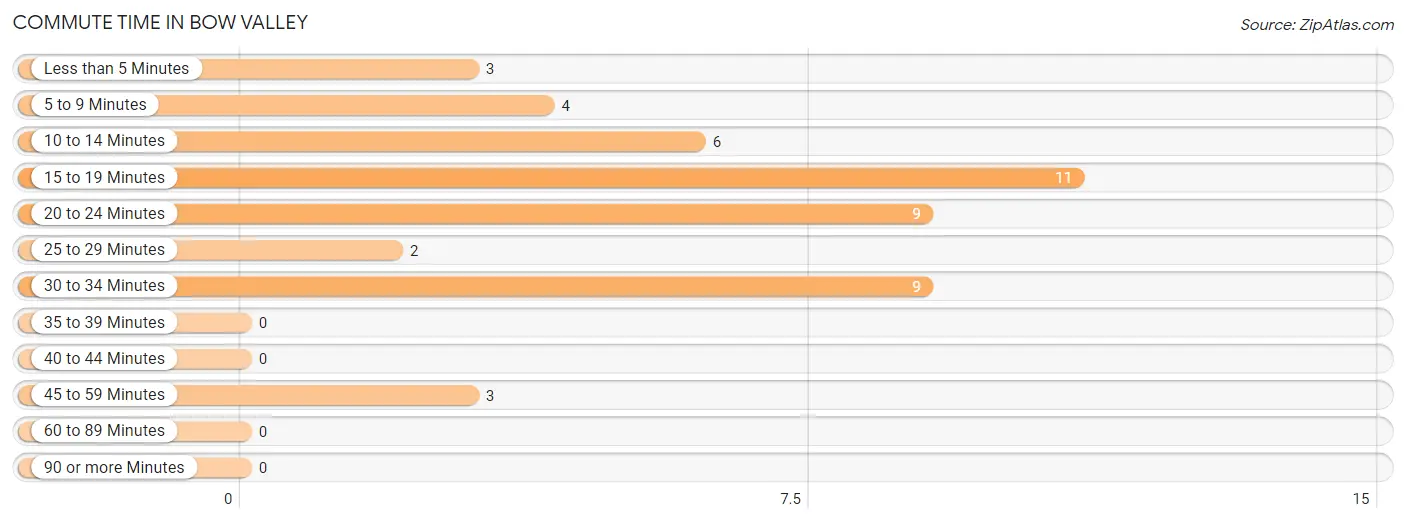
| Commute Time | # Commuters | % Commuters |
| Less than 5 Minutes | 3 | 6.4% |
| 5 to 9 Minutes | 4 | 8.5% |
| 10 to 14 Minutes | 6 | 12.8% |
| 15 to 19 Minutes | 11 | 23.4% |
| 20 to 24 Minutes | 9 | 19.2% |
| 25 to 29 Minutes | 2 | 4.3% |
| 30 to 34 Minutes | 9 | 19.2% |
| 35 to 39 Minutes | 0 | 0.0% |
| 40 to 44 Minutes | 0 | 0.0% |
| 45 to 59 Minutes | 3 | 6.4% |
| 60 to 89 Minutes | 0 | 0.0% |
| 90 or more Minutes | 0 | 0.0% |
Commute Time by Sex in Bow Valley
The most common commute times in Bow Valley are 20 to 24 minutes (7 commuters, 26.9%) for males and 30 to 34 minutes (9 commuters, 42.9%) for females.
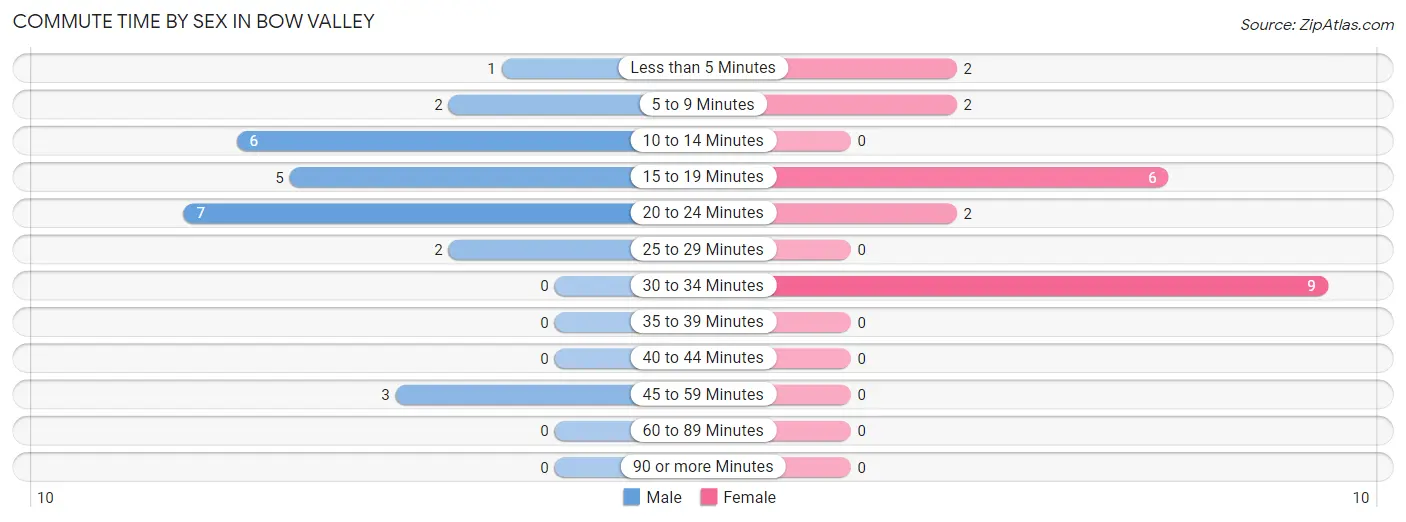
| Commute Time | Male | Female |
| Less than 5 Minutes | 1 (3.8%) | 2 (9.5%) |
| 5 to 9 Minutes | 2 (7.7%) | 2 (9.5%) |
| 10 to 14 Minutes | 6 (23.1%) | 0 (0.0%) |
| 15 to 19 Minutes | 5 (19.2%) | 6 (28.6%) |
| 20 to 24 Minutes | 7 (26.9%) | 2 (9.5%) |
| 25 to 29 Minutes | 2 (7.7%) | 0 (0.0%) |
| 30 to 34 Minutes | 0 (0.0%) | 9 (42.9%) |
| 35 to 39 Minutes | 0 (0.0%) | 0 (0.0%) |
| 40 to 44 Minutes | 0 (0.0%) | 0 (0.0%) |
| 45 to 59 Minutes | 3 (11.5%) | 0 (0.0%) |
| 60 to 89 Minutes | 0 (0.0%) | 0 (0.0%) |
| 90 or more Minutes | 0 (0.0%) | 0 (0.0%) |
Time of Departure to Work by Sex in Bow Valley
The most frequent times of departure to work in Bow Valley are 12:00 AM to 4:59 AM (8, 30.8%) for males and 7:30 AM to 7:59 AM (5, 23.8%) for females.
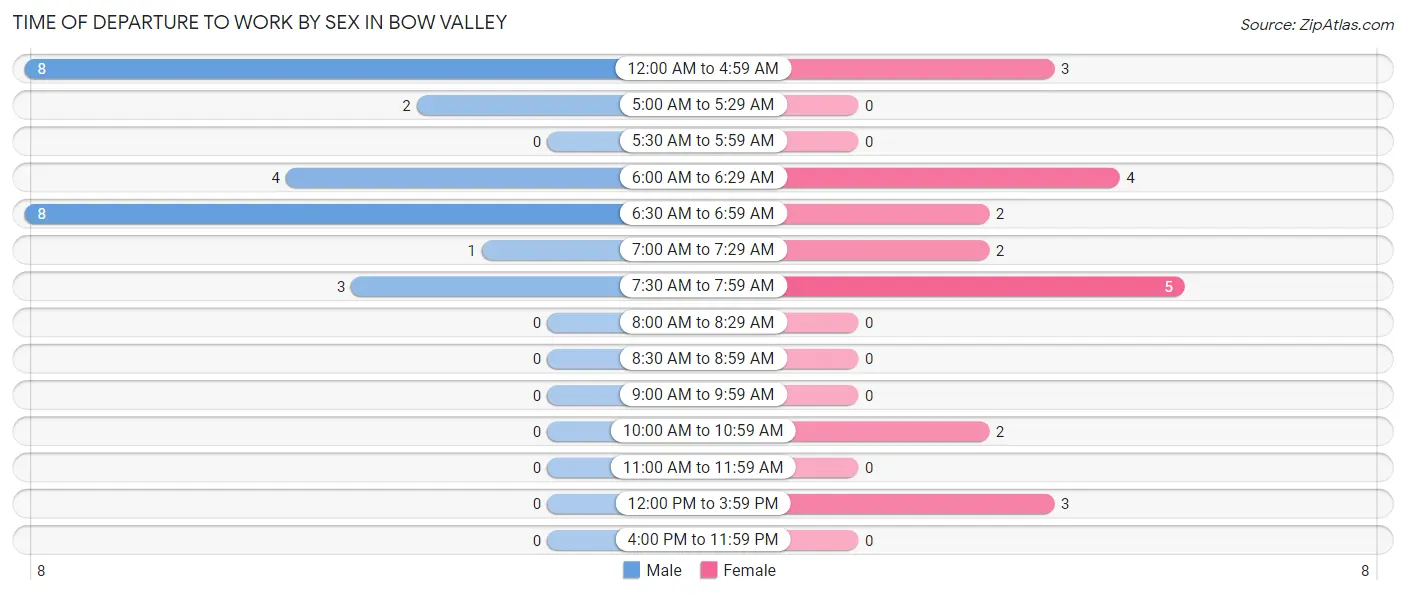
| Time of Departure | Male | Female |
| 12:00 AM to 4:59 AM | 8 (30.8%) | 3 (14.3%) |
| 5:00 AM to 5:29 AM | 2 (7.7%) | 0 (0.0%) |
| 5:30 AM to 5:59 AM | 0 (0.0%) | 0 (0.0%) |
| 6:00 AM to 6:29 AM | 4 (15.4%) | 4 (19.1%) |
| 6:30 AM to 6:59 AM | 8 (30.8%) | 2 (9.5%) |
| 7:00 AM to 7:29 AM | 1 (3.8%) | 2 (9.5%) |
| 7:30 AM to 7:59 AM | 3 (11.5%) | 5 (23.8%) |
| 8:00 AM to 8:29 AM | 0 (0.0%) | 0 (0.0%) |
| 8:30 AM to 8:59 AM | 0 (0.0%) | 0 (0.0%) |
| 9:00 AM to 9:59 AM | 0 (0.0%) | 0 (0.0%) |
| 10:00 AM to 10:59 AM | 0 (0.0%) | 2 (9.5%) |
| 11:00 AM to 11:59 AM | 0 (0.0%) | 0 (0.0%) |
| 12:00 PM to 3:59 PM | 0 (0.0%) | 3 (14.3%) |
| 4:00 PM to 11:59 PM | 0 (0.0%) | 0 (0.0%) |
| Total | 26 (100.0%) | 21 (100.0%) |
Housing Occupancy in Bow Valley
Occupancy by Ownership in Bow Valley
Of the total 42 dwellings in Bow Valley, owner-occupied units account for 42 (100.0%), while renter-occupied units make up 0 (0.0%).
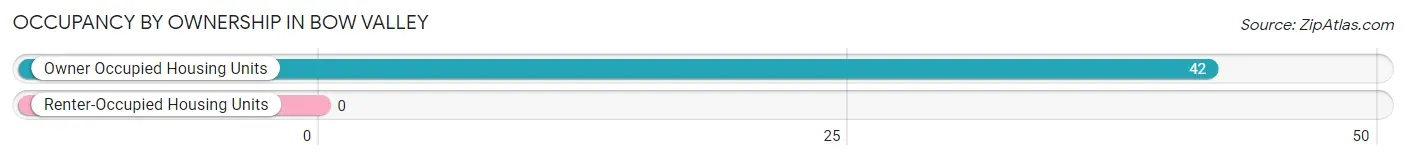
| Occupancy | # Housing Units | % Housing Units |
| Owner Occupied Housing Units | 42 | 100.0% |
| Renter-Occupied Housing Units | 0 | 0.0% |
| Total Occupied Housing Units | 42 | 100.0% |
Occupancy by Household Size in Bow Valley
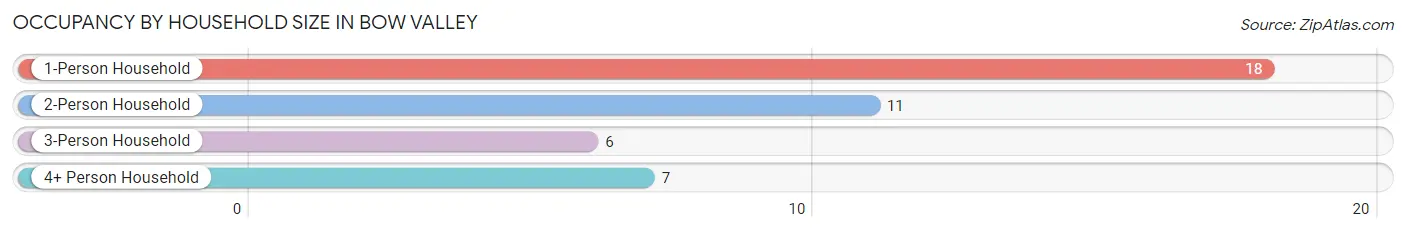
| Household Size | # Housing Units | % Housing Units |
| 1-Person Household | 18 | 42.9% |
| 2-Person Household | 11 | 26.2% |
| 3-Person Household | 6 | 14.3% |
| 4+ Person Household | 7 | 16.7% |
| Total Housing Units | 42 | 100.0% |
Occupancy by Ownership by Household Size in Bow Valley
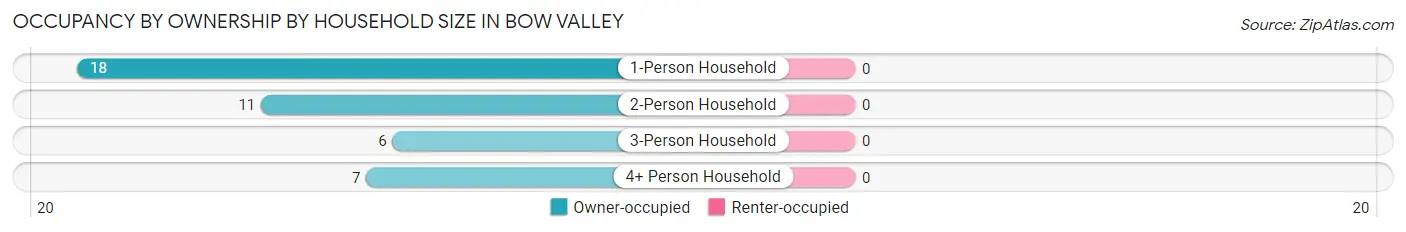
| Household Size | Owner-occupied | Renter-occupied |
| 1-Person Household | 18 (100.0%) | 0 (0.0%) |
| 2-Person Household | 11 (100.0%) | 0 (0.0%) |
| 3-Person Household | 6 (100.0%) | 0 (0.0%) |
| 4+ Person Household | 7 (100.0%) | 0 (0.0%) |
| Total Housing Units | 42 (100.0%) | 0 (0.0%) |
Occupancy by Educational Attainment in Bow Valley
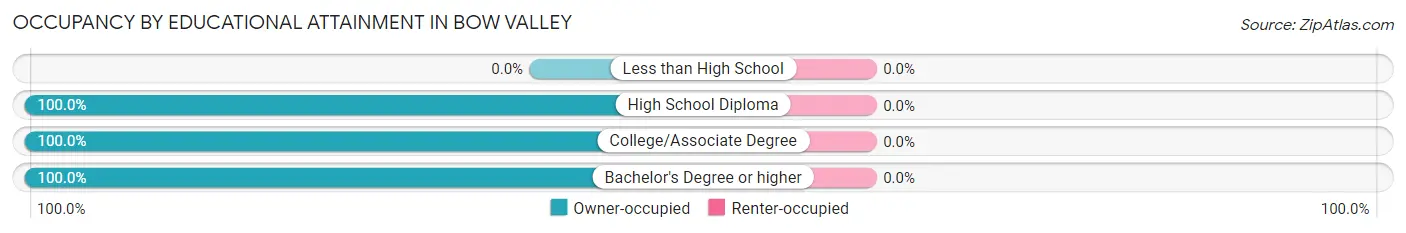
| Household Size | Owner-occupied | Renter-occupied |
| Less than High School | 0 (0.0%) | 0 (0.0%) |
| High School Diploma | 18 (100.0%) | 0 (0.0%) |
| College/Associate Degree | 12 (100.0%) | 0 (0.0%) |
| Bachelor's Degree or higher | 12 (100.0%) | 0 (0.0%) |
Occupancy by Age of Householder in Bow Valley
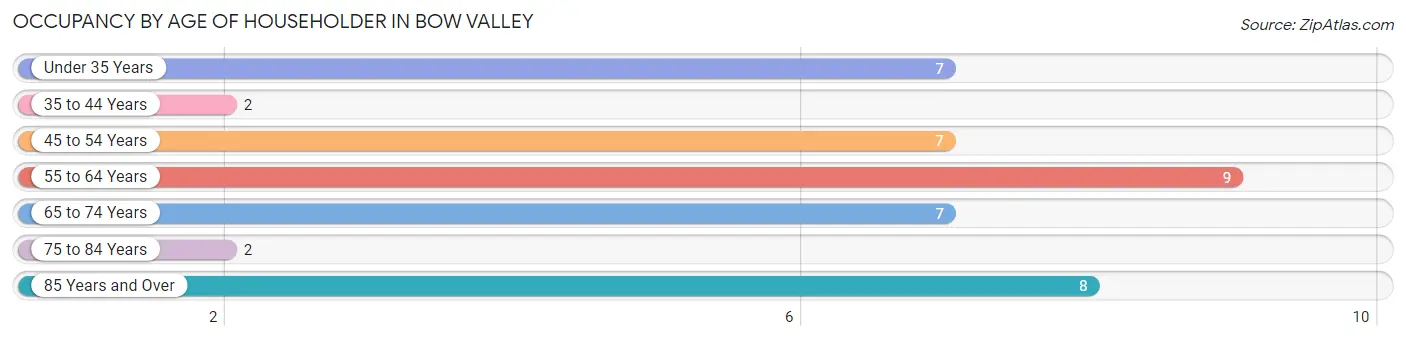
| Age Bracket | # Households | % Households |
| Under 35 Years | 7 | 16.7% |
| 35 to 44 Years | 2 | 4.8% |
| 45 to 54 Years | 7 | 16.7% |
| 55 to 64 Years | 9 | 21.4% |
| 65 to 74 Years | 7 | 16.7% |
| 75 to 84 Years | 2 | 4.8% |
| 85 Years and Over | 8 | 19.1% |
| Total | 42 | 100.0% |
Housing Finances in Bow Valley
Median Income by Occupancy in Bow Valley
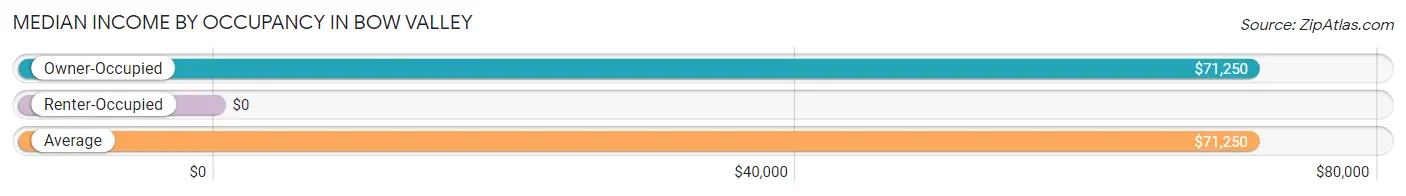
| Occupancy Type | # Households | Median Income |
| Owner-Occupied | 42 (100.0%) | $71,250 |
| Renter-Occupied | 0 (0.0%) | $0 |
| Average | 42 (100.0%) | $71,250 |
Occupancy by Householder Income Bracket in Bow Valley
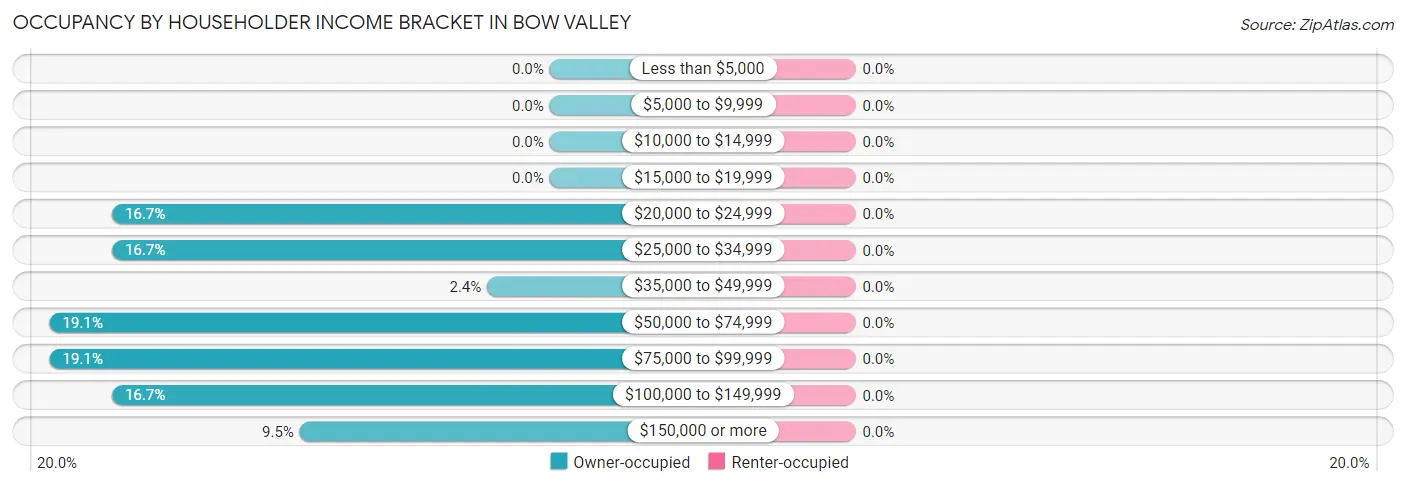
| Income Bracket | Owner-occupied | Renter-occupied |
| Less than $5,000 | 0 (0.0%) | 0 (0.0%) |
| $5,000 to $9,999 | 0 (0.0%) | 0 (0.0%) |
| $10,000 to $14,999 | 0 (0.0%) | 0 (0.0%) |
| $15,000 to $19,999 | 0 (0.0%) | 0 (0.0%) |
| $20,000 to $24,999 | 7 (16.7%) | 0 (0.0%) |
| $25,000 to $34,999 | 7 (16.7%) | 0 (0.0%) |
| $35,000 to $49,999 | 1 (2.4%) | 0 (0.0%) |
| $50,000 to $74,999 | 8 (19.1%) | 0 (0.0%) |
| $75,000 to $99,999 | 8 (19.1%) | 0 (0.0%) |
| $100,000 to $149,999 | 7 (16.7%) | 0 (0.0%) |
| $150,000 or more | 4 (9.5%) | 0 (0.0%) |
| Total | 42 (100.0%) | 0 (0.0%) |
Monthly Housing Cost Tiers in Bow Valley
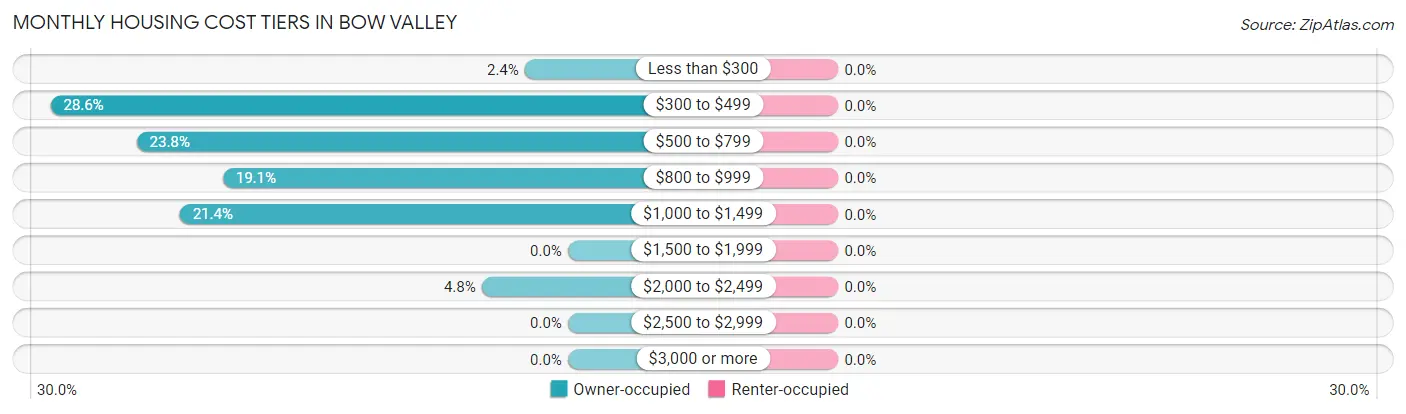
| Monthly Cost | Owner-occupied | Renter-occupied |
| Less than $300 | 1 (2.4%) | 0 (0.0%) |
| $300 to $499 | 12 (28.6%) | 0 (0.0%) |
| $500 to $799 | 10 (23.8%) | 0 (0.0%) |
| $800 to $999 | 8 (19.1%) | 0 (0.0%) |
| $1,000 to $1,499 | 9 (21.4%) | 0 (0.0%) |
| $1,500 to $1,999 | 0 (0.0%) | 0 (0.0%) |
| $2,000 to $2,499 | 2 (4.8%) | 0 (0.0%) |
| $2,500 to $2,999 | 0 (0.0%) | 0 (0.0%) |
| $3,000 or more | 0 (0.0%) | 0 (0.0%) |
| Total | 42 (100.0%) | 0 (0.0%) |
Physical Housing Characteristics in Bow Valley
Housing Structures in Bow Valley
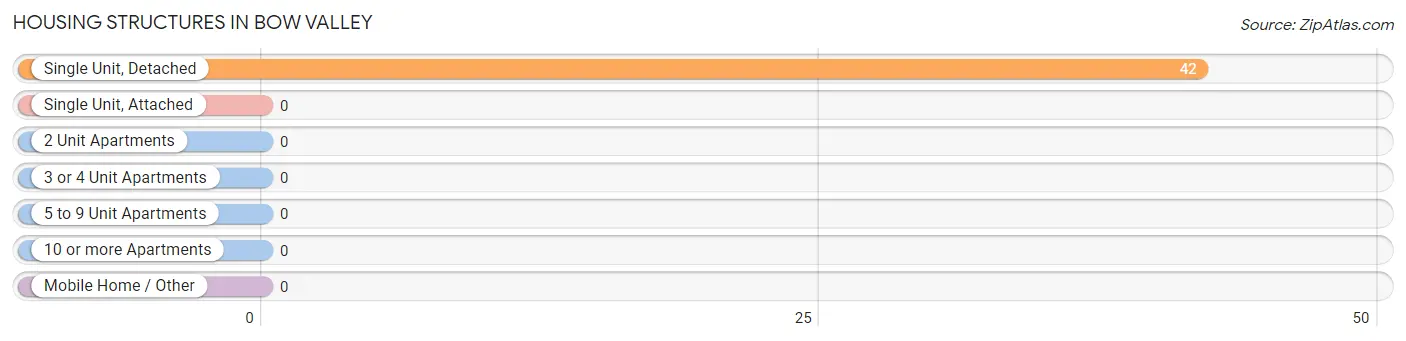
| Structure Type | # Housing Units | % Housing Units |
| Single Unit, Detached | 42 | 100.0% |
| Single Unit, Attached | 0 | 0.0% |
| 2 Unit Apartments | 0 | 0.0% |
| 3 or 4 Unit Apartments | 0 | 0.0% |
| 5 to 9 Unit Apartments | 0 | 0.0% |
| 10 or more Apartments | 0 | 0.0% |
| Mobile Home / Other | 0 | 0.0% |
| Total | 42 | 100.0% |
Housing Structures by Occupancy in Bow Valley
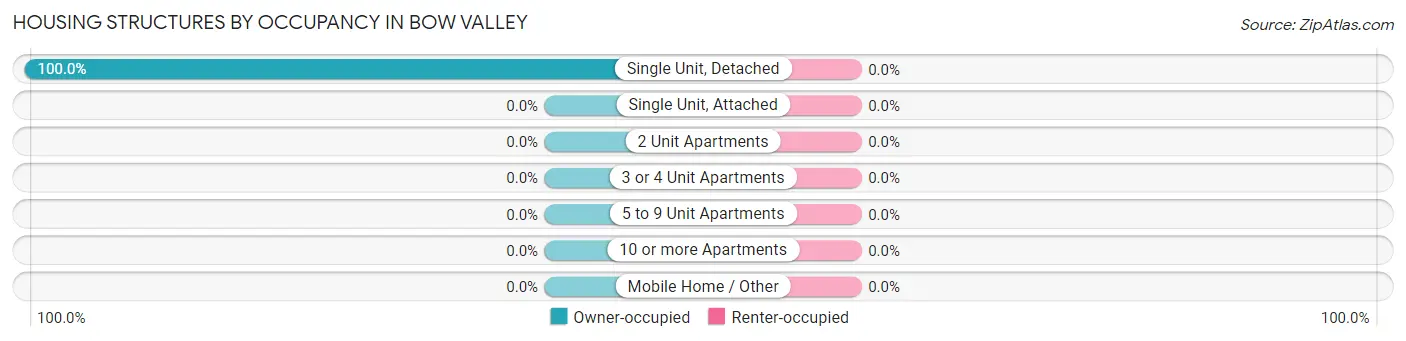
| Structure Type | Owner-occupied | Renter-occupied |
| Single Unit, Detached | 42 (100.0%) | 0 (0.0%) |
| Single Unit, Attached | 0 (0.0%) | 0 (0.0%) |
| 2 Unit Apartments | 0 (0.0%) | 0 (0.0%) |
| 3 or 4 Unit Apartments | 0 (0.0%) | 0 (0.0%) |
| 5 to 9 Unit Apartments | 0 (0.0%) | 0 (0.0%) |
| 10 or more Apartments | 0 (0.0%) | 0 (0.0%) |
| Mobile Home / Other | 0 (0.0%) | 0 (0.0%) |
| Total | 42 (100.0%) | 0 (0.0%) |
Housing Structures by Number of Rooms in Bow Valley
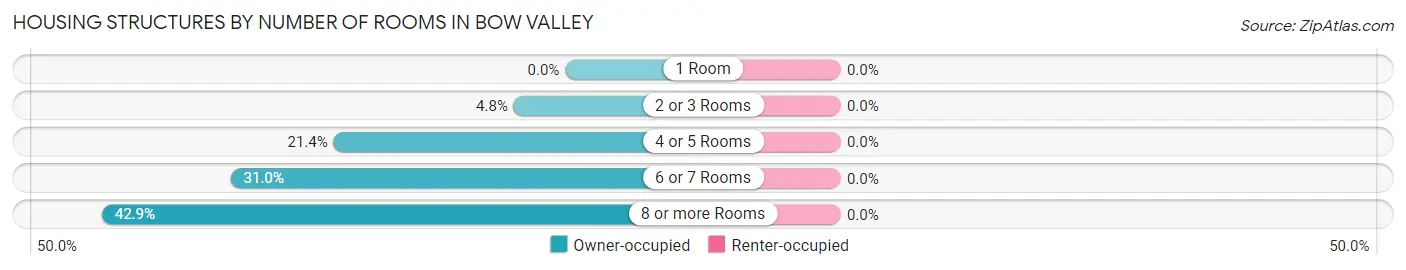
| Number of Rooms | Owner-occupied | Renter-occupied |
| 1 Room | 0 (0.0%) | 0 (0.0%) |
| 2 or 3 Rooms | 2 (4.8%) | 0 (0.0%) |
| 4 or 5 Rooms | 9 (21.4%) | 0 (0.0%) |
| 6 or 7 Rooms | 13 (30.9%) | 0 (0.0%) |
| 8 or more Rooms | 18 (42.9%) | 0 (0.0%) |
| Total | 42 (100.0%) | 0 (0.0%) |
Housing Structure by Heating Type in Bow Valley
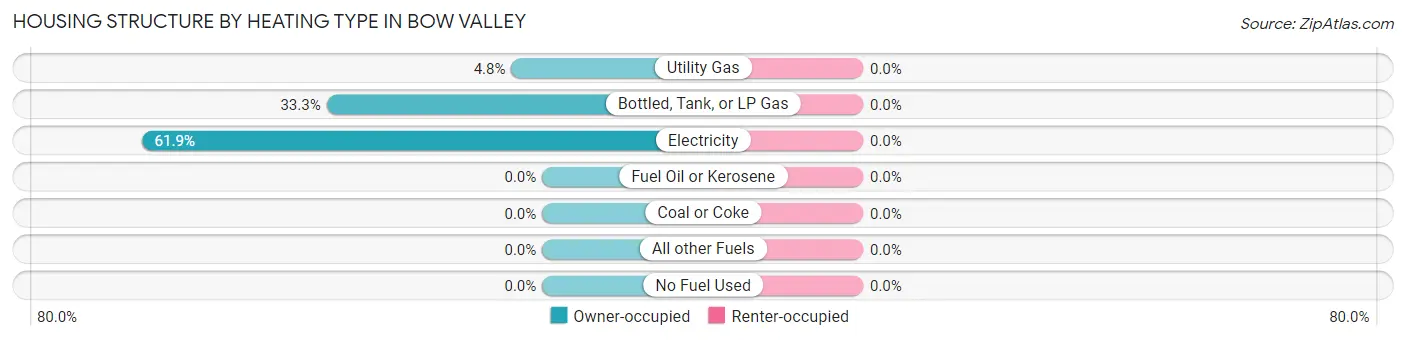
| Heating Type | Owner-occupied | Renter-occupied |
| Utility Gas | 2 (4.8%) | 0 (0.0%) |
| Bottled, Tank, or LP Gas | 14 (33.3%) | 0 (0.0%) |
| Electricity | 26 (61.9%) | 0 (0.0%) |
| Fuel Oil or Kerosene | 0 (0.0%) | 0 (0.0%) |
| Coal or Coke | 0 (0.0%) | 0 (0.0%) |
| All other Fuels | 0 (0.0%) | 0 (0.0%) |
| No Fuel Used | 0 (0.0%) | 0 (0.0%) |
| Total | 42 (100.0%) | 0 (0.0%) |
Household Vehicle Usage in Bow Valley
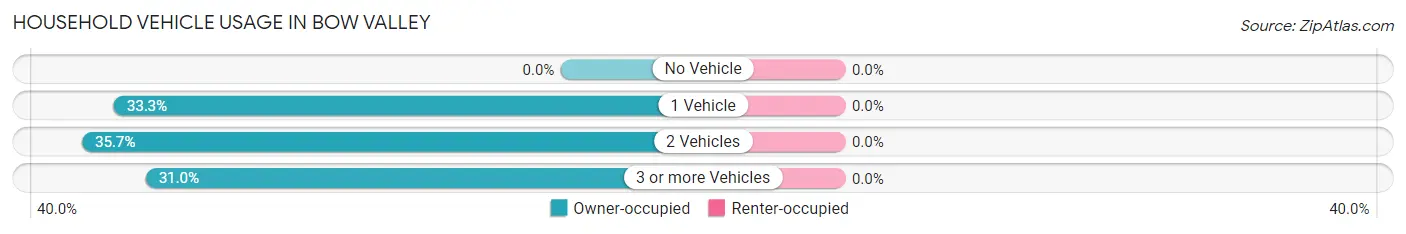
| Vehicles per Household | Owner-occupied | Renter-occupied |
| No Vehicle | 0 (0.0%) | 0 (0.0%) |
| 1 Vehicle | 14 (33.3%) | 0 (0.0%) |
| 2 Vehicles | 15 (35.7%) | 0 (0.0%) |
| 3 or more Vehicles | 13 (30.9%) | 0 (0.0%) |
| Total | 42 (100.0%) | 0 (0.0%) |
Real Estate & Mortgages in Bow Valley
Real Estate and Mortgage Overview in Bow Valley
| Characteristic | Without Mortgage | With Mortgage |
| Housing Units | 23 | 19 |
| Median Property Value | $140,600 | $121,900 |
| Median Household Income | - | - |
| Monthly Housing Costs | $483 | $0 |
| Real Estate Taxes | $1,875 | $0 |
Property Value by Mortgage Status in Bow Valley
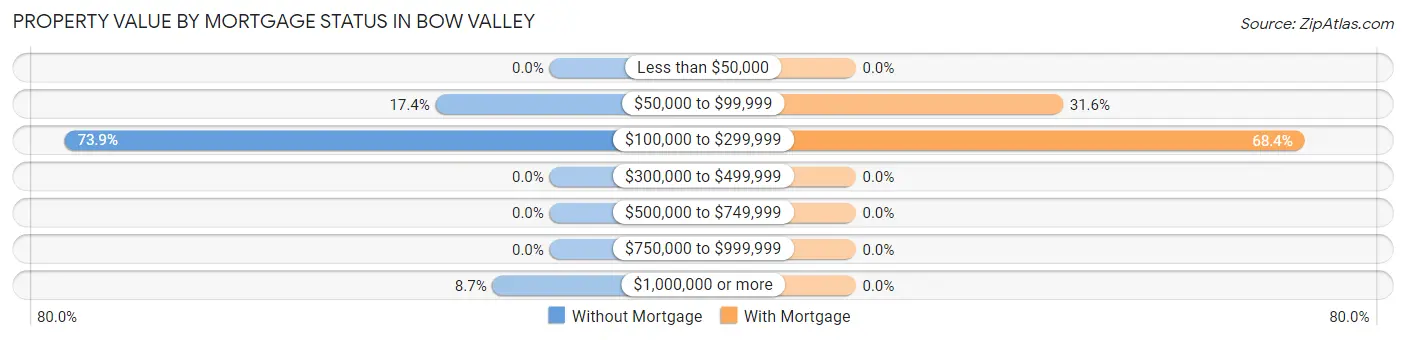
| Property Value | Without Mortgage | With Mortgage |
| Less than $50,000 | 0 (0.0%) | 0 (0.0%) |
| $50,000 to $99,999 | 4 (17.4%) | 6 (31.6%) |
| $100,000 to $299,999 | 17 (73.9%) | 13 (68.4%) |
| $300,000 to $499,999 | 0 (0.0%) | 0 (0.0%) |
| $500,000 to $749,999 | 0 (0.0%) | 0 (0.0%) |
| $750,000 to $999,999 | 0 (0.0%) | 0 (0.0%) |
| $1,000,000 or more | 2 (8.7%) | 0 (0.0%) |
| Total | 23 (100.0%) | 19 (100.0%) |
Household Income by Mortgage Status in Bow Valley
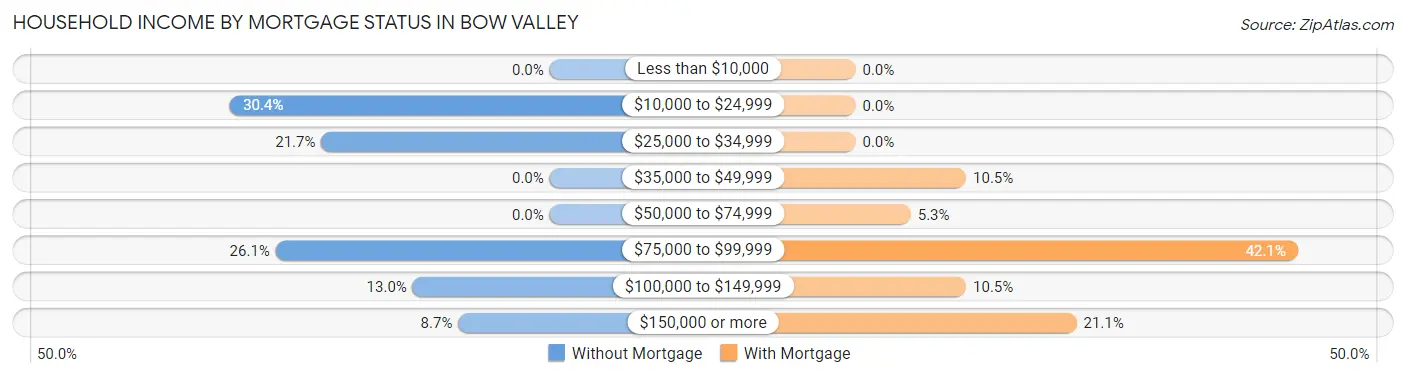
| Household Income | Without Mortgage | With Mortgage |
| Less than $10,000 | 0 (0.0%) | 0 (0.0%) |
| $10,000 to $24,999 | 7 (30.4%) | 0 (0.0%) |
| $25,000 to $34,999 | 5 (21.7%) | 0 (0.0%) |
| $35,000 to $49,999 | 0 (0.0%) | 2 (10.5%) |
| $50,000 to $74,999 | 0 (0.0%) | 1 (5.3%) |
| $75,000 to $99,999 | 6 (26.1%) | 8 (42.1%) |
| $100,000 to $149,999 | 3 (13.0%) | 2 (10.5%) |
| $150,000 or more | 2 (8.7%) | 4 (21.0%) |
| Total | 23 (100.0%) | 19 (100.0%) |
Property Value to Household Income Ratio in Bow Valley
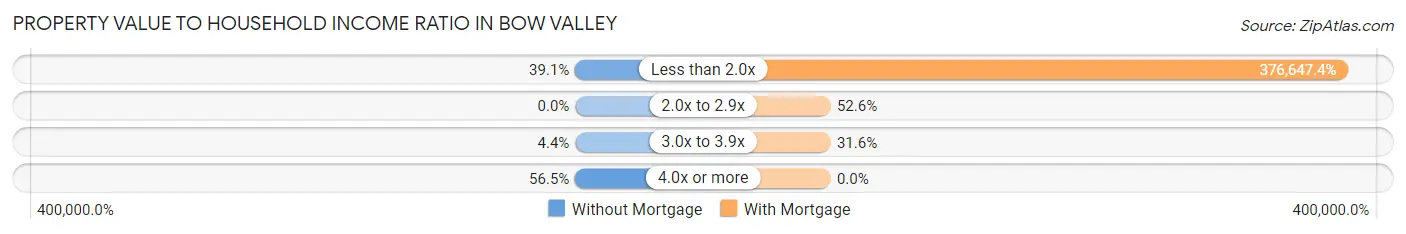
| Value-to-Income Ratio | Without Mortgage | With Mortgage |
| Less than 2.0x | 9 (39.1%) | 71,563 (376,647.4%) |
| 2.0x to 2.9x | 0 (0.0%) | 10 (52.6%) |
| 3.0x to 3.9x | 1 (4.3%) | 6 (31.6%) |
| 4.0x or more | 13 (56.5%) | 0 (0.0%) |
| Total | 23 (100.0%) | 19 (100.0%) |
Real Estate Taxes by Mortgage Status in Bow Valley
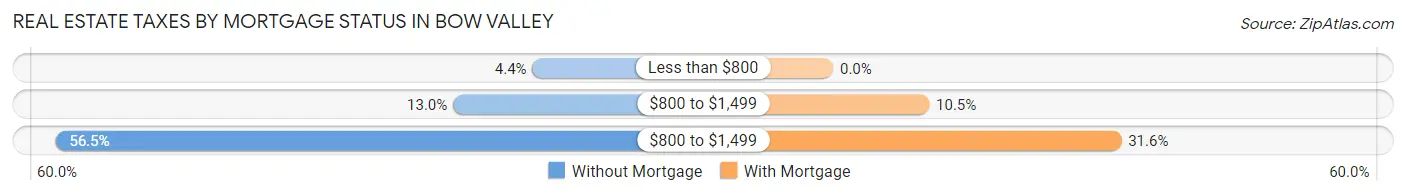
| Property Taxes | Without Mortgage | With Mortgage |
| Less than $800 | 1 (4.3%) | 0 (0.0%) |
| $800 to $1,499 | 3 (13.0%) | 2 (10.5%) |
| $800 to $1,499 | 13 (56.5%) | 6 (31.6%) |
| Total | 23 (100.0%) | 19 (100.0%) |
Health & Disability in Bow Valley
Health Insurance Coverage by Age in Bow Valley
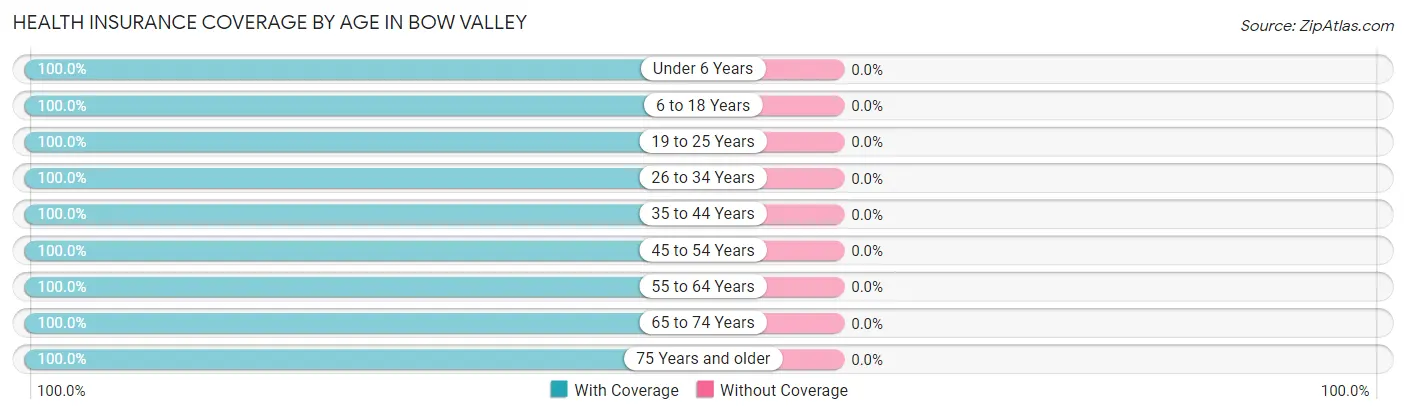
| Age Bracket | With Coverage | Without Coverage |
| Under 6 Years | 3 (100.0%) | 0 (0.0%) |
| 6 to 18 Years | 14 (100.0%) | 0 (0.0%) |
| 19 to 25 Years | 8 (100.0%) | 0 (0.0%) |
| 26 to 34 Years | 7 (100.0%) | 0 (0.0%) |
| 35 to 44 Years | 3 (100.0%) | 0 (0.0%) |
| 45 to 54 Years | 16 (100.0%) | 0 (0.0%) |
| 55 to 64 Years | 15 (100.0%) | 0 (0.0%) |
| 65 to 74 Years | 10 (100.0%) | 0 (0.0%) |
| 75 Years and older | 10 (100.0%) | 0 (0.0%) |
| Total | 86 (100.0%) | 0 (0.0%) |
Health Insurance Coverage by Citizenship Status in Bow Valley
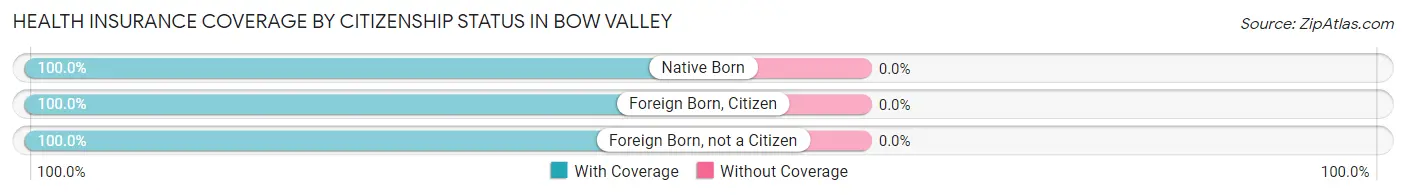
| Citizenship Status | With Coverage | Without Coverage |
| Native Born | 3 (100.0%) | 0 (0.0%) |
| Foreign Born, Citizen | 14 (100.0%) | 0 (0.0%) |
| Foreign Born, not a Citizen | 8 (100.0%) | 0 (0.0%) |
Health Insurance Coverage by Household Income in Bow Valley
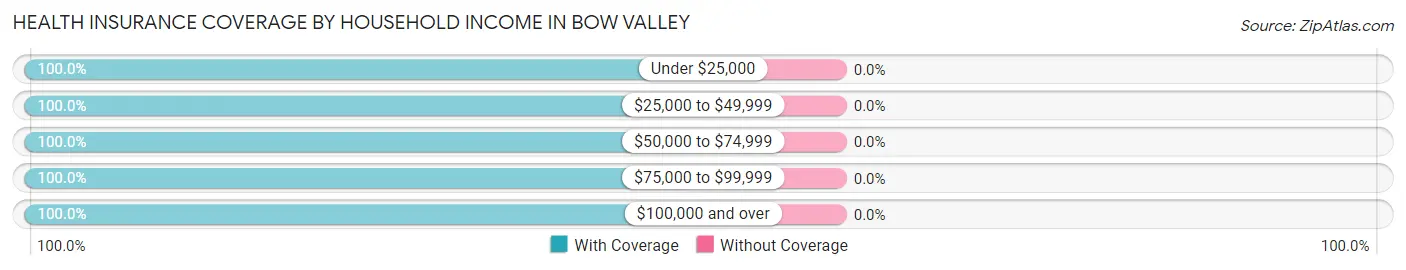
| Household Income | With Coverage | Without Coverage |
| Under $25,000 | 10 (100.0%) | 0 (0.0%) |
| $25,000 to $49,999 | 10 (100.0%) | 0 (0.0%) |
| $50,000 to $74,999 | 15 (100.0%) | 0 (0.0%) |
| $75,000 to $99,999 | 23 (100.0%) | 0 (0.0%) |
| $100,000 and over | 28 (100.0%) | 0 (0.0%) |
Public vs Private Health Insurance Coverage by Age in Bow Valley
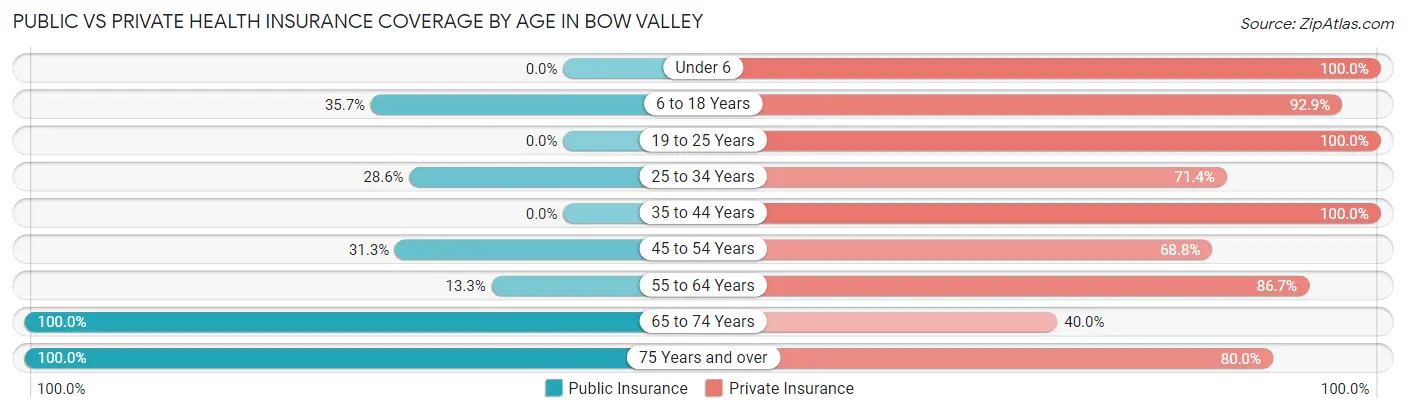
| Age Bracket | Public Insurance | Private Insurance |
| Under 6 | 0 (0.0%) | 3 (100.0%) |
| 6 to 18 Years | 5 (35.7%) | 13 (92.9%) |
| 19 to 25 Years | 0 (0.0%) | 8 (100.0%) |
| 25 to 34 Years | 2 (28.6%) | 5 (71.4%) |
| 35 to 44 Years | 0 (0.0%) | 3 (100.0%) |
| 45 to 54 Years | 5 (31.2%) | 11 (68.8%) |
| 55 to 64 Years | 2 (13.3%) | 13 (86.7%) |
| 65 to 74 Years | 10 (100.0%) | 4 (40.0%) |
| 75 Years and over | 10 (100.0%) | 8 (80.0%) |
| Total | 34 (39.5%) | 68 (79.1%) |
Disability Status by Sex by Age in Bow Valley
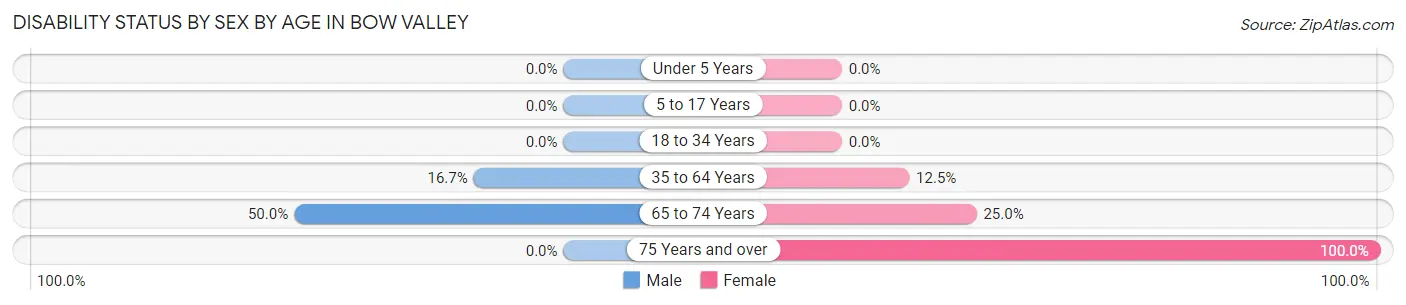
| Age Bracket | Male | Female |
| Under 5 Years | 0 (0.0%) | 0 (0.0%) |
| 5 to 17 Years | 0 (0.0%) | 0 (0.0%) |
| 18 to 34 Years | 0 (0.0%) | 0 (0.0%) |
| 35 to 64 Years | 3 (16.7%) | 2 (12.5%) |
| 65 to 74 Years | 3 (50.0%) | 1 (25.0%) |
| 75 Years and over | 0 (0.0%) | 8 (100.0%) |
Disability Class by Sex by Age in Bow Valley
Disability Class: Hearing Difficulty
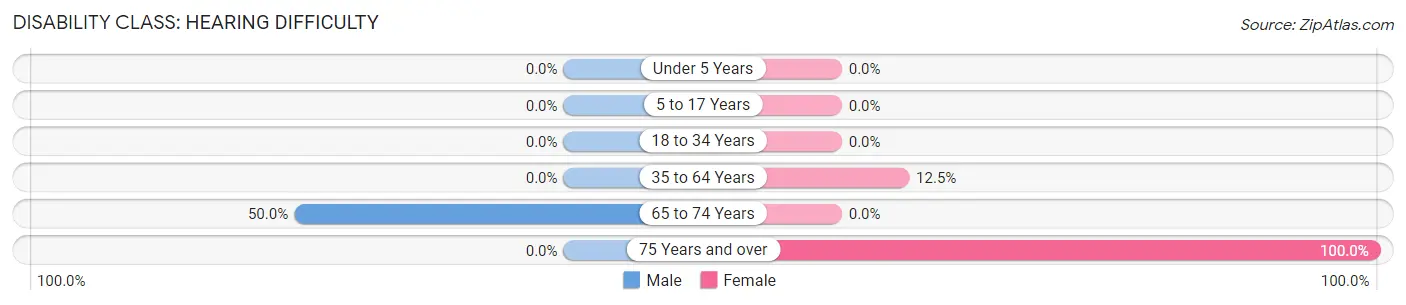
| Age Bracket | Male | Female |
| Under 5 Years | 0 (0.0%) | 0 (0.0%) |
| 5 to 17 Years | 0 (0.0%) | 0 (0.0%) |
| 18 to 34 Years | 0 (0.0%) | 0 (0.0%) |
| 35 to 64 Years | 0 (0.0%) | 2 (12.5%) |
| 65 to 74 Years | 3 (50.0%) | 0 (0.0%) |
| 75 Years and over | 0 (0.0%) | 8 (100.0%) |
Disability Class: Vision Difficulty
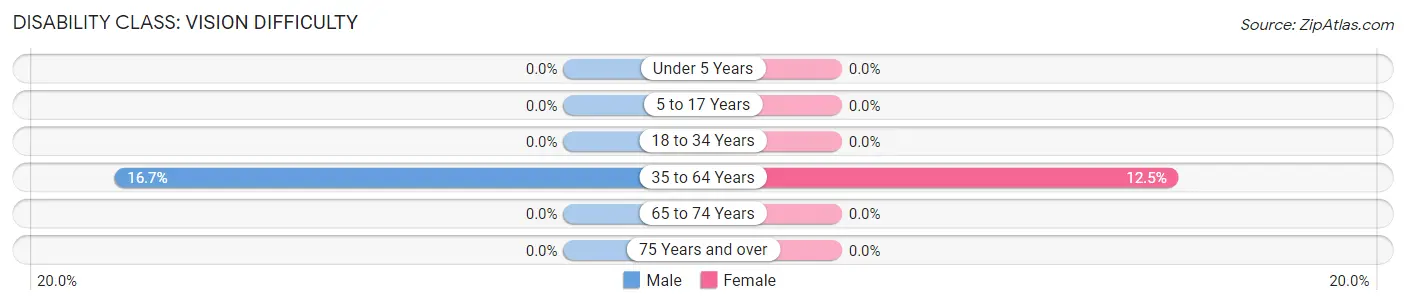
| Age Bracket | Male | Female |
| Under 5 Years | 0 (0.0%) | 0 (0.0%) |
| 5 to 17 Years | 0 (0.0%) | 0 (0.0%) |
| 18 to 34 Years | 0 (0.0%) | 0 (0.0%) |
| 35 to 64 Years | 3 (16.7%) | 2 (12.5%) |
| 65 to 74 Years | 0 (0.0%) | 0 (0.0%) |
| 75 Years and over | 0 (0.0%) | 0 (0.0%) |
Disability Class: Cognitive Difficulty
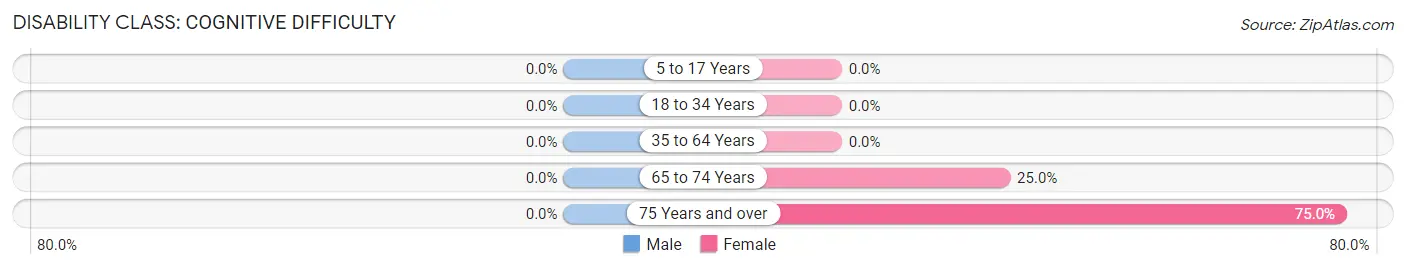
| Age Bracket | Male | Female |
| 5 to 17 Years | 0 (0.0%) | 0 (0.0%) |
| 18 to 34 Years | 0 (0.0%) | 0 (0.0%) |
| 35 to 64 Years | 0 (0.0%) | 0 (0.0%) |
| 65 to 74 Years | 0 (0.0%) | 1 (25.0%) |
| 75 Years and over | 0 (0.0%) | 6 (75.0%) |
Disability Class: Ambulatory Difficulty
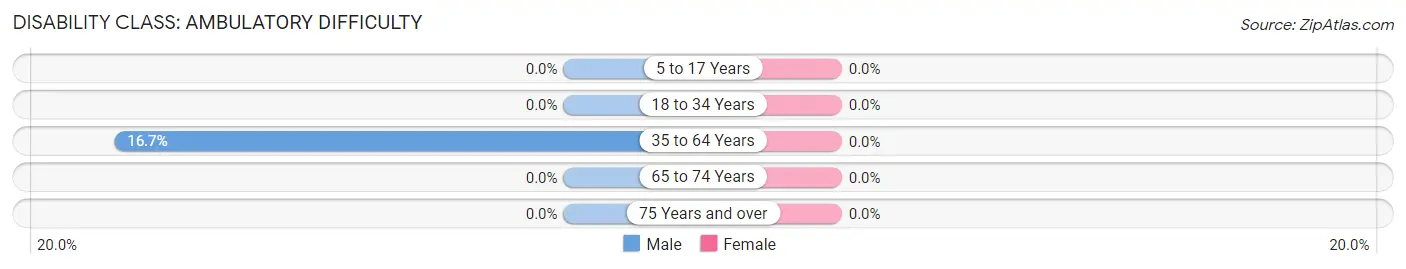
| Age Bracket | Male | Female |
| 5 to 17 Years | 0 (0.0%) | 0 (0.0%) |
| 18 to 34 Years | 0 (0.0%) | 0 (0.0%) |
| 35 to 64 Years | 3 (16.7%) | 0 (0.0%) |
| 65 to 74 Years | 0 (0.0%) | 0 (0.0%) |
| 75 Years and over | 0 (0.0%) | 0 (0.0%) |
Disability Class: Self-Care Difficulty
| Age Bracket | Male | Female |
| 5 to 17 Years | 0 (0.0%) | 0 (0.0%) |
| 18 to 34 Years | 0 (0.0%) | 0 (0.0%) |
| 35 to 64 Years | 0 (0.0%) | 0 (0.0%) |
| 65 to 74 Years | 0 (0.0%) | 0 (0.0%) |
| 75 Years and over | 0 (0.0%) | 0 (0.0%) |
Technology Access in Bow Valley
Computing Device Access in Bow Valley
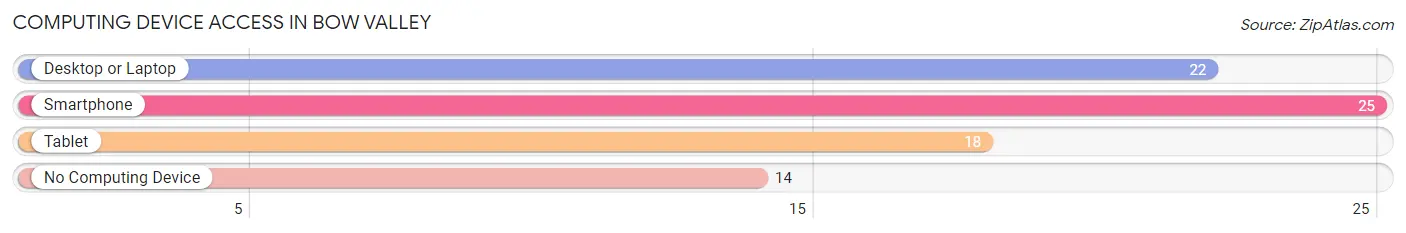
| Device Type | # Households | % Households |
| Desktop or Laptop | 22 | 52.4% |
| Smartphone | 25 | 59.5% |
| Tablet | 18 | 42.9% |
| No Computing Device | 14 | 33.3% |
| Total | 42 | 100.0% |
Internet Access in Bow Valley
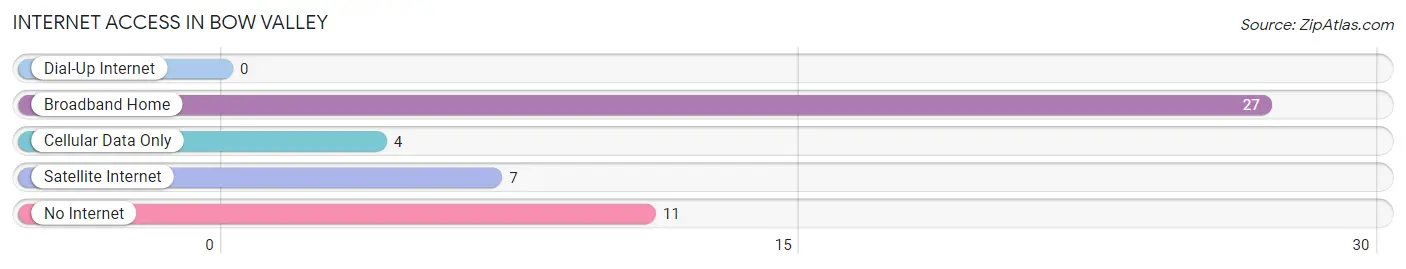
| Internet Type | # Households | % Households |
| Dial-Up Internet | 0 | 0.0% |
| Broadband Home | 27 | 64.3% |
| Cellular Data Only | 4 | 9.5% |
| Satellite Internet | 7 | 16.7% |
| No Internet | 11 | 26.2% |
| Total | 42 | 100.0% |
Bow Valley Summary
The Bow Valley is a region located in the Canadian province of Alberta. It is situated in the foothills of the Rocky Mountains, and is home to the towns of Canmore, Banff, and Lake Louise. The Bow Valley is a popular tourist destination, and is known for its stunning scenery, outdoor activities, and cultural attractions.
Geography
The Bow Valley is located in the foothills of the Rocky Mountains, and is bordered by the Bow River to the east and the Kananaskis River to the west. The region is approximately 80 km (50 mi) long and 40 km (25 mi) wide, and is situated between the towns of Canmore and Banff. The Bow Valley is characterized by its rugged terrain, with steep mountains, deep valleys, and numerous rivers and streams. The highest peak in the region is Mount Assiniboine, which stands at 3,618 m (11,870 ft).
The climate of the Bow Valley is generally mild, with warm summers and cold winters. The region receives an average of 890 mm (35 in) of precipitation annually, with most of it falling in the form of snow.
Economy
The economy of the Bow Valley is largely based on tourism. The region is home to several national parks, including Banff National Park, Yoho National Park, and Kootenay National Park. These parks attract millions of visitors each year, and are a major source of revenue for the region.
In addition to tourism, the Bow Valley is also home to several industries, including forestry, mining, and oil and gas. The region is also home to several ski resorts, which provide employment opportunities for locals.
Demographics
As of the 2016 census, the population of the Bow Valley was approximately 25,000. The majority of the population is of European descent, with the largest ethnic groups being British, German, and French. The region is also home to a large Indigenous population, with the largest groups being the Stoney Nakoda, Tsuu T'ina, and Ktunaxa.
The majority of the population is concentrated in the towns of Canmore, Banff, and Lake Louise. The region is also home to several smaller communities, including Exshaw, Harvie Heights, and Lac des Arcs.
The official language of the Bow Valley is English although French is also spoken in some areas
Conclusion
The Bow Valley is a stunning region located in the foothills of the Rocky Mountains. It is home to several national parks, ski resorts, and other attractions, and is a popular tourist destination. The economy of the region is largely based on tourism, although it is also home to several industries, including forestry, mining, and oil and gas. The population of the Bow Valley is approximately 25,000, and is largely of European descent, with a large Indigenous population. The official language of the region is English, although French is also spoken in some areas.
Common Questions
What is Per Capita Income in Bow Valley?
Per Capita income in Bow Valley is $57,664.
What is the Median Family Income in Bow Valley?
Median Family Income in Bow Valley is $81,500.
What is the Median Household income in Bow Valley?
Median Household Income in Bow Valley is $71,250.
What is Income or Wage Gap in Bow Valley?
Income or Wage Gap in Bow Valley is 53.2%.
Women in Bow Valley earn 46.8 cents for every dollar earned by a man.
What is Inequality or Gini Index in Bow Valley?
Inequality or Gini Index in Bow Valley is 0.57.
What is the Total Population of Bow Valley?
Total Population of Bow Valley is 86.
What is the Total Male Population of Bow Valley?
Total Male Population of Bow Valley is 40.
What is the Total Female Population of Bow Valley?
Total Female Population of Bow Valley is 46.
What is the Ratio of Males per 100 Females in Bow Valley?
There are 86.96 Males per 100 Females in Bow Valley.
What is the Ratio of Females per 100 Males in Bow Valley?
There are 115.00 Females per 100 Males in Bow Valley.
What is the Median Population Age in Bow Valley?
Median Population Age in Bow Valley is 49.5 Years.
What is the Average Family Size in Bow Valley
Average Family Size in Bow Valley is 3.0 People.
What is the Average Household Size in Bow Valley
Average Household Size in Bow Valley is 2.0 People.
How Large is the Labor Force in Bow Valley?
There are 49 People in the Labor Forcein in Bow Valley.
What is the Percentage of People in the Labor Force in Bow Valley?
65.3% of People are in the Labor Force in Bow Valley.