Ponca, NE Map & Demographics
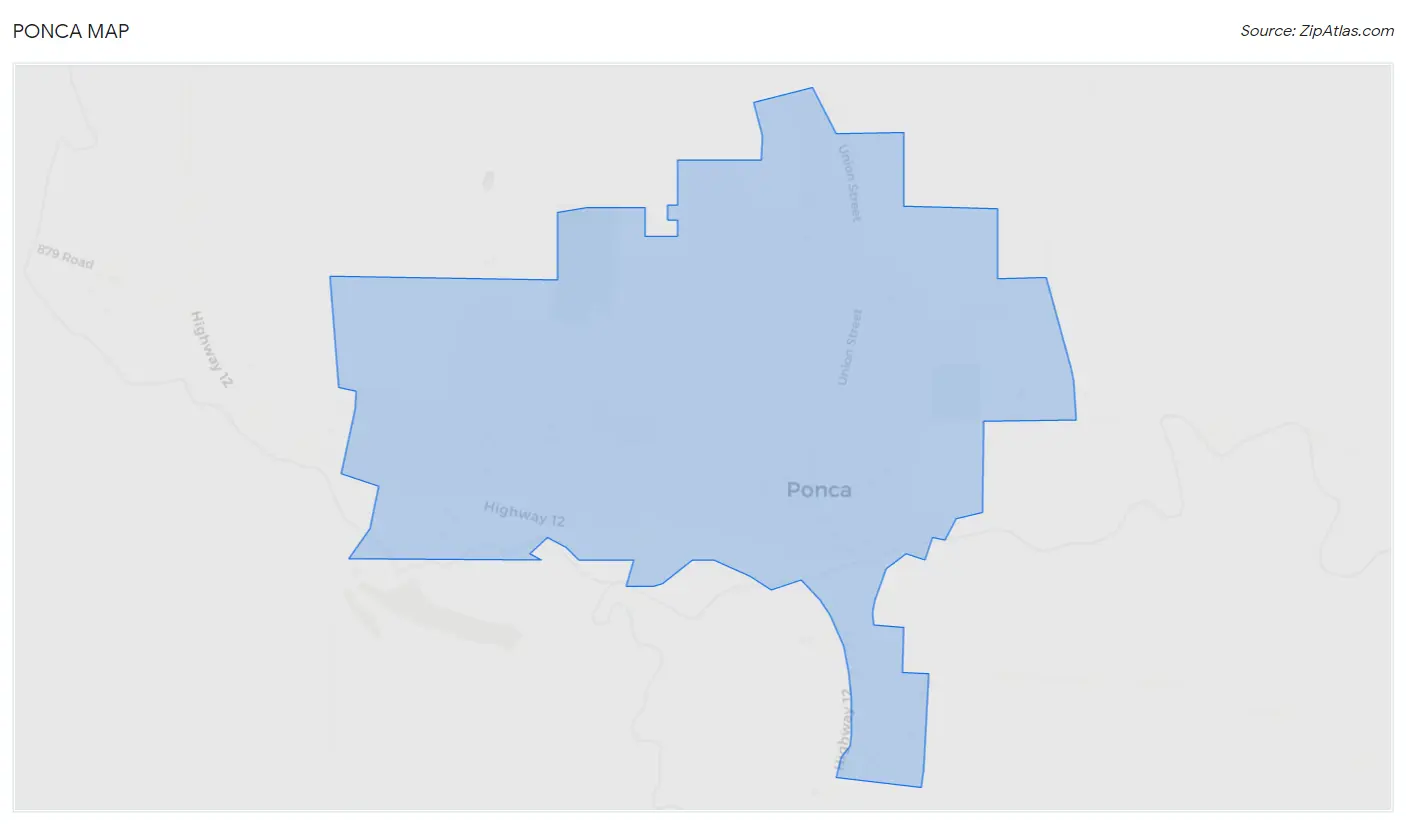
Ponca Map
Ponca Overview
$65,331
PER CAPITA INCOME
$105,156
AVG FAMILY INCOME
$58,542
AVG HOUSEHOLD INCOME
22.3%
WAGE / INCOME GAP [ % ]
77.7¢/ $1
WAGE / INCOME GAP [ $ ]
0.65
INEQUALITY / GINI INDEX
713
TOTAL POPULATION
396
MALE POPULATION
317
FEMALE POPULATION
124.92
MALES / 100 FEMALES
80.05
FEMALES / 100 MALES
40.8
MEDIAN AGE
3.1
AVG FAMILY SIZE
1.9
AVG HOUSEHOLD SIZE
391
LABOR FORCE [ PEOPLE ]
66.7%
PERCENT IN LABOR FORCE
4.6%
UNEMPLOYMENT RATE
Ponca Zip Codes
Ponca Area Codes
Income in Ponca
Income Overview in Ponca
Per Capita Income in Ponca is $65,331, while median incomes of families and households are $105,156 and $58,542 respectively.
| Characteristic | Number | Measure |
| Per Capita Income | 713 | $65,331 |
| Median Family Income | 147 | $105,156 |
| Mean Family Income | 147 | $123,893 |
| Median Household Income | 347 | $58,542 |
| Mean Household Income | 347 | $127,843 |
| Income Deficit | 147 | $0 |
| Wage / Income Gap (%) | 713 | 22.26% |
| Wage / Income Gap ($) | 713 | 77.74¢ per $1 |
| Gini / Inequality Index | 713 | 0.65 |
Earnings by Sex in Ponca
Average Earnings in Ponca are $38,482, $41,000 for men and $31,875 for women, a difference of 22.3%.
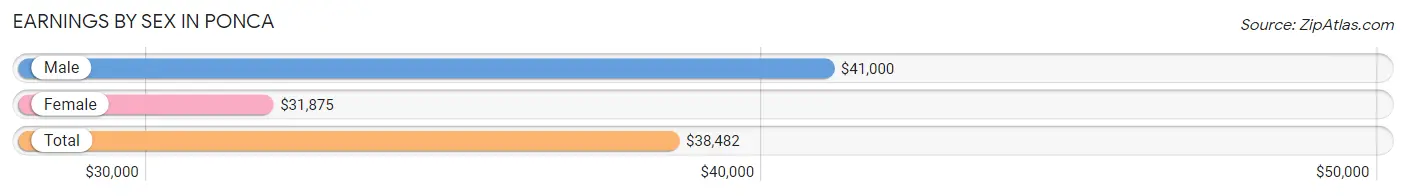
| Sex | Number | Average Earnings |
| Male | 224 (55.7%) | $41,000 |
| Female | 178 (44.3%) | $31,875 |
| Total | 402 (100.0%) | $38,482 |
Earnings by Sex by Income Bracket in Ponca
The most common earnings brackets in Ponca are $100,000+ for men (39 | 17.4%) and $45,000 to $49,999 for women (26 | 14.6%).
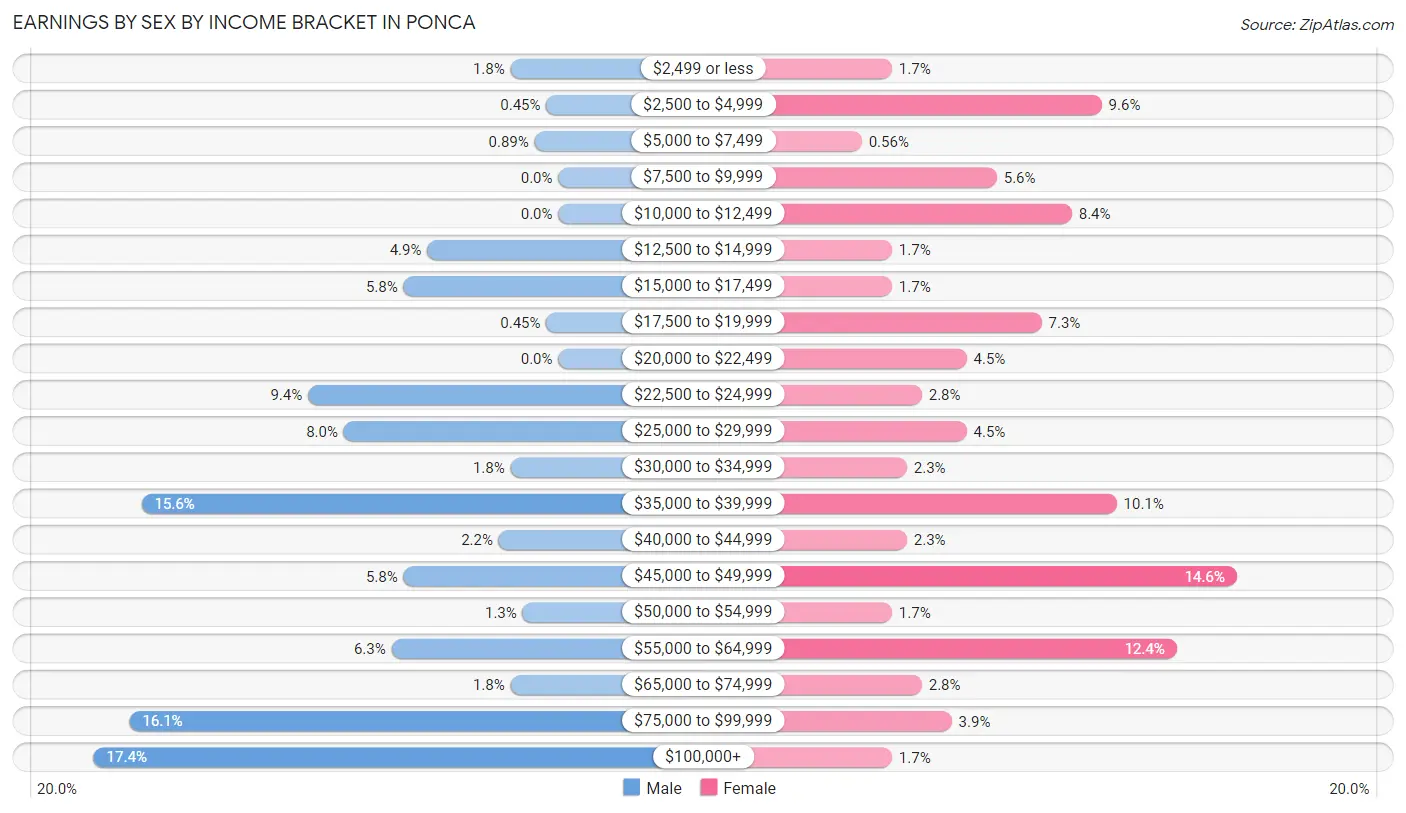
| Income | Male | Female |
| $2,499 or less | 4 (1.8%) | 3 (1.7%) |
| $2,500 to $4,999 | 1 (0.4%) | 17 (9.6%) |
| $5,000 to $7,499 | 2 (0.9%) | 1 (0.6%) |
| $7,500 to $9,999 | 0 (0.0%) | 10 (5.6%) |
| $10,000 to $12,499 | 0 (0.0%) | 15 (8.4%) |
| $12,500 to $14,999 | 11 (4.9%) | 3 (1.7%) |
| $15,000 to $17,499 | 13 (5.8%) | 3 (1.7%) |
| $17,500 to $19,999 | 1 (0.4%) | 13 (7.3%) |
| $20,000 to $22,499 | 0 (0.0%) | 8 (4.5%) |
| $22,500 to $24,999 | 21 (9.4%) | 5 (2.8%) |
| $25,000 to $29,999 | 18 (8.0%) | 8 (4.5%) |
| $30,000 to $34,999 | 4 (1.8%) | 4 (2.2%) |
| $35,000 to $39,999 | 35 (15.6%) | 18 (10.1%) |
| $40,000 to $44,999 | 5 (2.2%) | 4 (2.2%) |
| $45,000 to $49,999 | 13 (5.8%) | 26 (14.6%) |
| $50,000 to $54,999 | 3 (1.3%) | 3 (1.7%) |
| $55,000 to $64,999 | 14 (6.2%) | 22 (12.4%) |
| $65,000 to $74,999 | 4 (1.8%) | 5 (2.8%) |
| $75,000 to $99,999 | 36 (16.1%) | 7 (3.9%) |
| $100,000+ | 39 (17.4%) | 3 (1.7%) |
| Total | 224 (100.0%) | 178 (100.0%) |
Earnings by Sex by Educational Attainment in Ponca
Average earnings in Ponca are $48,438 for men and $36,181 for women, a difference of 25.3%. Men with an educational attainment of college or associate's degree enjoy the highest average annual earnings of $83,750, while those with less than high school education earn the least with $23,750. Women with an educational attainment of bachelor's degree earn the most with the average annual earnings of $47,614, while those with high school diploma education have the smallest earnings of $19,750.
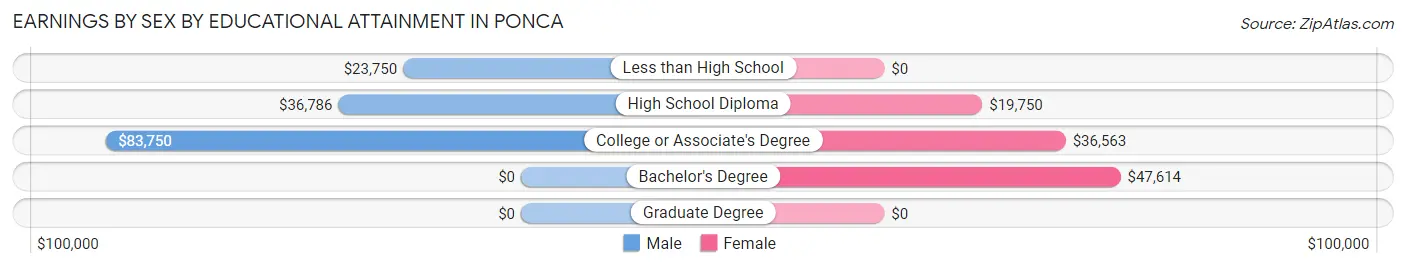
| Educational Attainment | Male Income | Female Income |
| Less than High School | $23,750 | $0 |
| High School Diploma | $36,786 | $19,750 |
| College or Associate's Degree | $83,750 | $36,563 |
| Bachelor's Degree | - | - |
| Graduate Degree | - | - |
| Total | $48,438 | $36,181 |
Family Income in Ponca
Family Income Brackets in Ponca
According to the Ponca family income data, there are 56 families falling into the $100,000 to $149,999 income range, which is the most common income bracket and makes up 38.1% of all families.
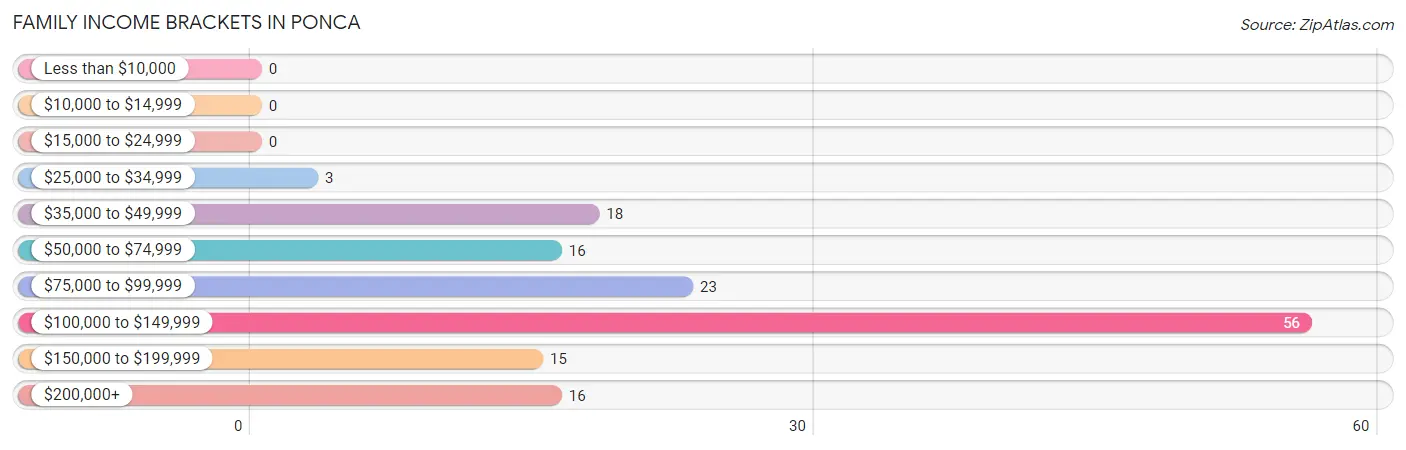
| Income Bracket | # Families | % Families |
| Less than $10,000 | 0 | 0.0% |
| $10,000 to $14,999 | 0 | 0.0% |
| $15,000 to $24,999 | 0 | 0.0% |
| $25,000 to $34,999 | 3 | 2.0% |
| $35,000 to $49,999 | 18 | 12.2% |
| $50,000 to $74,999 | 16 | 10.9% |
| $75,000 to $99,999 | 23 | 15.6% |
| $100,000 to $149,999 | 56 | 38.1% |
| $150,000 to $199,999 | 15 | 10.2% |
| $200,000+ | 16 | 10.9% |
Family Income by Famaliy Size in Ponca
5-person families (7 | 4.8%) account for the highest median family income in Ponca with $185,313 per family, while 2-person families (91 | 61.9%) have the highest median income of $51,534 per family member.
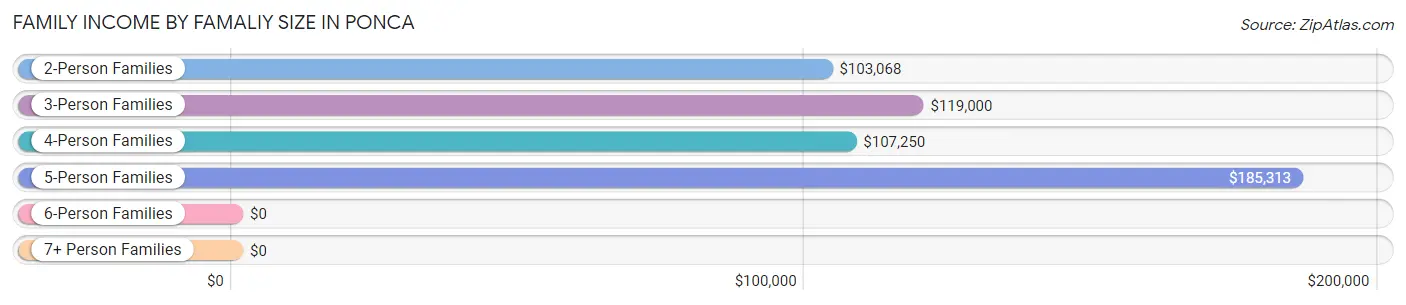
| Income Bracket | # Families | Median Income |
| 2-Person Families | 91 (61.9%) | $103,068 |
| 3-Person Families | 12 (8.2%) | $119,000 |
| 4-Person Families | 27 (18.4%) | $107,250 |
| 5-Person Families | 7 (4.8%) | $185,313 |
| 6-Person Families | 10 (6.8%) | $0 |
| 7+ Person Families | 0 (0.0%) | $0 |
| Total | 147 (100.0%) | $105,156 |
Family Income by Number of Earners in Ponca
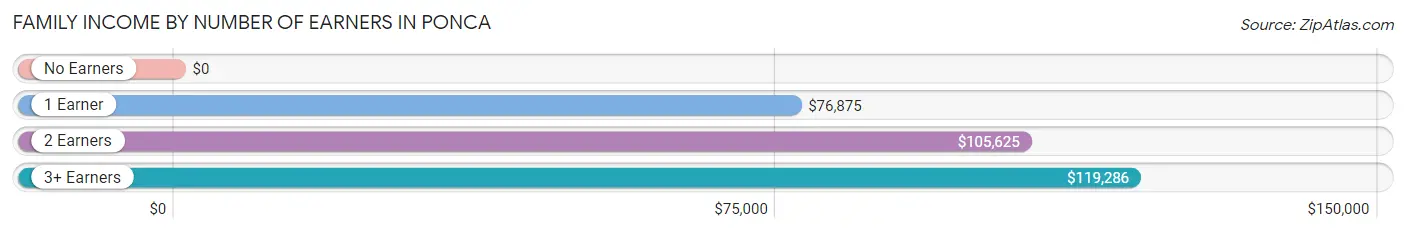
| Number of Earners | # Families | Median Income |
| No Earners | 5 (3.4%) | $0 |
| 1 Earner | 42 (28.6%) | $76,875 |
| 2 Earners | 80 (54.4%) | $105,625 |
| 3+ Earners | 20 (13.6%) | $119,286 |
| Total | 147 (100.0%) | $105,156 |
Household Income in Ponca
Household Income Brackets in Ponca
With 62 households falling in the category, the $100,000 to $149,999 income range is the most frequent in Ponca, accounting for 17.9% of all households. In contrast, only 12 households (3.5%) fall into the less than $10,000 income bracket, making it the least populous group.
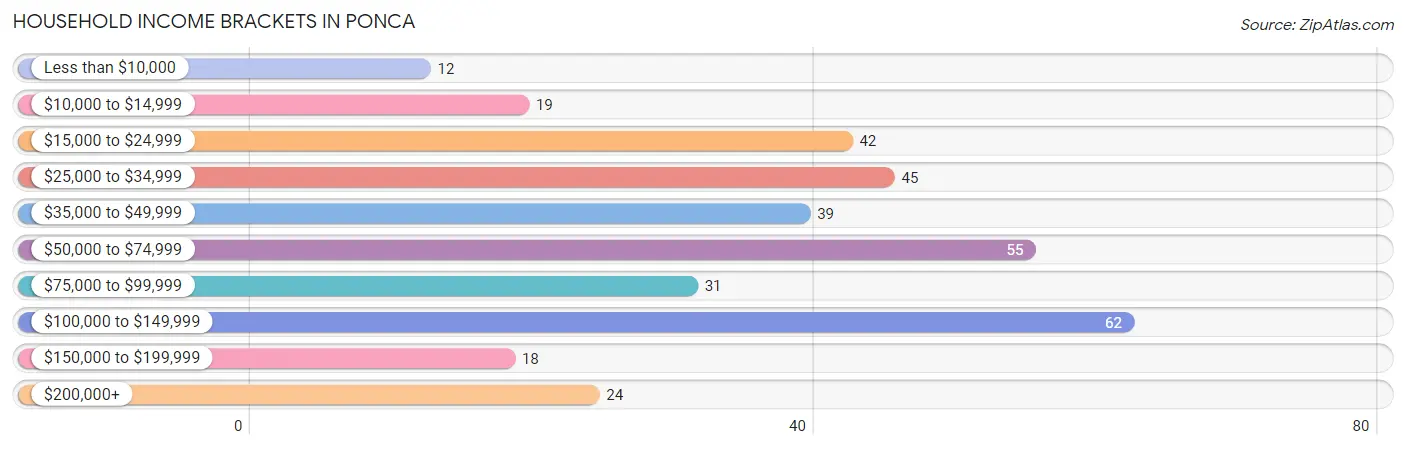
| Income Bracket | # Households | % Households |
| Less than $10,000 | 12 | 3.5% |
| $10,000 to $14,999 | 19 | 5.5% |
| $15,000 to $24,999 | 42 | 12.1% |
| $25,000 to $34,999 | 45 | 13.0% |
| $35,000 to $49,999 | 39 | 11.2% |
| $50,000 to $74,999 | 55 | 15.9% |
| $75,000 to $99,999 | 31 | 8.9% |
| $100,000 to $149,999 | 62 | 17.9% |
| $150,000 to $199,999 | 18 | 5.2% |
| $200,000+ | 24 | 6.9% |
Household Income by Householder Age in Ponca
The median household income in Ponca is $58,542, with the highest median household income of $96,563 found in the 25 to 44 years age bracket for the primary householder. A total of 105 households (30.3%) fall into this category. Meanwhile, the 15 to 24 years age bracket for the primary householder has the lowest median household income of $0, with 24 households (6.9%) in this group.
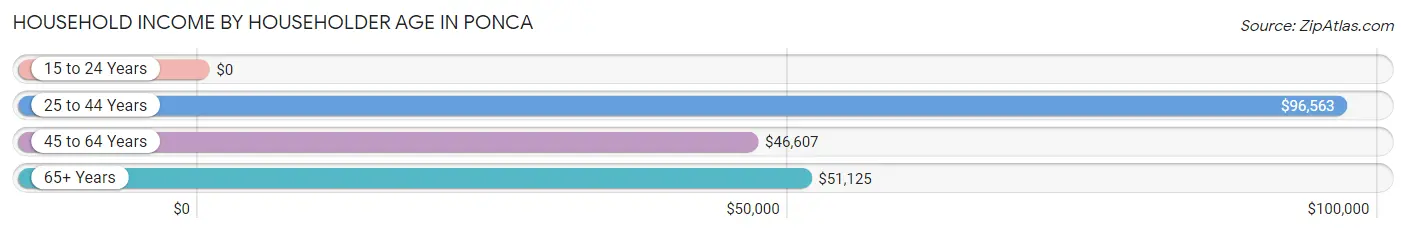
| Income Bracket | # Households | Median Income |
| 15 to 24 Years | 24 (6.9%) | $0 |
| 25 to 44 Years | 105 (30.3%) | $96,563 |
| 45 to 64 Years | 99 (28.5%) | $46,607 |
| 65+ Years | 119 (34.3%) | $51,125 |
| Total | 347 (100.0%) | $58,542 |
Poverty in Ponca
Income Below Poverty by Sex and Age in Ponca
With 7.3% poverty level for males and 2.9% for females among the residents of Ponca, 18 to 24 year old males and 18 to 24 year old females are the most vulnerable to poverty, with 8 males (21.0%) and 9 females (47.4%) in their respective age groups living below the poverty level.
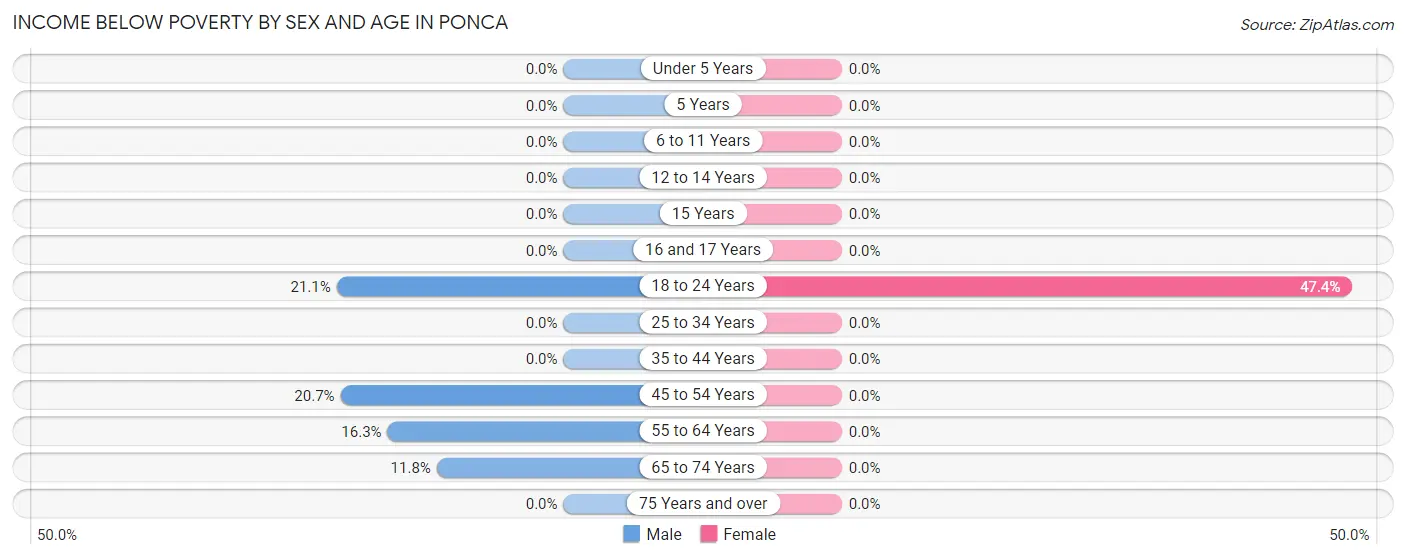
| Age Bracket | Male | Female |
| Under 5 Years | 0 (0.0%) | 0 (0.0%) |
| 5 Years | 0 (0.0%) | 0 (0.0%) |
| 6 to 11 Years | 0 (0.0%) | 0 (0.0%) |
| 12 to 14 Years | 0 (0.0%) | 0 (0.0%) |
| 15 Years | 0 (0.0%) | 0 (0.0%) |
| 16 and 17 Years | 0 (0.0%) | 0 (0.0%) |
| 18 to 24 Years | 8 (21.0%) | 9 (47.4%) |
| 25 to 34 Years | 0 (0.0%) | 0 (0.0%) |
| 35 to 44 Years | 0 (0.0%) | 0 (0.0%) |
| 45 to 54 Years | 6 (20.7%) | 0 (0.0%) |
| 55 to 64 Years | 8 (16.3%) | 0 (0.0%) |
| 65 to 74 Years | 4 (11.8%) | 0 (0.0%) |
| 75 Years and over | 0 (0.0%) | 0 (0.0%) |
| Total | 26 (7.3%) | 9 (2.9%) |
Income Above Poverty by Sex and Age in Ponca
According to the poverty statistics in Ponca, males aged under 5 years and females aged under 5 years are the age groups that are most secure financially, with 100.0% of males and 100.0% of females in these age groups living above the poverty line.
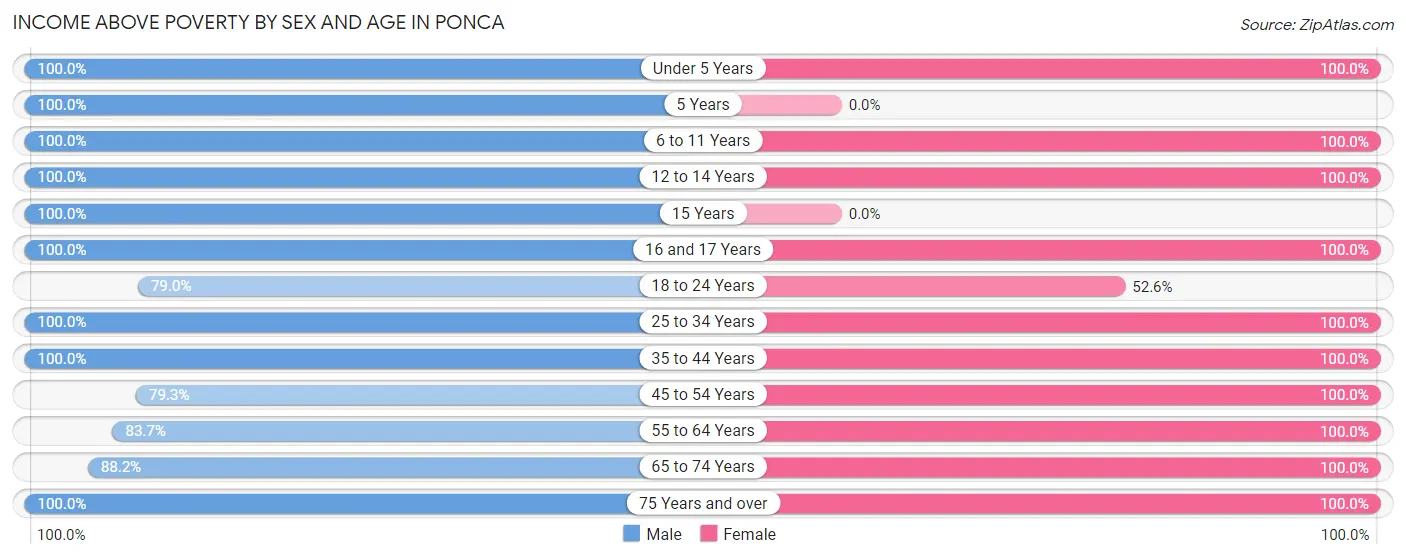
| Age Bracket | Male | Female |
| Under 5 Years | 41 (100.0%) | 30 (100.0%) |
| 5 Years | 12 (100.0%) | 0 (0.0%) |
| 6 to 11 Years | 22 (100.0%) | 5 (100.0%) |
| 12 to 14 Years | 8 (100.0%) | 4 (100.0%) |
| 15 Years | 5 (100.0%) | 0 (0.0%) |
| 16 and 17 Years | 2 (100.0%) | 8 (100.0%) |
| 18 to 24 Years | 30 (78.9%) | 10 (52.6%) |
| 25 to 34 Years | 43 (100.0%) | 44 (100.0%) |
| 35 to 44 Years | 50 (100.0%) | 41 (100.0%) |
| 45 to 54 Years | 23 (79.3%) | 23 (100.0%) |
| 55 to 64 Years | 41 (83.7%) | 40 (100.0%) |
| 65 to 74 Years | 30 (88.2%) | 23 (100.0%) |
| 75 Years and over | 21 (100.0%) | 69 (100.0%) |
| Total | 328 (92.7%) | 297 (97.1%) |
Income Below Poverty Among Married-Couple Families in Ponca
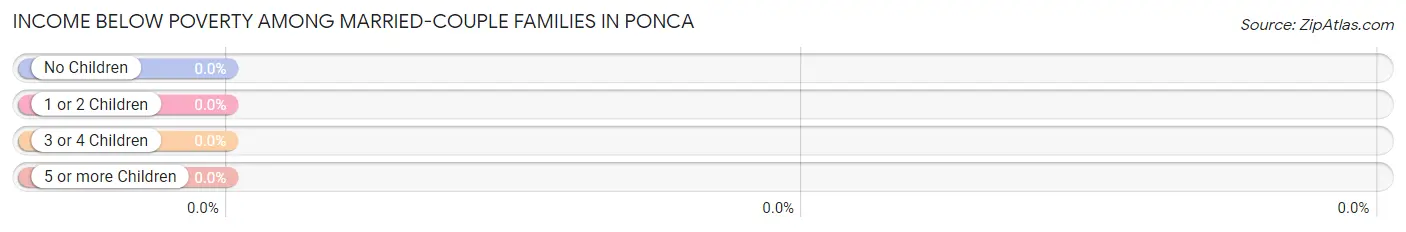
| Children | Above Poverty | Below Poverty |
| No Children | 91 (100.0%) | 0 (0.0%) |
| 1 or 2 Children | 30 (100.0%) | 0 (0.0%) |
| 3 or 4 Children | 14 (100.0%) | 0 (0.0%) |
| 5 or more Children | 0 (0.0%) | 0 (0.0%) |
| Total | 135 (100.0%) | 0 (0.0%) |
Income Below Poverty Among Single-Parent Households in Ponca
| Children | Single Father | Single Mother |
| No Children | 0 (0.0%) | 0 (0.0%) |
| 1 or 2 Children | 0 (0.0%) | 0 (0.0%) |
| 3 or 4 Children | 0 (0.0%) | 0 (0.0%) |
| 5 or more Children | 0 (0.0%) | 0 (0.0%) |
| Total | 0 (0.0%) | 0 (0.0%) |
Income Below Poverty Among Married-Couple vs Single-Parent Households in Ponca
| Children | Married-Couple Families | Single-Parent Households |
| No Children | 0 (0.0%) | 0 (0.0%) |
| 1 or 2 Children | 0 (0.0%) | 0 (0.0%) |
| 3 or 4 Children | 0 (0.0%) | 0 (0.0%) |
| 5 or more Children | 0 (0.0%) | 0 (0.0%) |
| Total | 0 (0.0%) | 0 (0.0%) |
Race in Ponca
The most populous races in Ponca are White / Caucasian (677 | 95.0%), Hispanic or Latino (42 | 5.9%), and Two or more Races (22 | 3.1%).
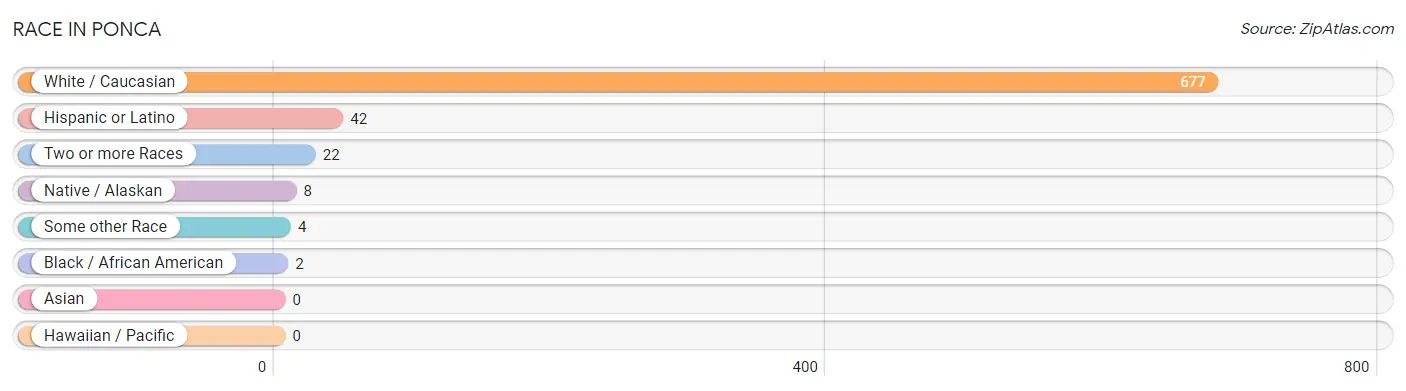
| Race | # Population | % Population |
| Asian | 0 | 0.0% |
| Black / African American | 2 | 0.3% |
| Hawaiian / Pacific | 0 | 0.0% |
| Hispanic or Latino | 42 | 5.9% |
| Native / Alaskan | 8 | 1.1% |
| White / Caucasian | 677 | 95.0% |
| Two or more Races | 22 | 3.1% |
| Some other Race | 4 | 0.6% |
| Total | 713 | 100.0% |
Ancestry in Ponca
The most populous ancestries reported in Ponca are German (362 | 50.8%), Irish (159 | 22.3%), Norwegian (72 | 10.1%), English (62 | 8.7%), and Swedish (37 | 5.2%), together accounting for 97.1% of all Ponca residents.
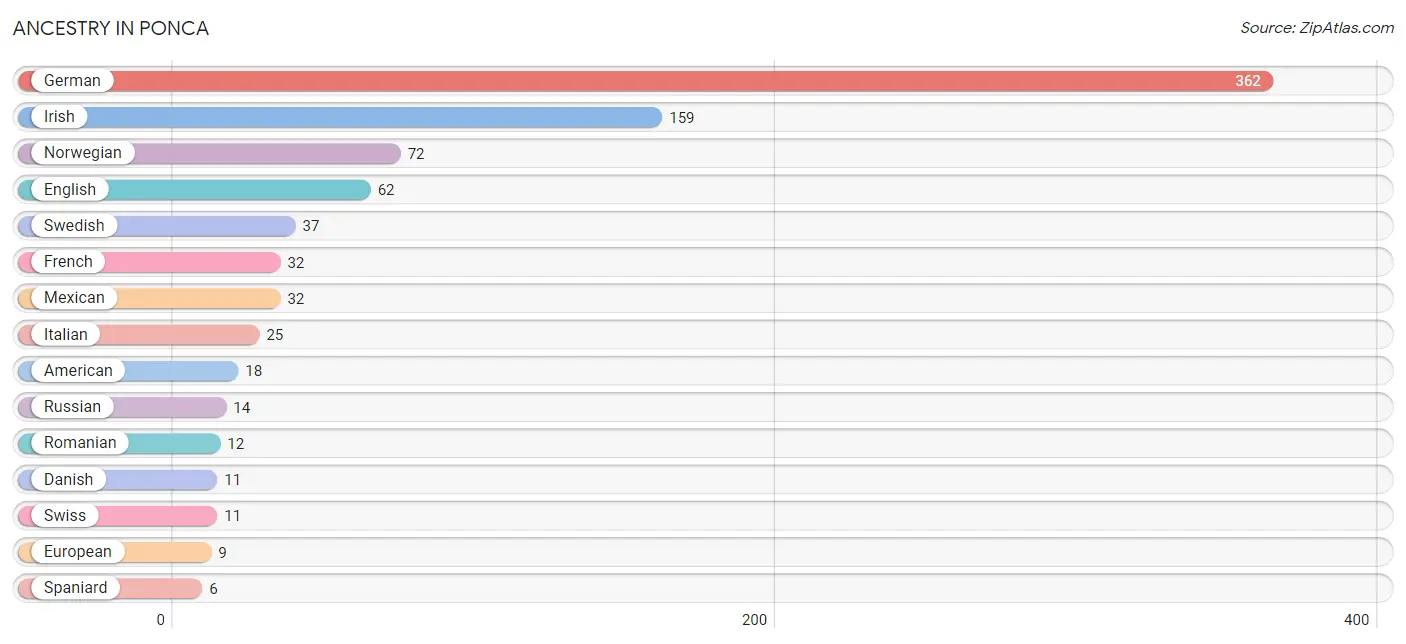
| Ancestry | # Population | % Population |
| American | 18 | 2.5% |
| British | 3 | 0.4% |
| Central American | 1 | 0.1% |
| Cherokee | 3 | 0.4% |
| Czech | 5 | 0.7% |
| Danish | 11 | 1.5% |
| Dutch | 2 | 0.3% |
| English | 62 | 8.7% |
| European | 9 | 1.3% |
| French | 32 | 4.5% |
| German | 362 | 50.8% |
| Guatemalan | 1 | 0.1% |
| Irish | 159 | 22.3% |
| Italian | 25 | 3.5% |
| Mexican | 32 | 4.5% |
| Nigerian | 1 | 0.1% |
| Norwegian | 72 | 10.1% |
| Portuguese | 4 | 0.6% |
| Potawatomi | 1 | 0.1% |
| Romanian | 12 | 1.7% |
| Russian | 14 | 2.0% |
| Scandinavian | 3 | 0.4% |
| Scottish | 2 | 0.3% |
| Sioux | 2 | 0.3% |
| Spaniard | 6 | 0.8% |
| Subsaharan African | 1 | 0.1% |
| Swedish | 37 | 5.2% |
| Swiss | 11 | 1.5% | View All 28 Rows |
Immigrants in Ponca
The most numerous immigrant groups reported in Ponca came from Central America (6 | 0.8%), Latin America (6 | 0.8%), Mexico (5 | 0.7%), Africa (1 | 0.1%), and Guatemala (1 | 0.1%), together accounting for 2.7% of all Ponca residents.
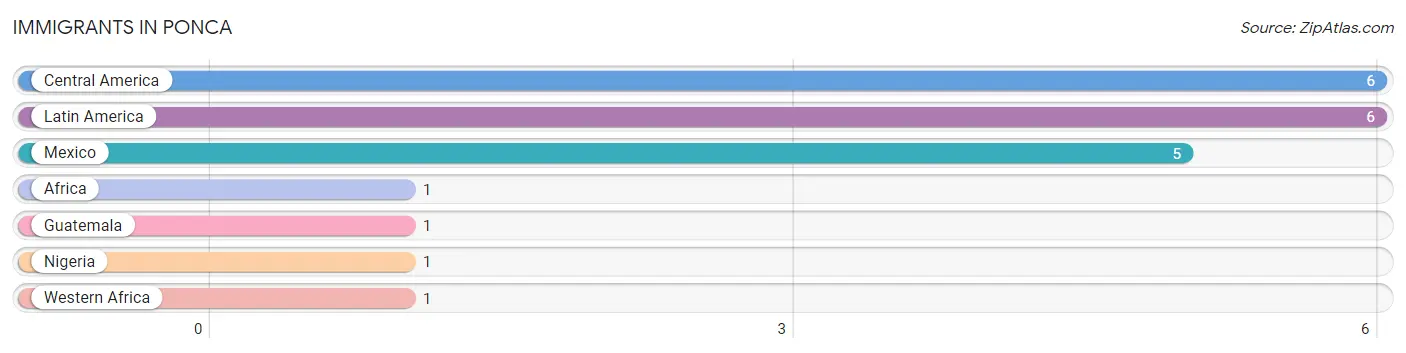
| Immigration Origin | # Population | % Population |
| Africa | 1 | 0.1% |
| Central America | 6 | 0.8% |
| Guatemala | 1 | 0.1% |
| Latin America | 6 | 0.8% |
| Mexico | 5 | 0.7% |
| Nigeria | 1 | 0.1% |
| Western Africa | 1 | 0.1% | View All 7 Rows |
Sex and Age in Ponca
Sex and Age in Ponca
The most populous age groups in Ponca are Under 5 Years (41 | 10.3%) for men and 80 to 84 Years (42 | 13.3%) for women.
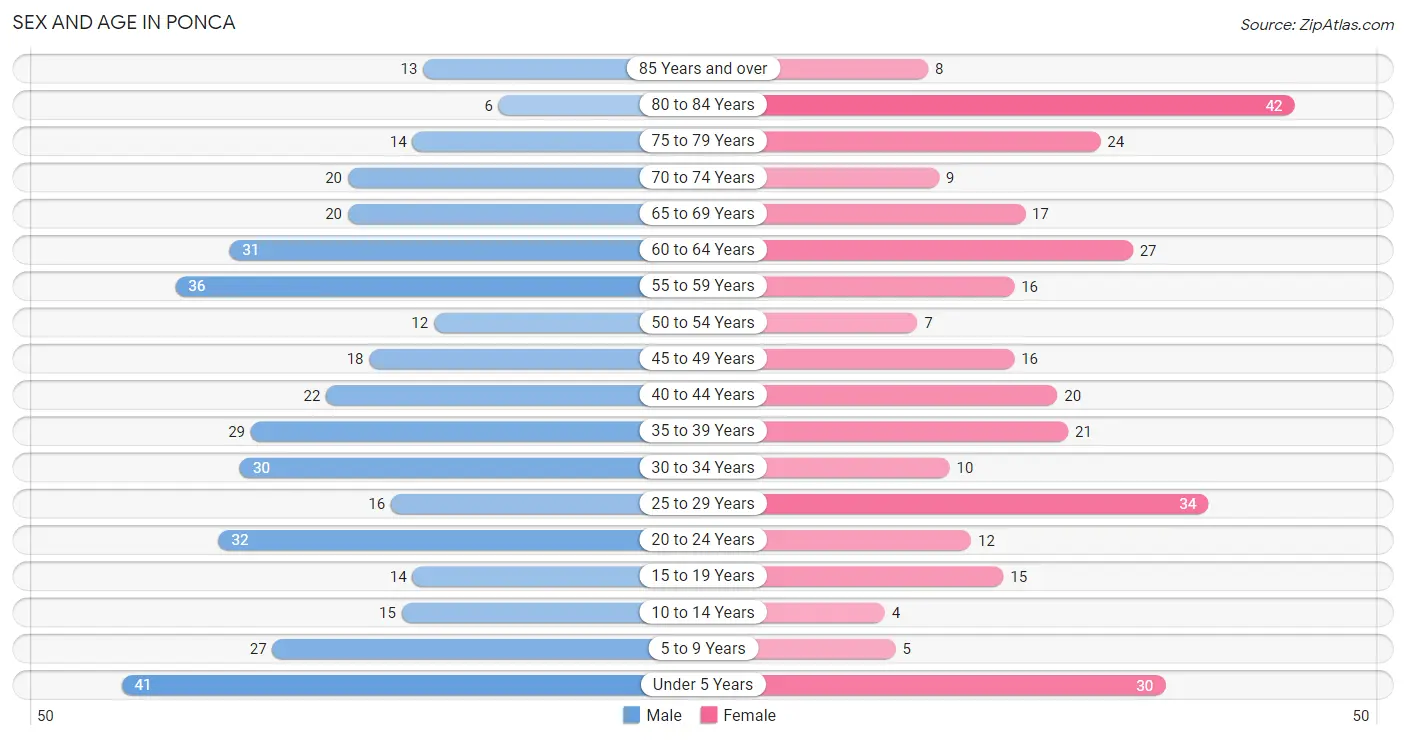
| Age Bracket | Male | Female |
| Under 5 Years | 41 (10.3%) | 30 (9.5%) |
| 5 to 9 Years | 27 (6.8%) | 5 (1.6%) |
| 10 to 14 Years | 15 (3.8%) | 4 (1.3%) |
| 15 to 19 Years | 14 (3.5%) | 15 (4.7%) |
| 20 to 24 Years | 32 (8.1%) | 12 (3.8%) |
| 25 to 29 Years | 16 (4.0%) | 34 (10.7%) |
| 30 to 34 Years | 30 (7.6%) | 10 (3.2%) |
| 35 to 39 Years | 29 (7.3%) | 21 (6.6%) |
| 40 to 44 Years | 22 (5.6%) | 20 (6.3%) |
| 45 to 49 Years | 18 (4.5%) | 16 (5.1%) |
| 50 to 54 Years | 12 (3.0%) | 7 (2.2%) |
| 55 to 59 Years | 36 (9.1%) | 16 (5.1%) |
| 60 to 64 Years | 31 (7.8%) | 27 (8.5%) |
| 65 to 69 Years | 20 (5.1%) | 17 (5.4%) |
| 70 to 74 Years | 20 (5.1%) | 9 (2.8%) |
| 75 to 79 Years | 14 (3.5%) | 24 (7.6%) |
| 80 to 84 Years | 6 (1.5%) | 42 (13.3%) |
| 85 Years and over | 13 (3.3%) | 8 (2.5%) |
| Total | 396 (100.0%) | 317 (100.0%) |
Families and Households in Ponca
Median Family Size in Ponca
The median family size in Ponca is 3.10 persons per family, with single female/mother families (7 | 4.8%) accounting for the largest median family size of 5.57 persons per family. On the other hand, single male/father families (5 | 3.4%) represent the smallest median family size with 2.40 persons per family.
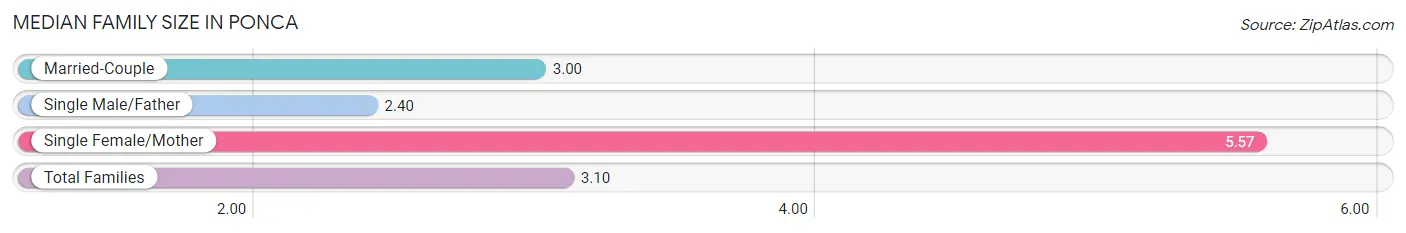
| Family Type | # Families | Family Size |
| Married-Couple | 135 (91.8%) | 3.00 |
| Single Male/Father | 5 (3.4%) | 2.40 |
| Single Female/Mother | 7 (4.8%) | 5.57 |
| Total Families | 147 (100.0%) | 3.10 |
Median Household Size in Ponca
The median household size in Ponca is 1.90 persons per household, with single female/mother households (7 | 2.0%) accounting for the largest median household size of 5.57 persons per household. non-family households (200 | 57.6%) represent the smallest median household size with 1.02 persons per household.
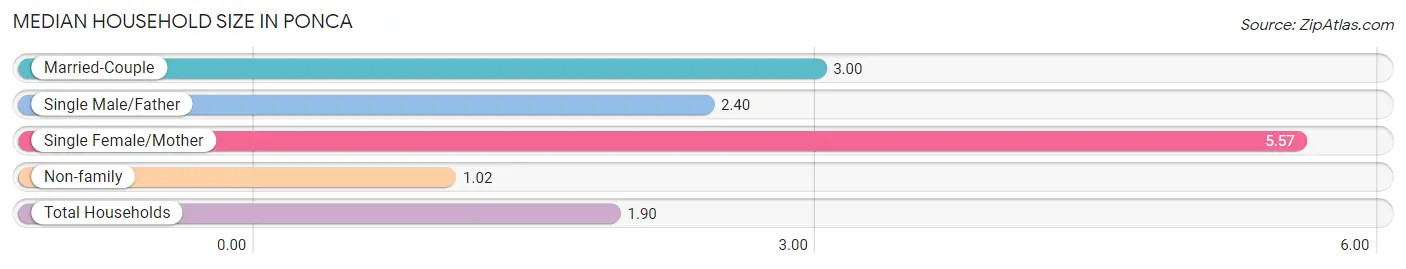
| Household Type | # Households | Household Size |
| Married-Couple | 135 (38.9%) | 3.00 |
| Single Male/Father | 5 (1.4%) | 2.40 |
| Single Female/Mother | 7 (2.0%) | 5.57 |
| Non-family | 200 (57.6%) | 1.02 |
| Total Households | 347 (100.0%) | 1.90 |
Household Size by Marriage Status in Ponca
Out of a total of 347 households in Ponca, 147 (42.4%) are family households, while 200 (57.6%) are nonfamily households. The most numerous type of family households are 2-person households, comprising 91, and the most common type of nonfamily households are 1-person households, comprising 194.
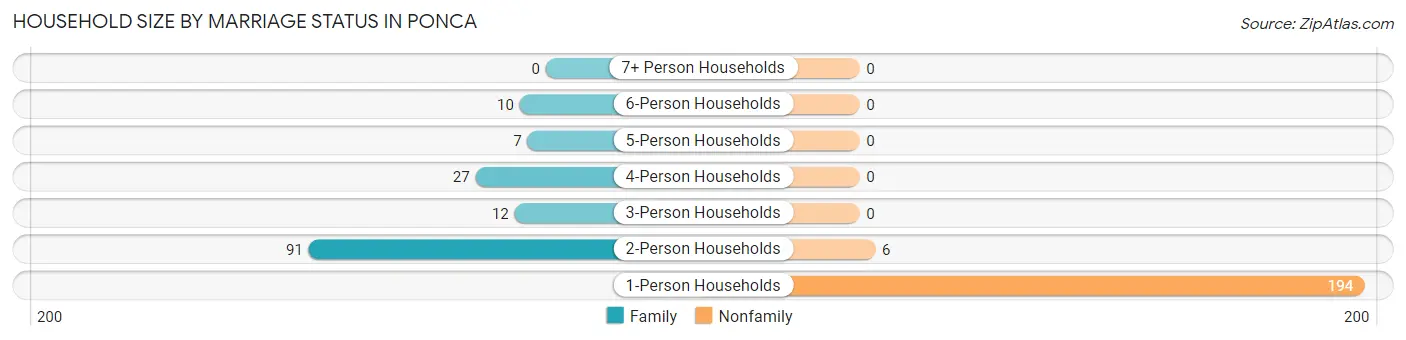
| Household Size | Family Households | Nonfamily Households |
| 1-Person Households | - | 194 (55.9%) |
| 2-Person Households | 91 (26.2%) | 6 (1.7%) |
| 3-Person Households | 12 (3.5%) | 0 (0.0%) |
| 4-Person Households | 27 (7.8%) | 0 (0.0%) |
| 5-Person Households | 7 (2.0%) | 0 (0.0%) |
| 6-Person Households | 10 (2.9%) | 0 (0.0%) |
| 7+ Person Households | 0 (0.0%) | 0 (0.0%) |
| Total | 147 (42.4%) | 200 (57.6%) |
Female Fertility in Ponca
Fertility by Age in Ponca
Average fertility rate in Ponca is 55.0 births per 1,000 women. Women in the age bracket of 20 to 34 years have the highest fertility rate with 125.0 births per 1,000 women. Women in the age bracket of 20 to 34 years acount for 100.0% of all women with births.
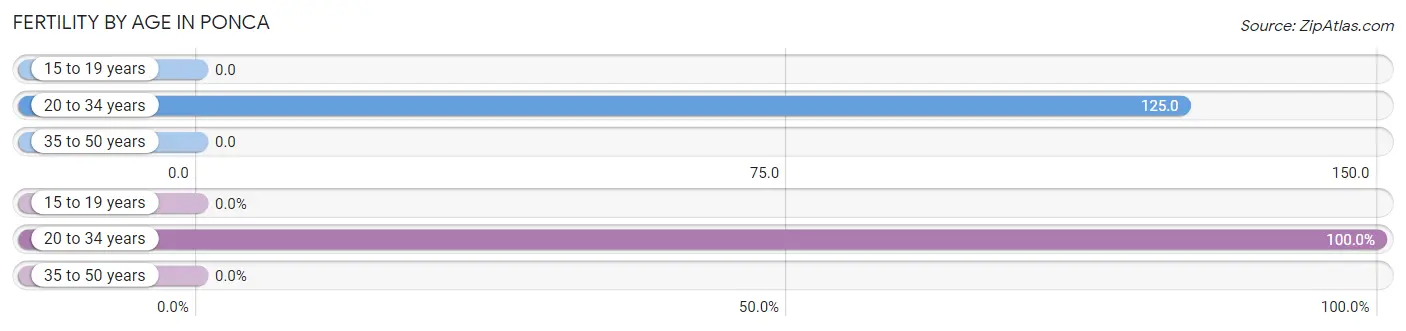
| Age Bracket | Women with Births | Births / 1,000 Women |
| 15 to 19 years | 0 (0.0%) | 0.0 |
| 20 to 34 years | 7 (100.0%) | 125.0 |
| 35 to 50 years | 0 (0.0%) | 0.0 |
| Total | 7 (100.0%) | 55.0 |
Fertility by Age by Marriage Status in Ponca
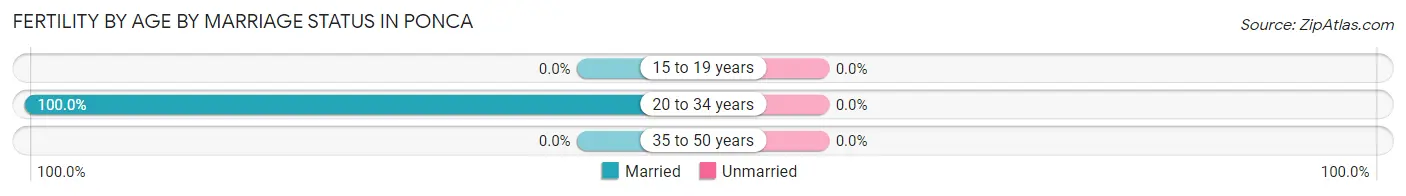
| Age Bracket | Married | Unmarried |
| 15 to 19 years | 0 (0.0%) | 0 (0.0%) |
| 20 to 34 years | 7 (100.0%) | 0 (0.0%) |
| 35 to 50 years | 0 (0.0%) | 0 (0.0%) |
| Total | 7 (100.0%) | 0 (0.0%) |
Fertility by Education in Ponca
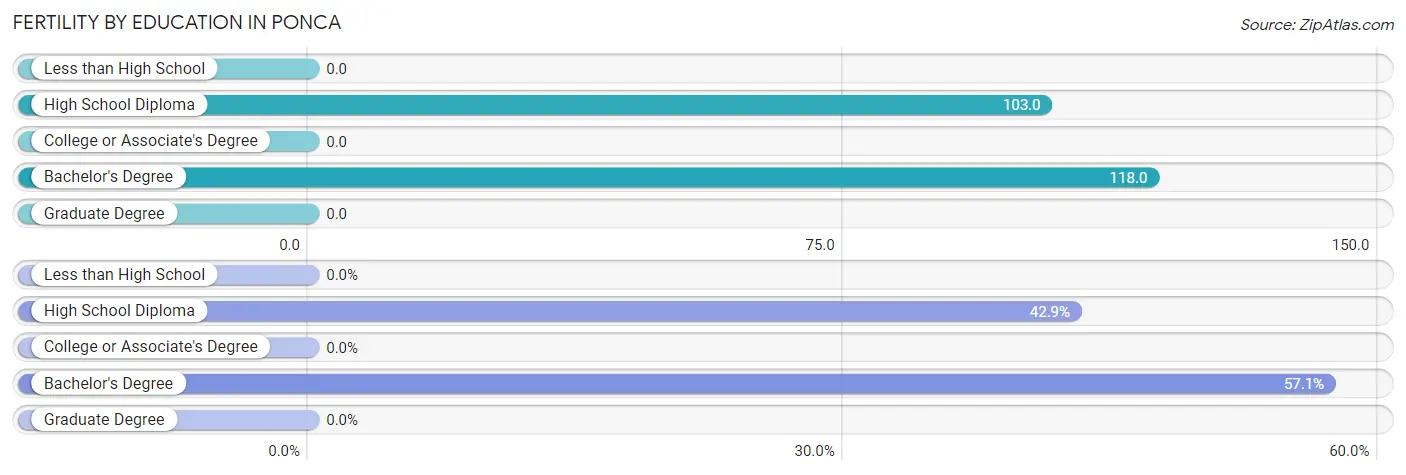
| Educational Attainment | Women with Births | Births / 1,000 Women |
| Less than High School | 0 (0.0%) | 0.0 |
| High School Diploma | 3 (42.9%) | 103.0 |
| College or Associate's Degree | 0 (0.0%) | 0.0 |
| Bachelor's Degree | 4 (57.1%) | 118.0 |
| Graduate Degree | 0 (0.0%) | 0.0 |
| Total | 7 (100.0%) | 55.0 |
Fertility by Education by Marriage Status in Ponca
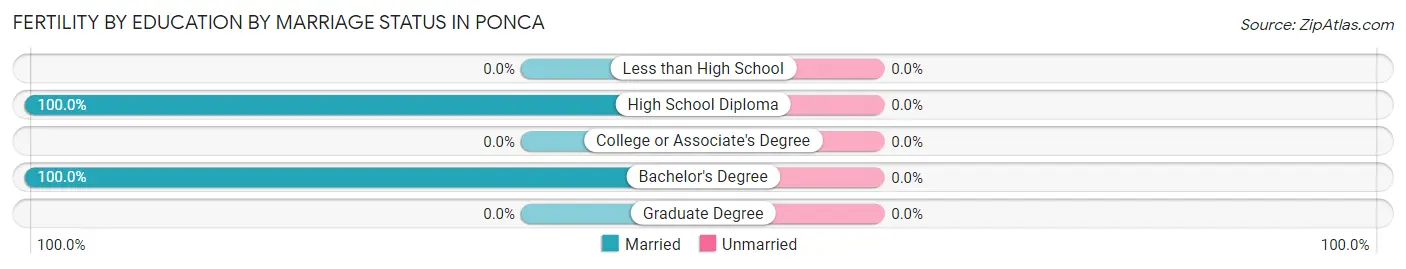
| Educational Attainment | Married | Unmarried |
| Less than High School | 0 (0.0%) | 0 (0.0%) |
| High School Diploma | 3 (100.0%) | 0 (0.0%) |
| College or Associate's Degree | 0 (0.0%) | 0 (0.0%) |
| Bachelor's Degree | 4 (100.0%) | 0 (0.0%) |
| Graduate Degree | 0 (0.0%) | 0 (0.0%) |
| Total | 7 (100.0%) | 0 (0.0%) |
Employment Characteristics in Ponca
Employment by Class of Employer in Ponca
Among the 370 employed individuals in Ponca, private company employees (222 | 60.0%), not-for-profit organizations (45 | 12.2%), and self-employed (not incorporated) (37 | 10.0%) make up the most common classes of employment.
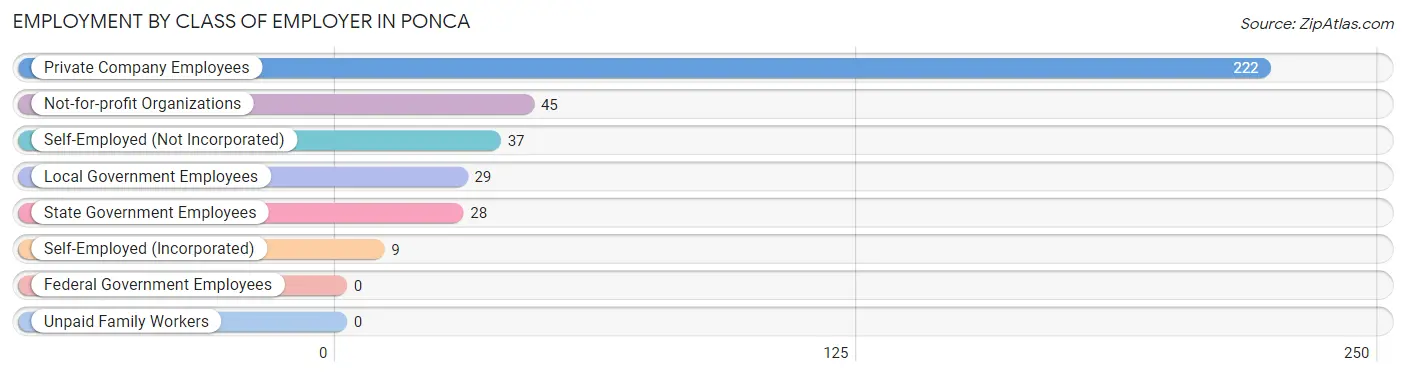
| Employer Class | # Employees | % Employees |
| Private Company Employees | 222 | 60.0% |
| Self-Employed (Incorporated) | 9 | 2.4% |
| Self-Employed (Not Incorporated) | 37 | 10.0% |
| Not-for-profit Organizations | 45 | 12.2% |
| Local Government Employees | 29 | 7.8% |
| State Government Employees | 28 | 7.6% |
| Federal Government Employees | 0 | 0.0% |
| Unpaid Family Workers | 0 | 0.0% |
| Total | 370 | 100.0% |
Employment Status by Age in Ponca
According to the labor force statistics for Ponca, out of the total population over 16 years of age (586), 66.7% or 391 individuals are in the labor force, with 4.6% or 18 of them unemployed. The age group with the highest labor force participation rate is 20 to 24 years, with 97.7% or 43 individuals in the labor force. Within the labor force, the 16 to 19 years age range has the highest percentage of unemployed individuals, with 57.9% or 11 of them being unemployed.
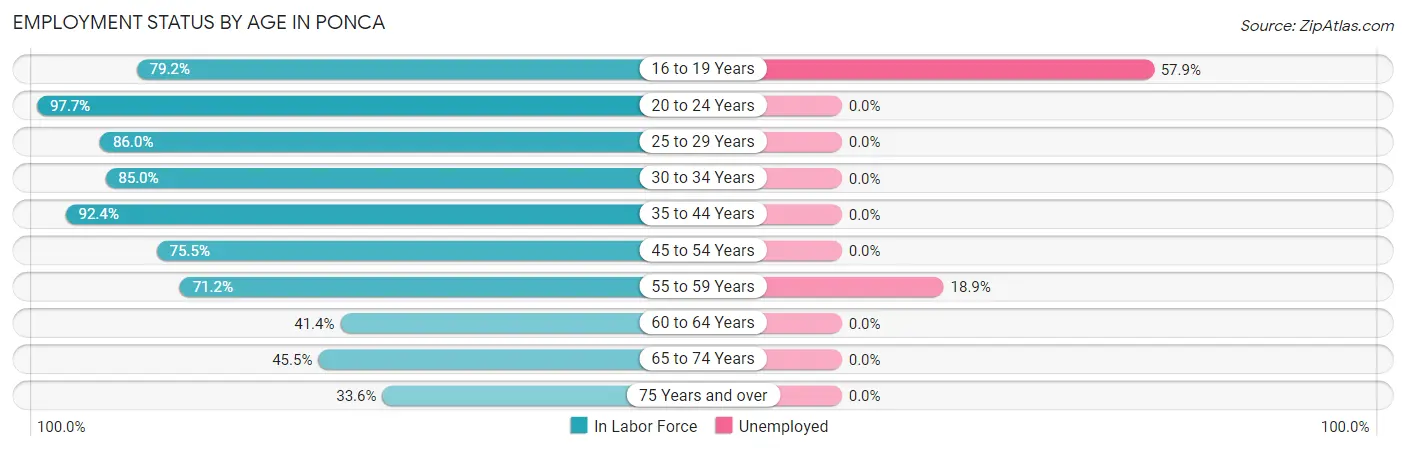
| Age Bracket | In Labor Force | Unemployed |
| 16 to 19 Years | 19 (79.2%) | 11 (57.9%) |
| 20 to 24 Years | 43 (97.7%) | 0 (0.0%) |
| 25 to 29 Years | 43 (86.0%) | 0 (0.0%) |
| 30 to 34 Years | 34 (85.0%) | 0 (0.0%) |
| 35 to 44 Years | 85 (92.4%) | 0 (0.0%) |
| 45 to 54 Years | 40 (75.5%) | 0 (0.0%) |
| 55 to 59 Years | 37 (71.2%) | 7 (18.9%) |
| 60 to 64 Years | 24 (41.4%) | 0 (0.0%) |
| 65 to 74 Years | 30 (45.5%) | 0 (0.0%) |
| 75 Years and over | 36 (33.6%) | 0 (0.0%) |
| Total | 391 (66.7%) | 18 (4.6%) |
Employment Status by Educational Attainment in Ponca
According to labor force statistics for Ponca, 76.2% of individuals (263) out of the total population between 25 and 64 years of age (345) are in the labor force, with 2.7% or 7 of them being unemployed. The group with the highest labor force participation rate are those with the educational attainment of less than high school, with 90.9% or 20 individuals in the labor force. Within the labor force, individuals with high school diploma education have the highest percentage of unemployment, with 9.0% or 7 of them being unemployed.
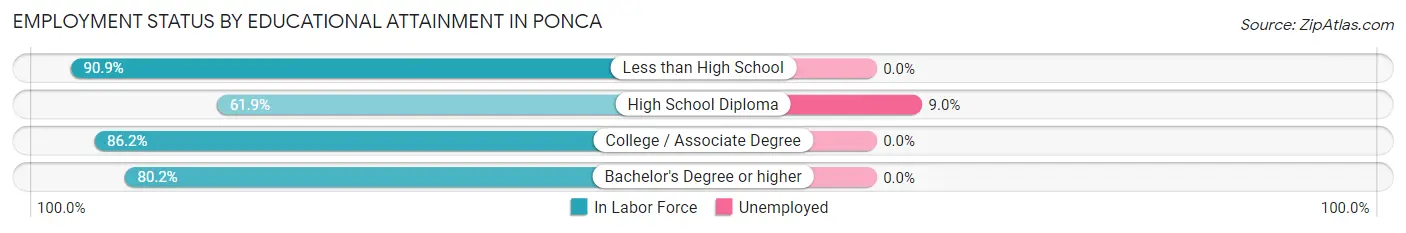
| Educational Attainment | In Labor Force | Unemployed |
| Less than High School | 20 (90.9%) | 0 (0.0%) |
| High School Diploma | 78 (61.9%) | 11 (9.0%) |
| College / Associate Degree | 100 (86.2%) | 0 (0.0%) |
| Bachelor's Degree or higher | 65 (80.2%) | 0 (0.0%) |
| Total | 263 (76.2%) | 9 (2.7%) |
Employment Occupations by Sex in Ponca
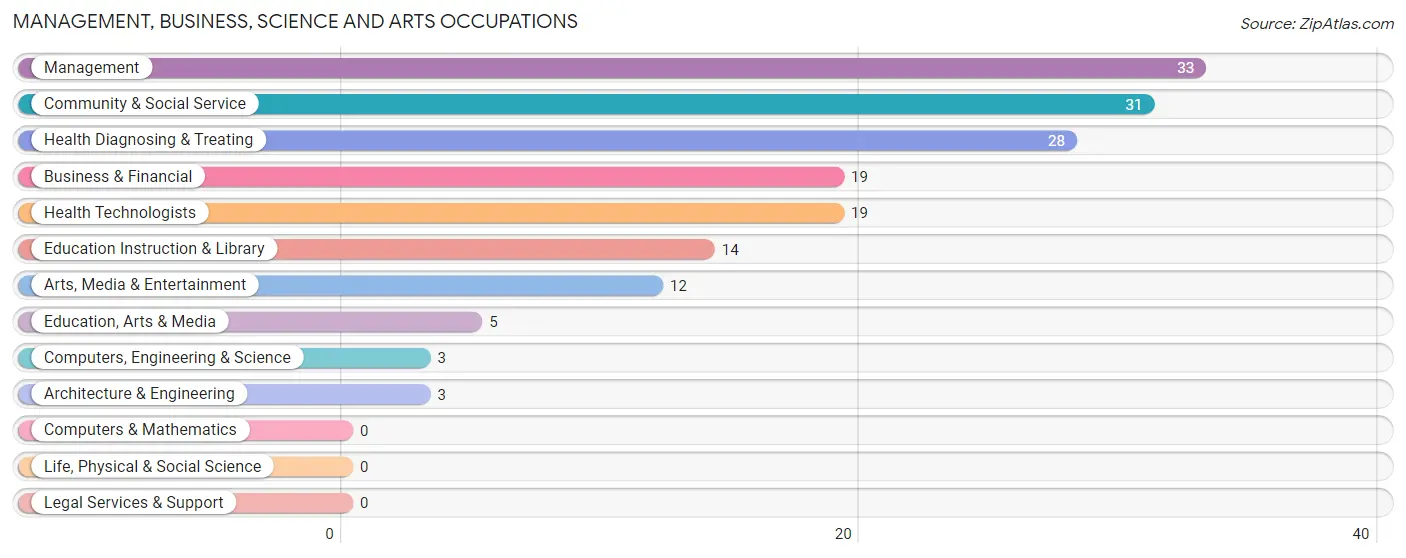
Management, Business, Science and Arts Occupations
The most common Management, Business, Science and Arts occupations in Ponca are Management (33 | 8.8%), Community & Social Service (31 | 8.3%), Health Diagnosing & Treating (28 | 7.5%), Business & Financial (19 | 5.1%), and Health Technologists (19 | 5.1%).
Management, Business, Science and Arts Occupations by Sex
Within the Management, Business, Science and Arts occupations in Ponca, the most male-oriented occupations are Computers, Engineering & Science (100.0%), Architecture & Engineering (100.0%), and Education, Arts & Media (100.0%), while the most female-oriented occupations are Health Diagnosing & Treating (100.0%), Health Technologists (100.0%), and Arts, Media & Entertainment (75.0%).
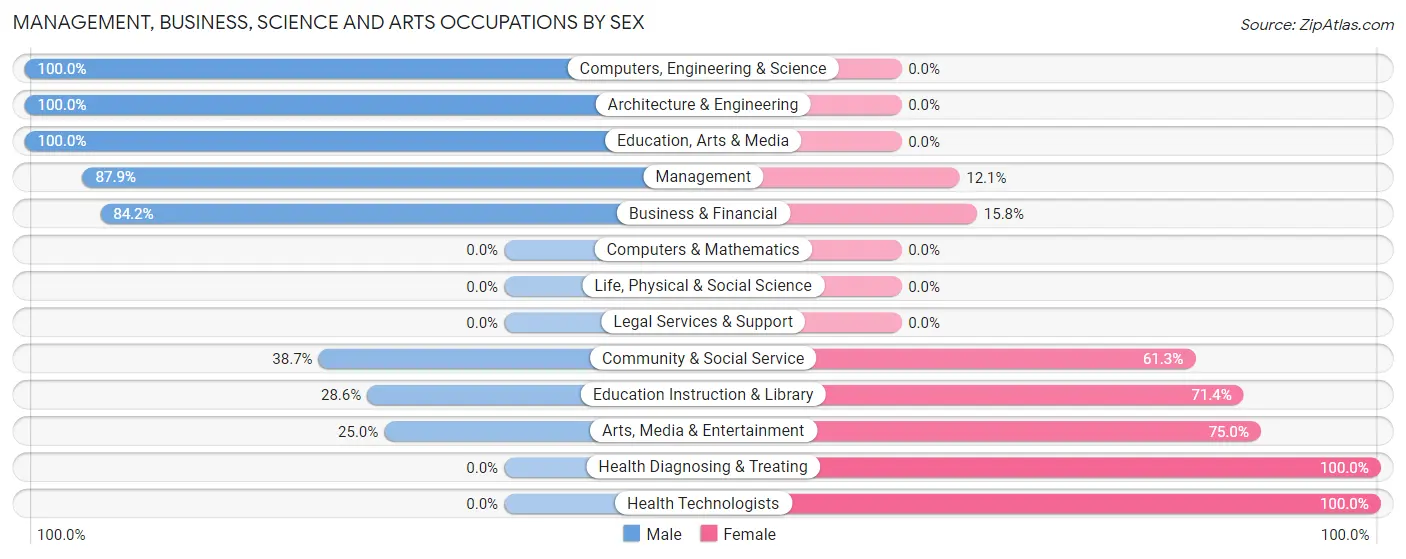
| Occupation | Male | Female |
| Management | 29 (87.9%) | 4 (12.1%) |
| Business & Financial | 16 (84.2%) | 3 (15.8%) |
| Computers, Engineering & Science | 3 (100.0%) | 0 (0.0%) |
| Computers & Mathematics | 0 (0.0%) | 0 (0.0%) |
| Architecture & Engineering | 3 (100.0%) | 0 (0.0%) |
| Life, Physical & Social Science | 0 (0.0%) | 0 (0.0%) |
| Community & Social Service | 12 (38.7%) | 19 (61.3%) |
| Education, Arts & Media | 5 (100.0%) | 0 (0.0%) |
| Legal Services & Support | 0 (0.0%) | 0 (0.0%) |
| Education Instruction & Library | 4 (28.6%) | 10 (71.4%) |
| Arts, Media & Entertainment | 3 (25.0%) | 9 (75.0%) |
| Health Diagnosing & Treating | 0 (0.0%) | 28 (100.0%) |
| Health Technologists | 0 (0.0%) | 19 (100.0%) |
| Total (Category) | 60 (52.6%) | 54 (47.4%) |
| Total (Overall) | 204 (54.7%) | 169 (45.3%) |
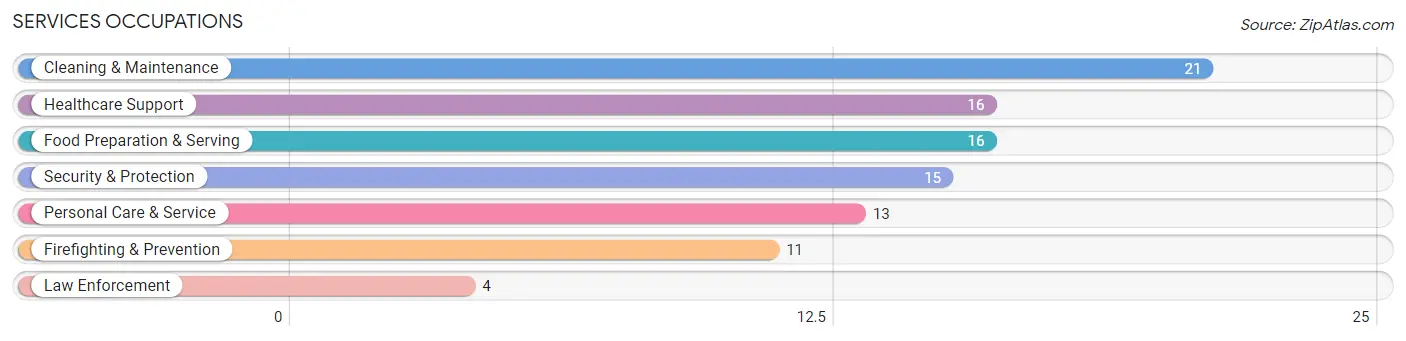
Services Occupations
The most common Services occupations in Ponca are Cleaning & Maintenance (21 | 5.6%), Healthcare Support (16 | 4.3%), Food Preparation & Serving (16 | 4.3%), Security & Protection (15 | 4.0%), and Personal Care & Service (13 | 3.5%).
Services Occupations by Sex
Within the Services occupations in Ponca, the most male-oriented occupations are Law Enforcement (100.0%), Security & Protection (80.0%), and Firefighting & Prevention (72.7%), while the most female-oriented occupations are Healthcare Support (100.0%), Personal Care & Service (100.0%), and Cleaning & Maintenance (71.4%).
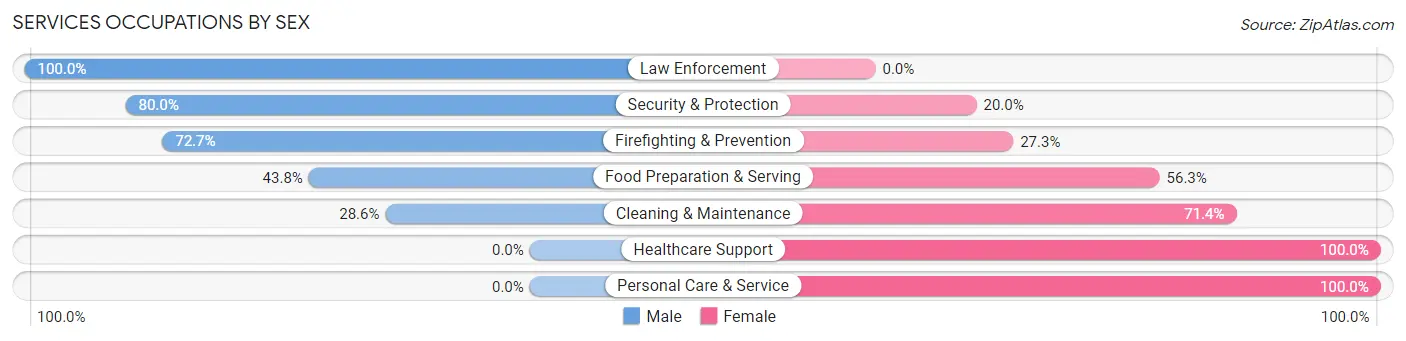
| Occupation | Male | Female |
| Healthcare Support | 0 (0.0%) | 16 (100.0%) |
| Security & Protection | 12 (80.0%) | 3 (20.0%) |
| Firefighting & Prevention | 8 (72.7%) | 3 (27.3%) |
| Law Enforcement | 4 (100.0%) | 0 (0.0%) |
| Food Preparation & Serving | 7 (43.8%) | 9 (56.2%) |
| Cleaning & Maintenance | 6 (28.6%) | 15 (71.4%) |
| Personal Care & Service | 0 (0.0%) | 13 (100.0%) |
| Total (Category) | 25 (30.9%) | 56 (69.1%) |
| Total (Overall) | 204 (54.7%) | 169 (45.3%) |
Sales and Office Occupations
The most common Sales and Office occupations in Ponca are Office & Administration (55 | 14.7%), and Sales & Related (31 | 8.3%).

Sales and Office Occupations by Sex
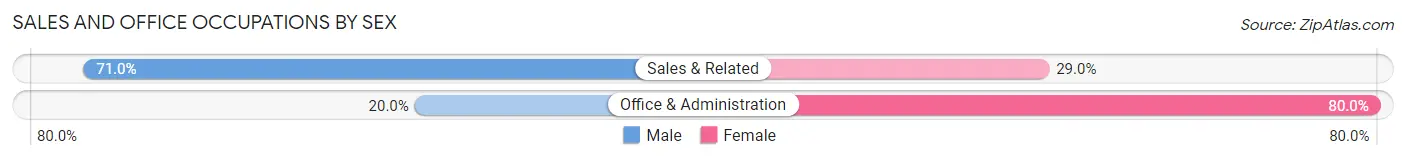
| Occupation | Male | Female |
| Sales & Related | 22 (71.0%) | 9 (29.0%) |
| Office & Administration | 11 (20.0%) | 44 (80.0%) |
| Total (Category) | 33 (38.4%) | 53 (61.6%) |
| Total (Overall) | 204 (54.7%) | 169 (45.3%) |
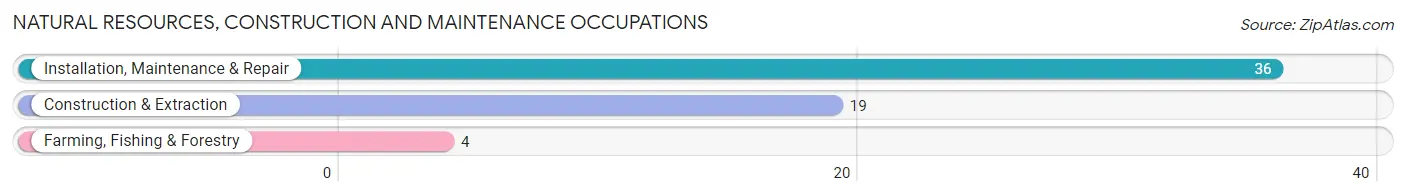
Natural Resources, Construction and Maintenance Occupations
The most common Natural Resources, Construction and Maintenance occupations in Ponca are Installation, Maintenance & Repair (36 | 9.7%), Construction & Extraction (19 | 5.1%), and Farming, Fishing & Forestry (4 | 1.1%).
Natural Resources, Construction and Maintenance Occupations by Sex
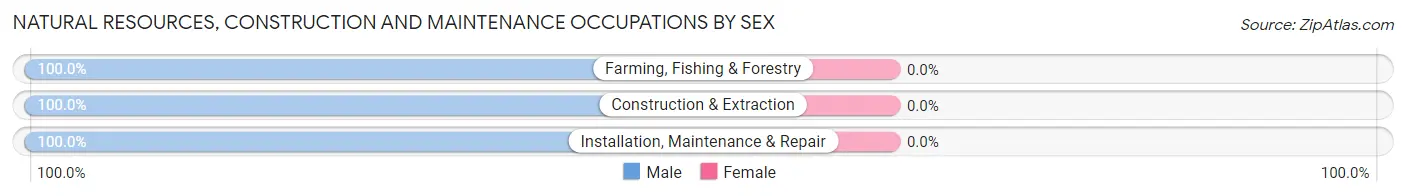
| Occupation | Male | Female |
| Farming, Fishing & Forestry | 4 (100.0%) | 0 (0.0%) |
| Construction & Extraction | 19 (100.0%) | 0 (0.0%) |
| Installation, Maintenance & Repair | 36 (100.0%) | 0 (0.0%) |
| Total (Category) | 59 (100.0%) | 0 (0.0%) |
| Total (Overall) | 204 (54.7%) | 169 (45.3%) |
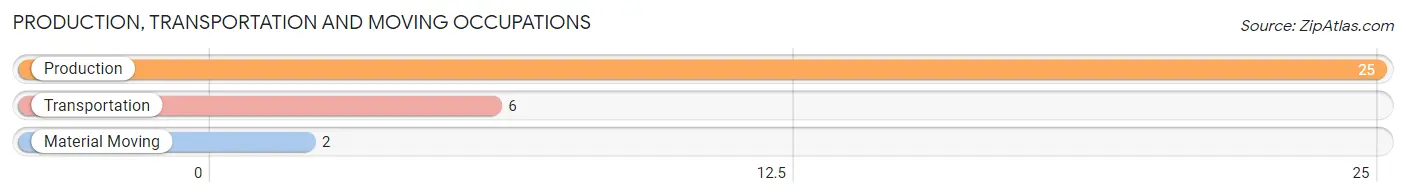
Production, Transportation and Moving Occupations
The most common Production, Transportation and Moving occupations in Ponca are Production (25 | 6.7%), Transportation (6 | 1.6%), and Material Moving (2 | 0.5%).
Production, Transportation and Moving Occupations by Sex
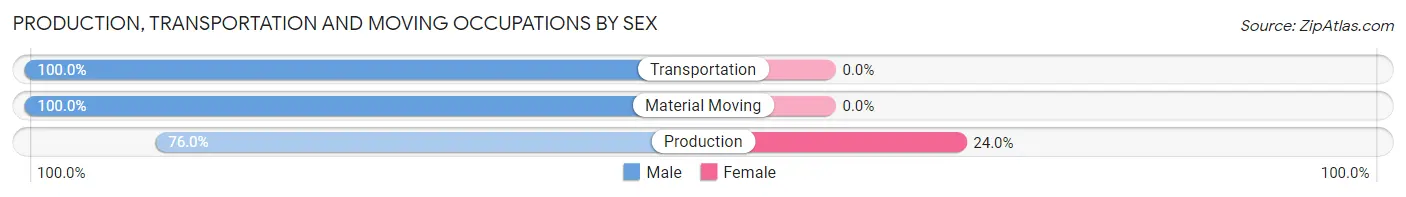
| Occupation | Male | Female |
| Production | 19 (76.0%) | 6 (24.0%) |
| Transportation | 6 (100.0%) | 0 (0.0%) |
| Material Moving | 2 (100.0%) | 0 (0.0%) |
| Total (Category) | 27 (81.8%) | 6 (18.2%) |
| Total (Overall) | 204 (54.7%) | 169 (45.3%) |
Employment Industries by Sex in Ponca
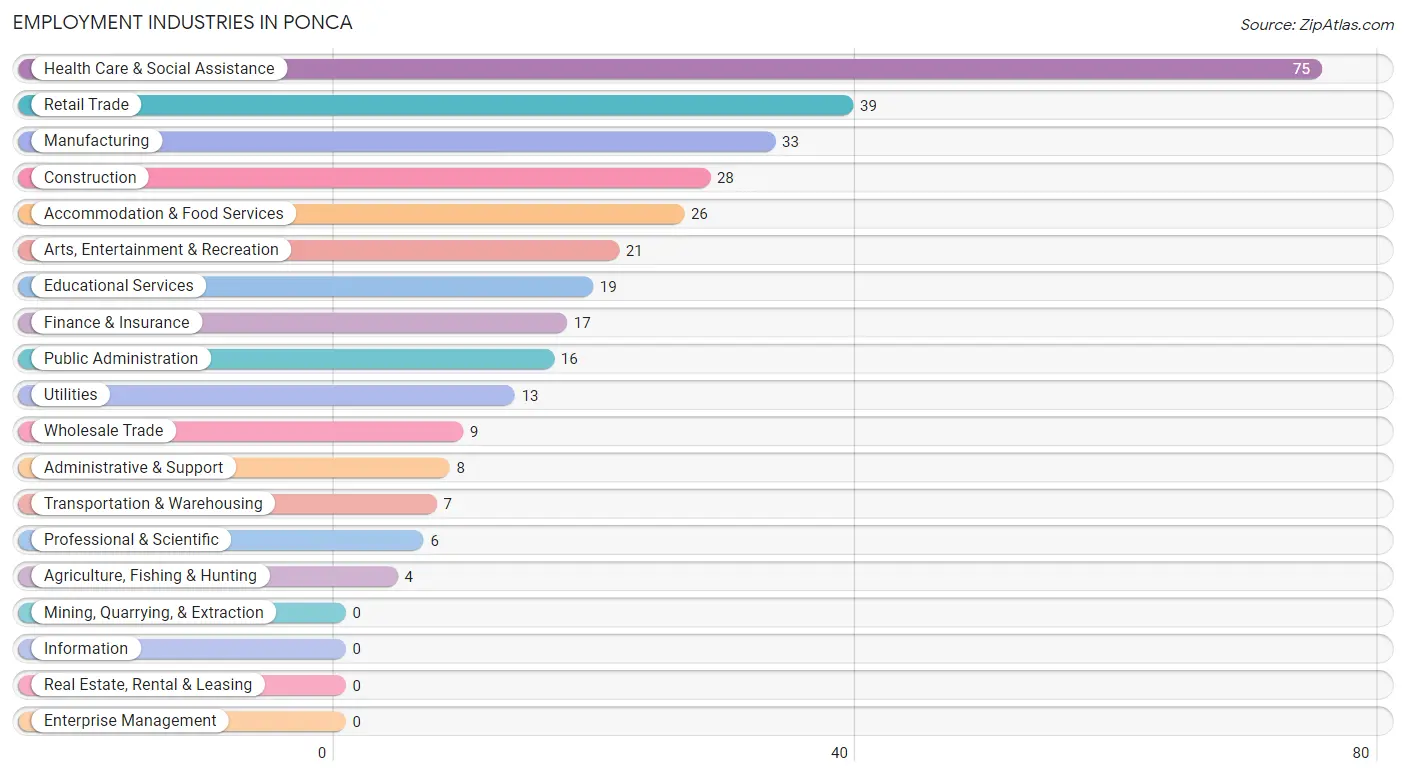
Employment Industries in Ponca
The major employment industries in Ponca include Health Care & Social Assistance (75 | 20.1%), Retail Trade (39 | 10.5%), Manufacturing (33 | 8.8%), Construction (28 | 7.5%), and Accommodation & Food Services (26 | 7.0%).
Employment Industries by Sex in Ponca
The Ponca industries that see more men than women are Agriculture, Fishing & Hunting (100.0%), Transportation & Warehousing (100.0%), and Professional & Scientific (100.0%), whereas the industries that tend to have a higher number of women are Health Care & Social Assistance (97.3%), Public Administration (75.0%), and Arts, Entertainment & Recreation (66.7%).
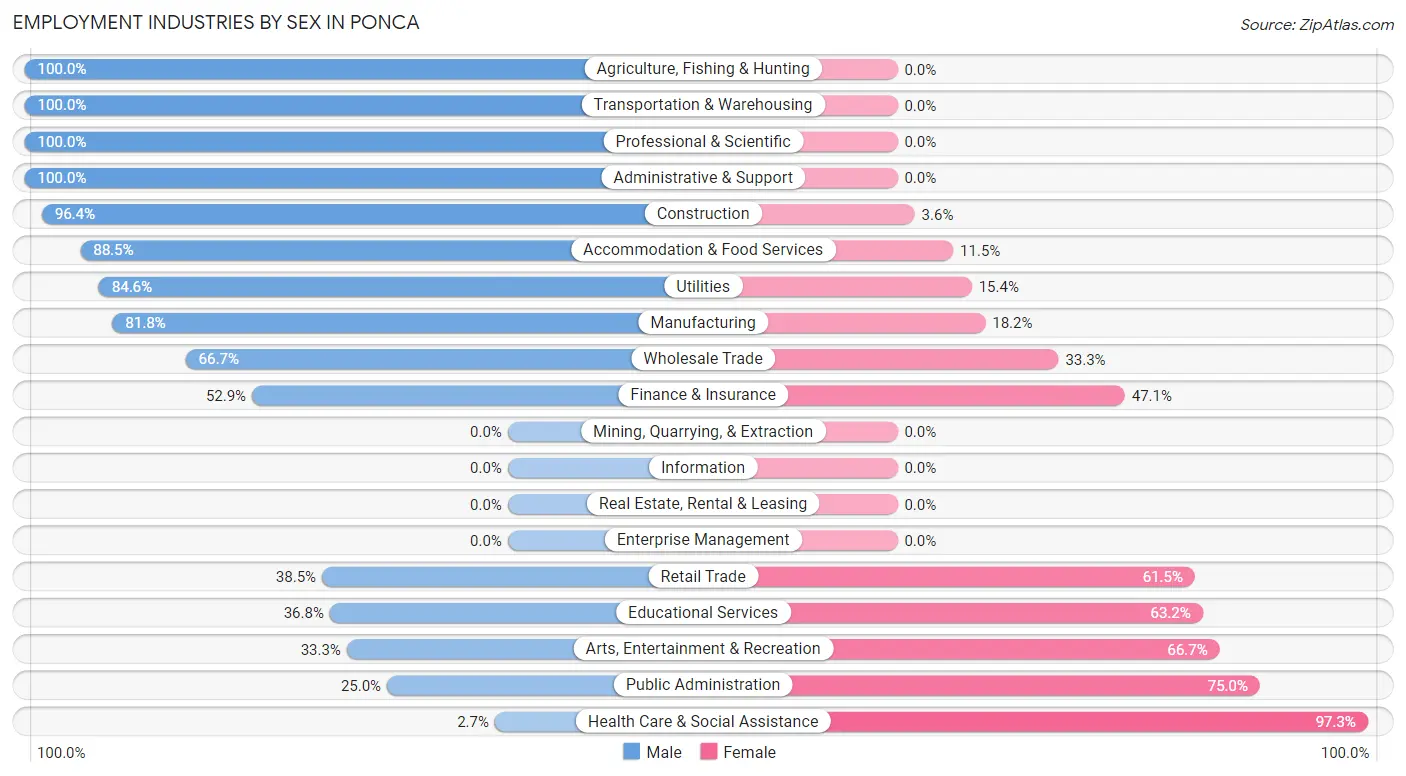
| Industry | Male | Female |
| Agriculture, Fishing & Hunting | 4 (100.0%) | 0 (0.0%) |
| Mining, Quarrying, & Extraction | 0 (0.0%) | 0 (0.0%) |
| Construction | 27 (96.4%) | 1 (3.6%) |
| Manufacturing | 27 (81.8%) | 6 (18.2%) |
| Wholesale Trade | 6 (66.7%) | 3 (33.3%) |
| Retail Trade | 15 (38.5%) | 24 (61.5%) |
| Transportation & Warehousing | 7 (100.0%) | 0 (0.0%) |
| Utilities | 11 (84.6%) | 2 (15.4%) |
| Information | 0 (0.0%) | 0 (0.0%) |
| Finance & Insurance | 9 (52.9%) | 8 (47.1%) |
| Real Estate, Rental & Leasing | 0 (0.0%) | 0 (0.0%) |
| Professional & Scientific | 6 (100.0%) | 0 (0.0%) |
| Enterprise Management | 0 (0.0%) | 0 (0.0%) |
| Administrative & Support | 8 (100.0%) | 0 (0.0%) |
| Educational Services | 7 (36.8%) | 12 (63.2%) |
| Health Care & Social Assistance | 2 (2.7%) | 73 (97.3%) |
| Arts, Entertainment & Recreation | 7 (33.3%) | 14 (66.7%) |
| Accommodation & Food Services | 23 (88.5%) | 3 (11.5%) |
| Public Administration | 4 (25.0%) | 12 (75.0%) |
| Total | 204 (54.7%) | 169 (45.3%) |
Education in Ponca
School Enrollment in Ponca
The most common levels of schooling among the 106 students in Ponca are elementary school (27 | 25.5%), college / undergraduate (27 | 25.5%), and high school (22 | 20.7%).
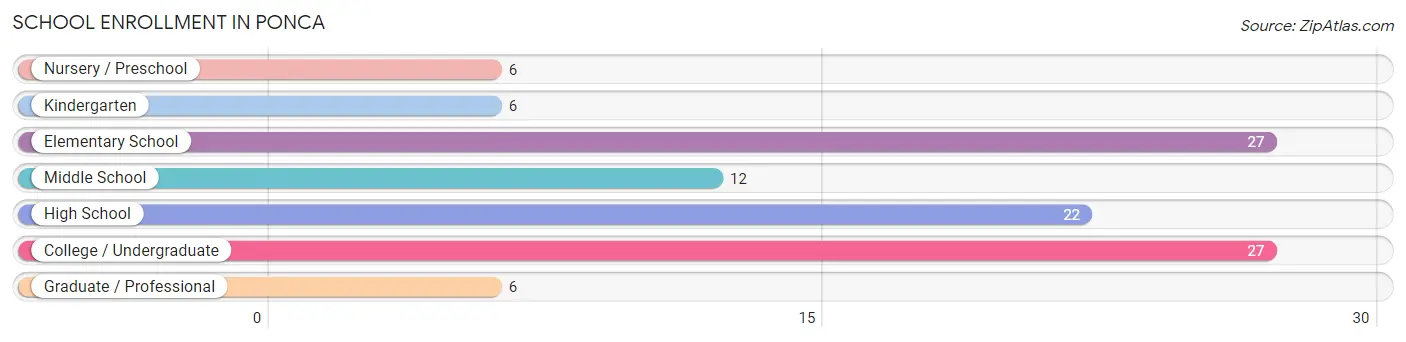
| School Level | # Students | % Students |
| Nursery / Preschool | 6 | 5.7% |
| Kindergarten | 6 | 5.7% |
| Elementary School | 27 | 25.5% |
| Middle School | 12 | 11.3% |
| High School | 22 | 20.7% |
| College / Undergraduate | 27 | 25.5% |
| Graduate / Professional | 6 | 5.7% |
| Total | 106 | 100.0% |
School Enrollment by Age by Funding Source in Ponca
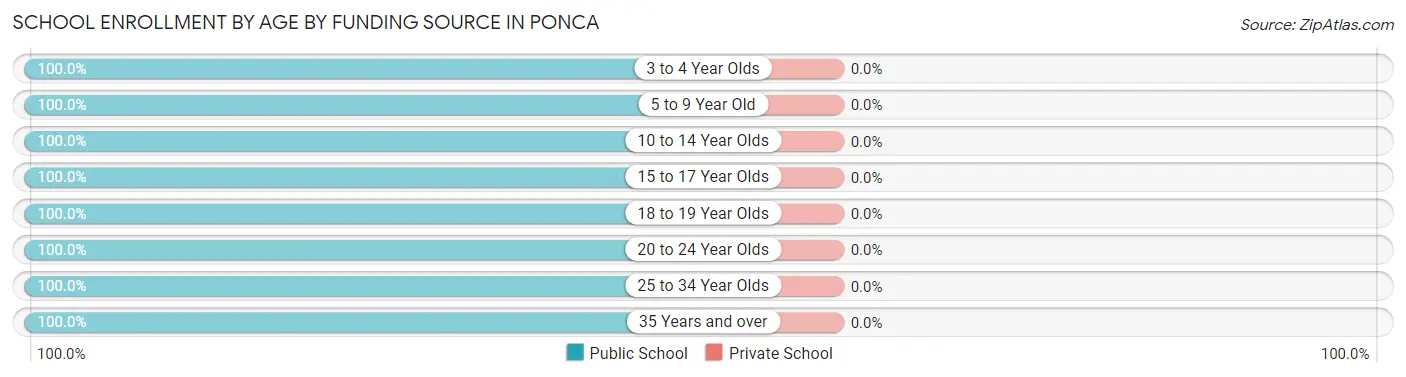
| Age Bracket | Public School | Private School |
| 3 to 4 Year Olds | 4 (100.0%) | 0 (0.0%) |
| 5 to 9 Year Old | 28 (100.0%) | 0 (0.0%) |
| 10 to 14 Year Olds | 19 (100.0%) | 0 (0.0%) |
| 15 to 17 Year Olds | 15 (100.0%) | 0 (0.0%) |
| 18 to 19 Year Olds | 8 (100.0%) | 0 (0.0%) |
| 20 to 24 Year Olds | 17 (100.0%) | 0 (0.0%) |
| 25 to 34 Year Olds | 11 (100.0%) | 0 (0.0%) |
| 35 Years and over | 4 (100.0%) | 0 (0.0%) |
| Total | 106 (100.0%) | 0 (0.0%) |
Educational Attainment by Field of Study in Ponca
Education (55 | 33.3%), science & technology (29 | 17.6%), business (27 | 16.4%), bio, nature & agricultural (14 | 8.5%), and social sciences (9 | 5.4%) are the most common fields of study among 165 individuals in Ponca who have obtained a bachelor's degree or higher.
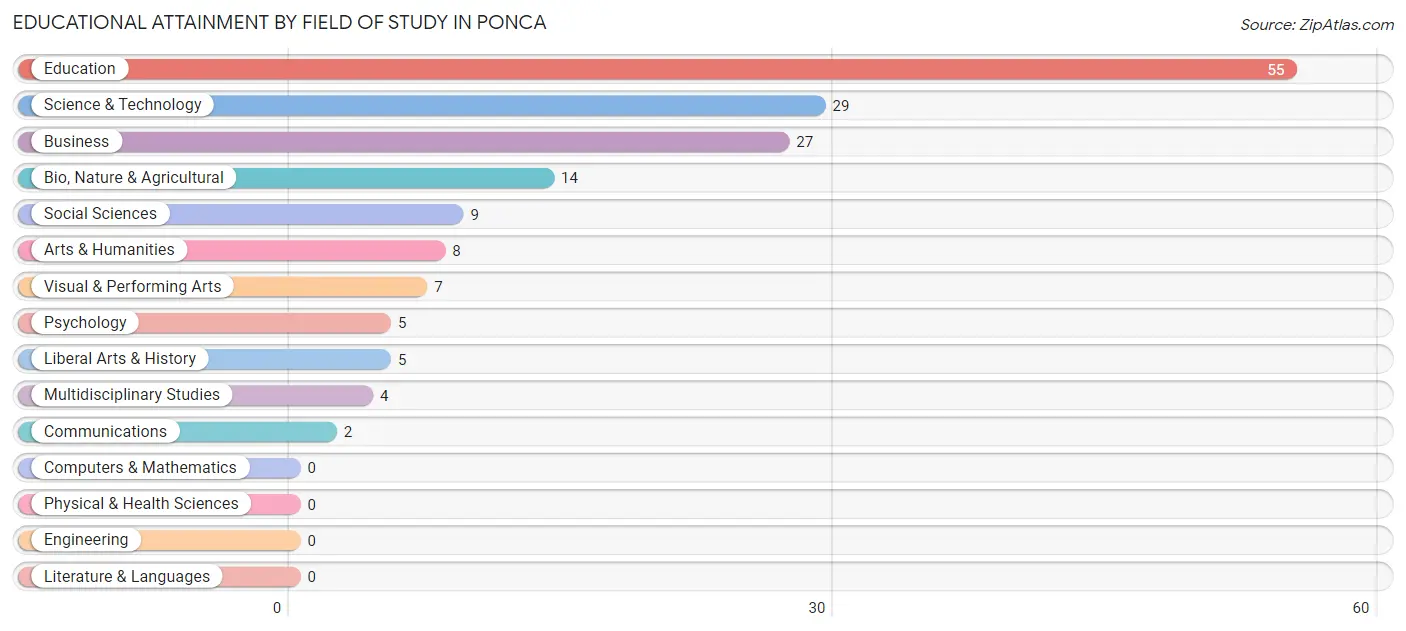
| Field of Study | # Graduates | % Graduates |
| Computers & Mathematics | 0 | 0.0% |
| Bio, Nature & Agricultural | 14 | 8.5% |
| Physical & Health Sciences | 0 | 0.0% |
| Psychology | 5 | 3.0% |
| Social Sciences | 9 | 5.4% |
| Engineering | 0 | 0.0% |
| Multidisciplinary Studies | 4 | 2.4% |
| Science & Technology | 29 | 17.6% |
| Business | 27 | 16.4% |
| Education | 55 | 33.3% |
| Literature & Languages | 0 | 0.0% |
| Liberal Arts & History | 5 | 3.0% |
| Visual & Performing Arts | 7 | 4.2% |
| Communications | 2 | 1.2% |
| Arts & Humanities | 8 | 4.9% |
| Total | 165 | 100.0% |
Transportation & Commute in Ponca
Vehicle Availability by Sex in Ponca
The most prevalent vehicle ownership categories in Ponca are males with 3 vehicles (87, accounting for 42.6%) and females with 3 vehicles (38, making up 52.4%).
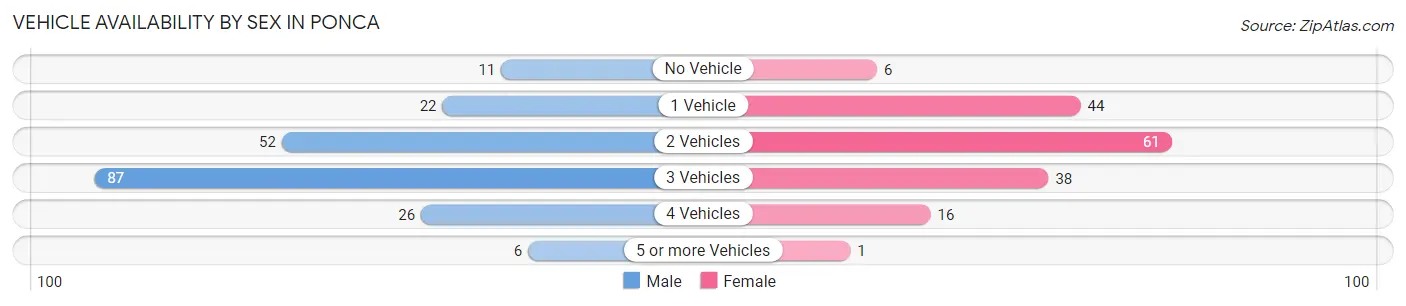
| Vehicles Available | Male | Female |
| No Vehicle | 11 (5.4%) | 6 (3.6%) |
| 1 Vehicle | 22 (10.8%) | 44 (26.5%) |
| 2 Vehicles | 52 (25.5%) | 61 (36.7%) |
| 3 Vehicles | 87 (42.6%) | 38 (22.9%) |
| 4 Vehicles | 26 (12.8%) | 16 (9.6%) |
| 5 or more Vehicles | 6 (2.9%) | 1 (0.6%) |
| Total | 204 (100.0%) | 166 (100.0%) |
Commute Time in Ponca
The most frequently occuring commute durations in Ponca are less than 5 minutes (78 commuters, 22.5%), 5 to 9 minutes (62 commuters, 17.9%), and 35 to 39 minutes (51 commuters, 14.7%).
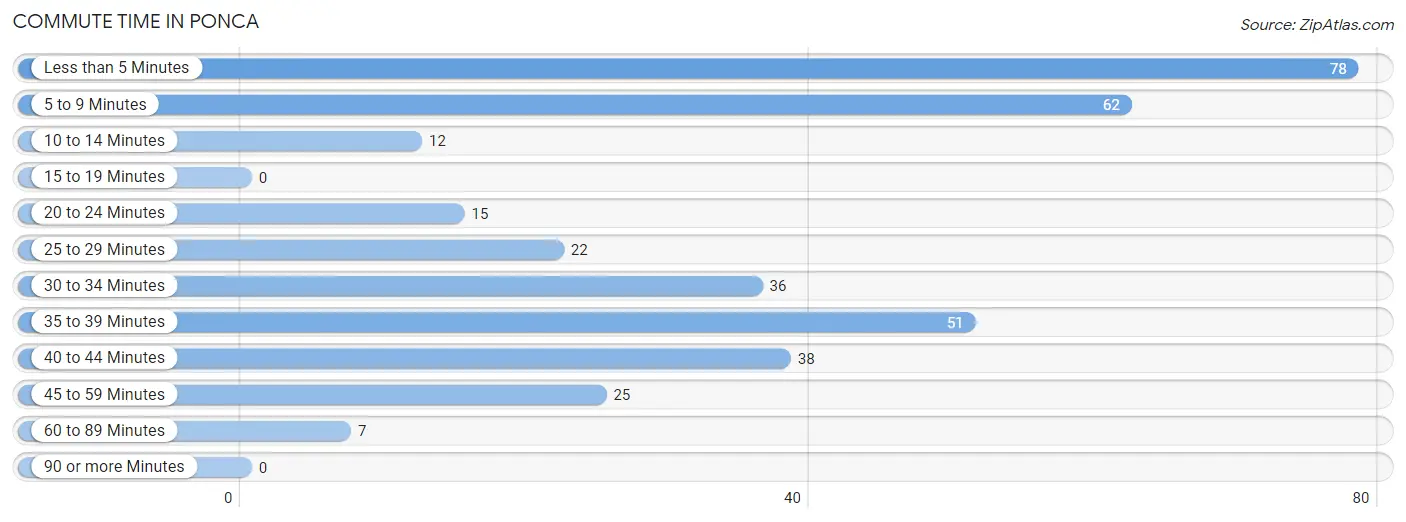
| Commute Time | # Commuters | % Commuters |
| Less than 5 Minutes | 78 | 22.5% |
| 5 to 9 Minutes | 62 | 17.9% |
| 10 to 14 Minutes | 12 | 3.5% |
| 15 to 19 Minutes | 0 | 0.0% |
| 20 to 24 Minutes | 15 | 4.3% |
| 25 to 29 Minutes | 22 | 6.4% |
| 30 to 34 Minutes | 36 | 10.4% |
| 35 to 39 Minutes | 51 | 14.7% |
| 40 to 44 Minutes | 38 | 11.0% |
| 45 to 59 Minutes | 25 | 7.2% |
| 60 to 89 Minutes | 7 | 2.0% |
| 90 or more Minutes | 0 | 0.0% |
Commute Time by Sex in Ponca
The most common commute times in Ponca are less than 5 minutes (30 commuters, 15.5%) for males and less than 5 minutes (48 commuters, 31.4%) for females.
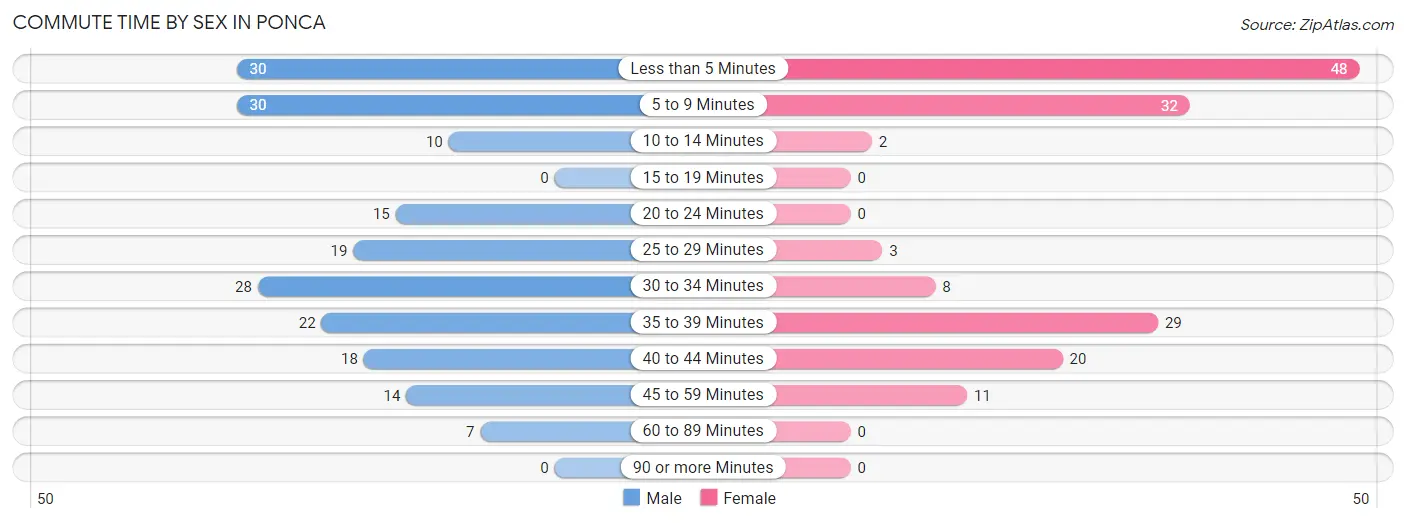
| Commute Time | Male | Female |
| Less than 5 Minutes | 30 (15.5%) | 48 (31.4%) |
| 5 to 9 Minutes | 30 (15.5%) | 32 (20.9%) |
| 10 to 14 Minutes | 10 (5.2%) | 2 (1.3%) |
| 15 to 19 Minutes | 0 (0.0%) | 0 (0.0%) |
| 20 to 24 Minutes | 15 (7.8%) | 0 (0.0%) |
| 25 to 29 Minutes | 19 (9.8%) | 3 (2.0%) |
| 30 to 34 Minutes | 28 (14.5%) | 8 (5.2%) |
| 35 to 39 Minutes | 22 (11.4%) | 29 (19.0%) |
| 40 to 44 Minutes | 18 (9.3%) | 20 (13.1%) |
| 45 to 59 Minutes | 14 (7.2%) | 11 (7.2%) |
| 60 to 89 Minutes | 7 (3.6%) | 0 (0.0%) |
| 90 or more Minutes | 0 (0.0%) | 0 (0.0%) |
Time of Departure to Work by Sex in Ponca
The most frequent times of departure to work in Ponca are 6:00 AM to 6:29 AM (26, 13.5%) for males and 7:30 AM to 7:59 AM (39, 25.5%) for females.
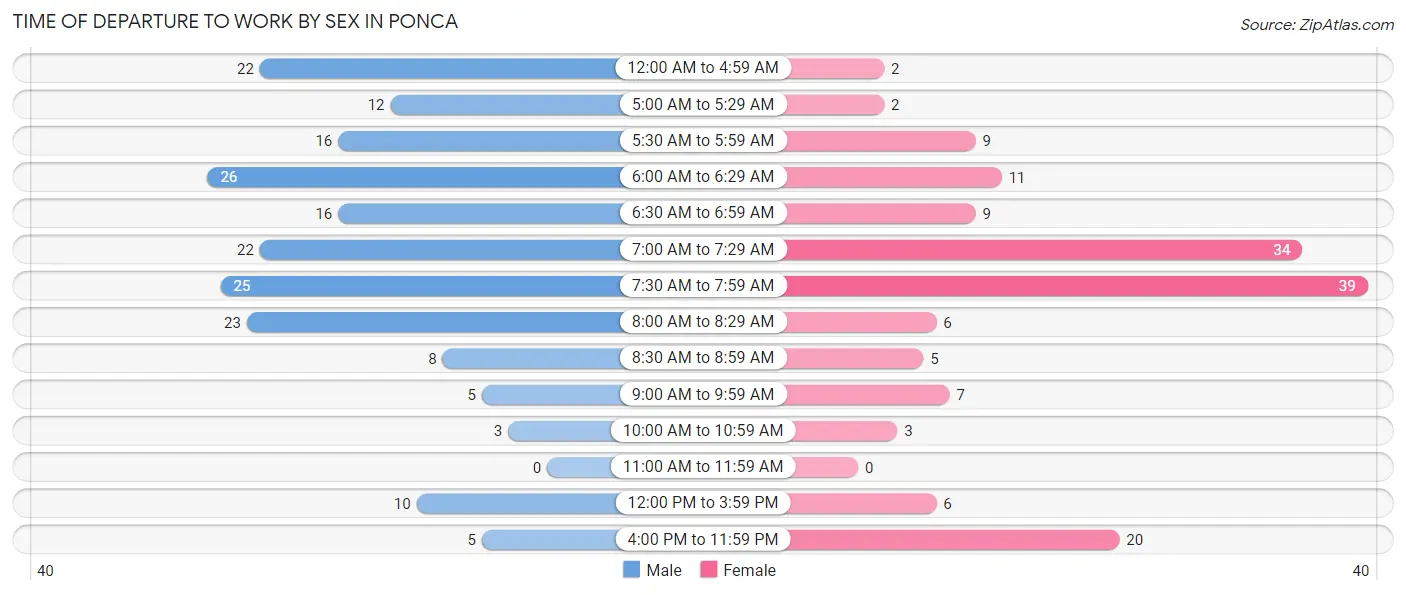
| Time of Departure | Male | Female |
| 12:00 AM to 4:59 AM | 22 (11.4%) | 2 (1.3%) |
| 5:00 AM to 5:29 AM | 12 (6.2%) | 2 (1.3%) |
| 5:30 AM to 5:59 AM | 16 (8.3%) | 9 (5.9%) |
| 6:00 AM to 6:29 AM | 26 (13.5%) | 11 (7.2%) |
| 6:30 AM to 6:59 AM | 16 (8.3%) | 9 (5.9%) |
| 7:00 AM to 7:29 AM | 22 (11.4%) | 34 (22.2%) |
| 7:30 AM to 7:59 AM | 25 (13.0%) | 39 (25.5%) |
| 8:00 AM to 8:29 AM | 23 (11.9%) | 6 (3.9%) |
| 8:30 AM to 8:59 AM | 8 (4.2%) | 5 (3.3%) |
| 9:00 AM to 9:59 AM | 5 (2.6%) | 7 (4.6%) |
| 10:00 AM to 10:59 AM | 3 (1.5%) | 3 (2.0%) |
| 11:00 AM to 11:59 AM | 0 (0.0%) | 0 (0.0%) |
| 12:00 PM to 3:59 PM | 10 (5.2%) | 6 (3.9%) |
| 4:00 PM to 11:59 PM | 5 (2.6%) | 20 (13.1%) |
| Total | 193 (100.0%) | 153 (100.0%) |
Housing Occupancy in Ponca
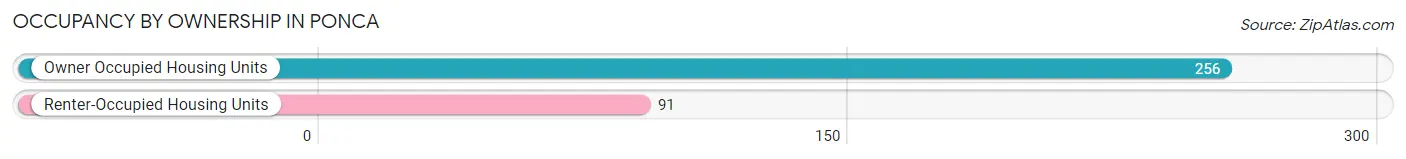
Occupancy by Ownership in Ponca
Of the total 347 dwellings in Ponca, owner-occupied units account for 256 (73.8%), while renter-occupied units make up 91 (26.2%).
| Occupancy | # Housing Units | % Housing Units |
| Owner Occupied Housing Units | 256 | 73.8% |
| Renter-Occupied Housing Units | 91 | 26.2% |
| Total Occupied Housing Units | 347 | 100.0% |
Occupancy by Household Size in Ponca
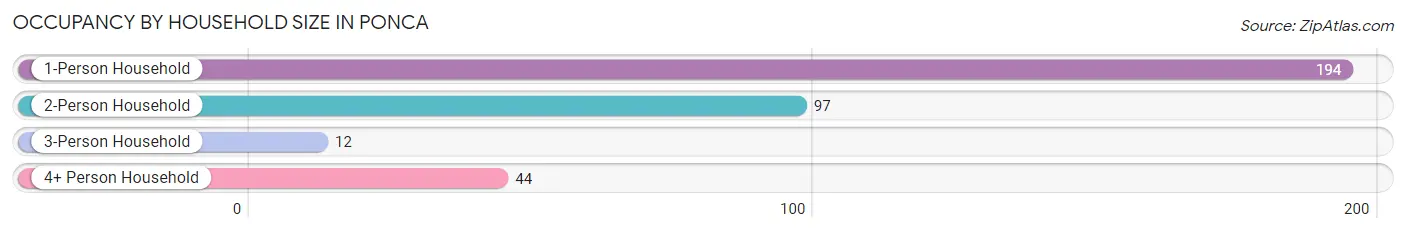
| Household Size | # Housing Units | % Housing Units |
| 1-Person Household | 194 | 55.9% |
| 2-Person Household | 97 | 28.0% |
| 3-Person Household | 12 | 3.5% |
| 4+ Person Household | 44 | 12.7% |
| Total Housing Units | 347 | 100.0% |
Occupancy by Ownership by Household Size in Ponca
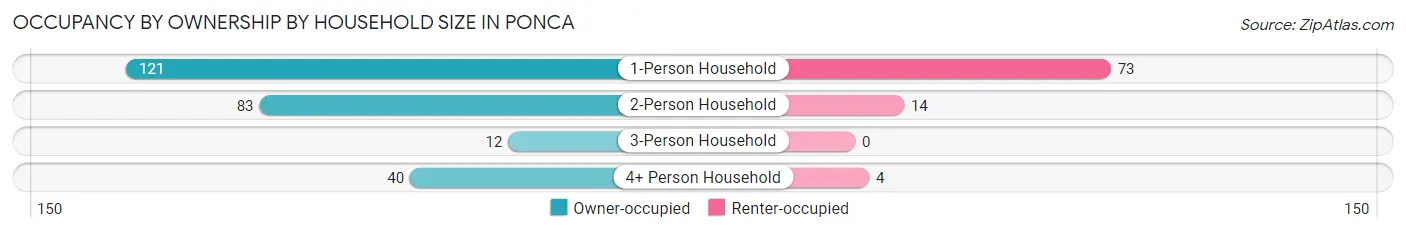
| Household Size | Owner-occupied | Renter-occupied |
| 1-Person Household | 121 (62.4%) | 73 (37.6%) |
| 2-Person Household | 83 (85.6%) | 14 (14.4%) |
| 3-Person Household | 12 (100.0%) | 0 (0.0%) |
| 4+ Person Household | 40 (90.9%) | 4 (9.1%) |
| Total Housing Units | 256 (73.8%) | 91 (26.2%) |
Occupancy by Educational Attainment in Ponca
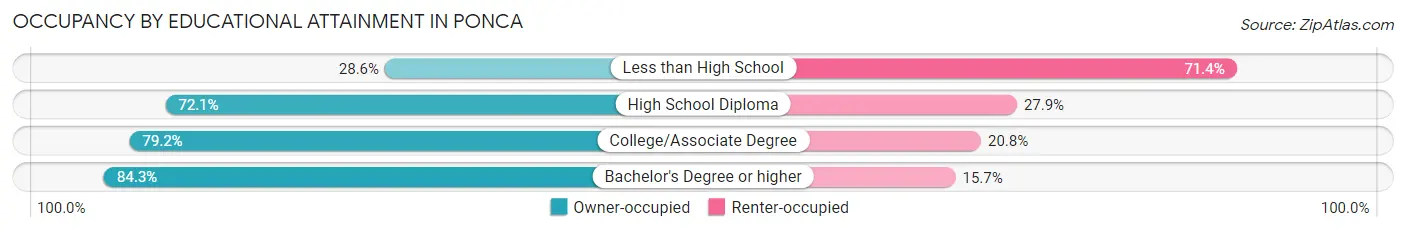
| Household Size | Owner-occupied | Renter-occupied |
| Less than High School | 8 (28.6%) | 20 (71.4%) |
| High School Diploma | 93 (72.1%) | 36 (27.9%) |
| College/Associate Degree | 80 (79.2%) | 21 (20.8%) |
| Bachelor's Degree or higher | 75 (84.3%) | 14 (15.7%) |
Occupancy by Age of Householder in Ponca
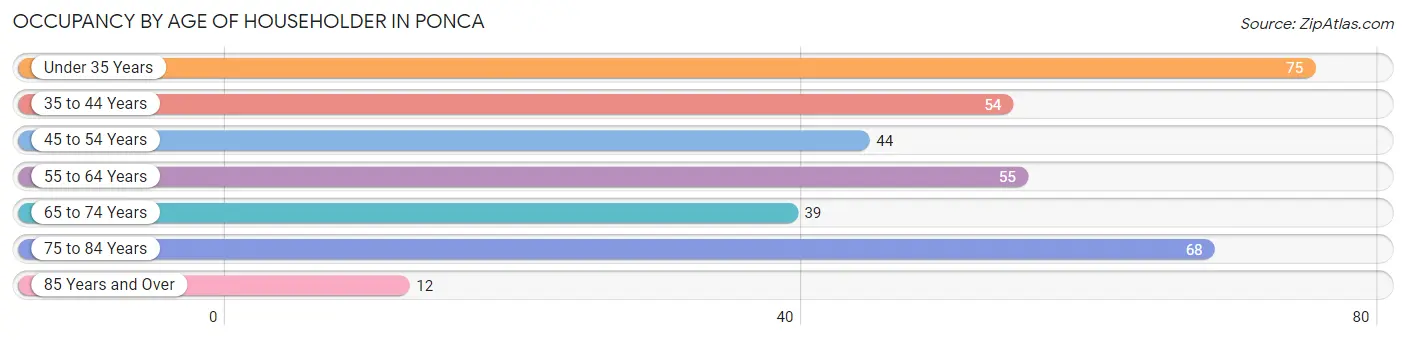
| Age Bracket | # Households | % Households |
| Under 35 Years | 75 | 21.6% |
| 35 to 44 Years | 54 | 15.6% |
| 45 to 54 Years | 44 | 12.7% |
| 55 to 64 Years | 55 | 15.9% |
| 65 to 74 Years | 39 | 11.2% |
| 75 to 84 Years | 68 | 19.6% |
| 85 Years and Over | 12 | 3.5% |
| Total | 347 | 100.0% |
Housing Finances in Ponca
Median Income by Occupancy in Ponca
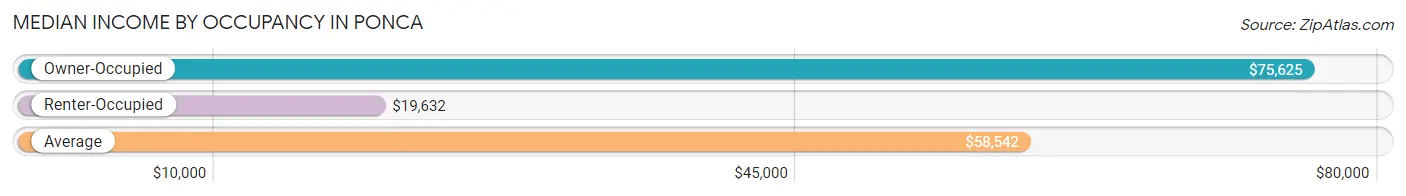
| Occupancy Type | # Households | Median Income |
| Owner-Occupied | 256 (73.8%) | $75,625 |
| Renter-Occupied | 91 (26.2%) | $19,632 |
| Average | 347 (100.0%) | $58,542 |
Occupancy by Householder Income Bracket in Ponca
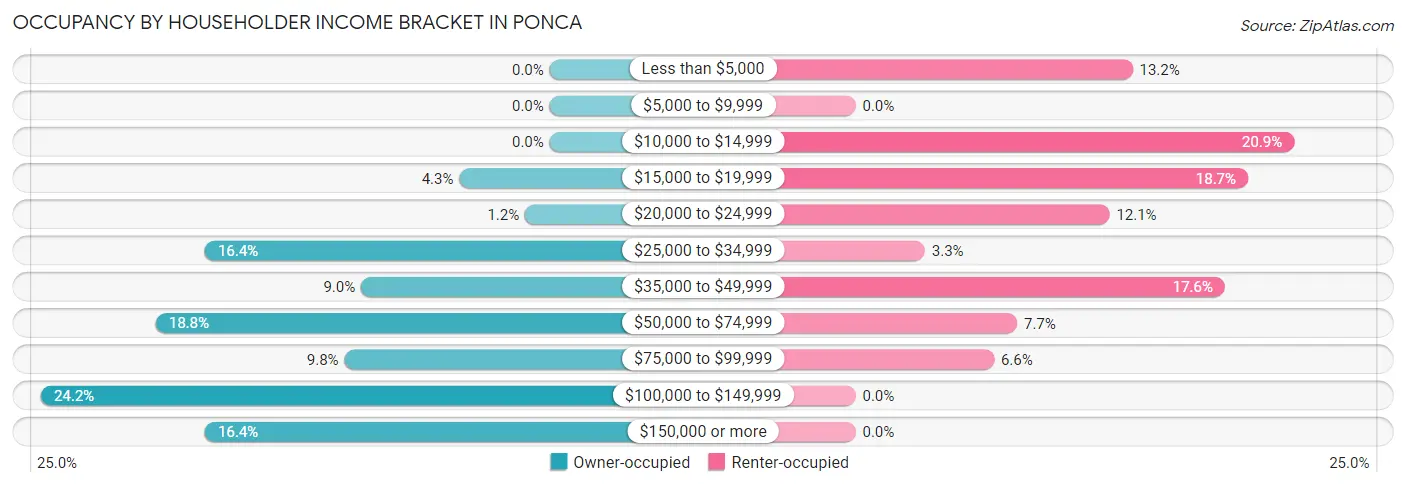
| Income Bracket | Owner-occupied | Renter-occupied |
| Less than $5,000 | 0 (0.0%) | 12 (13.2%) |
| $5,000 to $9,999 | 0 (0.0%) | 0 (0.0%) |
| $10,000 to $14,999 | 0 (0.0%) | 19 (20.9%) |
| $15,000 to $19,999 | 11 (4.3%) | 17 (18.7%) |
| $20,000 to $24,999 | 3 (1.2%) | 11 (12.1%) |
| $25,000 to $34,999 | 42 (16.4%) | 3 (3.3%) |
| $35,000 to $49,999 | 23 (9.0%) | 16 (17.6%) |
| $50,000 to $74,999 | 48 (18.8%) | 7 (7.7%) |
| $75,000 to $99,999 | 25 (9.8%) | 6 (6.6%) |
| $100,000 to $149,999 | 62 (24.2%) | 0 (0.0%) |
| $150,000 or more | 42 (16.4%) | 0 (0.0%) |
| Total | 256 (100.0%) | 91 (100.0%) |
Monthly Housing Cost Tiers in Ponca
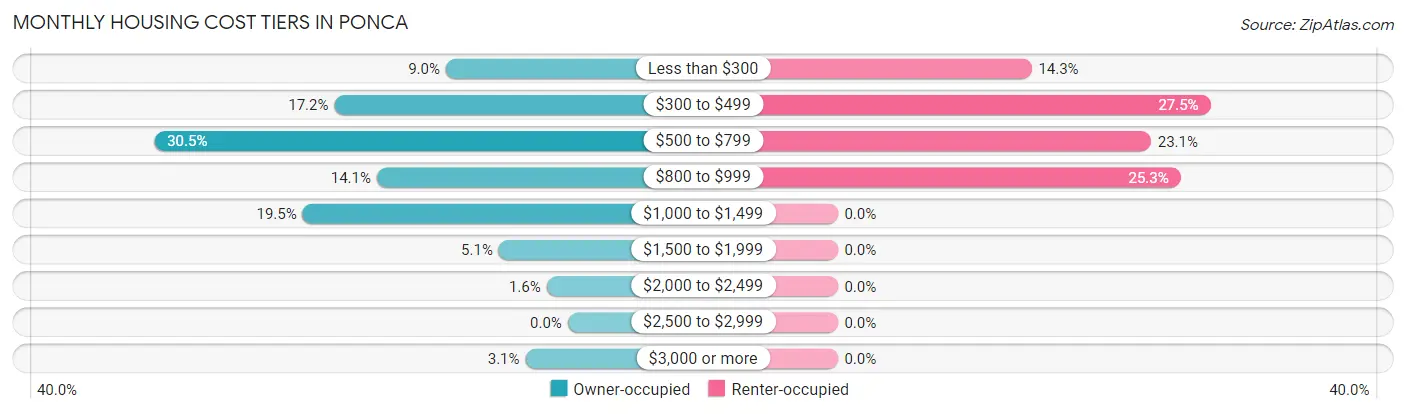
| Monthly Cost | Owner-occupied | Renter-occupied |
| Less than $300 | 23 (9.0%) | 13 (14.3%) |
| $300 to $499 | 44 (17.2%) | 25 (27.5%) |
| $500 to $799 | 78 (30.5%) | 21 (23.1%) |
| $800 to $999 | 36 (14.1%) | 23 (25.3%) |
| $1,000 to $1,499 | 50 (19.5%) | 0 (0.0%) |
| $1,500 to $1,999 | 13 (5.1%) | 0 (0.0%) |
| $2,000 to $2,499 | 4 (1.6%) | 0 (0.0%) |
| $2,500 to $2,999 | 0 (0.0%) | 0 (0.0%) |
| $3,000 or more | 8 (3.1%) | 0 (0.0%) |
| Total | 256 (100.0%) | 91 (100.0%) |
Physical Housing Characteristics in Ponca
Housing Structures in Ponca
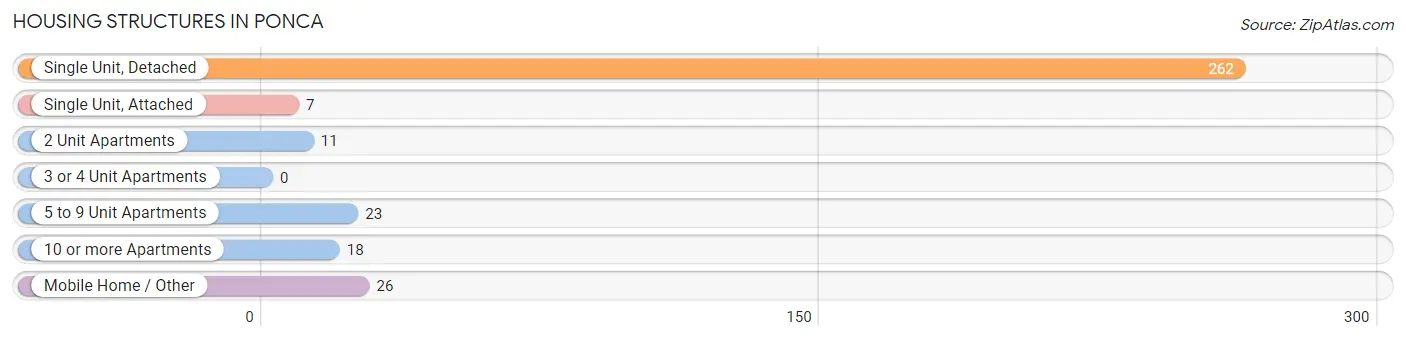
| Structure Type | # Housing Units | % Housing Units |
| Single Unit, Detached | 262 | 75.5% |
| Single Unit, Attached | 7 | 2.0% |
| 2 Unit Apartments | 11 | 3.2% |
| 3 or 4 Unit Apartments | 0 | 0.0% |
| 5 to 9 Unit Apartments | 23 | 6.6% |
| 10 or more Apartments | 18 | 5.2% |
| Mobile Home / Other | 26 | 7.5% |
| Total | 347 | 100.0% |
Housing Structures by Occupancy in Ponca
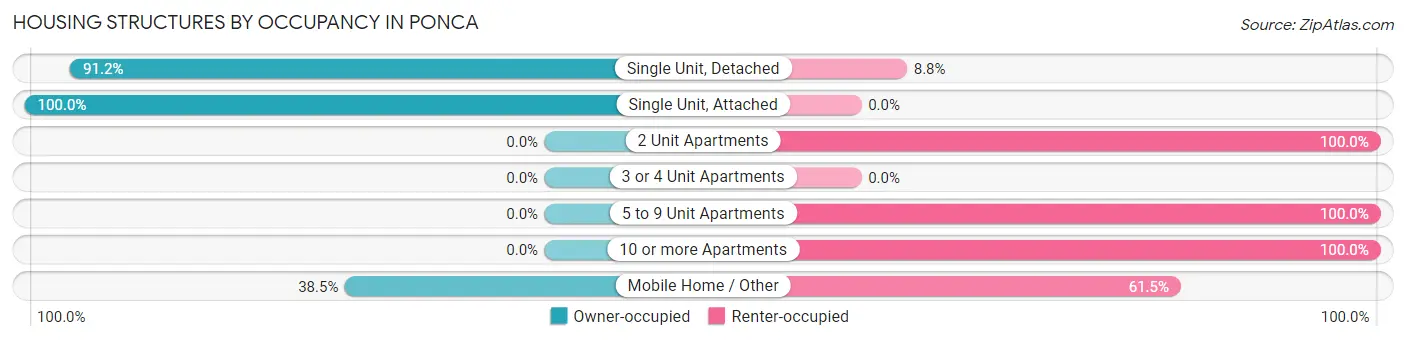
| Structure Type | Owner-occupied | Renter-occupied |
| Single Unit, Detached | 239 (91.2%) | 23 (8.8%) |
| Single Unit, Attached | 7 (100.0%) | 0 (0.0%) |
| 2 Unit Apartments | 0 (0.0%) | 11 (100.0%) |
| 3 or 4 Unit Apartments | 0 (0.0%) | 0 (0.0%) |
| 5 to 9 Unit Apartments | 0 (0.0%) | 23 (100.0%) |
| 10 or more Apartments | 0 (0.0%) | 18 (100.0%) |
| Mobile Home / Other | 10 (38.5%) | 16 (61.5%) |
| Total | 256 (73.8%) | 91 (26.2%) |
Housing Structures by Number of Rooms in Ponca
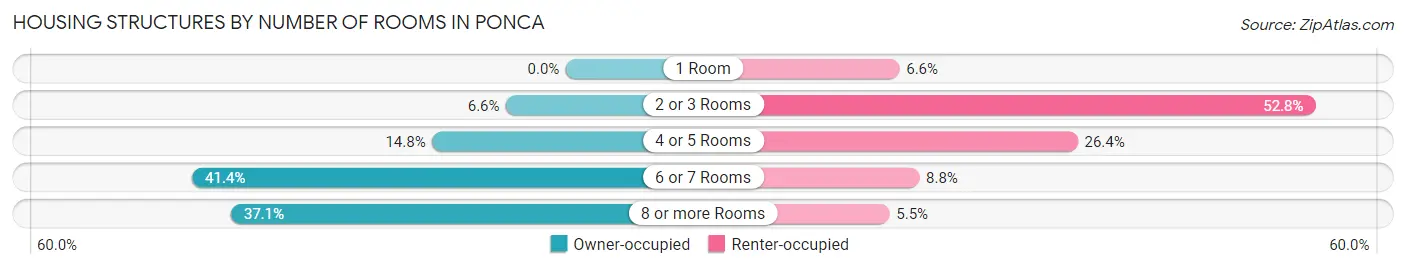
| Number of Rooms | Owner-occupied | Renter-occupied |
| 1 Room | 0 (0.0%) | 6 (6.6%) |
| 2 or 3 Rooms | 17 (6.6%) | 48 (52.7%) |
| 4 or 5 Rooms | 38 (14.8%) | 24 (26.4%) |
| 6 or 7 Rooms | 106 (41.4%) | 8 (8.8%) |
| 8 or more Rooms | 95 (37.1%) | 5 (5.5%) |
| Total | 256 (100.0%) | 91 (100.0%) |
Housing Structure by Heating Type in Ponca
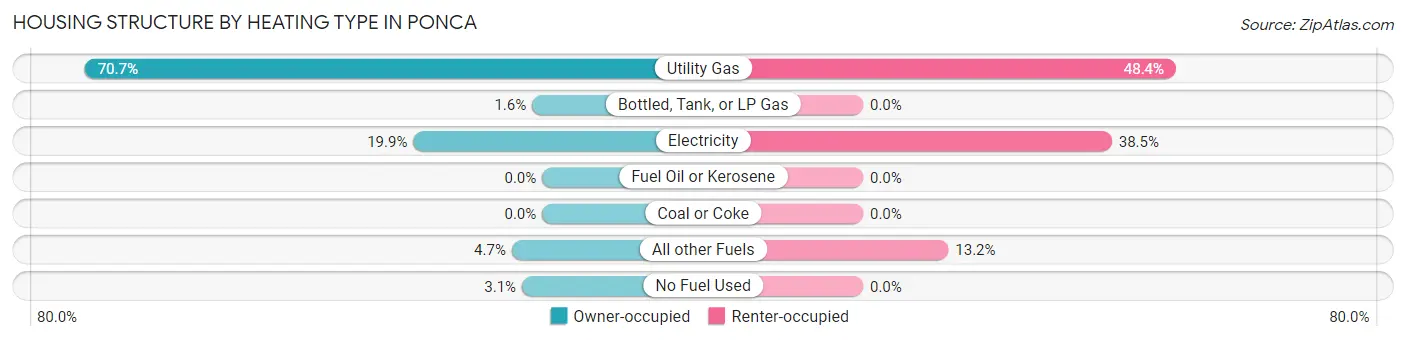
| Heating Type | Owner-occupied | Renter-occupied |
| Utility Gas | 181 (70.7%) | 44 (48.3%) |
| Bottled, Tank, or LP Gas | 4 (1.6%) | 0 (0.0%) |
| Electricity | 51 (19.9%) | 35 (38.5%) |
| Fuel Oil or Kerosene | 0 (0.0%) | 0 (0.0%) |
| Coal or Coke | 0 (0.0%) | 0 (0.0%) |
| All other Fuels | 12 (4.7%) | 12 (13.2%) |
| No Fuel Used | 8 (3.1%) | 0 (0.0%) |
| Total | 256 (100.0%) | 91 (100.0%) |
Household Vehicle Usage in Ponca
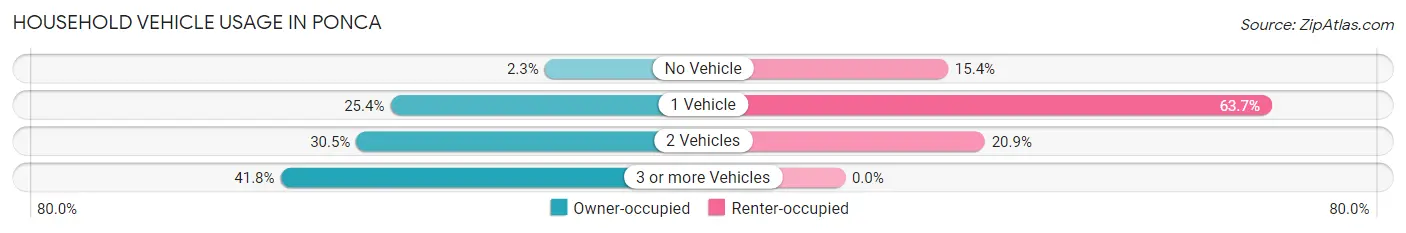
| Vehicles per Household | Owner-occupied | Renter-occupied |
| No Vehicle | 6 (2.3%) | 14 (15.4%) |
| 1 Vehicle | 65 (25.4%) | 58 (63.7%) |
| 2 Vehicles | 78 (30.5%) | 19 (20.9%) |
| 3 or more Vehicles | 107 (41.8%) | 0 (0.0%) |
| Total | 256 (100.0%) | 91 (100.0%) |
Real Estate & Mortgages in Ponca
Real Estate and Mortgage Overview in Ponca
| Characteristic | Without Mortgage | With Mortgage |
| Housing Units | 150 | 106 |
| Median Property Value | $109,100 | $150,000 |
| Median Household Income | $61,071 | $21 |
| Monthly Housing Costs | $550 | $0 |
| Real Estate Taxes | $1,848 | $0 |
Property Value by Mortgage Status in Ponca
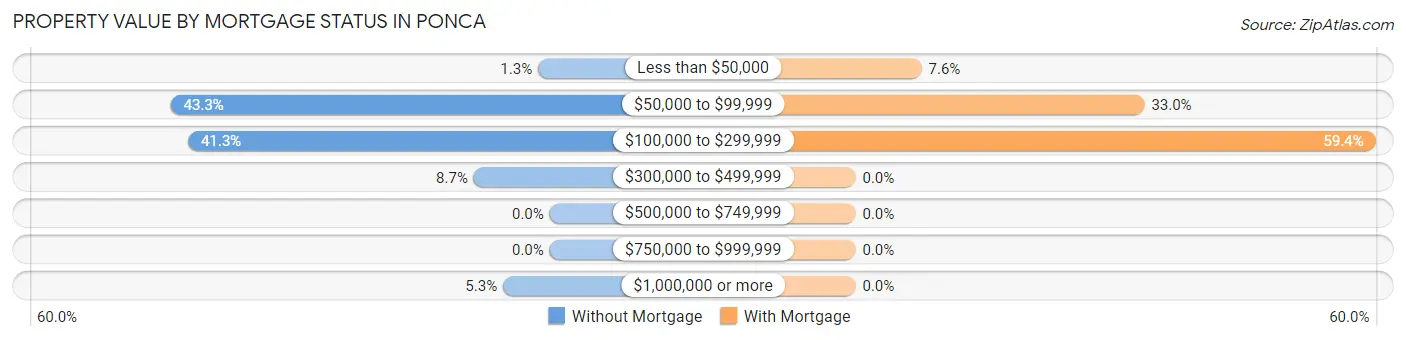
| Property Value | Without Mortgage | With Mortgage |
| Less than $50,000 | 2 (1.3%) | 8 (7.5%) |
| $50,000 to $99,999 | 65 (43.3%) | 35 (33.0%) |
| $100,000 to $299,999 | 62 (41.3%) | 63 (59.4%) |
| $300,000 to $499,999 | 13 (8.7%) | 0 (0.0%) |
| $500,000 to $749,999 | 0 (0.0%) | 0 (0.0%) |
| $750,000 to $999,999 | 0 (0.0%) | 0 (0.0%) |
| $1,000,000 or more | 8 (5.3%) | 0 (0.0%) |
| Total | 150 (100.0%) | 106 (100.0%) |
Household Income by Mortgage Status in Ponca
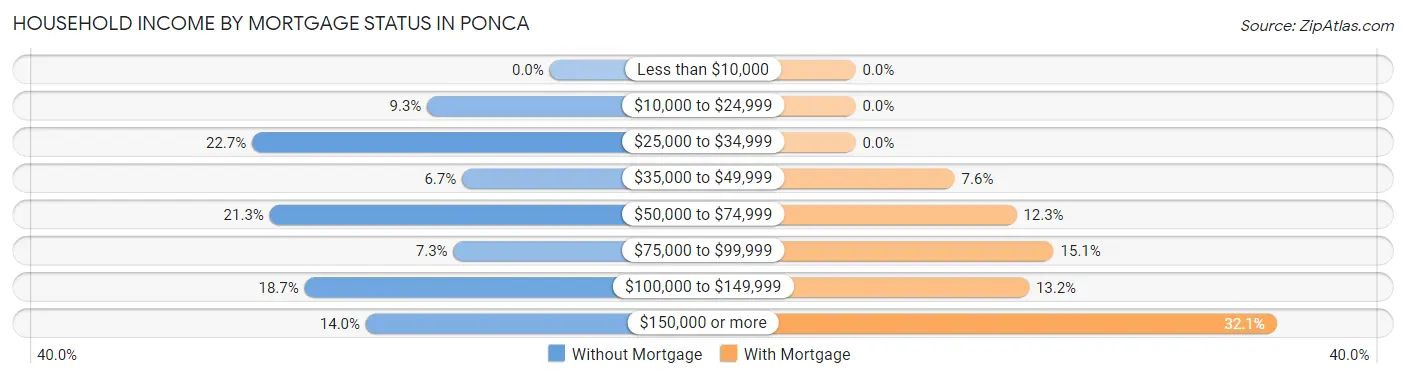
| Household Income | Without Mortgage | With Mortgage |
| Less than $10,000 | 0 (0.0%) | 0 (0.0%) |
| $10,000 to $24,999 | 14 (9.3%) | 0 (0.0%) |
| $25,000 to $34,999 | 34 (22.7%) | 0 (0.0%) |
| $35,000 to $49,999 | 10 (6.7%) | 8 (7.5%) |
| $50,000 to $74,999 | 32 (21.3%) | 13 (12.3%) |
| $75,000 to $99,999 | 11 (7.3%) | 16 (15.1%) |
| $100,000 to $149,999 | 28 (18.7%) | 14 (13.2%) |
| $150,000 or more | 21 (14.0%) | 34 (32.1%) |
| Total | 150 (100.0%) | 106 (100.0%) |
Property Value to Household Income Ratio in Ponca
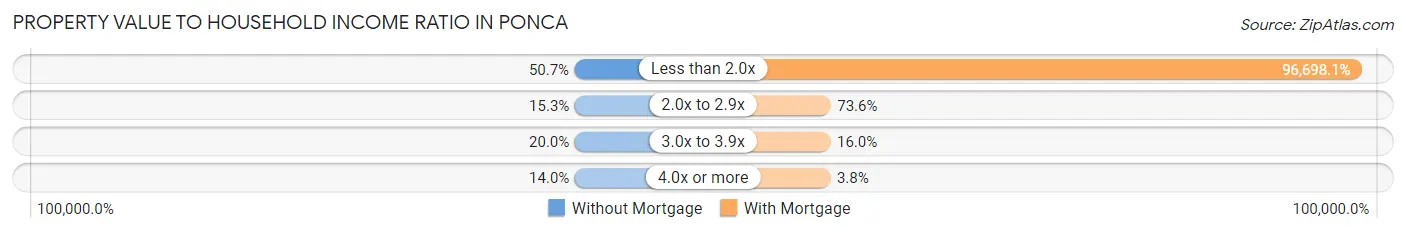
| Value-to-Income Ratio | Without Mortgage | With Mortgage |
| Less than 2.0x | 76 (50.7%) | 102,500 (96,698.1%) |
| 2.0x to 2.9x | 23 (15.3%) | 78 (73.6%) |
| 3.0x to 3.9x | 30 (20.0%) | 17 (16.0%) |
| 4.0x or more | 21 (14.0%) | 4 (3.8%) |
| Total | 150 (100.0%) | 106 (100.0%) |
Real Estate Taxes by Mortgage Status in Ponca
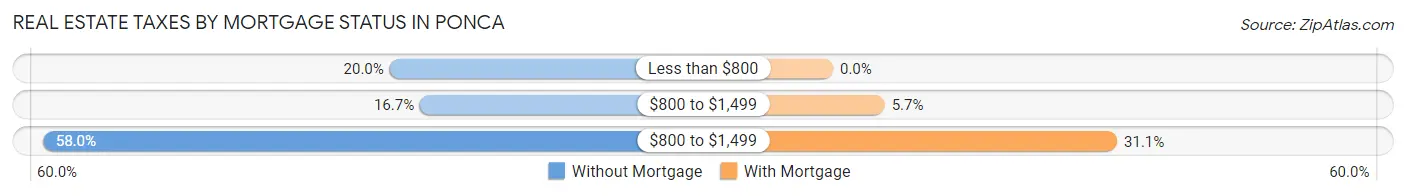
| Property Taxes | Without Mortgage | With Mortgage |
| Less than $800 | 30 (20.0%) | 0 (0.0%) |
| $800 to $1,499 | 25 (16.7%) | 6 (5.7%) |
| $800 to $1,499 | 87 (58.0%) | 33 (31.1%) |
| Total | 150 (100.0%) | 106 (100.0%) |
Health & Disability in Ponca
Health Insurance Coverage by Age in Ponca
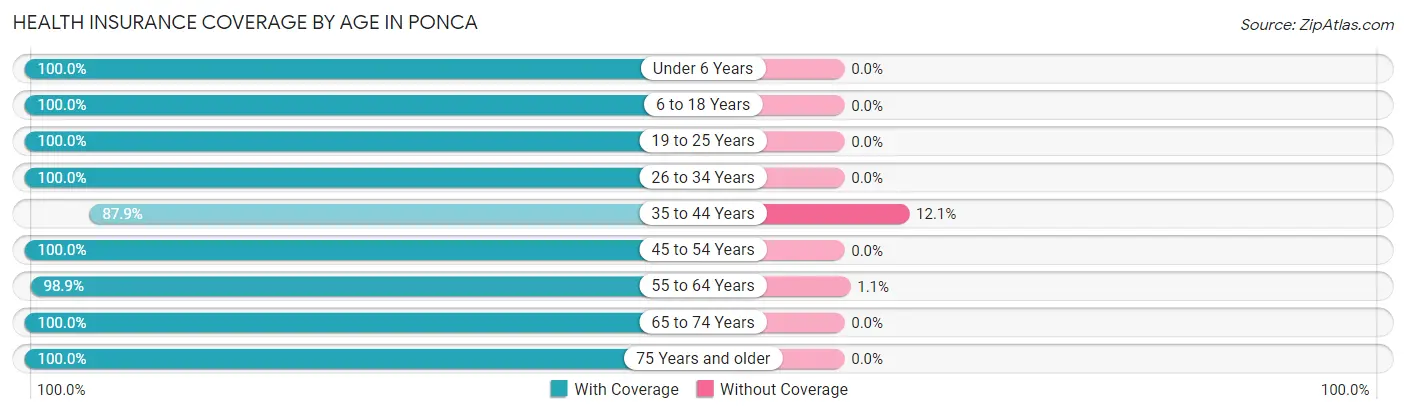
| Age Bracket | With Coverage | Without Coverage |
| Under 6 Years | 83 (100.0%) | 0 (0.0%) |
| 6 to 18 Years | 61 (100.0%) | 0 (0.0%) |
| 19 to 25 Years | 56 (100.0%) | 0 (0.0%) |
| 26 to 34 Years | 81 (100.0%) | 0 (0.0%) |
| 35 to 44 Years | 80 (87.9%) | 11 (12.1%) |
| 45 to 54 Years | 52 (100.0%) | 0 (0.0%) |
| 55 to 64 Years | 88 (98.9%) | 1 (1.1%) |
| 65 to 74 Years | 57 (100.0%) | 0 (0.0%) |
| 75 Years and older | 90 (100.0%) | 0 (0.0%) |
| Total | 648 (98.2%) | 12 (1.8%) |
Health Insurance Coverage by Citizenship Status in Ponca

| Citizenship Status | With Coverage | Without Coverage |
| Native Born | 83 (100.0%) | 0 (0.0%) |
| Foreign Born, Citizen | 61 (100.0%) | 0 (0.0%) |
| Foreign Born, not a Citizen | 56 (100.0%) | 0 (0.0%) |
Health Insurance Coverage by Household Income in Ponca
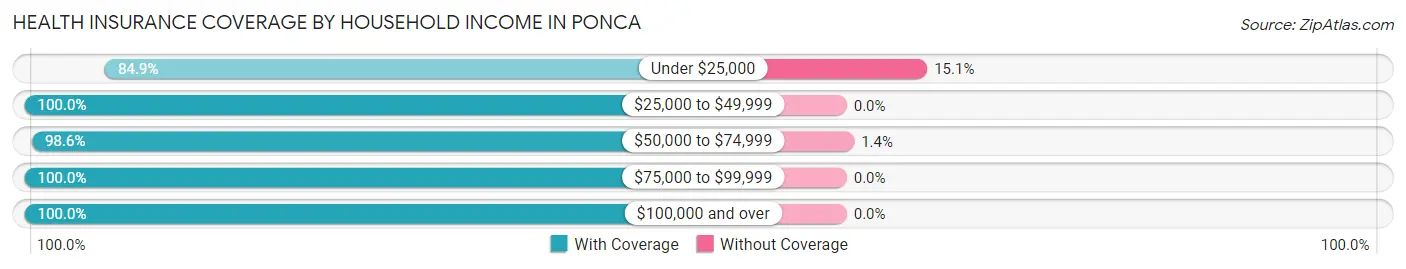
| Household Income | With Coverage | Without Coverage |
| Under $25,000 | 62 (84.9%) | 11 (15.1%) |
| $25,000 to $49,999 | 137 (100.0%) | 0 (0.0%) |
| $50,000 to $74,999 | 71 (98.6%) | 1 (1.4%) |
| $75,000 to $99,999 | 97 (100.0%) | 0 (0.0%) |
| $100,000 and over | 281 (100.0%) | 0 (0.0%) |
Public vs Private Health Insurance Coverage by Age in Ponca
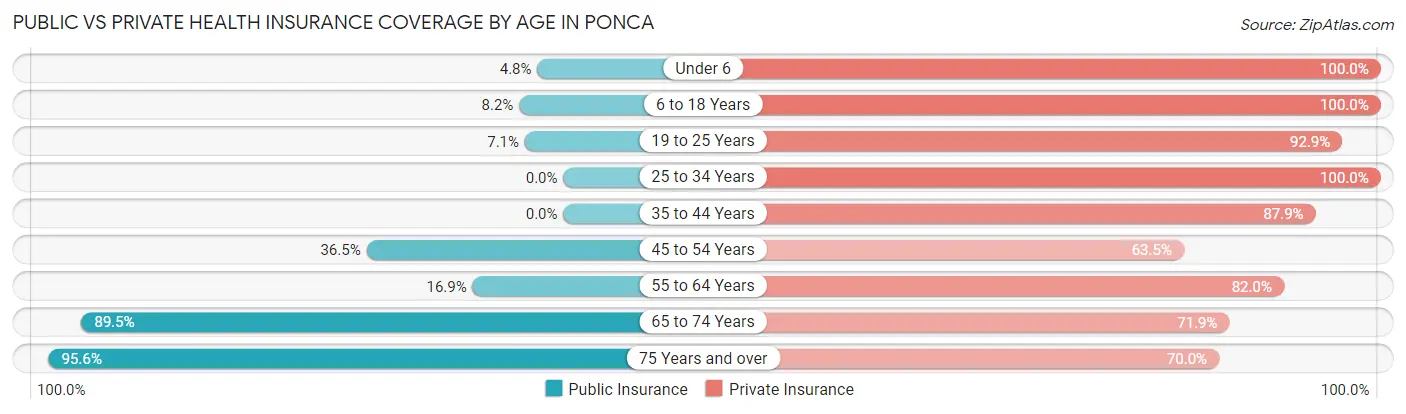
| Age Bracket | Public Insurance | Private Insurance |
| Under 6 | 4 (4.8%) | 83 (100.0%) |
| 6 to 18 Years | 5 (8.2%) | 61 (100.0%) |
| 19 to 25 Years | 4 (7.1%) | 52 (92.9%) |
| 25 to 34 Years | 0 (0.0%) | 81 (100.0%) |
| 35 to 44 Years | 0 (0.0%) | 80 (87.9%) |
| 45 to 54 Years | 19 (36.5%) | 33 (63.5%) |
| 55 to 64 Years | 15 (16.9%) | 73 (82.0%) |
| 65 to 74 Years | 51 (89.5%) | 41 (71.9%) |
| 75 Years and over | 86 (95.6%) | 63 (70.0%) |
| Total | 184 (27.9%) | 567 (85.9%) |
Disability Status by Sex by Age in Ponca
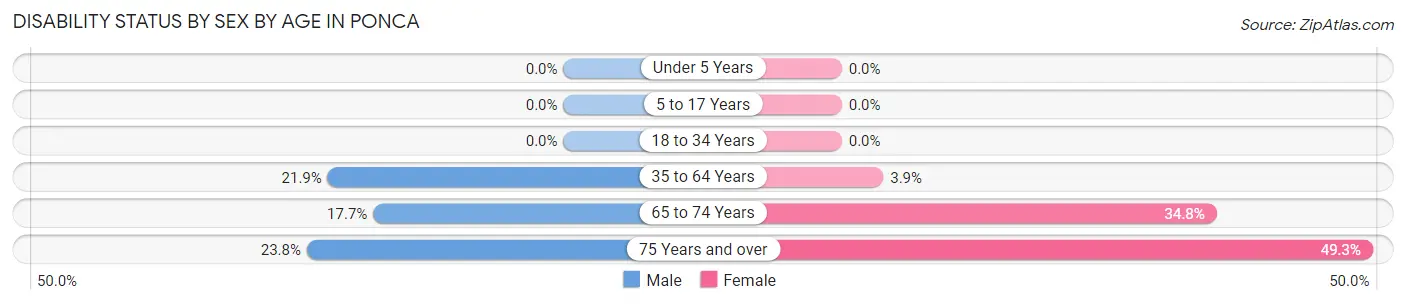
| Age Bracket | Male | Female |
| Under 5 Years | 0 (0.0%) | 0 (0.0%) |
| 5 to 17 Years | 0 (0.0%) | 0 (0.0%) |
| 18 to 34 Years | 0 (0.0%) | 0 (0.0%) |
| 35 to 64 Years | 28 (21.9%) | 4 (3.8%) |
| 65 to 74 Years | 6 (17.6%) | 8 (34.8%) |
| 75 Years and over | 5 (23.8%) | 34 (49.3%) |
Disability Class by Sex by Age in Ponca
Disability Class: Hearing Difficulty
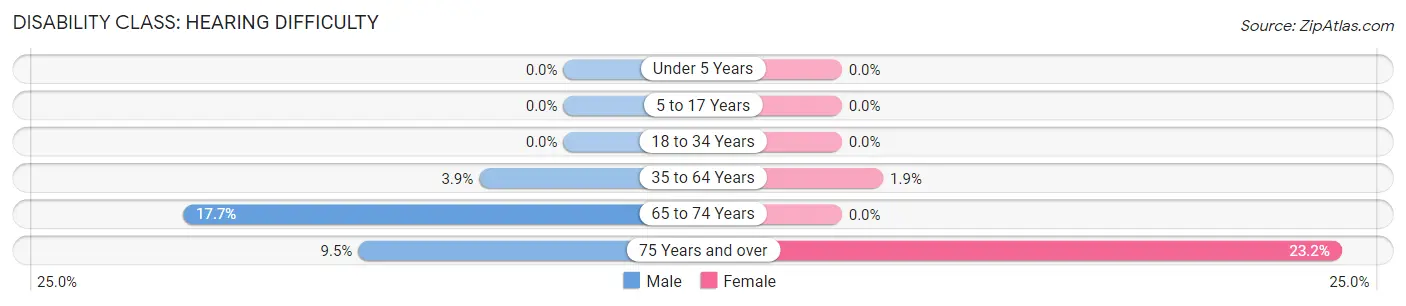
| Age Bracket | Male | Female |
| Under 5 Years | 0 (0.0%) | 0 (0.0%) |
| 5 to 17 Years | 0 (0.0%) | 0 (0.0%) |
| 18 to 34 Years | 0 (0.0%) | 0 (0.0%) |
| 35 to 64 Years | 5 (3.9%) | 2 (1.9%) |
| 65 to 74 Years | 6 (17.6%) | 0 (0.0%) |
| 75 Years and over | 2 (9.5%) | 16 (23.2%) |
Disability Class: Vision Difficulty
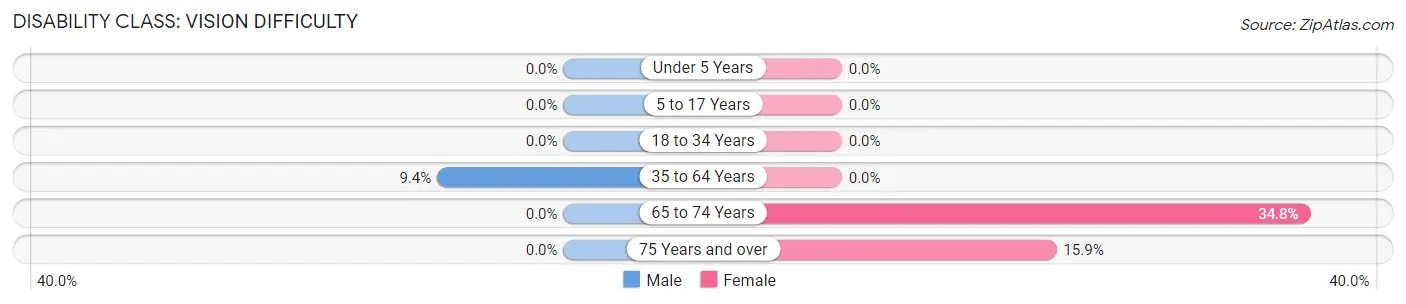
| Age Bracket | Male | Female |
| Under 5 Years | 0 (0.0%) | 0 (0.0%) |
| 5 to 17 Years | 0 (0.0%) | 0 (0.0%) |
| 18 to 34 Years | 0 (0.0%) | 0 (0.0%) |
| 35 to 64 Years | 12 (9.4%) | 0 (0.0%) |
| 65 to 74 Years | 0 (0.0%) | 8 (34.8%) |
| 75 Years and over | 0 (0.0%) | 11 (15.9%) |
Disability Class: Cognitive Difficulty
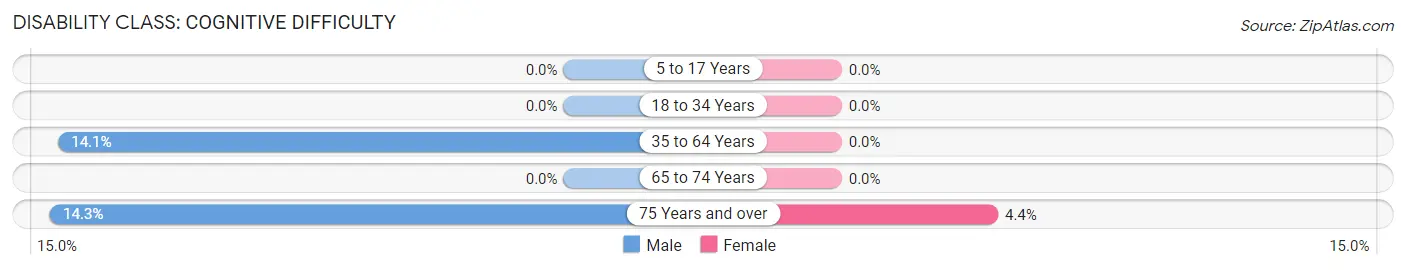
| Age Bracket | Male | Female |
| 5 to 17 Years | 0 (0.0%) | 0 (0.0%) |
| 18 to 34 Years | 0 (0.0%) | 0 (0.0%) |
| 35 to 64 Years | 18 (14.1%) | 0 (0.0%) |
| 65 to 74 Years | 0 (0.0%) | 0 (0.0%) |
| 75 Years and over | 3 (14.3%) | 3 (4.3%) |
Disability Class: Ambulatory Difficulty
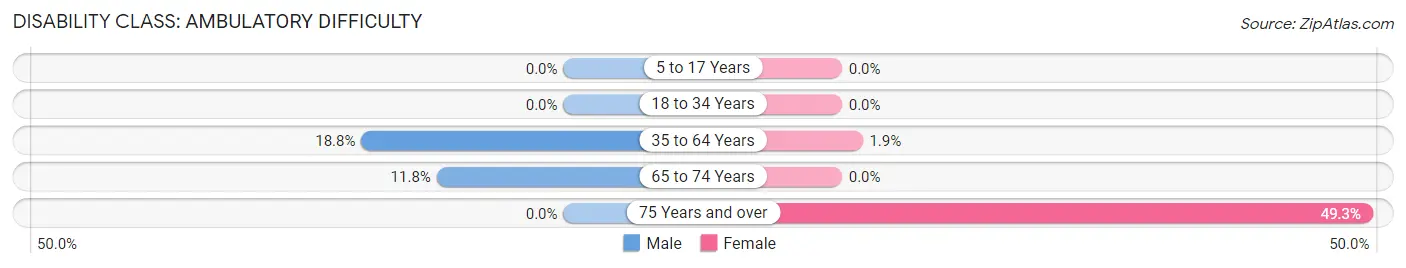
| Age Bracket | Male | Female |
| 5 to 17 Years | 0 (0.0%) | 0 (0.0%) |
| 18 to 34 Years | 0 (0.0%) | 0 (0.0%) |
| 35 to 64 Years | 24 (18.8%) | 2 (1.9%) |
| 65 to 74 Years | 4 (11.8%) | 0 (0.0%) |
| 75 Years and over | 0 (0.0%) | 34 (49.3%) |
Disability Class: Self-Care Difficulty
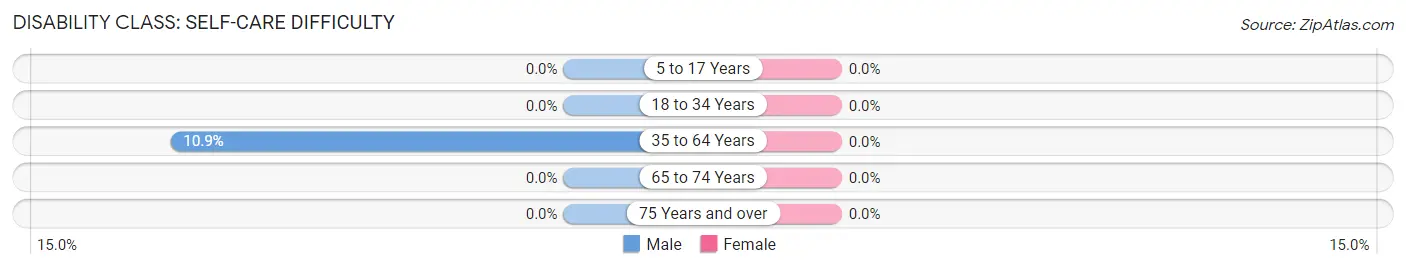
| Age Bracket | Male | Female |
| 5 to 17 Years | 0 (0.0%) | 0 (0.0%) |
| 18 to 34 Years | 0 (0.0%) | 0 (0.0%) |
| 35 to 64 Years | 14 (10.9%) | 0 (0.0%) |
| 65 to 74 Years | 0 (0.0%) | 0 (0.0%) |
| 75 Years and over | 0 (0.0%) | 0 (0.0%) |
Technology Access in Ponca
Computing Device Access in Ponca
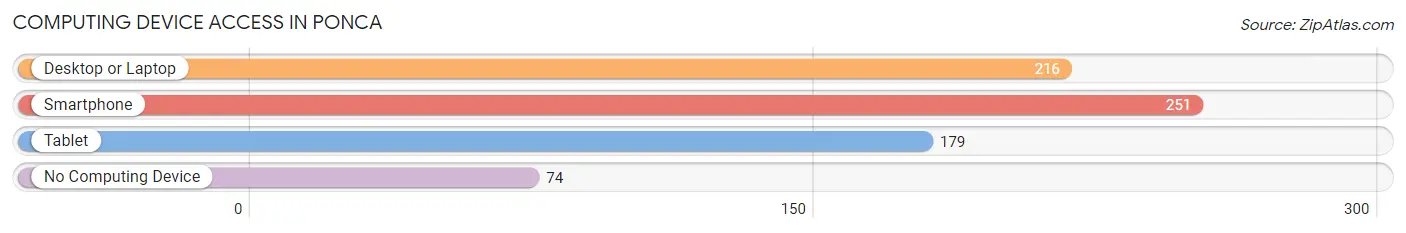
| Device Type | # Households | % Households |
| Desktop or Laptop | 216 | 62.3% |
| Smartphone | 251 | 72.3% |
| Tablet | 179 | 51.6% |
| No Computing Device | 74 | 21.3% |
| Total | 347 | 100.0% |
Internet Access in Ponca
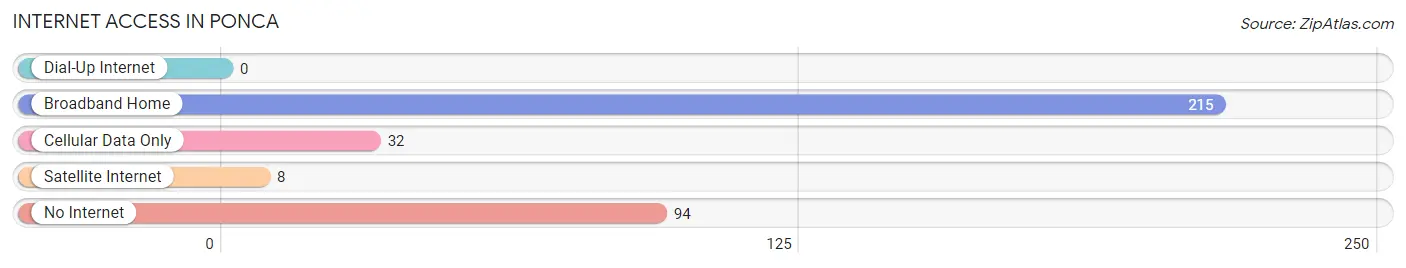
| Internet Type | # Households | % Households |
| Dial-Up Internet | 0 | 0.0% |
| Broadband Home | 215 | 62.0% |
| Cellular Data Only | 32 | 9.2% |
| Satellite Internet | 8 | 2.3% |
| No Internet | 94 | 27.1% |
| Total | 347 | 100.0% |
Ponca Summary
Ponca, Nebraska is a small city located in Dixon County, Nebraska. It is situated on the banks of the Missouri River, and is home to a population of approximately 1,000 people. The city is known for its rich history, diverse geography, and vibrant economy.
History
Ponca, Nebraska was founded in 1856 by a group of Ponca Indians who had been relocated from their ancestral lands in Oklahoma. The Ponca were a small tribe of Native Americans who had lived in the area for centuries before being forced to move by the US government. The Ponca were relocated to the area in order to make way for the construction of the Union Pacific Railroad. The Ponca were given a small plot of land in the area, and the city of Ponca was established.
The city of Ponca quickly grew in size and population, and by the early 1900s it had become a thriving community. The city was home to a variety of businesses, including a flour mill, a sawmill, a blacksmith shop, and a general store. The city also had a school, a post office, and a number of churches.
Geography
Ponca, Nebraska is located in Dixon County, Nebraska. The city is situated on the banks of the Missouri River, and is surrounded by rolling hills and lush farmland. The city is located in the heart of the Great Plains, and is known for its wide open spaces and beautiful scenery. The city is also home to a variety of wildlife, including deer, elk, and wild turkeys.
Economy
Ponca, Nebraska has a vibrant economy that is largely based on agriculture. The city is home to a number of farms and ranches, and the surrounding area is known for its production of corn, soybeans, and wheat. The city is also home to a number of businesses, including a grocery store, a hardware store, and a variety of restaurants.
Demographics
As of the 2010 census, the population of Ponca, Nebraska was 1,000 people. The city is predominantly white, with a small minority population of African Americans, Hispanics, and Native Americans. The median household income in the city is $41,000, and the median home value is $90,000. The city has a low unemployment rate, and the majority of the population is employed in the agricultural sector.
Ponca, Nebraska is a small city with a rich history, diverse geography, and vibrant economy. The city is home to a variety of businesses, and the surrounding area is known for its production of corn, soybeans, and wheat. The city is predominantly white, with a small minority population of African Americans, Hispanics, and Native Americans. The city has a low unemployment rate, and the majority of the population is employed in the agricultural sector.
Common Questions
What is Per Capita Income in Ponca?
Per Capita income in Ponca is $65,331.
What is the Median Family Income in Ponca?
Median Family Income in Ponca is $105,156.
What is the Median Household income in Ponca?
Median Household Income in Ponca is $58,542.
What is Income or Wage Gap in Ponca?
Income or Wage Gap in Ponca is 22.3%.
Women in Ponca earn 77.7 cents for every dollar earned by a man.
What is Inequality or Gini Index in Ponca?
Inequality or Gini Index in Ponca is 0.65.
What is the Total Population of Ponca?
Total Population of Ponca is 713.
What is the Total Male Population of Ponca?
Total Male Population of Ponca is 396.
What is the Total Female Population of Ponca?
Total Female Population of Ponca is 317.
What is the Ratio of Males per 100 Females in Ponca?
There are 124.92 Males per 100 Females in Ponca.
What is the Ratio of Females per 100 Males in Ponca?
There are 80.05 Females per 100 Males in Ponca.
What is the Median Population Age in Ponca?
Median Population Age in Ponca is 40.8 Years.
What is the Average Family Size in Ponca
Average Family Size in Ponca is 3.1 People.
What is the Average Household Size in Ponca
Average Household Size in Ponca is 1.9 People.
How Large is the Labor Force in Ponca?
There are 391 People in the Labor Forcein in Ponca.
What is the Percentage of People in the Labor Force in Ponca?
66.7% of People are in the Labor Force in Ponca.
What is the Unemployment Rate in Ponca?
Unemployment Rate in Ponca is 4.6%.