Zip Codes with the Highest Percentage of Population with a Degree in Visual and Performing Arts in Bellevue, NE
RELATED REPORTS & OPTIONS
Visual and Performing Arts
Bellevue
Compare Zip Codes
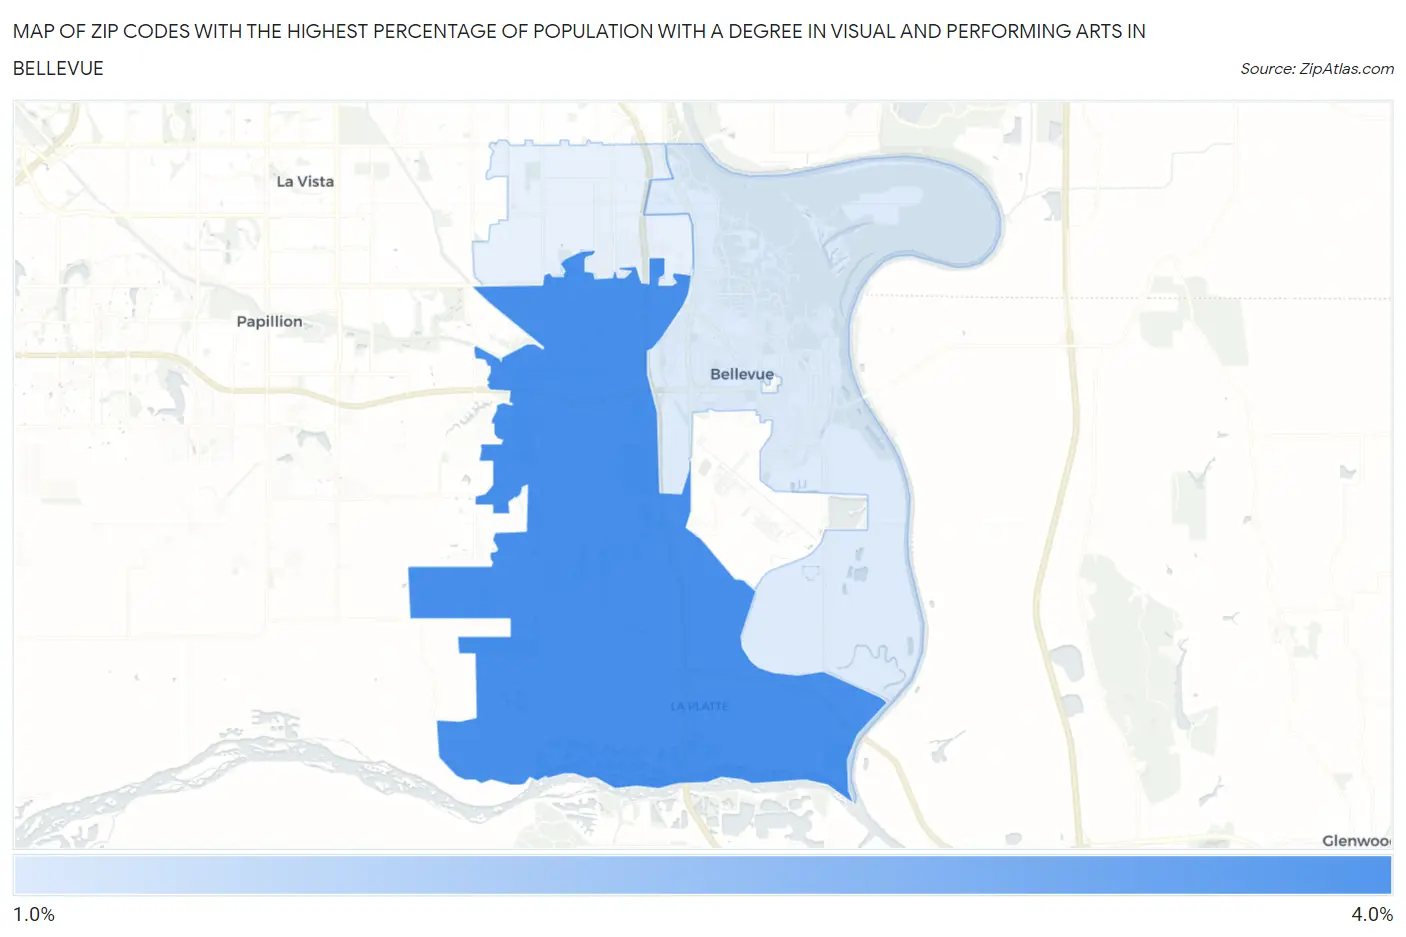
Map of Zip Codes with the Highest Percentage of Population with a Degree in Visual and Performing Arts in Bellevue
1.9%
3.3%
Zip Codes with the Highest Percentage of Population with a Degree in Visual and Performing Arts in Bellevue, NE
| Zip Code | % Graduates | vs State | vs National | |
| 1. | 68123 | 3.3% | 3.3%(+0.046)#132 | 4.3%(-0.937)#11,543 |
| 2. | 68005 | 1.9% | 3.3%(-1.38)#195 | 4.3%(-2.36)#16,815 |
1
Common Questions
What are the Top Zip Codes with the Highest Percentage of Population with a Degree in Visual and Performing Arts in Bellevue, NE?
Top Zip Codes with the Highest Percentage of Population with a Degree in Visual and Performing Arts in Bellevue, NE are:
What zip code has the Highest Percentage of Population with a Degree in Visual and Performing Arts in Bellevue, NE?
68123 has the Highest Percentage of Population with a Degree in Visual and Performing Arts in Bellevue, NE with 3.3%.
What is the Percentage of Population with a Degree in Visual and Performing Arts in Bellevue, NE?
Percentage of Population with a Degree in Visual and Performing Arts in Bellevue is 1.8%.
What is the Percentage of Population with a Degree in Visual and Performing Arts in Nebraska?
Percentage of Population with a Degree in Visual and Performing Arts in Nebraska is 3.3%.
What is the Percentage of Population with a Degree in Visual and Performing Arts in the United States?
Percentage of Population with a Degree in Visual and Performing Arts in the United States is 4.3%.