Zip Codes with the Highest Percentage of Population with a Degree in Visual and Performing Arts in Grand Island, NE
RELATED REPORTS & OPTIONS
Visual and Performing Arts
Grand Island
Compare Zip Codes
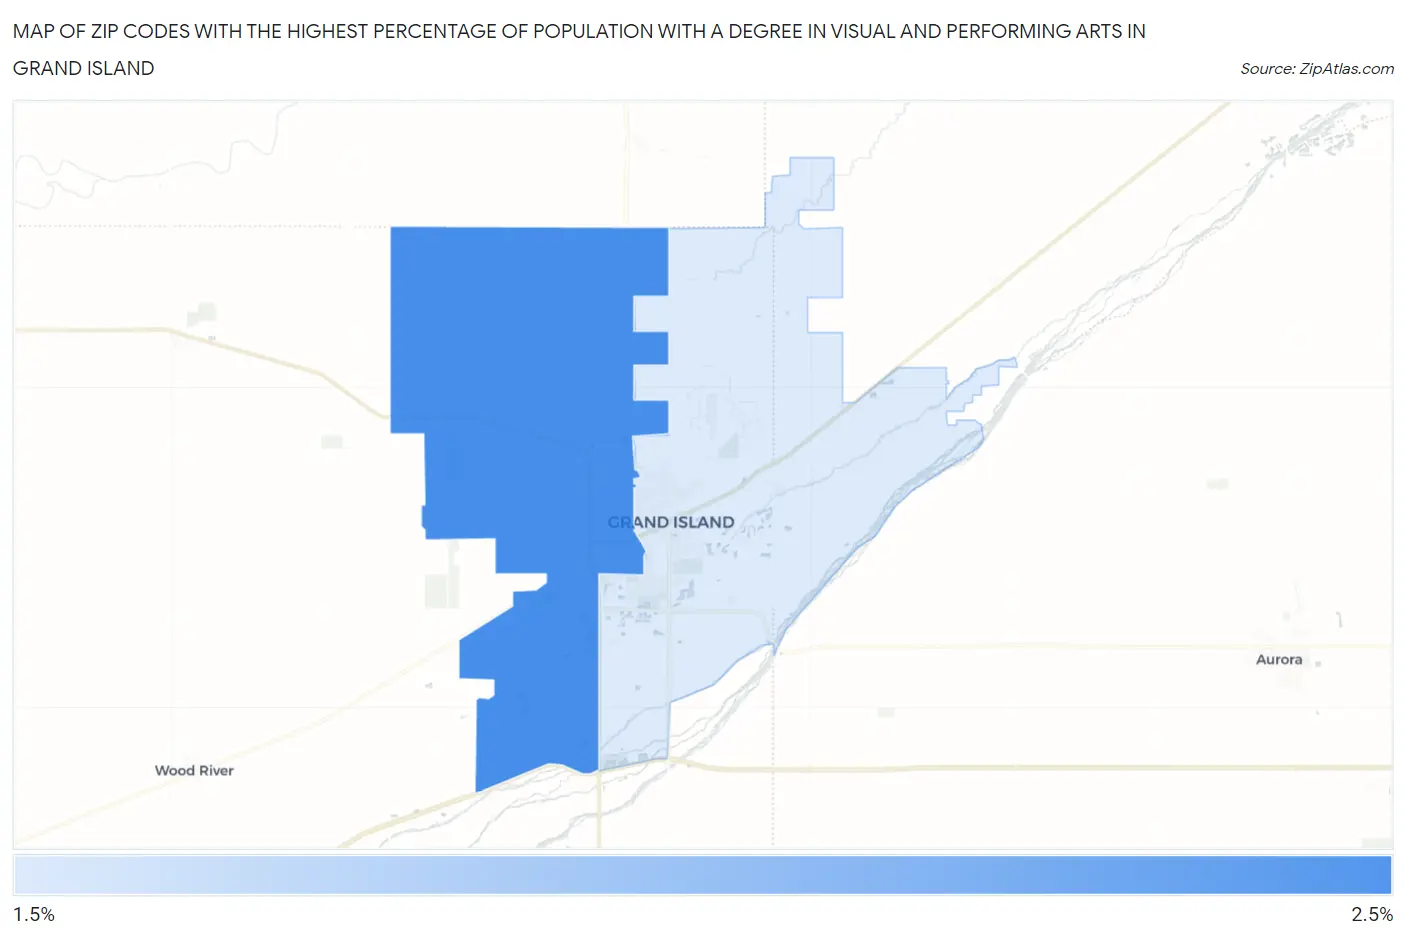
Map of Zip Codes with the Highest Percentage of Population with a Degree in Visual and Performing Arts in Grand Island
1.7%
2.4%
Zip Codes with the Highest Percentage of Population with a Degree in Visual and Performing Arts in Grand Island, NE
| Zip Code | % Graduates | vs State | vs National | |
| 1. | 68803 | 2.4% | 3.3%(-0.825)#167 | 4.3%(-1.81)#14,818 |
| 2. | 68801 | 1.7% | 3.3%(-1.60)#217 | 4.3%(-2.59)#17,620 |
1
Common Questions
What are the Top Zip Codes with the Highest Percentage of Population with a Degree in Visual and Performing Arts in Grand Island, NE?
Top Zip Codes with the Highest Percentage of Population with a Degree in Visual and Performing Arts in Grand Island, NE are:
What zip code has the Highest Percentage of Population with a Degree in Visual and Performing Arts in Grand Island, NE?
68803 has the Highest Percentage of Population with a Degree in Visual and Performing Arts in Grand Island, NE with 2.4%.
What is the Percentage of Population with a Degree in Visual and Performing Arts in Grand Island, NE?
Percentage of Population with a Degree in Visual and Performing Arts in Grand Island is 2.3%.
What is the Percentage of Population with a Degree in Visual and Performing Arts in Nebraska?
Percentage of Population with a Degree in Visual and Performing Arts in Nebraska is 3.3%.
What is the Percentage of Population with a Degree in Visual and Performing Arts in the United States?
Percentage of Population with a Degree in Visual and Performing Arts in the United States is 4.3%.