Zip Codes with the Highest Percentage of Families with Income Above $200,000 in Papillion, NE
RELATED REPORTS & OPTIONS
Family Income | $200k+
Papillion
Compare Zip Codes
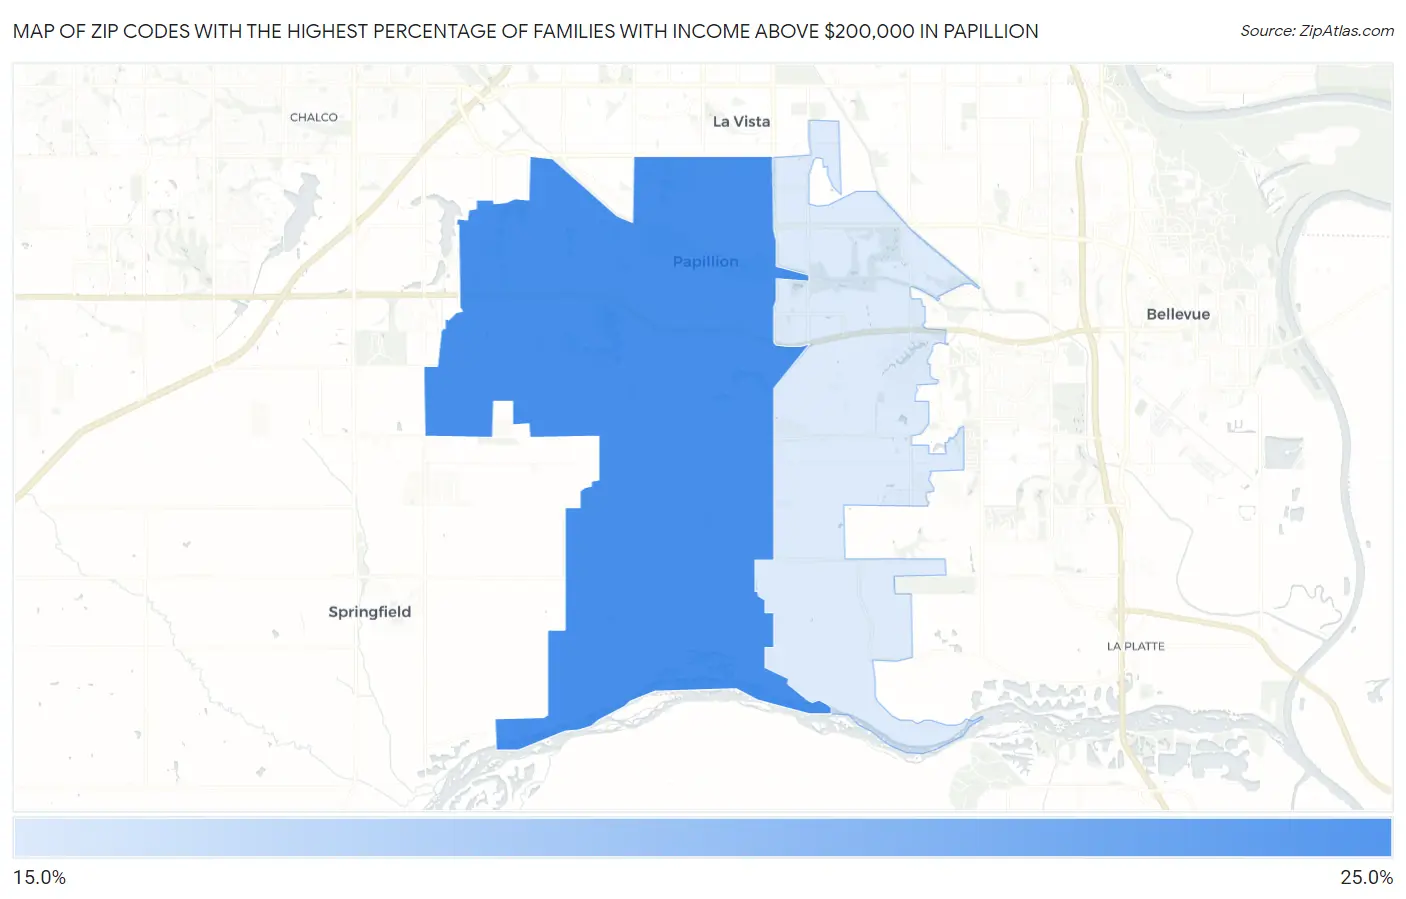
Map of Zip Codes with the Highest Percentage of Families with Income Above $200,000 in Papillion
21.3%
23.3%
Zip Codes with the Highest Percentage of Families with Income Above $200,000 in Papillion, NE
| Zip Code | Families with Income > $200k | vs State | vs National | |
| 1. | 68046 | 23.3% | 10.9%(+12.4)#31 | 14.8%(+8.50)#3,876 |
| 2. | 68133 | 21.3% | 10.9%(+10.4)#41 | 14.8%(+6.50)#4,409 |
1
Common Questions
What are the Top Zip Codes with the Highest Percentage of Families with Income Above $200,000 in Papillion, NE?
Top Zip Codes with the Highest Percentage of Families with Income Above $200,000 in Papillion, NE are:
What zip code has the Highest Percentage of Families with Income Above $200,000 in Papillion, NE?
68046 has the Highest Percentage of Families with Income Above $200,000 in Papillion, NE with 23.3%.
What is the Percentage of Families with Income Above $200,000 in Papillion, NE?
Percentage of Families with Income Above $200,000 in Papillion is 17.4%.
What is the Percentage of Families with Income Above $200,000 in Nebraska?
Percentage of Families with Income Above $200,000 in Nebraska is 10.9%.
What is the Percentage of Families with Income Above $200,000 in the United States?
Percentage of Families with Income Above $200,000 in the United States is 14.8%.