Zip Codes with the Lowest Poverty Level Among Children Under the Age of 5 in Nebraska
RELATED REPORTS & OPTIONS
Lowest Poverty | Child 0-5
Nebraska
Compare Zip Codes
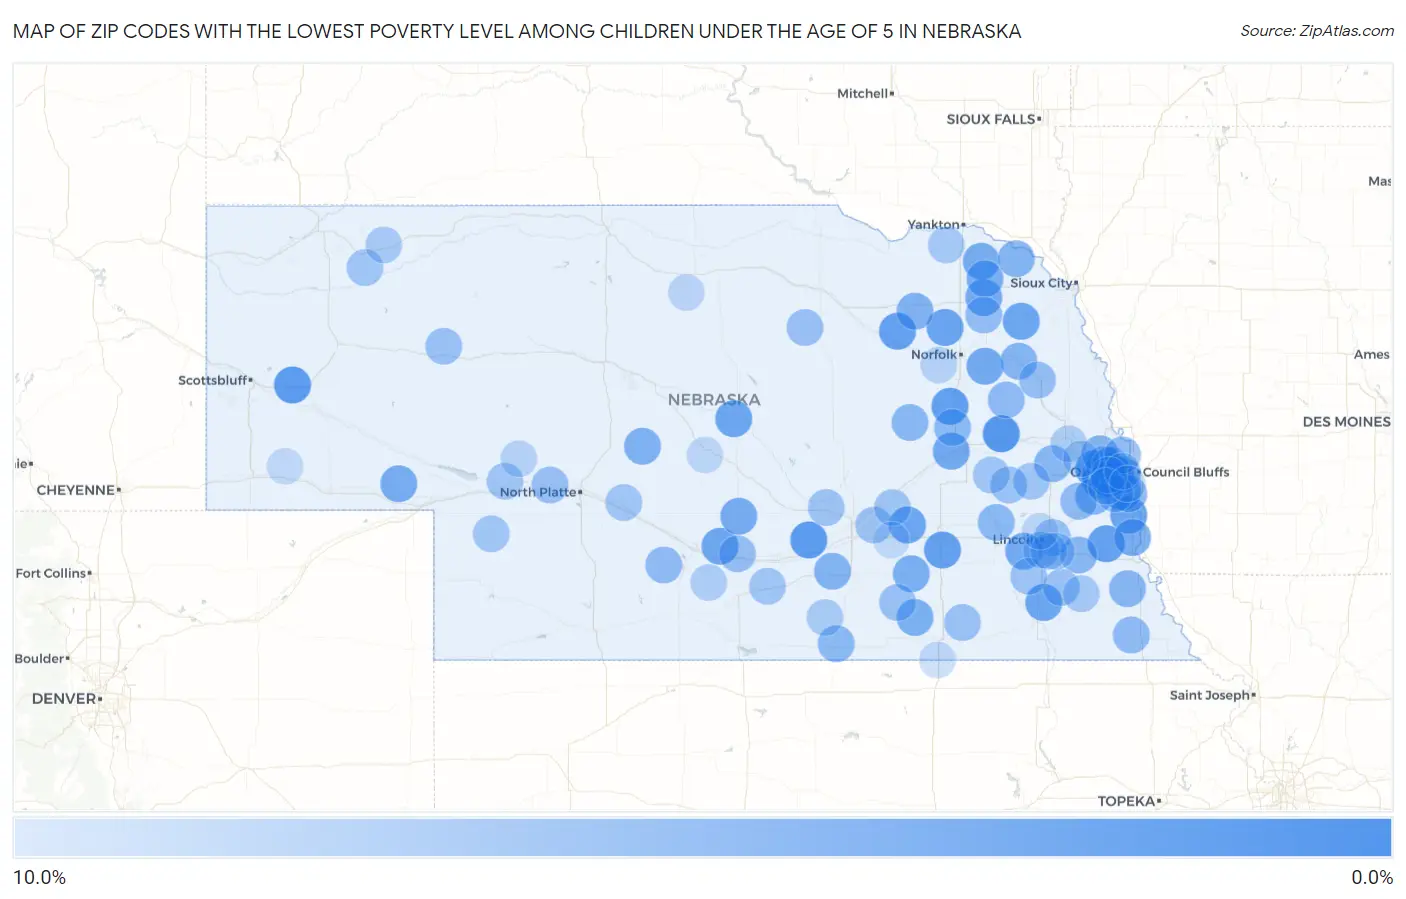
Map of Zip Codes with the Lowest Poverty Level Among Children Under the Age of 5 in Nebraska
10.0%
0.0%
Zip Codes with the Lowest Poverty Level Among Children Under the Age of 5 in Nebraska
| Zip Code | Child Poverty | vs State | vs National | |
| 1. | 68661 | 0.35% | 13.8%(-13.4)#1 | 18.1%(-17.7)#23 |
| 2. | 68022 | 0.63% | 13.8%(-13.1)#2 | 18.1%(-17.4)#106 |
| 3. | 69334 | 0.65% | 13.8%(-13.1)#3 | 18.1%(-17.4)#112 |
| 4. | 68876 | 0.66% | 13.8%(-13.1)#4 | 18.1%(-17.4)#117 |
| 5. | 68154 | 0.72% | 13.8%(-13.1)#5 | 18.1%(-17.3)#138 |
| 6. | 68642 | 1.3% | 13.8%(-12.5)#6 | 18.1%(-16.8)#421 |
| 7. | 68401 | 1.4% | 13.8%(-12.4)#7 | 18.1%(-16.7)#470 |
| 8. | 68756 | 1.4% | 13.8%(-12.3)#8 | 18.1%(-16.6)#499 |
| 9. | 68307 | 1.6% | 13.8%(-12.2)#9 | 18.1%(-16.5)#573 |
| 10. | 68130 | 1.7% | 13.8%(-12.0)#10 | 18.1%(-16.3)#666 |
| 11. | 68048 | 2.0% | 13.8%(-11.8)#11 | 18.1%(-16.1)#811 |
| 12. | 68767 | 2.0% | 13.8%(-11.8)#12 | 18.1%(-16.1)#813 |
| 13. | 68135 | 2.0% | 13.8%(-11.8)#13 | 18.1%(-16.1)#814 |
| 14. | 68874 | 2.0% | 13.8%(-11.7)#14 | 18.1%(-16.0)#861 |
| 15. | 68843 | 2.1% | 13.8%(-11.7)#15 | 18.1%(-16.0)#889 |
| 16. | 68422 | 2.1% | 13.8%(-11.7)#16 | 18.1%(-16.0)#891 |
| 17. | 68784 | 2.1% | 13.8%(-11.6)#17 | 18.1%(-15.9)#933 |
| 18. | 68863 | 2.2% | 13.8%(-11.6)#18 | 18.1%(-15.9)#954 |
| 19. | 68634 | 2.6% | 13.8%(-11.2)#19 | 18.1%(-15.5)#1,201 |
| 20. | 68779 | 2.6% | 13.8%(-11.2)#20 | 18.1%(-15.5)#1,227 |
| 21. | 68339 | 2.8% | 13.8%(-11.0)#21 | 18.1%(-15.3)#1,352 |
| 22. | 68717 | 2.8% | 13.8%(-11.0)#22 | 18.1%(-15.3)#1,356 |
| 23. | 68858 | 2.9% | 13.8%(-10.9)#23 | 18.1%(-15.2)#1,413 |
| 24. | 68133 | 3.0% | 13.8%(-10.8)#24 | 18.1%(-15.1)#1,482 |
| 25. | 69129 | 3.0% | 13.8%(-10.8)#25 | 18.1%(-15.1)#1,491 |
| 26. | 68455 | 3.0% | 13.8%(-10.7)#26 | 18.1%(-15.0)#1,525 |
| 27. | 68116 | 3.1% | 13.8%(-10.7)#27 | 18.1%(-15.0)#1,552 |
| 28. | 68739 | 3.1% | 13.8%(-10.7)#28 | 18.1%(-15.0)#1,557 |
| 29. | 68979 | 3.3% | 13.8%(-10.4)#29 | 18.1%(-14.7)#1,723 |
| 30. | 68727 | 3.3% | 13.8%(-10.4)#30 | 18.1%(-14.7)#1,727 |
| 31. | 68124 | 3.4% | 13.8%(-10.3)#31 | 18.1%(-14.6)#1,790 |
| 32. | 68335 | 3.4% | 13.8%(-10.3)#32 | 18.1%(-14.6)#1,801 |
| 33. | 69120 | 3.6% | 13.8%(-10.2)#33 | 18.1%(-14.5)#1,876 |
| 34. | 68769 | 3.8% | 13.8%(-10.00)#34 | 18.1%(-14.3)#2,006 |
| 35. | 68955 | 3.9% | 13.8%(-9.82)#35 | 18.1%(-14.1)#2,127 |
| 36. | 68791 | 4.1% | 13.8%(-9.64)#36 | 18.1%(-13.9)#2,281 |
| 37. | 68757 | 4.2% | 13.8%(-9.61)#37 | 18.1%(-13.9)#2,311 |
| 38. | 68123 | 4.2% | 13.8%(-9.60)#38 | 18.1%(-13.9)#2,317 |
| 39. | 68028 | 4.2% | 13.8%(-9.60)#39 | 18.1%(-13.9)#2,318 |
| 40. | 68007 | 4.2% | 13.8%(-9.58)#40 | 18.1%(-13.9)#2,332 |
| 41. | 68018 | 4.3% | 13.8%(-9.42)#41 | 18.1%(-13.7)#2,450 |
| 42. | 68320 | 4.3% | 13.8%(-9.42)#42 | 18.1%(-13.7)#2,457 |
| 43. | 68660 | 4.5% | 13.8%(-9.29)#43 | 18.1%(-13.6)#2,540 |
| 44. | 68418 | 4.5% | 13.8%(-9.26)#44 | 18.1%(-13.6)#2,568 |
| 45. | 68653 | 4.5% | 13.8%(-9.23)#45 | 18.1%(-13.5)#2,595 |
| 46. | 68434 | 4.6% | 13.8%(-9.13)#46 | 18.1%(-13.4)#2,661 |
| 47. | 68970 | 4.7% | 13.8%(-9.08)#47 | 18.1%(-13.4)#2,689 |
| 48. | 68641 | 4.8% | 13.8%(-9.01)#48 | 18.1%(-13.3)#2,734 |
| 49. | 68003 | 4.9% | 13.8%(-8.86)#49 | 18.1%(-13.2)#2,837 |
| 50. | 68106 | 4.9% | 13.8%(-8.84)#50 | 18.1%(-13.1)#2,858 |
| 51. | 68376 | 5.0% | 13.8%(-8.77)#51 | 18.1%(-13.1)#2,908 |
| 52. | 69028 | 5.0% | 13.8%(-8.77)#52 | 18.1%(-13.1)#2,911 |
| 53. | 68137 | 5.0% | 13.8%(-8.73)#53 | 18.1%(-13.0)#2,932 |
| 54. | 68164 | 5.2% | 13.8%(-8.55)#54 | 18.1%(-12.8)#3,050 |
| 55. | 68723 | 5.3% | 13.8%(-8.51)#55 | 18.1%(-12.8)#3,076 |
| 56. | 68152 | 5.3% | 13.8%(-8.48)#56 | 18.1%(-12.8)#3,091 |
| 57. | 68046 | 5.4% | 13.8%(-8.36)#57 | 18.1%(-12.6)#3,177 |
| 58. | 68836 | 5.4% | 13.8%(-8.33)#58 | 18.1%(-12.6)#3,197 |
| 59. | 68788 | 5.6% | 13.8%(-8.22)#59 | 18.1%(-12.5)#3,278 |
| 60. | 69143 | 5.7% | 13.8%(-8.06)#60 | 18.1%(-12.3)#3,404 |
| 61. | 68725 | 5.7% | 13.8%(-8.06)#61 | 18.1%(-12.3)#3,410 |
| 62. | 68301 | 5.8% | 13.8%(-7.95)#62 | 18.1%(-12.2)#3,472 |
| 63. | 68935 | 5.9% | 13.8%(-7.89)#63 | 18.1%(-12.2)#3,514 |
| 64. | 68626 | 5.9% | 13.8%(-7.89)#64 | 18.1%(-12.2)#3,517 |
| 65. | 68303 | 5.9% | 13.8%(-7.89)#65 | 18.1%(-12.2)#3,523 |
| 66. | 69333 | 5.9% | 13.8%(-7.89)#66 | 18.1%(-12.2)#3,525 |
| 67. | 68505 | 5.9% | 13.8%(-7.88)#67 | 18.1%(-12.2)#3,527 |
| 68. | 68368 | 6.1% | 13.8%(-7.71)#68 | 18.1%(-12.0)#3,645 |
| 69. | 68865 | 6.1% | 13.8%(-7.65)#69 | 18.1%(-11.9)#3,684 |
| 70. | 68824 | 6.1% | 13.8%(-7.63)#70 | 18.1%(-11.9)#3,695 |
| 71. | 68526 | 6.2% | 13.8%(-7.60)#71 | 18.1%(-11.9)#3,714 |
| 72. | 69155 | 6.2% | 13.8%(-7.52)#72 | 18.1%(-11.8)#3,777 |
| 73. | 68070 | 6.2% | 13.8%(-7.52)#73 | 18.1%(-11.8)#3,778 |
| 74. | 69123 | 6.2% | 13.8%(-7.52)#74 | 18.1%(-11.8)#3,781 |
| 75. | 68924 | 6.3% | 13.8%(-7.48)#75 | 18.1%(-11.8)#3,808 |
| 76. | 68632 | 6.3% | 13.8%(-7.48)#76 | 18.1%(-11.8)#3,809 |
| 77. | 69347 | 6.3% | 13.8%(-7.42)#77 | 18.1%(-11.7)#3,842 |
| 78. | 69150 | 6.5% | 13.8%(-7.32)#78 | 18.1%(-11.6)#3,909 |
| 79. | 68144 | 6.5% | 13.8%(-7.30)#79 | 18.1%(-11.6)#3,919 |
| 80. | 68854 | 6.5% | 13.8%(-7.25)#80 | 18.1%(-11.5)#3,950 |
| 81. | 68443 | 6.7% | 13.8%(-7.04)#81 | 18.1%(-11.3)#4,090 |
| 82. | 68138 | 6.8% | 13.8%(-6.97)#82 | 18.1%(-11.3)#4,149 |
| 83. | 68730 | 6.8% | 13.8%(-6.92)#83 | 18.1%(-11.2)#4,181 |
| 84. | 68512 | 6.9% | 13.8%(-6.92)#84 | 18.1%(-11.2)#4,185 |
| 85. | 69360 | 7.0% | 13.8%(-6.82)#85 | 18.1%(-11.1)#4,263 |
| 86. | 68516 | 7.1% | 13.8%(-6.70)#86 | 18.1%(-11.0)#4,332 |
| 87. | 68928 | 7.1% | 13.8%(-6.63)#87 | 18.1%(-10.9)#4,391 |
| 88. | 68927 | 7.4% | 13.8%(-6.42)#88 | 18.1%(-10.7)#4,511 |
| 89. | 68025 | 7.4% | 13.8%(-6.36)#89 | 18.1%(-10.6)#4,557 |
| 90. | 68064 | 7.9% | 13.8%(-5.86)#90 | 18.1%(-10.2)#4,856 |
| 91. | 68715 | 8.0% | 13.8%(-5.77)#91 | 18.1%(-10.1)#4,918 |
| 92. | 69165 | 8.0% | 13.8%(-5.77)#92 | 18.1%(-10.1)#4,919 |
| 93. | 69210 | 8.4% | 13.8%(-5.39)#93 | 18.1%(-9.68)#5,173 |
| 94. | 68132 | 8.6% | 13.8%(-5.19)#94 | 18.1%(-9.48)#5,312 |
| 95. | 68822 | 8.6% | 13.8%(-5.17)#95 | 18.1%(-9.46)#5,327 |
| 96. | 68147 | 8.7% | 13.8%(-5.11)#96 | 18.1%(-9.40)#5,375 |
| 97. | 68521 | 8.7% | 13.8%(-5.08)#97 | 18.1%(-9.37)#5,392 |
| 98. | 68327 | 8.7% | 13.8%(-5.08)#98 | 18.1%(-9.37)#5,409 |
| 99. | 69156 | 8.8% | 13.8%(-4.95)#99 | 18.1%(-9.24)#5,495 |
| 100. | 68818 | 8.9% | 13.8%(-4.88)#100 | 18.1%(-9.17)#5,531 |
Common Questions
What are the Top 10 Zip Codes with the Lowest Poverty Level Among Children Under the Age of 5 in Nebraska?
Top 10 Zip Codes with the Lowest Poverty Level Among Children Under the Age of 5 in Nebraska are:
What zip code has the Lowest Poverty Level Among Children Under the Age of 5 in Nebraska?
68661 has the Lowest Poverty Level Among Children Under the Age of 5 in Nebraska with 0.35%.
What is the Poverty Level Among Children Under the Age of 5 in the State of Nebraska?
Poverty Level Among Children Under the Age of 5 in Nebraska is 13.8%.
What is the Poverty Level Among Children Under the Age of 5 in the United States?
Poverty Level Among Children Under the Age of 5 in the United States is 18.1%.