Zip Codes with the Highest Percentage of Households Without a Vehicle in Missoula, MT
RELATED REPORTS & OPTIONS
Households without a Cars
Missoula
Compare Zip Codes
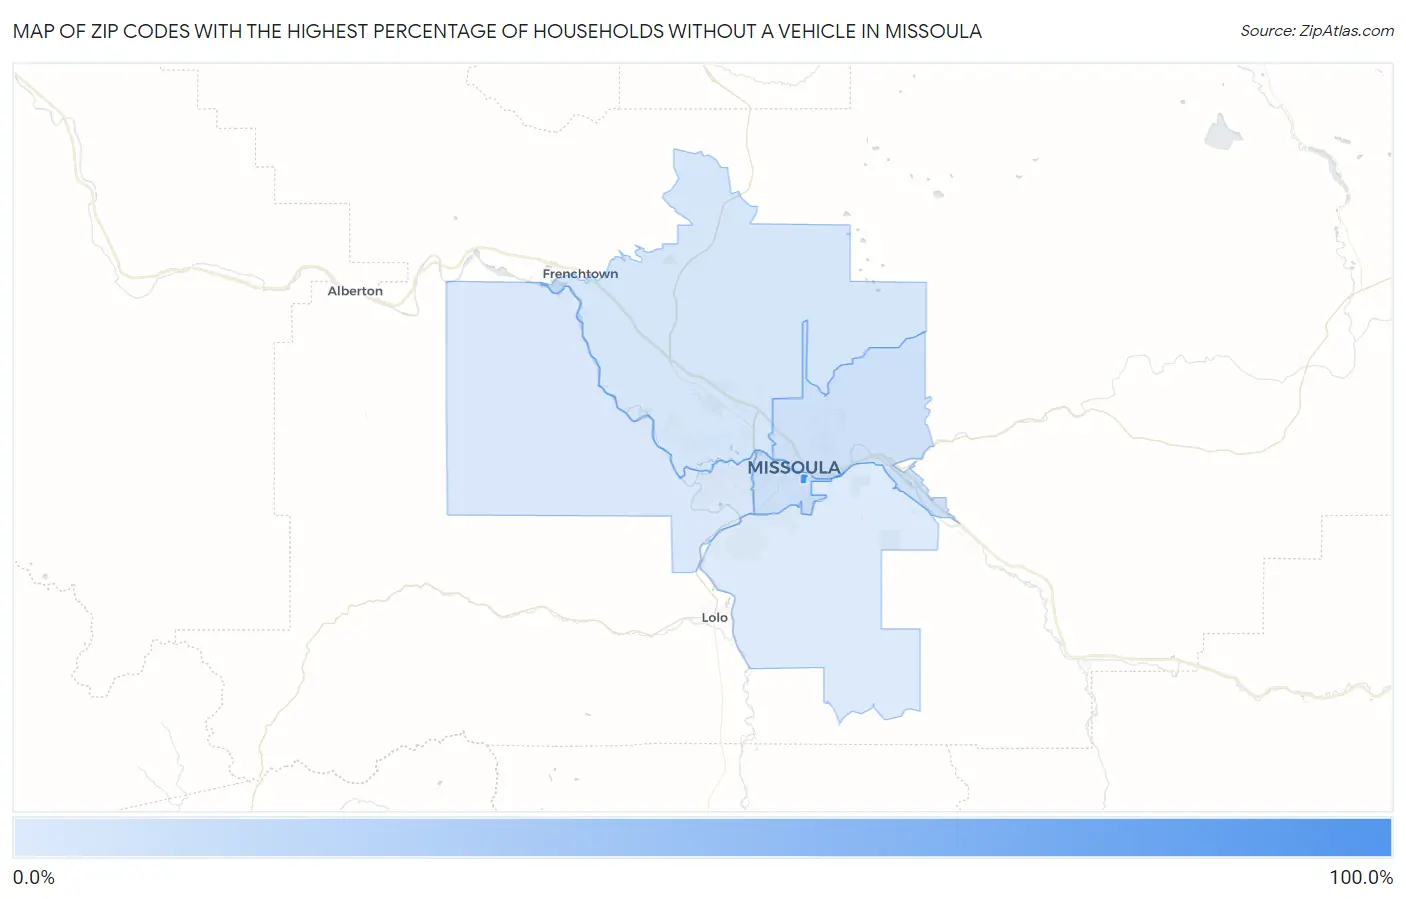
Map of Zip Codes with the Highest Percentage of Households Without a Vehicle in Missoula
1.4%
100.0%
Zip Codes with the Highest Percentage of Households Without a Vehicle in Missoula, MT
| Zip Code | Housholds Without a Car | vs State | vs National | |
| 1. | 59812 | 100.0% | 4.6%(+95.4)#1 | 8.3%(+91.7)#11 |
| 2. | 59801 | 8.5% | 4.6%(+3.90)#35 | 8.3%(+0.200)#6,312 |
| 3. | 59802 | 8.4% | 4.6%(+3.80)#36 | 8.3%(+0.100)#6,443 |
| 4. | 59808 | 5.1% | 4.6%(+0.500)#82 | 8.3%(-3.20)#12,631 |
| 5. | 59804 | 2.8% | 4.6%(-1.80)#131 | 8.3%(-5.50)#19,836 |
| 6. | 59803 | 1.4% | 4.6%(-3.20)#181 | 8.3%(-6.90)#24,450 |
1
Common Questions
What are the Top 5 Zip Codes with the Highest Percentage of Households Without a Vehicle in Missoula, MT?
Top 5 Zip Codes with the Highest Percentage of Households Without a Vehicle in Missoula, MT are:
What zip code has the Highest Percentage of Households Without a Vehicle in Missoula, MT?
59812 has the Highest Percentage of Households Without a Vehicle in Missoula, MT with 100.0%.
What is the Percentage of Households Without a Vehicle in Missoula, MT?
Percentage of Households Without a Vehicle in Missoula is 7.8%.
What is the Percentage of Households Without a Vehicle in Montana?
Percentage of Households Without a Vehicle in Montana is 4.6%.
What is the Percentage of Households Without a Vehicle in the United States?
Percentage of Households Without a Vehicle in the United States is 8.3%.