Zip Codes with the Highest Percentage of Households Without a Vehicle in Montana
RELATED REPORTS & OPTIONS
Households without a Cars
Montana
Compare Zip Codes
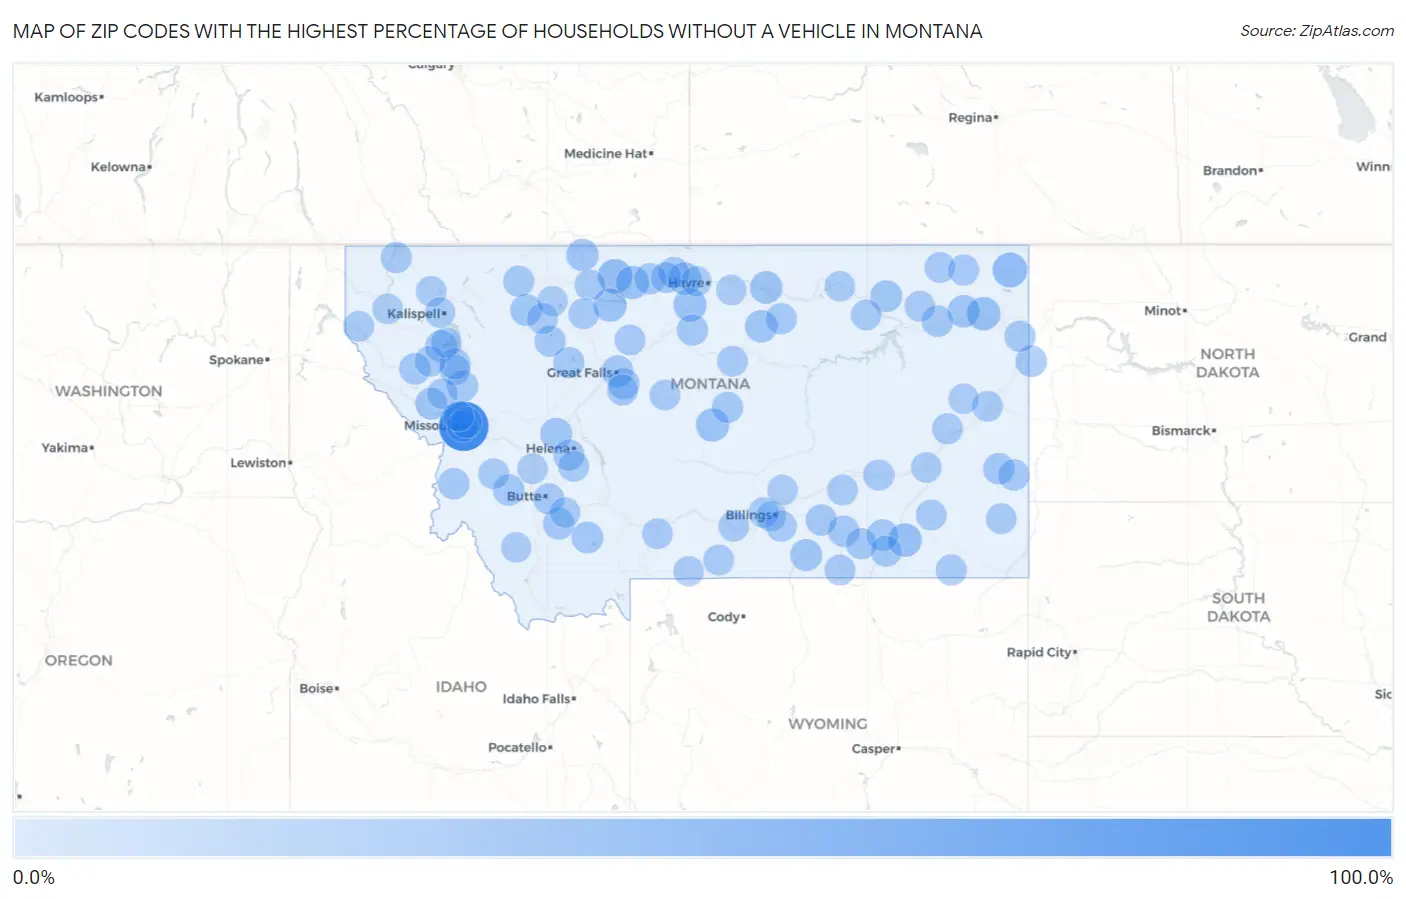
Map of Zip Codes with the Highest Percentage of Households Without a Vehicle in Montana
0.0%
100.0%
Zip Codes with the Highest Percentage of Households Without a Vehicle in Montana
| Zip Code | Housholds Without a Car | vs State | vs National | |
| 1. | 59812 | 100.0% | 4.6%(+95.4)#1 | 8.3%(+91.7)#11 |
| 2. | 59211 | 25.5% | 4.6%(+20.9)#2 | 8.3%(+17.2)#1,039 |
| 3. | 59444 | 23.9% | 4.6%(+19.3)#3 | 8.3%(+15.6)#1,148 |
| 4. | 59003 | 19.0% | 4.6%(+14.4)#4 | 8.3%(+10.7)#1,632 |
| 5. | 59213 | 18.9% | 4.6%(+14.3)#5 | 8.3%(+10.6)#1,655 |
| 6. | 59456 | 18.1% | 4.6%(+13.5)#6 | 8.3%(+9.80)#1,772 |
| 7. | 59522 | 17.7% | 4.6%(+13.1)#7 | 8.3%(+9.40)#1,841 |
| 8. | 59521 | 17.5% | 4.6%(+12.9)#8 | 8.3%(+9.20)#1,864 |
| 9. | 59464 | 17.3% | 4.6%(+12.7)#9 | 8.3%(+9.00)#1,904 |
| 10. | 59532 | 15.3% | 4.6%(+10.7)#10 | 8.3%(+7.00)#2,321 |
| 11. | 59526 | 14.9% | 4.6%(+10.3)#11 | 8.3%(+6.60)#2,425 |
| 12. | 59527 | 14.2% | 4.6%(+9.60)#12 | 8.3%(+5.90)#2,650 |
| 13. | 59255 | 14.0% | 4.6%(+9.40)#13 | 8.3%(+5.70)#2,710 |
| 14. | 59482 | 13.2% | 4.6%(+8.60)#14 | 8.3%(+4.90)#3,035 |
| 15. | 59846 | 11.7% | 4.6%(+7.10)#15 | 8.3%(+3.40)#3,736 |
| 16. | 59915 | 11.6% | 4.6%(+7.00)#16 | 8.3%(+3.30)#3,808 |
| 17. | 59035 | 11.6% | 4.6%(+7.00)#17 | 8.3%(+3.30)#3,814 |
| 18. | 59448 | 11.5% | 4.6%(+6.90)#18 | 8.3%(+3.20)#3,865 |
| 19. | 59231 | 11.5% | 4.6%(+6.90)#19 | 8.3%(+3.20)#3,870 |
| 20. | 59640 | 11.4% | 4.6%(+6.80)#20 | 8.3%(+3.10)#3,928 |
| 21. | 59740 | 10.7% | 4.6%(+6.10)#21 | 8.3%(+2.40)#4,364 |
| 22. | 59401 | 10.3% | 4.6%(+5.70)#22 | 8.3%(+2.00)#4,645 |
| 23. | 59751 | 10.0% | 4.6%(+5.40)#23 | 8.3%(+1.70)#4,916 |
| 24. | 59859 | 9.8% | 4.6%(+5.20)#24 | 8.3%(+1.50)#5,056 |
| 25. | 59022 | 9.7% | 4.6%(+5.10)#25 | 8.3%(+1.40)#5,143 |
| 26. | 59201 | 9.4% | 4.6%(+4.80)#26 | 8.3%(+1.10)#5,376 |
| 27. | 59270 | 9.2% | 4.6%(+4.60)#27 | 8.3%(+0.900)#5,550 |
| 28. | 59344 | 9.2% | 4.6%(+4.60)#28 | 8.3%(+0.900)#5,606 |
| 29. | 59711 | 9.0% | 4.6%(+4.40)#29 | 8.3%(+0.700)#5,764 |
| 30. | 59043 | 8.9% | 4.6%(+4.30)#30 | 8.3%(+0.600)#5,892 |
| 31. | 59840 | 8.6% | 4.6%(+4.00)#31 | 8.3%(+0.300)#6,209 |
| 32. | 59865 | 8.6% | 4.6%(+4.00)#32 | 8.3%(+0.300)#6,246 |
| 33. | 59313 | 8.6% | 4.6%(+4.00)#33 | 8.3%(+0.300)#6,260 |
| 34. | 59601 | 8.5% | 4.6%(+3.90)#34 | 8.3%(+0.200)#6,311 |
| 35. | 59801 | 8.5% | 4.6%(+3.90)#35 | 8.3%(+0.200)#6,312 |
| 36. | 59802 | 8.4% | 4.6%(+3.80)#36 | 8.3%(+0.100)#6,443 |
| 37. | 59457 | 8.2% | 4.6%(+3.60)#37 | 8.3%(-0.100)#6,686 |
| 38. | 59034 | 8.2% | 4.6%(+3.60)#38 | 8.3%(-0.100)#6,702 |
| 39. | 59520 | 8.2% | 4.6%(+3.60)#39 | 8.3%(-0.100)#6,743 |
| 40. | 59530 | 8.2% | 4.6%(+3.60)#40 | 8.3%(-0.100)#6,771 |
| 41. | 59472 | 8.0% | 4.6%(+3.40)#41 | 8.3%(-0.300)#7,047 |
| 42. | 59436 | 7.9% | 4.6%(+3.30)#42 | 8.3%(-0.400)#7,164 |
| 43. | 59524 | 7.9% | 4.6%(+3.30)#43 | 8.3%(-0.400)#7,183 |
| 44. | 59422 | 7.8% | 4.6%(+3.20)#44 | 8.3%(-0.500)#7,300 |
| 45. | 59016 | 7.8% | 4.6%(+3.20)#45 | 8.3%(-0.500)#7,323 |
| 46. | 59930 | 7.8% | 4.6%(+3.20)#46 | 8.3%(-0.500)#7,331 |
| 47. | 59417 | 7.7% | 4.6%(+3.10)#47 | 8.3%(-0.600)#7,429 |
| 48. | 59221 | 7.7% | 4.6%(+3.10)#48 | 8.3%(-0.600)#7,482 |
| 49. | 59012 | 7.7% | 4.6%(+3.10)#49 | 8.3%(-0.600)#7,525 |
| 50. | 59855 | 7.6% | 4.6%(+3.00)#50 | 8.3%(-0.700)#7,664 |
| 51. | 59525 | 7.2% | 4.6%(+2.60)#51 | 8.3%(-1.10)#8,347 |
| 52. | 59405 | 7.0% | 4.6%(+2.40)#52 | 8.3%(-1.30)#8,539 |
| 53. | 59701 | 7.0% | 4.6%(+2.40)#53 | 8.3%(-1.30)#8,540 |
| 54. | 59327 | 6.7% | 4.6%(+2.10)#54 | 8.3%(-1.60)#9,120 |
| 55. | 59349 | 6.7% | 4.6%(+2.10)#55 | 8.3%(-1.60)#9,140 |
| 56. | 59222 | 6.7% | 4.6%(+2.10)#56 | 8.3%(-1.60)#9,162 |
| 57. | 59314 | 6.7% | 4.6%(+2.10)#57 | 8.3%(-1.60)#9,168 |
| 58. | 59432 | 6.6% | 4.6%(+2.00)#58 | 8.3%(-1.70)#9,346 |
| 59. | 59528 | 6.5% | 4.6%(+1.90)#59 | 8.3%(-1.80)#9,541 |
| 60. | 59474 | 6.3% | 4.6%(+1.70)#60 | 8.3%(-2.00)#9,887 |
| 61. | 59263 | 6.3% | 4.6%(+1.70)#61 | 8.3%(-2.00)#9,938 |
| 62. | 59638 | 6.3% | 4.6%(+1.70)#62 | 8.3%(-2.00)#9,950 |
| 63. | 59864 | 6.2% | 4.6%(+1.60)#63 | 8.3%(-2.10)#10,068 |
| 64. | 59351 | 6.2% | 4.6%(+1.60)#64 | 8.3%(-2.10)#10,163 |
| 65. | 59845 | 6.1% | 4.6%(+1.50)#65 | 8.3%(-2.20)#10,363 |
| 66. | 59101 | 6.0% | 4.6%(+1.40)#66 | 8.3%(-2.30)#10,421 |
| 67. | 59425 | 6.0% | 4.6%(+1.40)#67 | 8.3%(-2.30)#10,542 |
| 68. | 59853 | 6.0% | 4.6%(+1.40)#68 | 8.3%(-2.30)#10,599 |
| 69. | 59038 | 6.0% | 4.6%(+1.40)#69 | 8.3%(-2.30)#10,612 |
| 70. | 59225 | 5.8% | 4.6%(+1.20)#70 | 8.3%(-2.50)#11,064 |
| 71. | 59324 | 5.7% | 4.6%(+1.10)#71 | 8.3%(-2.60)#11,313 |
| 72. | 59831 | 5.7% | 4.6%(+1.10)#72 | 8.3%(-2.60)#11,318 |
| 73. | 59068 | 5.6% | 4.6%(+1.000)#73 | 8.3%(-2.70)#11,475 |
| 74. | 59489 | 5.6% | 4.6%(+1.000)#74 | 8.3%(-2.70)#11,567 |
| 75. | 59230 | 5.5% | 4.6%(+0.900)#75 | 8.3%(-2.80)#11,717 |
| 76. | 59858 | 5.5% | 4.6%(+0.900)#76 | 8.3%(-2.80)#11,768 |
| 77. | 59330 | 5.4% | 4.6%(+0.800)#77 | 8.3%(-2.90)#11,923 |
| 78. | 59089 | 5.4% | 4.6%(+0.800)#78 | 8.3%(-2.90)#12,028 |
| 79. | 59447 | 5.4% | 4.6%(+0.800)#79 | 8.3%(-2.90)#12,038 |
| 80. | 59047 | 5.3% | 4.6%(+0.700)#80 | 8.3%(-3.00)#12,149 |
| 81. | 59019 | 5.3% | 4.6%(+0.700)#81 | 8.3%(-3.00)#12,206 |
| 82. | 59808 | 5.1% | 4.6%(+0.500)#82 | 8.3%(-3.20)#12,631 |
| 83. | 59937 | 5.1% | 4.6%(+0.500)#83 | 8.3%(-3.20)#12,658 |
| 84. | 59420 | 5.1% | 4.6%(+0.500)#84 | 8.3%(-3.20)#12,814 |
| 85. | 59106 | 4.9% | 4.6%(+0.300)#85 | 8.3%(-3.40)#13,137 |
| 86. | 59923 | 4.8% | 4.6%(+0.200)#86 | 8.3%(-3.50)#13,444 |
| 87. | 59339 | 4.7% | 4.6%(+0.100)#87 | 8.3%(-3.60)#13,878 |
| 88. | 59102 | 4.6% | 4.6%(=0.000)#88 | 8.3%(-3.70)#13,893 |
| 89. | 59914 | 4.6% | 4.6%(=0.000)#89 | 8.3%(-3.70)#14,154 |
| 90. | 59722 | 4.5% | 4.6%(-0.100)#90 | 8.3%(-3.80)#14,293 |
| 91. | 59759 | 4.5% | 4.6%(-0.100)#91 | 8.3%(-3.80)#14,323 |
| 92. | 59079 | 4.5% | 4.6%(-0.100)#92 | 8.3%(-3.80)#14,326 |
| 93. | 59261 | 4.5% | 4.6%(-0.100)#93 | 8.3%(-3.80)#14,425 |
| 94. | 59301 | 4.4% | 4.6%(-0.200)#94 | 8.3%(-3.90)#14,558 |
| 95. | 59523 | 4.4% | 4.6%(-0.200)#95 | 8.3%(-3.90)#14,656 |
| 96. | 59486 | 4.2% | 4.6%(-0.400)#96 | 8.3%(-4.10)#15,286 |
| 97. | 59020 | 4.2% | 4.6%(-0.400)#97 | 8.3%(-4.10)#15,337 |
| 98. | 59746 | 4.1% | 4.6%(-0.500)#98 | 8.3%(-4.20)#15,668 |
| 99. | 59901 | 4.0% | 4.6%(-0.600)#99 | 8.3%(-4.30)#15,674 |
| 100. | 59501 | 4.0% | 4.6%(-0.600)#100 | 8.3%(-4.30)#15,773 |
Common Questions
What are the Top 10 Zip Codes with the Highest Percentage of Households Without a Vehicle in Montana?
Top 10 Zip Codes with the Highest Percentage of Households Without a Vehicle in Montana are:
What zip code has the Highest Percentage of Households Without a Vehicle in Montana?
59812 has the Highest Percentage of Households Without a Vehicle in Montana with 100.0%.
What is the Percentage of Households Without a Vehicle in the State of Montana?
Percentage of Households Without a Vehicle in Montana is 4.6%.
What is the Percentage of Households Without a Vehicle in the United States?
Percentage of Households Without a Vehicle in the United States is 8.3%.