Zip Codes with the Highest Percentage of Households Without a Vehicle in Great Falls, MT
RELATED REPORTS & OPTIONS
Households without a Cars
Great Falls
Compare Zip Codes
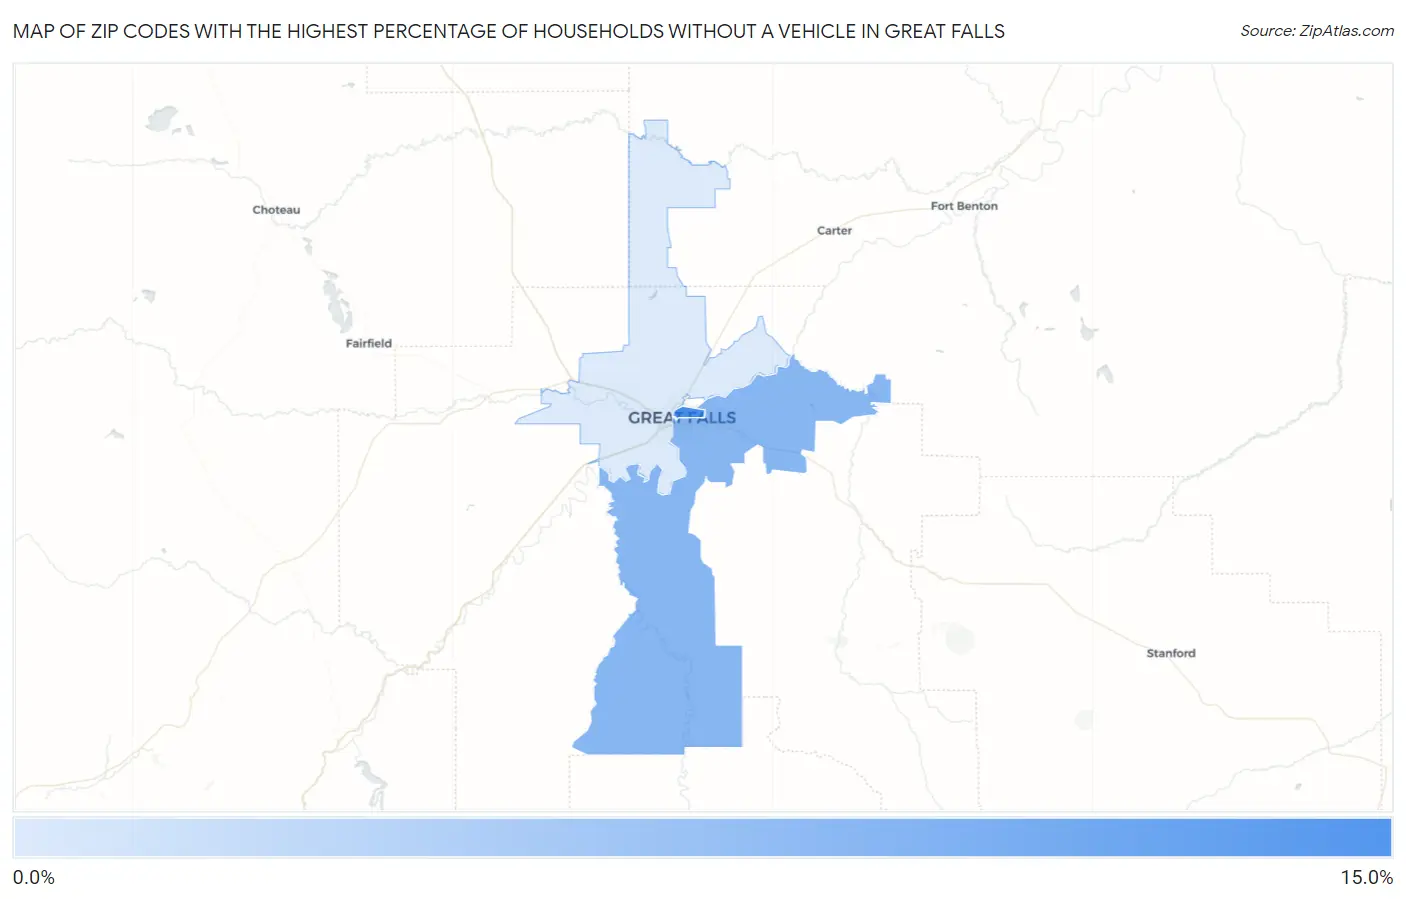
Map of Zip Codes with the Highest Percentage of Households Without a Vehicle in Great Falls
2.8%
10.3%
Zip Codes with the Highest Percentage of Households Without a Vehicle in Great Falls, MT
| Zip Code | Housholds Without a Car | vs State | vs National | |
| 1. | 59401 | 10.3% | 4.6%(+5.70)#22 | 8.3%(+2.00)#4,645 |
| 2. | 59405 | 7.0% | 4.6%(+2.40)#52 | 8.3%(-1.30)#8,539 |
| 3. | 59404 | 2.8% | 4.6%(-1.80)#130 | 8.3%(-5.50)#19,755 |
1
Common Questions
What are the Top Zip Codes with the Highest Percentage of Households Without a Vehicle in Great Falls, MT?
Top Zip Codes with the Highest Percentage of Households Without a Vehicle in Great Falls, MT are:
What zip code has the Highest Percentage of Households Without a Vehicle in Great Falls, MT?
59401 has the Highest Percentage of Households Without a Vehicle in Great Falls, MT with 10.3%.
What is the Percentage of Households Without a Vehicle in Great Falls, MT?
Percentage of Households Without a Vehicle in Great Falls is 6.6%.
What is the Percentage of Households Without a Vehicle in Montana?
Percentage of Households Without a Vehicle in Montana is 4.6%.
What is the Percentage of Households Without a Vehicle in the United States?
Percentage of Households Without a Vehicle in the United States is 8.3%.