Killona, LA Map & Demographics
Killona Map
Killona Overview
$33,454
PER CAPITA INCOME
0.39
INEQUALITY / GINI INDEX
262
TOTAL POPULATION
105
MALE POPULATION
157
FEMALE POPULATION
66.88
MALES / 100 FEMALES
149.52
FEMALES / 100 MALES
57.0
MEDIAN AGE
2.1
AVG FAMILY SIZE
1.8
AVG HOUSEHOLD SIZE
125
LABOR FORCE [ PEOPLE ]
50.0%
PERCENT IN LABOR FORCE
7.2%
UNEMPLOYMENT RATE
Killona Area Codes
Income in Killona
Income Overview in Killona
| Characteristic | Number | Measure |
| Per Capita Income | 262 | $33,454 |
| Median Family Income | 83 | $0 |
| Mean Family Income | 83 | $92,022 |
| Median Household Income | 145 | $0 |
| Mean Household Income | 145 | $64,884 |
| Income Deficit | 83 | $0 |
| Wage / Income Gap (%) | 262 | 0.00% |
| Wage / Income Gap ($) | 262 | 100.00¢ per $1 |
| Gini / Inequality Index | 262 | 0.39 |
Earnings by Sex in Killona
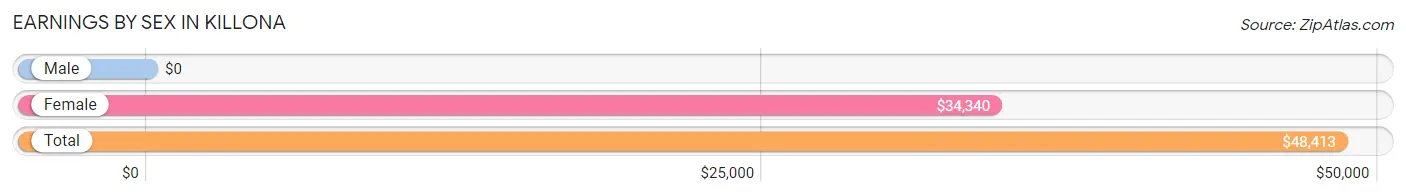
| Sex | Number | Average Earnings |
| Male | 70 (49.6%) | $0 |
| Female | 71 (50.3%) | $34,340 |
| Total | 141 (100.0%) | $48,413 |
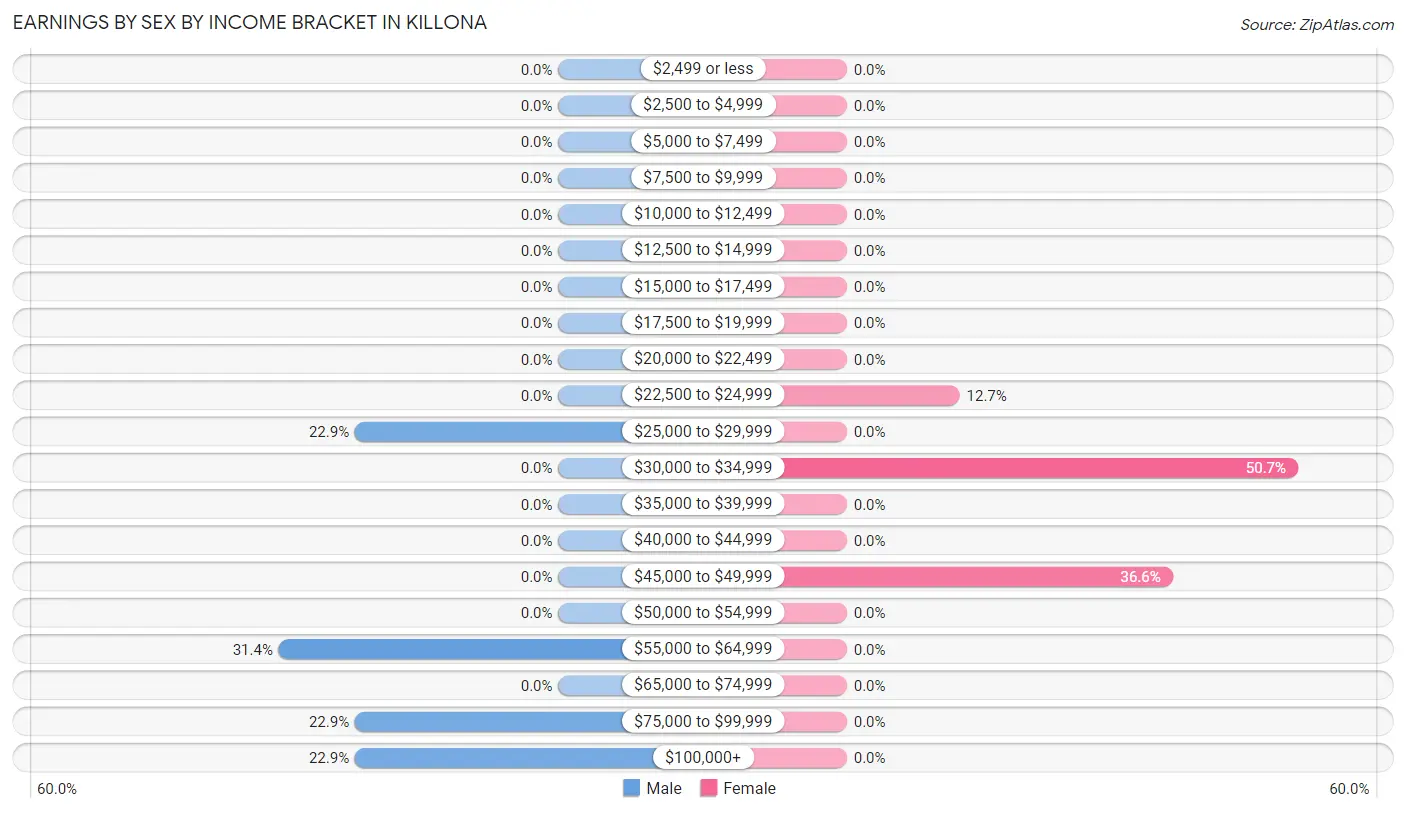
Earnings by Sex by Income Bracket in Killona
The most common earnings brackets in Killona are $55,000 to $64,999 for men (22 | 31.4%) and $30,000 to $34,999 for women (36 | 50.7%).
| Income | Male | Female |
| $2,499 or less | 0 (0.0%) | 0 (0.0%) |
| $2,500 to $4,999 | 0 (0.0%) | 0 (0.0%) |
| $5,000 to $7,499 | 0 (0.0%) | 0 (0.0%) |
| $7,500 to $9,999 | 0 (0.0%) | 0 (0.0%) |
| $10,000 to $12,499 | 0 (0.0%) | 0 (0.0%) |
| $12,500 to $14,999 | 0 (0.0%) | 0 (0.0%) |
| $15,000 to $17,499 | 0 (0.0%) | 0 (0.0%) |
| $17,500 to $19,999 | 0 (0.0%) | 0 (0.0%) |
| $20,000 to $22,499 | 0 (0.0%) | 0 (0.0%) |
| $22,500 to $24,999 | 0 (0.0%) | 9 (12.7%) |
| $25,000 to $29,999 | 16 (22.9%) | 0 (0.0%) |
| $30,000 to $34,999 | 0 (0.0%) | 36 (50.7%) |
| $35,000 to $39,999 | 0 (0.0%) | 0 (0.0%) |
| $40,000 to $44,999 | 0 (0.0%) | 0 (0.0%) |
| $45,000 to $49,999 | 0 (0.0%) | 26 (36.6%) |
| $50,000 to $54,999 | 0 (0.0%) | 0 (0.0%) |
| $55,000 to $64,999 | 22 (31.4%) | 0 (0.0%) |
| $65,000 to $74,999 | 0 (0.0%) | 0 (0.0%) |
| $75,000 to $99,999 | 16 (22.9%) | 0 (0.0%) |
| $100,000+ | 16 (22.9%) | 0 (0.0%) |
| Total | 70 (100.0%) | 71 (100.0%) |
Earnings by Sex by Educational Attainment in Killona
| Educational Attainment | Male Income | Female Income |
| Less than High School | - | - |
| High School Diploma | - | - |
| College or Associate's Degree | - | - |
| Bachelor's Degree | - | - |
| Graduate Degree | - | - |
| Total | - | - |
Family Income in Killona
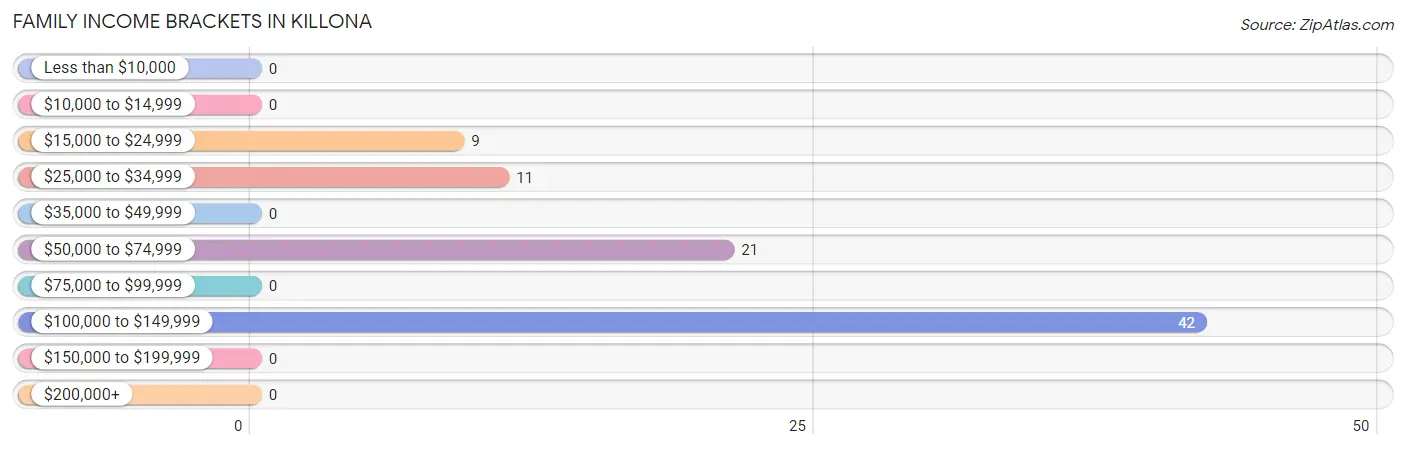
Family Income Brackets in Killona
According to the Killona family income data, there are 42 families falling into the $100,000 to $149,999 income range, which is the most common income bracket and makes up 50.6% of all families.
| Income Bracket | # Families | % Families |
| Less than $10,000 | 0 | 0.0% |
| $10,000 to $14,999 | 0 | 0.0% |
| $15,000 to $24,999 | 9 | 10.8% |
| $25,000 to $34,999 | 11 | 13.3% |
| $35,000 to $49,999 | 0 | 0.0% |
| $50,000 to $74,999 | 21 | 25.3% |
| $75,000 to $99,999 | 0 | 0.0% |
| $100,000 to $149,999 | 42 | 50.6% |
| $150,000 to $199,999 | 0 | 0.0% |
| $200,000+ | 0 | 0.0% |
Family Income by Famaliy Size in Killona
| Income Bracket | # Families | Median Income |
| 2-Person Families | 83 (100.0%) | $0 |
| 3-Person Families | 0 (0.0%) | $0 |
| 4-Person Families | 0 (0.0%) | $0 |
| 5-Person Families | 0 (0.0%) | $0 |
| 6-Person Families | 0 (0.0%) | $0 |
| 7+ Person Families | 0 (0.0%) | $0 |
| Total | 83 (100.0%) | $0 |
Family Income by Number of Earners in Killona
| Number of Earners | # Families | Median Income |
| No Earners | 0 (0.0%) | $0 |
| 1 Earner | 57 (68.7%) | $0 |
| 2 Earners | 26 (31.3%) | $0 |
| 3+ Earners | 0 (0.0%) | $0 |
| Total | 83 (100.0%) | $0 |
Household Income in Killona
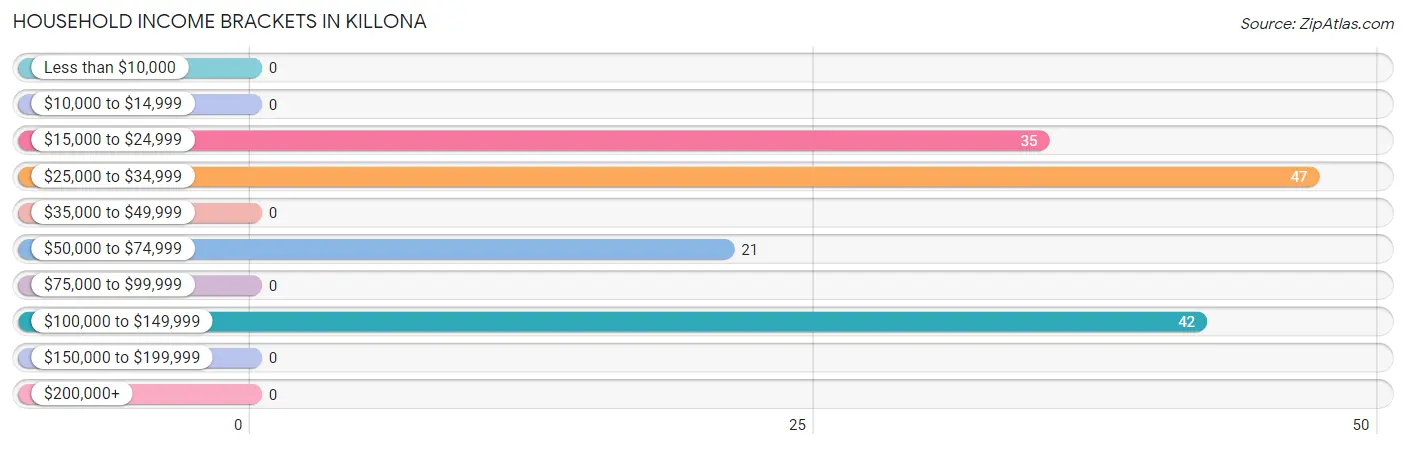
Household Income Brackets in Killona
With 47 households falling in the category, the $25,000 to $34,999 income range is the most frequent in Killona, accounting for 32.4% of all households.
| Income Bracket | # Households | % Households |
| Less than $10,000 | 0 | 0.0% |
| $10,000 to $14,999 | 0 | 0.0% |
| $15,000 to $24,999 | 35 | 24.1% |
| $25,000 to $34,999 | 47 | 32.4% |
| $35,000 to $49,999 | 0 | 0.0% |
| $50,000 to $74,999 | 21 | 14.5% |
| $75,000 to $99,999 | 0 | 0.0% |
| $100,000 to $149,999 | 42 | 29.0% |
| $150,000 to $199,999 | 0 | 0.0% |
| $200,000+ | 0 | 0.0% |
Household Income by Householder Age in Killona
| Income Bracket | # Households | Median Income |
| 15 to 24 Years | 0 (0.0%) | $0 |
| 25 to 44 Years | 30 (20.7%) | $0 |
| 45 to 64 Years | 62 (42.8%) | $0 |
| 65+ Years | 53 (36.5%) | $0 |
| Total | 145 (100.0%) | $0 |
Poverty in Killona
Income Below Poverty by Sex and Age in Killona
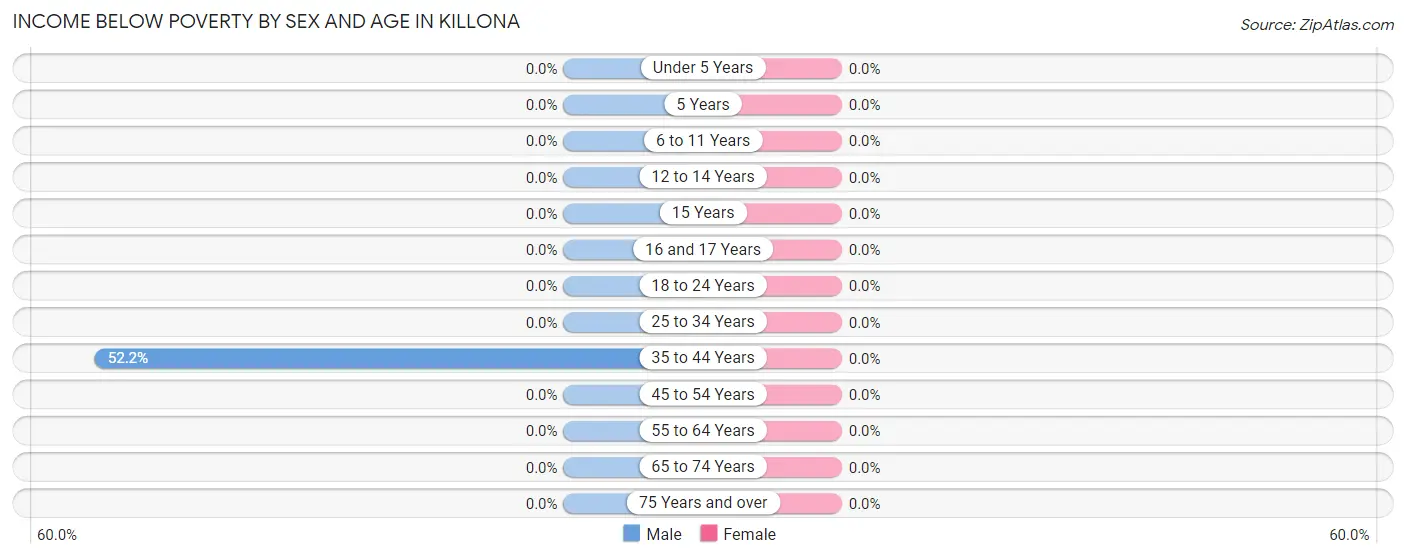
| Age Bracket | Male | Female |
| Under 5 Years | 0 (0.0%) | 0 (0.0%) |
| 5 Years | 0 (0.0%) | 0 (0.0%) |
| 6 to 11 Years | 0 (0.0%) | 0 (0.0%) |
| 12 to 14 Years | 0 (0.0%) | 0 (0.0%) |
| 15 Years | 0 (0.0%) | 0 (0.0%) |
| 16 and 17 Years | 0 (0.0%) | 0 (0.0%) |
| 18 to 24 Years | 0 (0.0%) | 0 (0.0%) |
| 25 to 34 Years | 0 (0.0%) | 0 (0.0%) |
| 35 to 44 Years | 24 (52.2%) | 0 (0.0%) |
| 45 to 54 Years | 0 (0.0%) | 0 (0.0%) |
| 55 to 64 Years | 0 (0.0%) | 0 (0.0%) |
| 65 to 74 Years | 0 (0.0%) | 0 (0.0%) |
| 75 Years and over | 0 (0.0%) | 0 (0.0%) |
| Total | 24 (22.9%) | 0 (0.0%) |
Income Above Poverty by Sex and Age in Killona
According to the poverty statistics in Killona, males aged 45 to 54 years and females aged 6 to 11 years are the age groups that are most secure financially, with 100.0% of males and 100.0% of females in these age groups living above the poverty line.
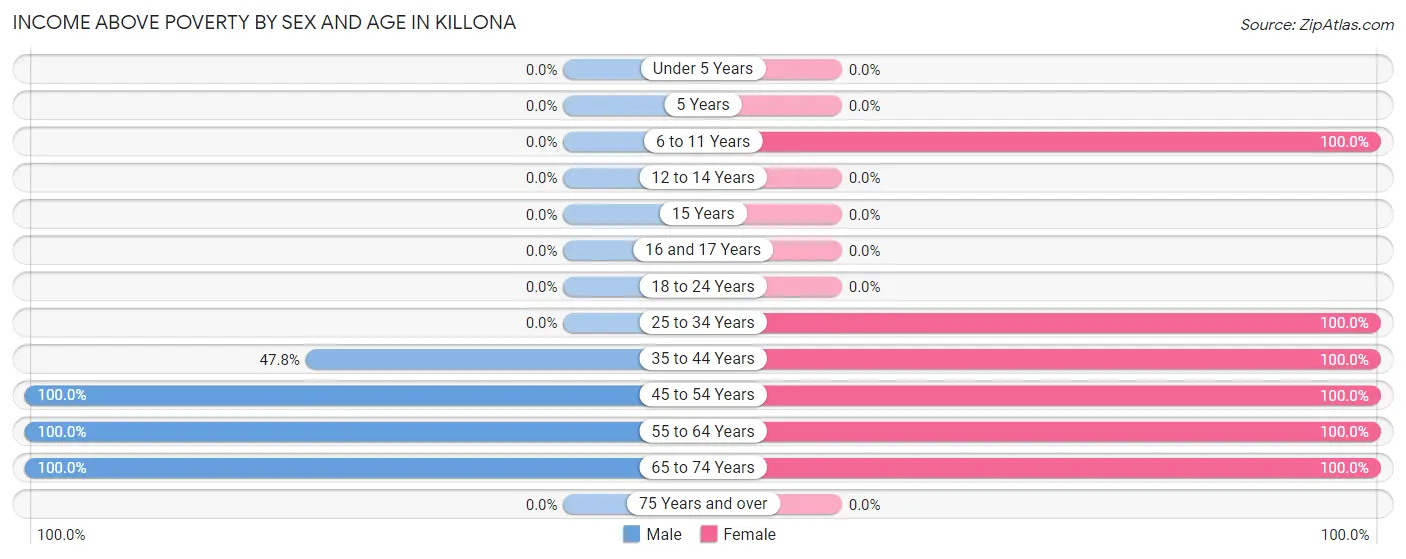
| Age Bracket | Male | Female |
| Under 5 Years | 0 (0.0%) | 0 (0.0%) |
| 5 Years | 0 (0.0%) | 0 (0.0%) |
| 6 to 11 Years | 0 (0.0%) | 12 (100.0%) |
| 12 to 14 Years | 0 (0.0%) | 0 (0.0%) |
| 15 Years | 0 (0.0%) | 0 (0.0%) |
| 16 and 17 Years | 0 (0.0%) | 0 (0.0%) |
| 18 to 24 Years | 0 (0.0%) | 0 (0.0%) |
| 25 to 34 Years | 0 (0.0%) | 9 (100.0%) |
| 35 to 44 Years | 22 (47.8%) | 21 (100.0%) |
| 45 to 54 Years | 16 (100.0%) | 26 (100.0%) |
| 55 to 64 Years | 16 (100.0%) | 63 (100.0%) |
| 65 to 74 Years | 27 (100.0%) | 26 (100.0%) |
| 75 Years and over | 0 (0.0%) | 0 (0.0%) |
| Total | 81 (77.1%) | 157 (100.0%) |
Income Below Poverty Among Married-Couple Families in Killona
| Children | Above Poverty | Below Poverty |
| No Children | 63 (100.0%) | 0 (0.0%) |
| 1 or 2 Children | 0 (0.0%) | 0 (0.0%) |
| 3 or 4 Children | 0 (0.0%) | 0 (0.0%) |
| 5 or more Children | 0 (0.0%) | 0 (0.0%) |
| Total | 63 (100.0%) | 0 (0.0%) |
Income Below Poverty Among Single-Parent Households in Killona
| Children | Single Father | Single Mother |
| No Children | 0 (0.0%) | 0 (0.0%) |
| 1 or 2 Children | 0 (0.0%) | 0 (0.0%) |
| 3 or 4 Children | 0 (0.0%) | 0 (0.0%) |
| 5 or more Children | 0 (0.0%) | 0 (0.0%) |
| Total | 0 (0.0%) | 0 (0.0%) |
Income Below Poverty Among Married-Couple vs Single-Parent Households in Killona
| Children | Married-Couple Families | Single-Parent Households |
| No Children | 0 (0.0%) | 0 (0.0%) |
| 1 or 2 Children | 0 (0.0%) | 0 (0.0%) |
| 3 or 4 Children | 0 (0.0%) | 0 (0.0%) |
| 5 or more Children | 0 (0.0%) | 0 (0.0%) |
| Total | 0 (0.0%) | 0 (0.0%) |
Race in Killona
The most populous races in Killona are Black / African American (211 | 80.5%), Hispanic or Latino (51 | 19.5%), and White / Caucasian (51 | 19.5%).
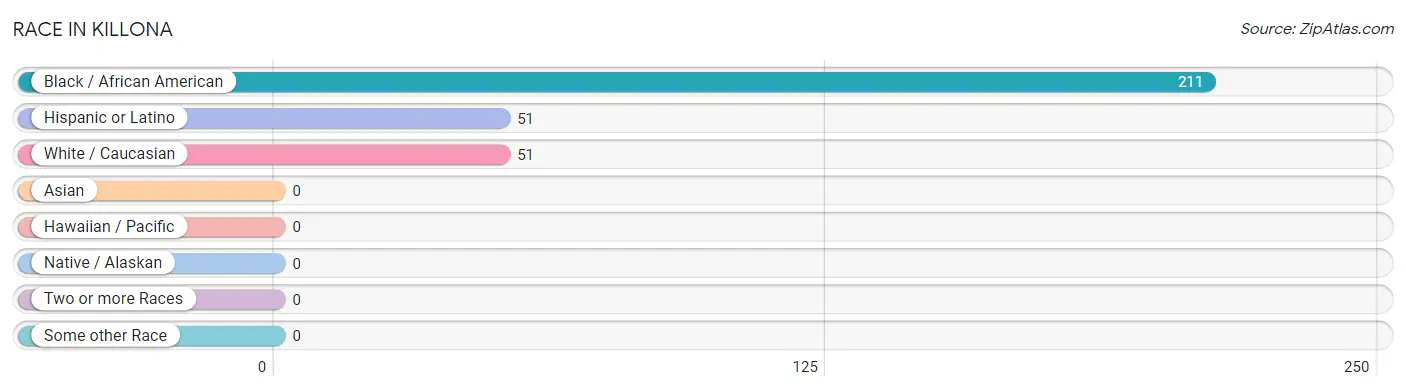
| Race | # Population | % Population |
| Asian | 0 | 0.0% |
| Black / African American | 211 | 80.5% |
| Hawaiian / Pacific | 0 | 0.0% |
| Hispanic or Latino | 51 | 19.5% |
| Native / Alaskan | 0 | 0.0% |
| White / Caucasian | 51 | 19.5% |
| Two or more Races | 0 | 0.0% |
| Some other Race | 0 | 0.0% |
| Total | 262 | 100.0% |
Ancestry in Killona
The most populous ancestries reported in Killona are Central American (51 | 19.5%), Nicaraguan (51 | 19.5%), and French (43 | 16.4%), together accounting for 55.3% of all Killona residents.
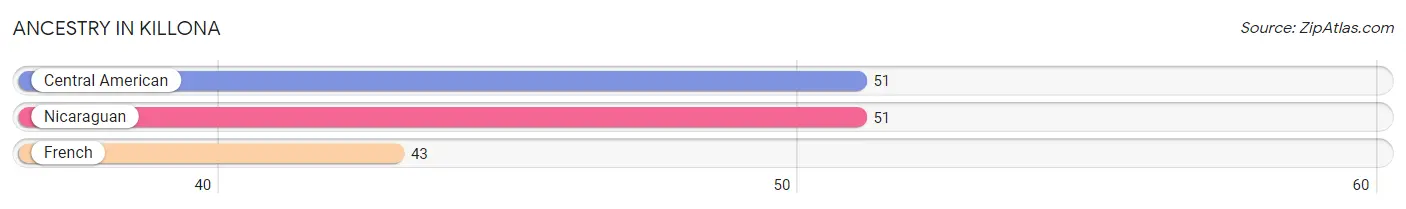
| Ancestry | # Population | % Population |
| Central American | 51 | 19.5% |
| French | 43 | 16.4% |
| Nicaraguan | 51 | 19.5% | View All 3 Rows |
Immigrants in Killona

| Immigration Origin | # Population | % Population | View All 0 Rows |
Sex and Age in Killona
Sex and Age in Killona
The most populous age groups in Killona are 65 to 69 Years (27 | 25.7%) for men and 55 to 59 Years (36 | 22.9%) for women.
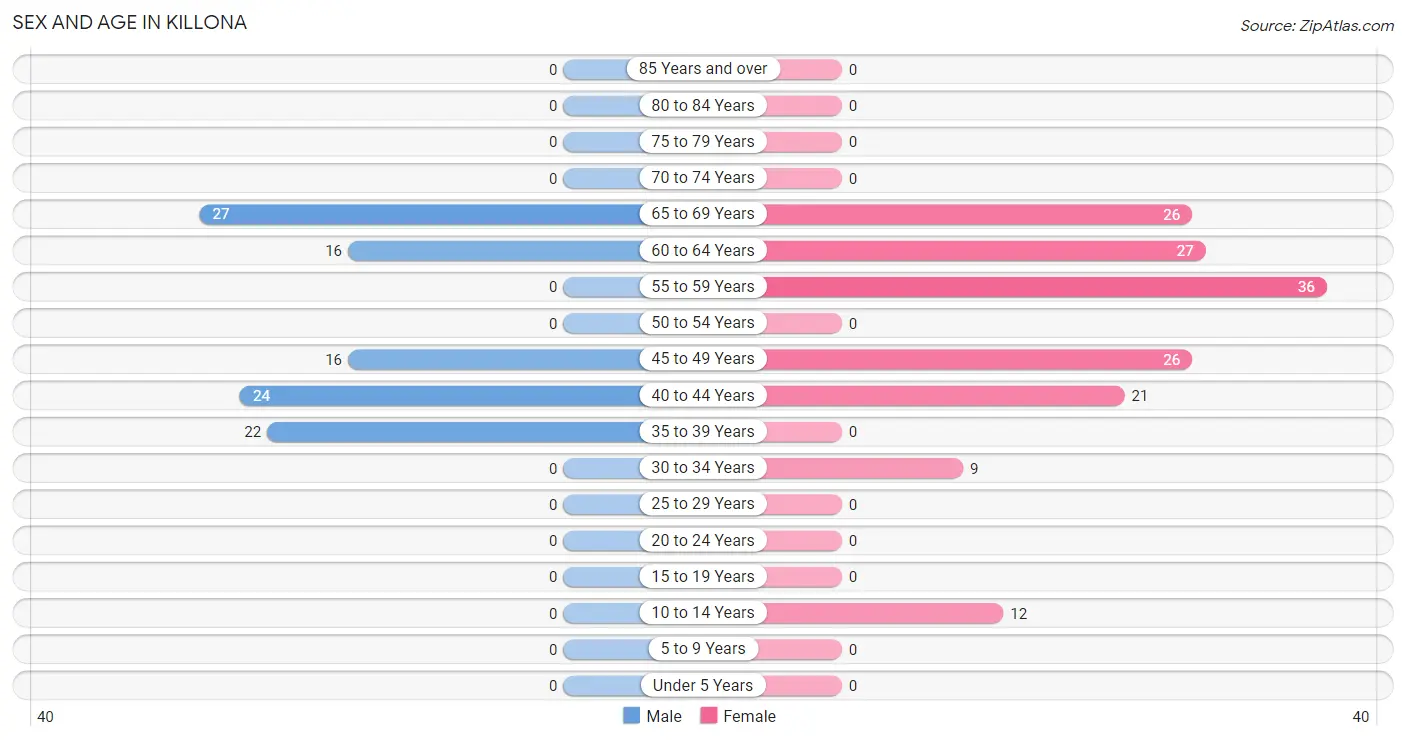
| Age Bracket | Male | Female |
| Under 5 Years | 0 (0.0%) | 0 (0.0%) |
| 5 to 9 Years | 0 (0.0%) | 0 (0.0%) |
| 10 to 14 Years | 0 (0.0%) | 12 (7.6%) |
| 15 to 19 Years | 0 (0.0%) | 0 (0.0%) |
| 20 to 24 Years | 0 (0.0%) | 0 (0.0%) |
| 25 to 29 Years | 0 (0.0%) | 0 (0.0%) |
| 30 to 34 Years | 0 (0.0%) | 9 (5.7%) |
| 35 to 39 Years | 22 (20.9%) | 0 (0.0%) |
| 40 to 44 Years | 24 (22.9%) | 21 (13.4%) |
| 45 to 49 Years | 16 (15.2%) | 26 (16.6%) |
| 50 to 54 Years | 0 (0.0%) | 0 (0.0%) |
| 55 to 59 Years | 0 (0.0%) | 36 (22.9%) |
| 60 to 64 Years | 16 (15.2%) | 27 (17.2%) |
| 65 to 69 Years | 27 (25.7%) | 26 (16.6%) |
| 70 to 74 Years | 0 (0.0%) | 0 (0.0%) |
| 75 to 79 Years | 0 (0.0%) | 0 (0.0%) |
| 80 to 84 Years | 0 (0.0%) | 0 (0.0%) |
| 85 Years and over | 0 (0.0%) | 0 (0.0%) |
| Total | 105 (100.0%) | 157 (100.0%) |
Families and Households in Killona
Median Family Size in Killona
The median family size in Killona is 2.12 persons per family, with single male/father families (11 | 13.3%) accounting for the largest median family size of 2.45 persons per family. On the other hand, married-couple families (63 | 75.9%) represent the smallest median family size with 2.03 persons per family.
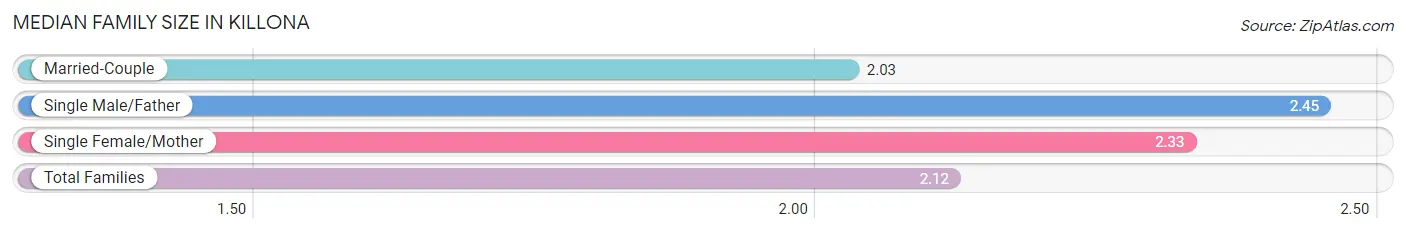
| Family Type | # Families | Family Size |
| Married-Couple | 63 (75.9%) | 2.03 |
| Single Male/Father | 11 (13.3%) | 2.45 |
| Single Female/Mother | 9 (10.8%) | 2.33 |
| Total Families | 83 (100.0%) | 2.12 |
Median Household Size in Killona
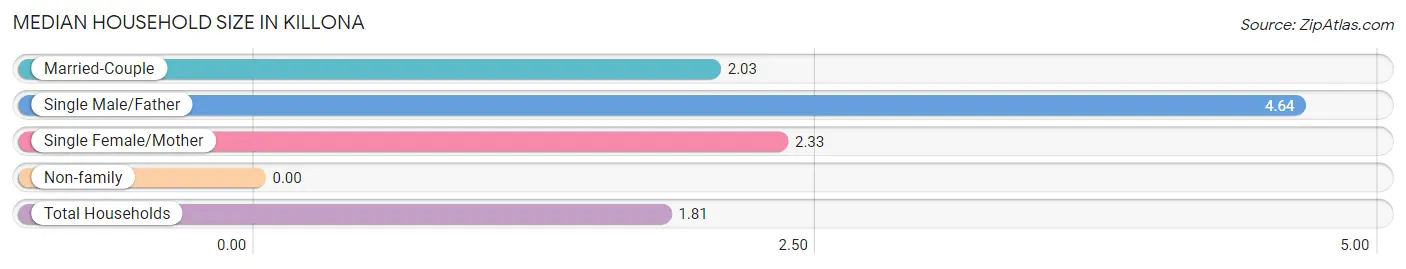
| Household Type | # Households | Household Size |
| Married-Couple | 63 (43.4%) | 2.03 |
| Single Male/Father | 11 (7.6%) | 4.64 |
| Single Female/Mother | 9 (6.2%) | 2.33 |
| Non-family | 62 (42.8%) | - |
| Total Households | 145 (100.0%) | 1.81 |
Household Size by Marriage Status in Killona
Out of a total of 145 households in Killona, 83 (57.2%) are family households, while 62 (42.8%) are nonfamily households. The most numerous type of family households are 2-person households, comprising 72, and the most common type of nonfamily households are 1-person households, comprising 62.
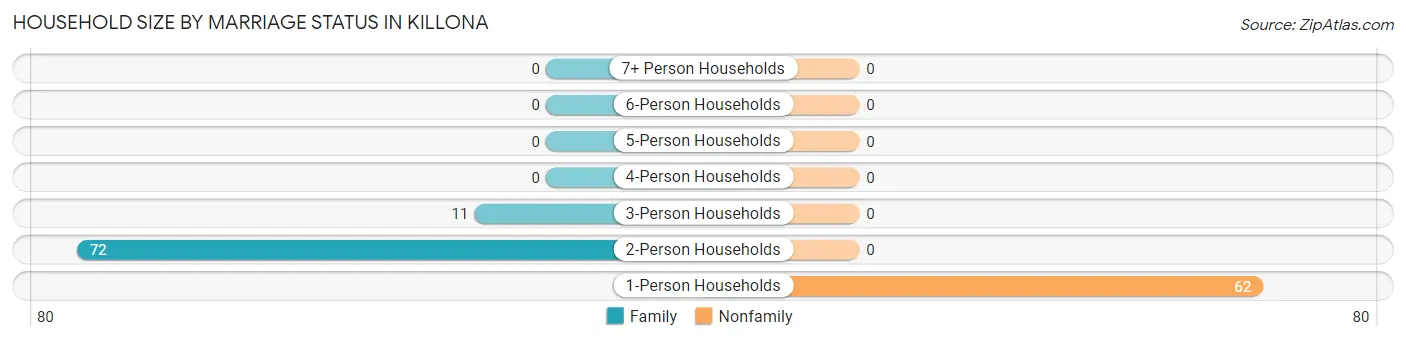
| Household Size | Family Households | Nonfamily Households |
| 1-Person Households | - | 62 (42.8%) |
| 2-Person Households | 72 (49.7%) | 0 (0.0%) |
| 3-Person Households | 11 (7.6%) | 0 (0.0%) |
| 4-Person Households | 0 (0.0%) | 0 (0.0%) |
| 5-Person Households | 0 (0.0%) | 0 (0.0%) |
| 6-Person Households | 0 (0.0%) | 0 (0.0%) |
| 7+ Person Households | 0 (0.0%) | 0 (0.0%) |
| Total | 83 (57.2%) | 62 (42.8%) |
Female Fertility in Killona
Fertility by Age in Killona
| Age Bracket | Women with Births | Births / 1,000 Women |
| 15 to 19 years | 0 (0.0%) | 0.0 |
| 20 to 34 years | 0 (0.0%) | 0.0 |
| 35 to 50 years | 0 (0.0%) | 0.0 |
| Total | 0 (0.0%) | 0.0 |
Fertility by Age by Marriage Status in Killona
| Age Bracket | Married | Unmarried |
| 15 to 19 years | 0 (0.0%) | 0 (0.0%) |
| 20 to 34 years | 0 (0.0%) | 0 (0.0%) |
| 35 to 50 years | 0 (0.0%) | 0 (0.0%) |
| Total | 0 (0.0%) | 0 (0.0%) |
Fertility by Education in Killona
| Educational Attainment | Women with Births | Births / 1,000 Women |
| Less than High School | 0 (0.0%) | 0.0 |
| High School Diploma | 0 (0.0%) | 0.0 |
| College or Associate's Degree | 0 (0.0%) | 0.0 |
| Bachelor's Degree | 0 (0.0%) | 0.0 |
| Graduate Degree | 0 (0.0%) | 0.0 |
| Total | 0 (0.0%) | 0.0 |
Fertility by Education by Marriage Status in Killona
| Educational Attainment | Married | Unmarried |
| Less than High School | 0 (0.0%) | 0 (0.0%) |
| High School Diploma | 0 (0.0%) | 0 (0.0%) |
| College or Associate's Degree | 0 (0.0%) | 0 (0.0%) |
| Bachelor's Degree | 0 (0.0%) | 0 (0.0%) |
| Graduate Degree | 0 (0.0%) | 0 (0.0%) |
| Total | 0 (0.0%) | 0 (0.0%) |
Employment Characteristics in Killona
Employment by Class of Employer in Killona
Among the 116 employed individuals in Killona, private company employees (80 | 69.0%), and self-employed (not incorporated) (36 | 31.0%) make up the most common classes of employment.
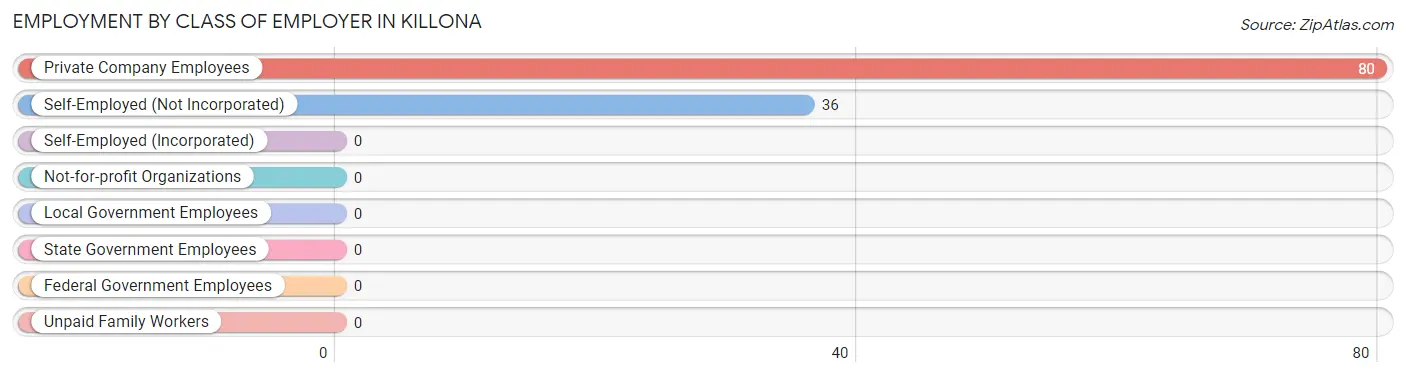
| Employer Class | # Employees | % Employees |
| Private Company Employees | 80 | 69.0% |
| Self-Employed (Incorporated) | 0 | 0.0% |
| Self-Employed (Not Incorporated) | 36 | 31.0% |
| Not-for-profit Organizations | 0 | 0.0% |
| Local Government Employees | 0 | 0.0% |
| State Government Employees | 0 | 0.0% |
| Federal Government Employees | 0 | 0.0% |
| Unpaid Family Workers | 0 | 0.0% |
| Total | 116 | 100.0% |
Employment Status by Age in Killona
According to the labor force statistics for Killona, out of the total population over 16 years of age (250), 50.0% or 125 individuals are in the labor force, with 7.2% or 9 of them unemployed. The age group with the highest labor force participation rate is 30 to 34 years, with 100.0% or 9 individuals in the labor force. Within the labor force, the 30 to 34 years age range has the highest percentage of unemployed individuals, with 100.0% or 9 of them being unemployed.
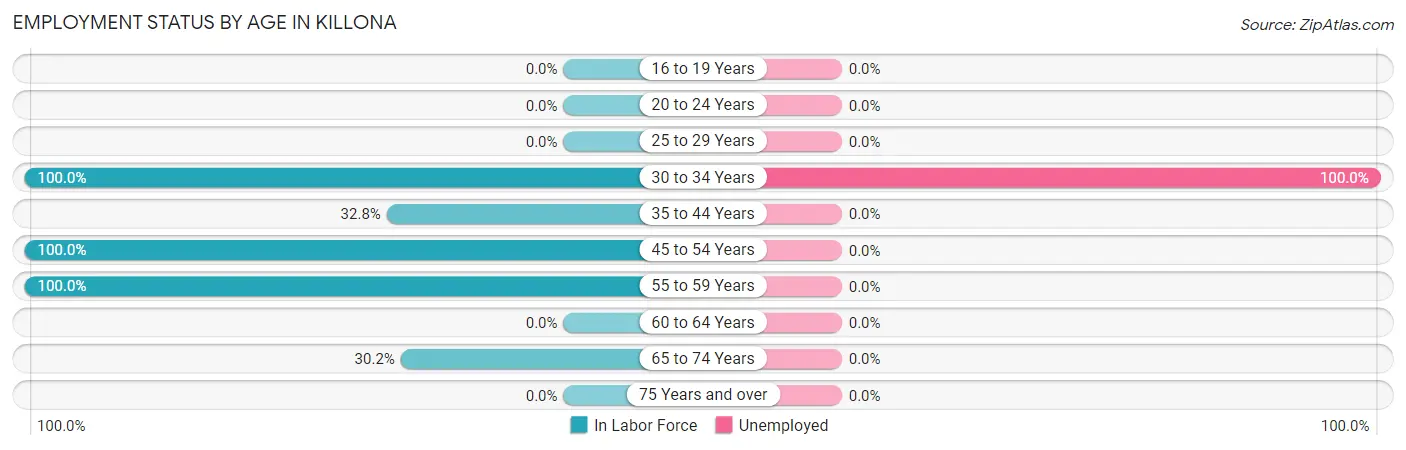
| Age Bracket | In Labor Force | Unemployed |
| 16 to 19 Years | 0 (0.0%) | 0 (0.0%) |
| 20 to 24 Years | 0 (0.0%) | 0 (0.0%) |
| 25 to 29 Years | 0 (0.0%) | 0 (0.0%) |
| 30 to 34 Years | 9 (100.0%) | 9 (100.0%) |
| 35 to 44 Years | 22 (32.8%) | 0 (0.0%) |
| 45 to 54 Years | 42 (100.0%) | 0 (0.0%) |
| 55 to 59 Years | 36 (100.0%) | 0 (0.0%) |
| 60 to 64 Years | 0 (0.0%) | 0 (0.0%) |
| 65 to 74 Years | 16 (30.2%) | 0 (0.0%) |
| 75 Years and over | 0 (0.0%) | 0 (0.0%) |
| Total | 125 (50.0%) | 9 (7.2%) |
Employment Status by Educational Attainment in Killona
According to labor force statistics for Killona, 55.3% of individuals (109) out of the total population between 25 and 64 years of age (197) are in the labor force, with 8.3% or 9 of them being unemployed. The group with the highest labor force participation rate are those with the educational attainment of bachelor's degree or higher, with 100.0% or 26 individuals in the labor force. Within the labor force, individuals with high school diploma education have the highest percentage of unemployment, with 36.0% or 9 of them being unemployed.
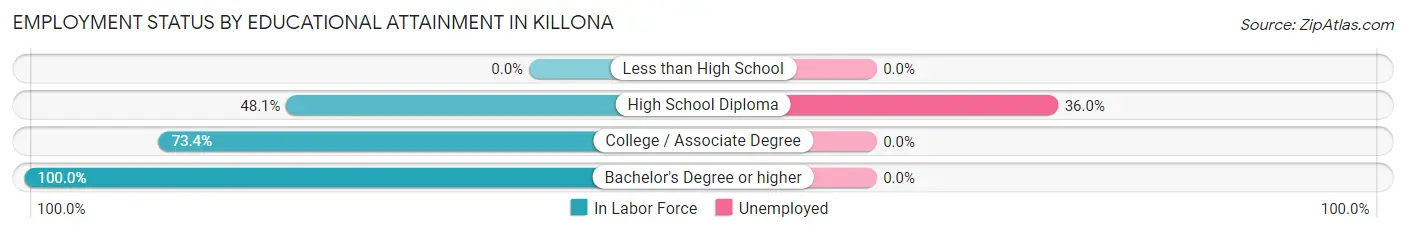
| Educational Attainment | In Labor Force | Unemployed |
| Less than High School | 0 (0.0%) | 0 (0.0%) |
| High School Diploma | 25 (48.1%) | 19 (36.0%) |
| College / Associate Degree | 58 (73.4%) | 0 (0.0%) |
| Bachelor's Degree or higher | 26 (100.0%) | 0 (0.0%) |
| Total | 109 (55.3%) | 16 (8.3%) |
Employment Occupations by Sex in Killona
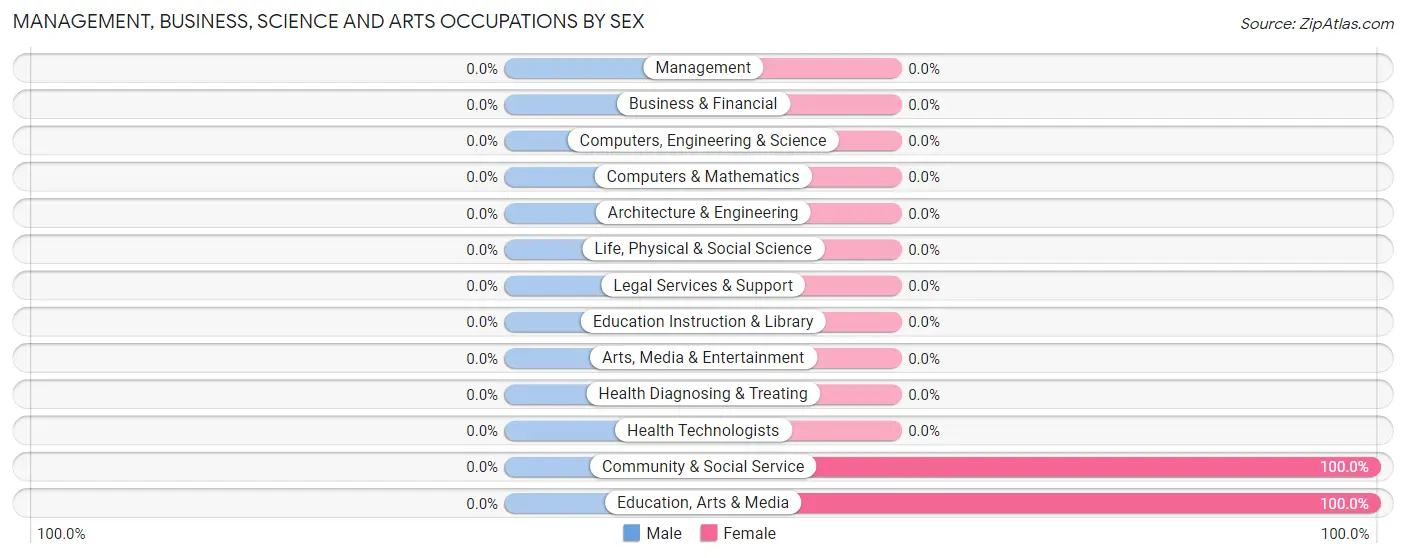
Management, Business, Science and Arts Occupations
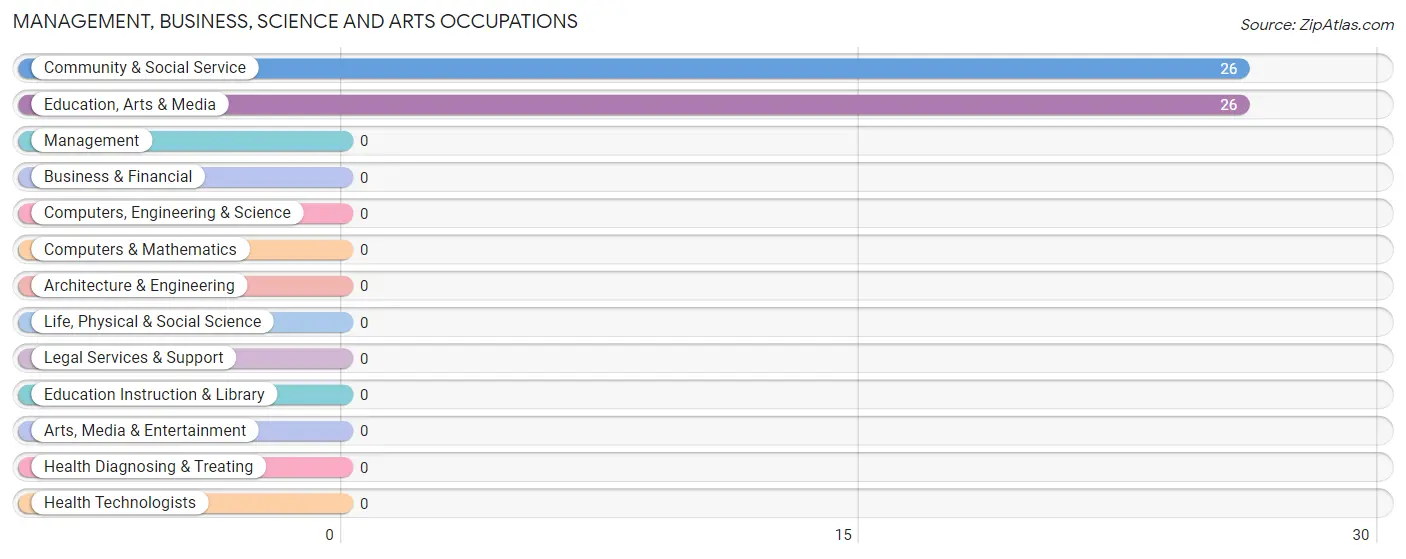
The most common Management, Business, Science and Arts occupations in Killona are Community & Social Service (26 | 22.4%), and Education, Arts & Media (26 | 22.4%).
Management, Business, Science and Arts Occupations by Sex
| Occupation | Male | Female |
| Management | 0 (0.0%) | 0 (0.0%) |
| Business & Financial | 0 (0.0%) | 0 (0.0%) |
| Computers, Engineering & Science | 0 (0.0%) | 0 (0.0%) |
| Computers & Mathematics | 0 (0.0%) | 0 (0.0%) |
| Architecture & Engineering | 0 (0.0%) | 0 (0.0%) |
| Life, Physical & Social Science | 0 (0.0%) | 0 (0.0%) |
| Community & Social Service | 0 (0.0%) | 26 (100.0%) |
| Education, Arts & Media | 0 (0.0%) | 26 (100.0%) |
| Legal Services & Support | 0 (0.0%) | 0 (0.0%) |
| Education Instruction & Library | 0 (0.0%) | 0 (0.0%) |
| Arts, Media & Entertainment | 0 (0.0%) | 0 (0.0%) |
| Health Diagnosing & Treating | 0 (0.0%) | 0 (0.0%) |
| Health Technologists | 0 (0.0%) | 0 (0.0%) |
| Total (Category) | 0 (0.0%) | 26 (100.0%) |
| Total (Overall) | 54 (46.6%) | 62 (53.4%) |
Services Occupations
Services Occupations by Sex
| Occupation | Male | Female |
| Healthcare Support | 0 (0.0%) | 0 (0.0%) |
| Security & Protection | 0 (0.0%) | 0 (0.0%) |
| Firefighting & Prevention | 0 (0.0%) | 0 (0.0%) |
| Law Enforcement | 0 (0.0%) | 0 (0.0%) |
| Food Preparation & Serving | 0 (0.0%) | 0 (0.0%) |
| Cleaning & Maintenance | 0 (0.0%) | 0 (0.0%) |
| Personal Care & Service | 0 (0.0%) | 0 (0.0%) |
| Total (Category) | 0 (0.0%) | 0 (0.0%) |
| Total (Overall) | 54 (46.6%) | 62 (53.4%) |
Sales and Office Occupations
Sales and Office Occupations by Sex
| Occupation | Male | Female |
| Sales & Related | 0 (0.0%) | 0 (0.0%) |
| Office & Administration | 0 (0.0%) | 0 (0.0%) |
| Total (Category) | 0 (0.0%) | 0 (0.0%) |
| Total (Overall) | 54 (46.6%) | 62 (53.4%) |
Natural Resources, Construction and Maintenance Occupations
The most common Natural Resources, Construction and Maintenance occupations in Killona are , and Construction & Extraction (58 | 50.0%).
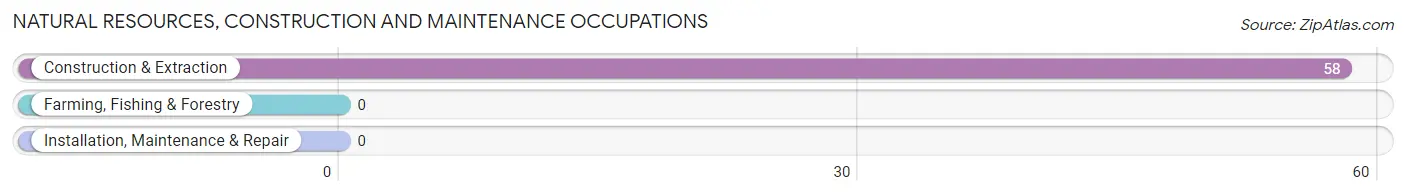
Natural Resources, Construction and Maintenance Occupations by Sex
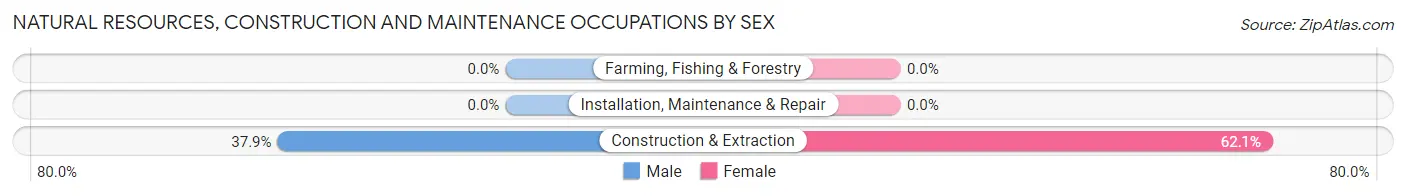
| Occupation | Male | Female |
| Farming, Fishing & Forestry | 0 (0.0%) | 0 (0.0%) |
| Construction & Extraction | 22 (37.9%) | 36 (62.1%) |
| Installation, Maintenance & Repair | 0 (0.0%) | 0 (0.0%) |
| Total (Category) | 22 (37.9%) | 36 (62.1%) |
| Total (Overall) | 54 (46.6%) | 62 (53.4%) |
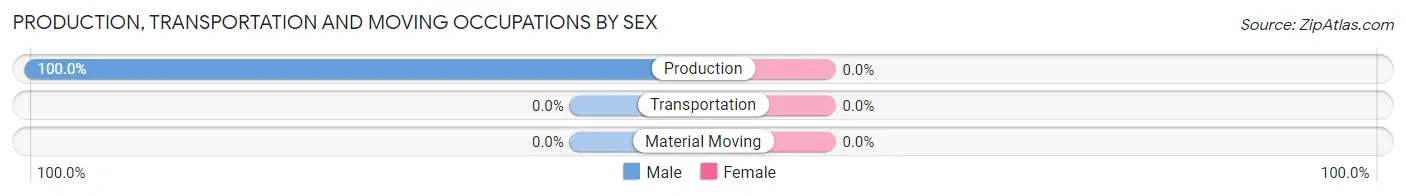
Production, Transportation and Moving Occupations
The most common Production, Transportation and Moving occupations in Killona are , and Production (32 | 27.6%).
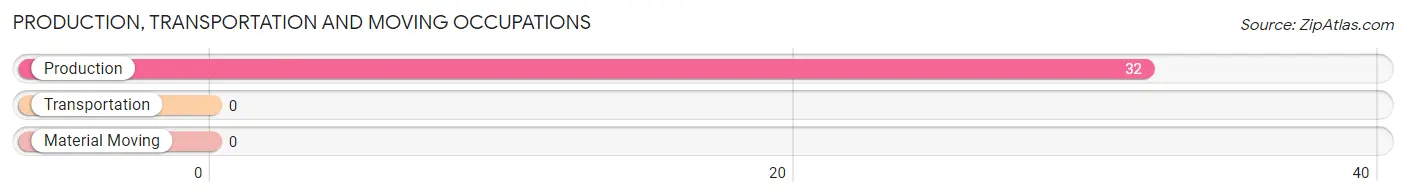
Production, Transportation and Moving Occupations by Sex
| Occupation | Male | Female |
| Production | 32 (100.0%) | 0 (0.0%) |
| Transportation | 0 (0.0%) | 0 (0.0%) |
| Material Moving | 0 (0.0%) | 0 (0.0%) |
| Total (Category) | 32 (100.0%) | 0 (0.0%) |
| Total (Overall) | 54 (46.6%) | 62 (53.4%) |
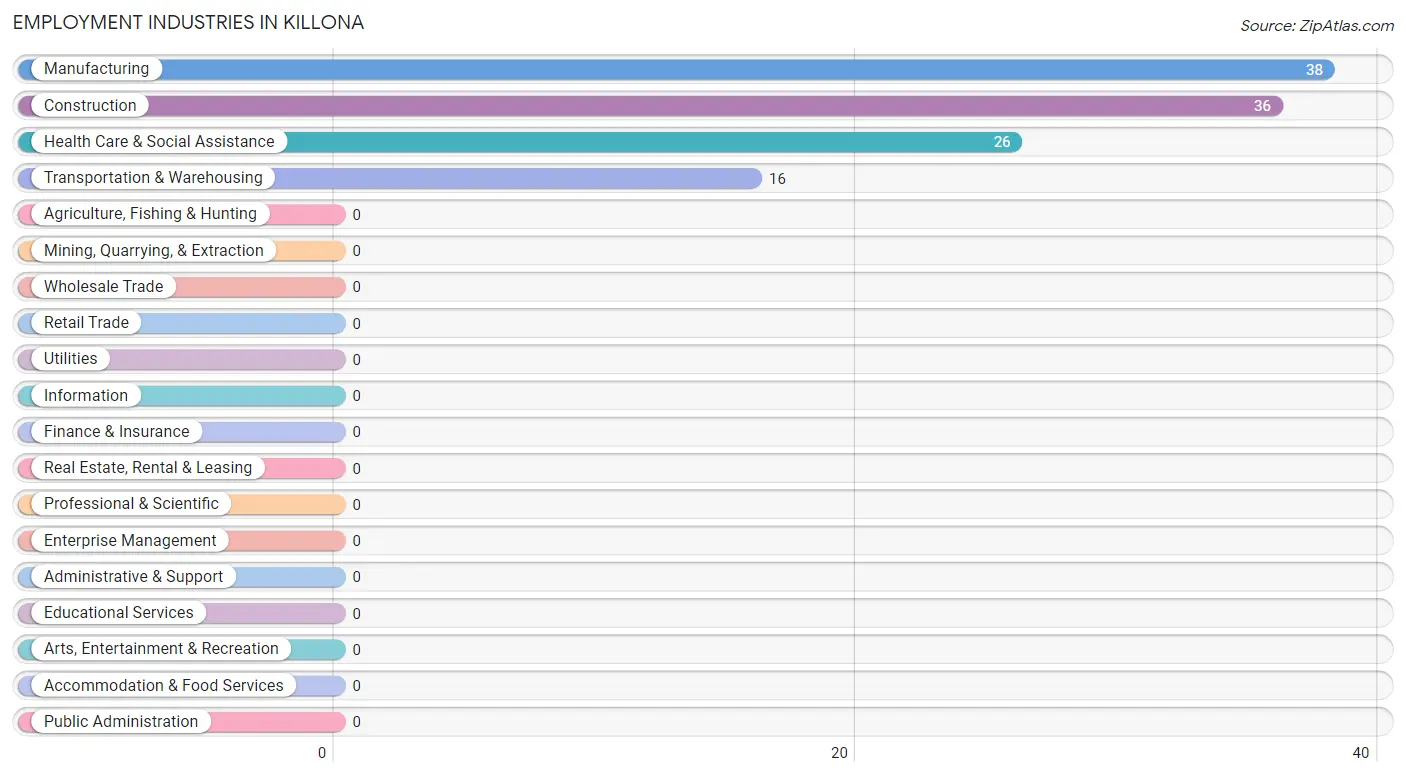
Employment Industries by Sex in Killona
Employment Industries in Killona
The major employment industries in Killona include Manufacturing (38 | 32.8%), Construction (36 | 31.0%), Health Care & Social Assistance (26 | 22.4%), and Transportation & Warehousing (16 | 13.8%).
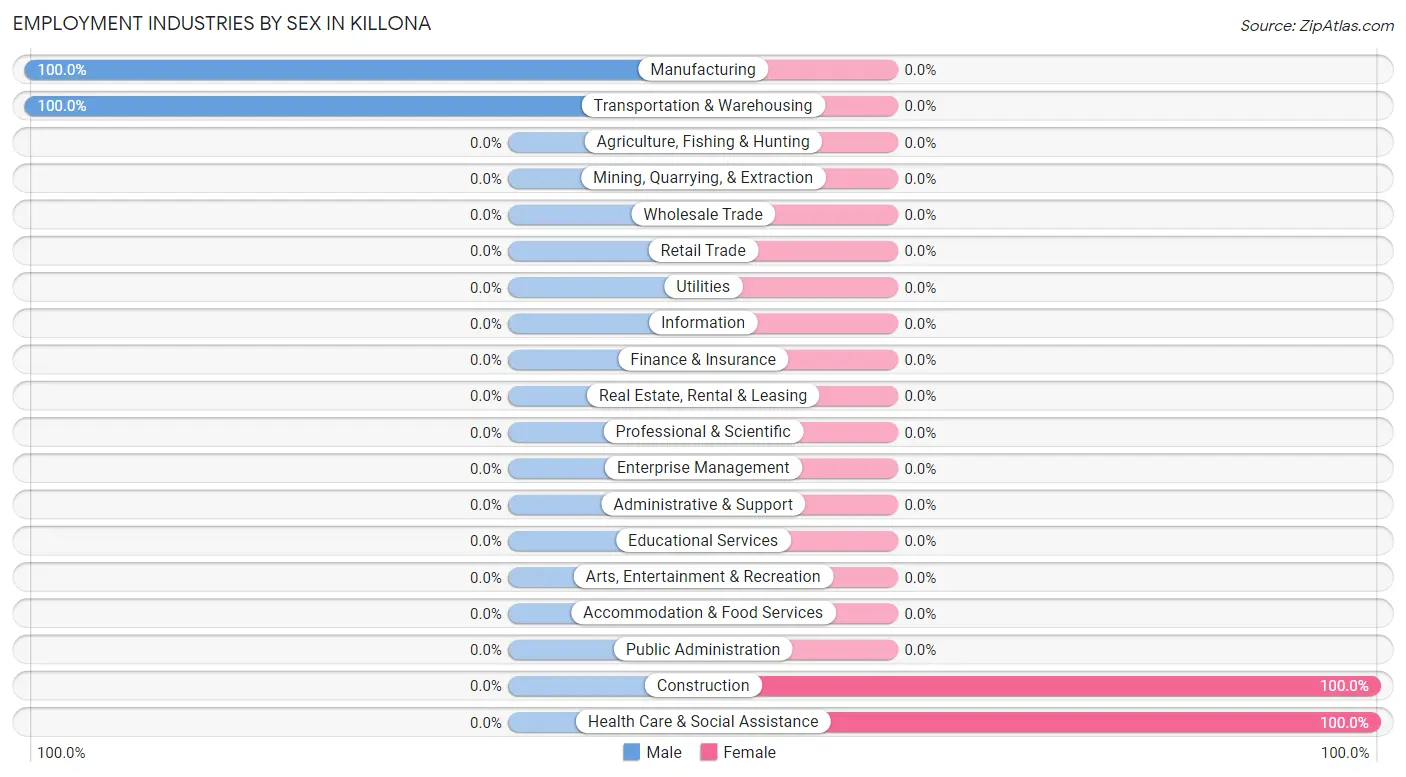
Employment Industries by Sex in Killona
The Killona industries that see more men than women are Manufacturing (100.0%), and Transportation & Warehousing (100.0%), whereas the industries that tend to have a higher number of women are Construction (100.0%), and Health Care & Social Assistance (100.0%).
| Industry | Male | Female |
| Agriculture, Fishing & Hunting | 0 (0.0%) | 0 (0.0%) |
| Mining, Quarrying, & Extraction | 0 (0.0%) | 0 (0.0%) |
| Construction | 0 (0.0%) | 36 (100.0%) |
| Manufacturing | 38 (100.0%) | 0 (0.0%) |
| Wholesale Trade | 0 (0.0%) | 0 (0.0%) |
| Retail Trade | 0 (0.0%) | 0 (0.0%) |
| Transportation & Warehousing | 16 (100.0%) | 0 (0.0%) |
| Utilities | 0 (0.0%) | 0 (0.0%) |
| Information | 0 (0.0%) | 0 (0.0%) |
| Finance & Insurance | 0 (0.0%) | 0 (0.0%) |
| Real Estate, Rental & Leasing | 0 (0.0%) | 0 (0.0%) |
| Professional & Scientific | 0 (0.0%) | 0 (0.0%) |
| Enterprise Management | 0 (0.0%) | 0 (0.0%) |
| Administrative & Support | 0 (0.0%) | 0 (0.0%) |
| Educational Services | 0 (0.0%) | 0 (0.0%) |
| Health Care & Social Assistance | 0 (0.0%) | 26 (100.0%) |
| Arts, Entertainment & Recreation | 0 (0.0%) | 0 (0.0%) |
| Accommodation & Food Services | 0 (0.0%) | 0 (0.0%) |
| Public Administration | 0 (0.0%) | 0 (0.0%) |
| Total | 54 (46.6%) | 62 (53.4%) |
Education in Killona
School Enrollment in Killona
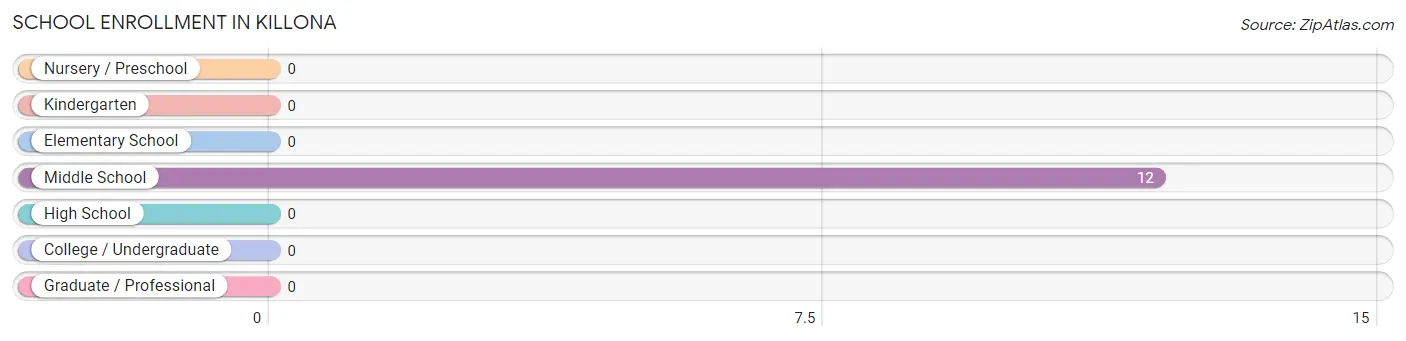
| School Level | # Students | % Students |
| Nursery / Preschool | 0 | 0.0% |
| Kindergarten | 0 | 0.0% |
| Elementary School | 0 | 0.0% |
| Middle School | 12 | 100.0% |
| High School | 0 | 0.0% |
| College / Undergraduate | 0 | 0.0% |
| Graduate / Professional | 0 | 0.0% |
| Total | 12 | 100.0% |
School Enrollment by Age by Funding Source in Killona
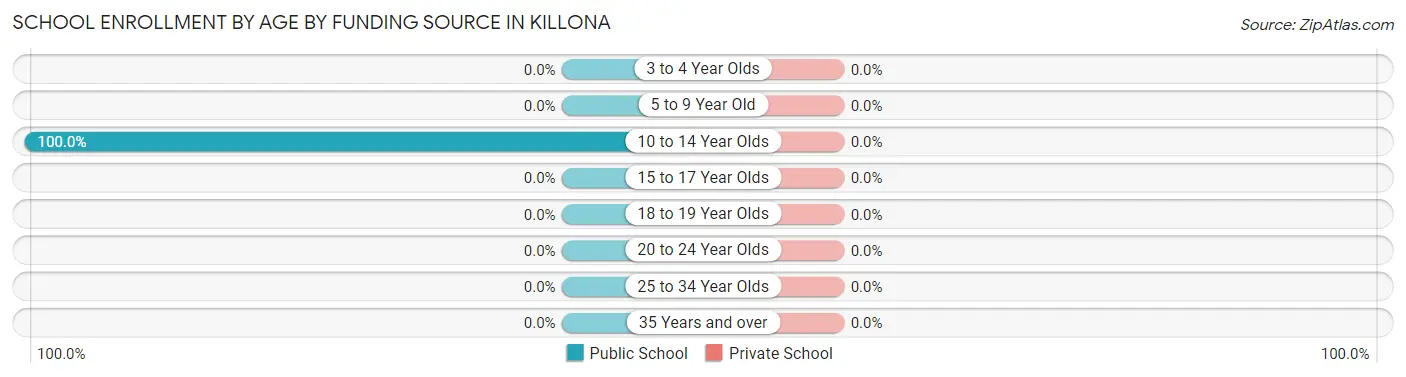
| Age Bracket | Public School | Private School |
| 3 to 4 Year Olds | 0 (0.0%) | 0 (0.0%) |
| 5 to 9 Year Old | 0 (0.0%) | 0 (0.0%) |
| 10 to 14 Year Olds | 12 (100.0%) | 0 (0.0%) |
| 15 to 17 Year Olds | 0 (0.0%) | 0 (0.0%) |
| 18 to 19 Year Olds | 0 (0.0%) | 0 (0.0%) |
| 20 to 24 Year Olds | 0 (0.0%) | 0 (0.0%) |
| 25 to 34 Year Olds | 0 (0.0%) | 0 (0.0%) |
| 35 Years and over | 0 (0.0%) | 0 (0.0%) |
| Total | 12 (100.0%) | 0 (0.0%) |
Educational Attainment by Field of Study in Killona
, and arts & humanities (26 | 100.0%) are the most common fields of study among 26 individuals in Killona who have obtained a bachelor's degree or higher.
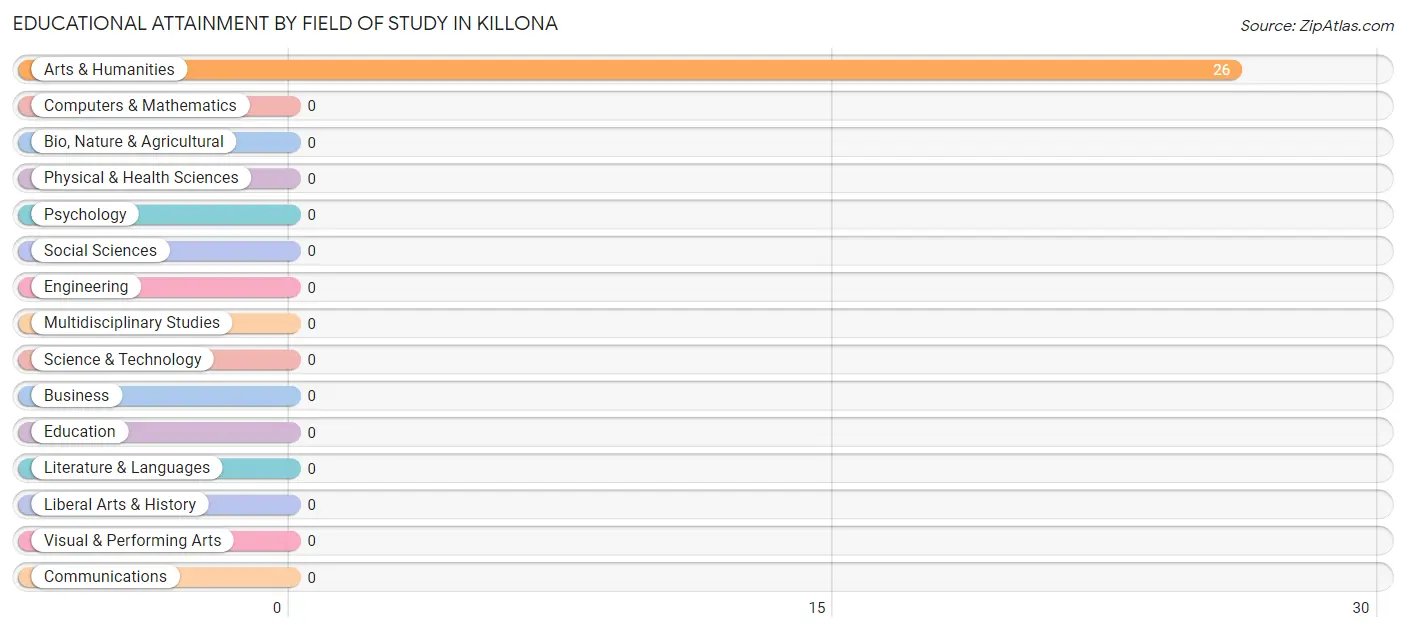
| Field of Study | # Graduates | % Graduates |
| Computers & Mathematics | 0 | 0.0% |
| Bio, Nature & Agricultural | 0 | 0.0% |
| Physical & Health Sciences | 0 | 0.0% |
| Psychology | 0 | 0.0% |
| Social Sciences | 0 | 0.0% |
| Engineering | 0 | 0.0% |
| Multidisciplinary Studies | 0 | 0.0% |
| Science & Technology | 0 | 0.0% |
| Business | 0 | 0.0% |
| Education | 0 | 0.0% |
| Literature & Languages | 0 | 0.0% |
| Liberal Arts & History | 0 | 0.0% |
| Visual & Performing Arts | 0 | 0.0% |
| Communications | 0 | 0.0% |
| Arts & Humanities | 26 | 100.0% |
| Total | 26 | 100.0% |
Transportation & Commute in Killona
Vehicle Availability by Sex in Killona
The most prevalent vehicle ownership categories in Killona are males with 2 vehicles (38, accounting for 70.4%) and females with 2 vehicles (0, making up 61.3%).
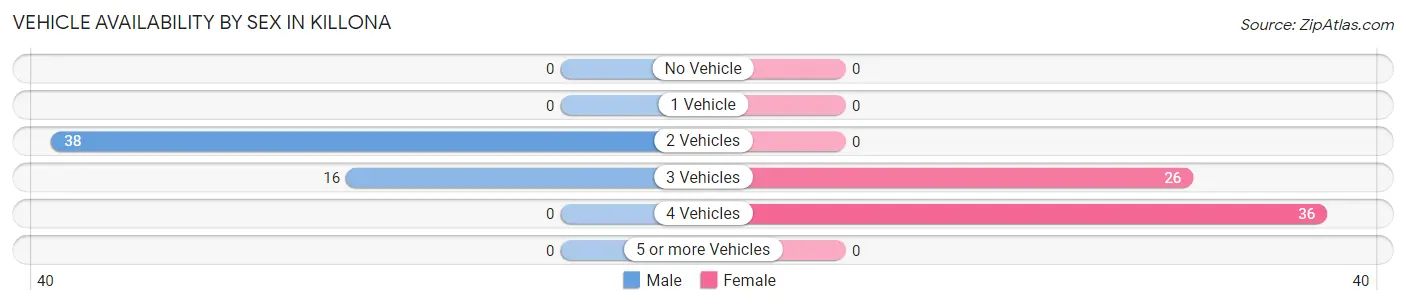
| Vehicles Available | Male | Female |
| No Vehicle | 0 (0.0%) | 0 (0.0%) |
| 1 Vehicle | 0 (0.0%) | 0 (0.0%) |
| 2 Vehicles | 38 (70.4%) | 0 (0.0%) |
| 3 Vehicles | 16 (29.6%) | 26 (41.9%) |
| 4 Vehicles | 0 (0.0%) | 36 (58.1%) |
| 5 or more Vehicles | 0 (0.0%) | 0 (0.0%) |
| Total | 54 (100.0%) | 62 (100.0%) |
Commute Time in Killona
The most frequently occuring commute durations in Killona are 25 to 29 minutes (58 commuters, 50.0%), 45 to 59 minutes (42 commuters, 36.2%), and 15 to 19 minutes (16 commuters, 13.8%).
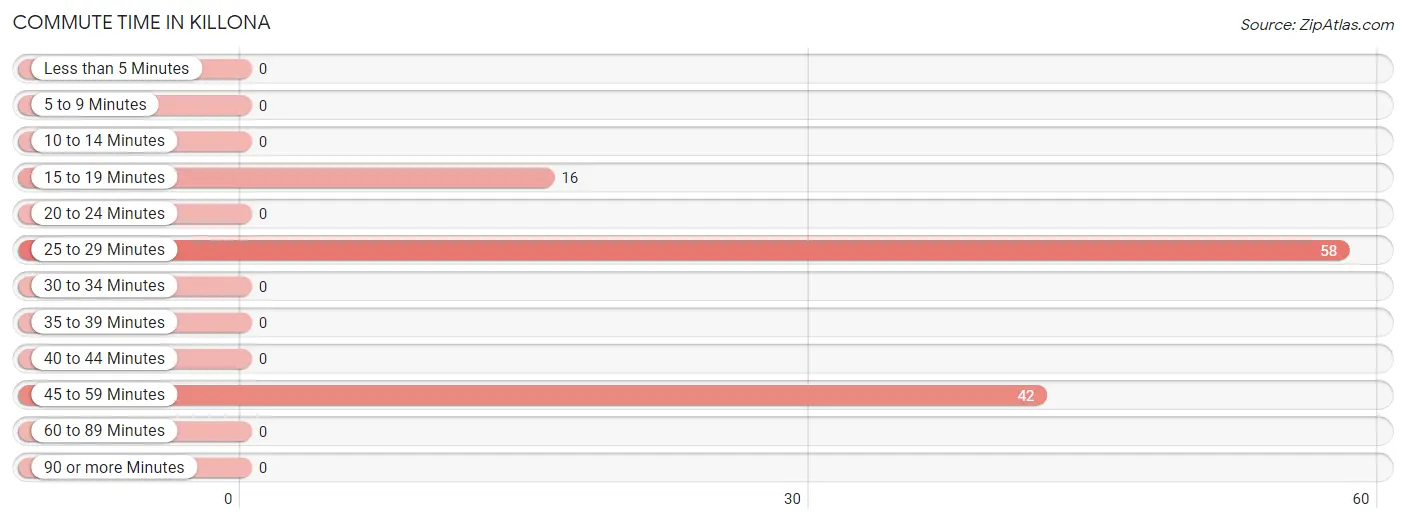
| Commute Time | # Commuters | % Commuters |
| Less than 5 Minutes | 0 | 0.0% |
| 5 to 9 Minutes | 0 | 0.0% |
| 10 to 14 Minutes | 0 | 0.0% |
| 15 to 19 Minutes | 16 | 13.8% |
| 20 to 24 Minutes | 0 | 0.0% |
| 25 to 29 Minutes | 58 | 50.0% |
| 30 to 34 Minutes | 0 | 0.0% |
| 35 to 39 Minutes | 0 | 0.0% |
| 40 to 44 Minutes | 0 | 0.0% |
| 45 to 59 Minutes | 42 | 36.2% |
| 60 to 89 Minutes | 0 | 0.0% |
| 90 or more Minutes | 0 | 0.0% |
Commute Time by Sex in Killona
The most common commute times in Killona are 25 to 29 minutes (22 commuters, 40.7%) for males and 25 to 29 minutes (36 commuters, 58.1%) for females.
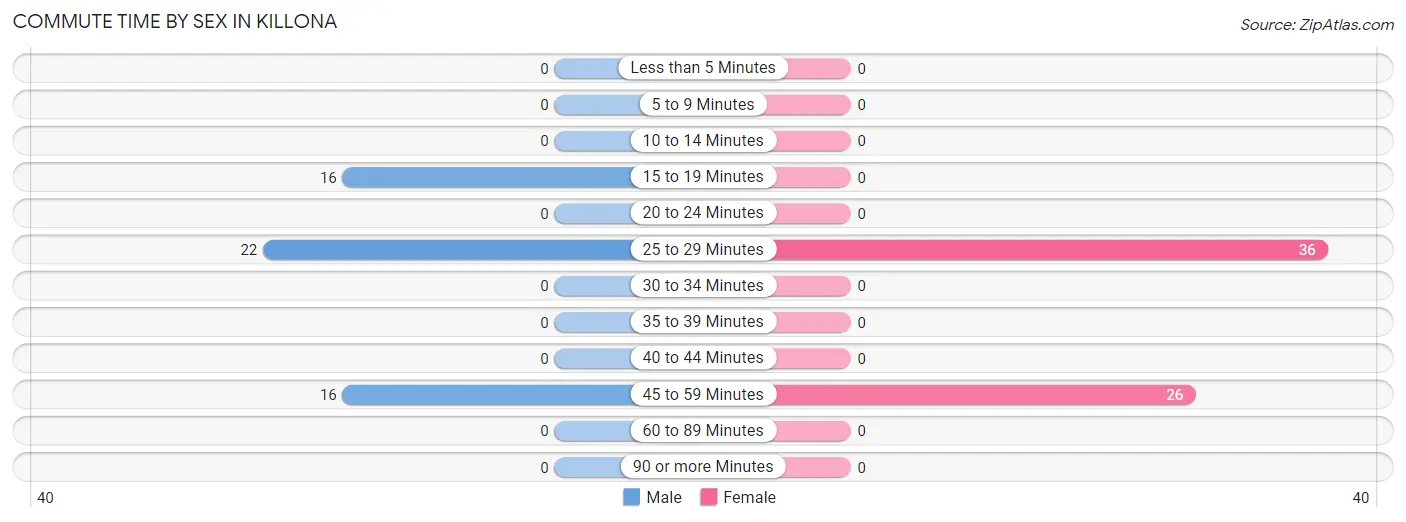
| Commute Time | Male | Female |
| Less than 5 Minutes | 0 (0.0%) | 0 (0.0%) |
| 5 to 9 Minutes | 0 (0.0%) | 0 (0.0%) |
| 10 to 14 Minutes | 0 (0.0%) | 0 (0.0%) |
| 15 to 19 Minutes | 16 (29.6%) | 0 (0.0%) |
| 20 to 24 Minutes | 0 (0.0%) | 0 (0.0%) |
| 25 to 29 Minutes | 22 (40.7%) | 36 (58.1%) |
| 30 to 34 Minutes | 0 (0.0%) | 0 (0.0%) |
| 35 to 39 Minutes | 0 (0.0%) | 0 (0.0%) |
| 40 to 44 Minutes | 0 (0.0%) | 0 (0.0%) |
| 45 to 59 Minutes | 16 (29.6%) | 26 (41.9%) |
| 60 to 89 Minutes | 0 (0.0%) | 0 (0.0%) |
| 90 or more Minutes | 0 (0.0%) | 0 (0.0%) |
Time of Departure to Work by Sex in Killona
The most frequent times of departure to work in Killona are 5:30 AM to 5:59 AM (22, 40.7%) for males and 6:00 AM to 6:29 AM (36, 58.1%) for females.
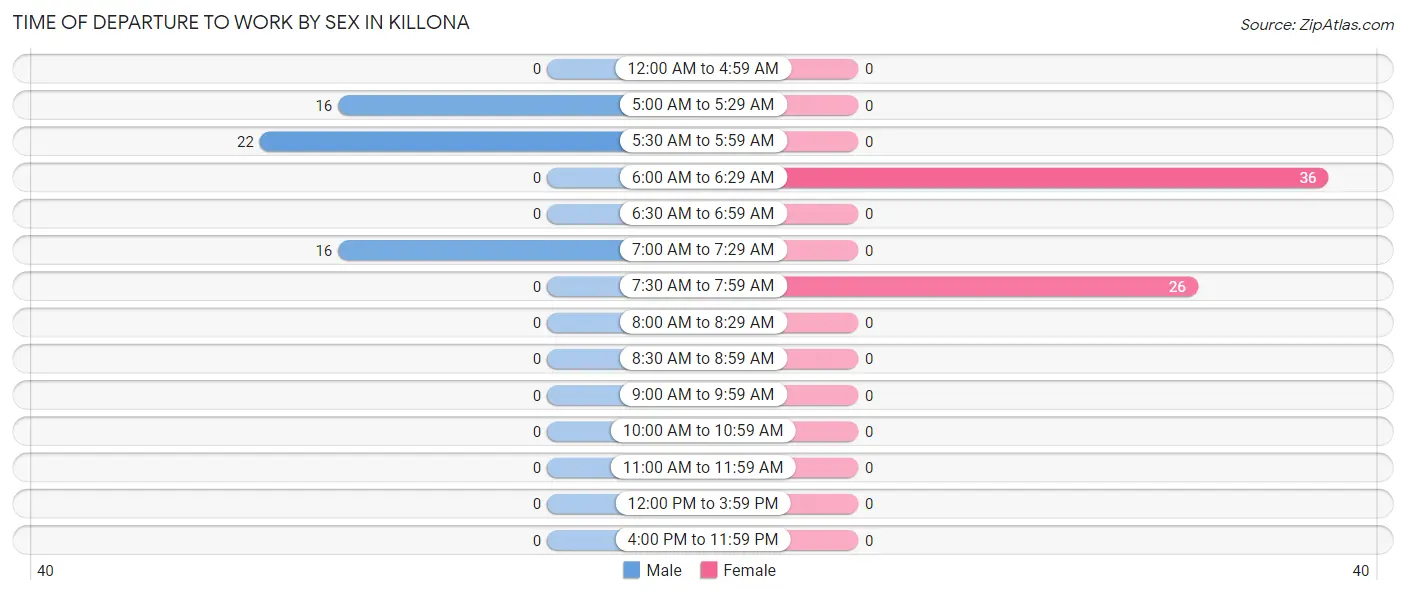
| Time of Departure | Male | Female |
| 12:00 AM to 4:59 AM | 0 (0.0%) | 0 (0.0%) |
| 5:00 AM to 5:29 AM | 16 (29.6%) | 0 (0.0%) |
| 5:30 AM to 5:59 AM | 22 (40.7%) | 0 (0.0%) |
| 6:00 AM to 6:29 AM | 0 (0.0%) | 36 (58.1%) |
| 6:30 AM to 6:59 AM | 0 (0.0%) | 0 (0.0%) |
| 7:00 AM to 7:29 AM | 16 (29.6%) | 0 (0.0%) |
| 7:30 AM to 7:59 AM | 0 (0.0%) | 26 (41.9%) |
| 8:00 AM to 8:29 AM | 0 (0.0%) | 0 (0.0%) |
| 8:30 AM to 8:59 AM | 0 (0.0%) | 0 (0.0%) |
| 9:00 AM to 9:59 AM | 0 (0.0%) | 0 (0.0%) |
| 10:00 AM to 10:59 AM | 0 (0.0%) | 0 (0.0%) |
| 11:00 AM to 11:59 AM | 0 (0.0%) | 0 (0.0%) |
| 12:00 PM to 3:59 PM | 0 (0.0%) | 0 (0.0%) |
| 4:00 PM to 11:59 PM | 0 (0.0%) | 0 (0.0%) |
| Total | 54 (100.0%) | 62 (100.0%) |
Housing Occupancy in Killona
Occupancy by Ownership in Killona
Of the total 145 dwellings in Killona, owner-occupied units account for 136 (93.8%), while renter-occupied units make up 9 (6.2%).
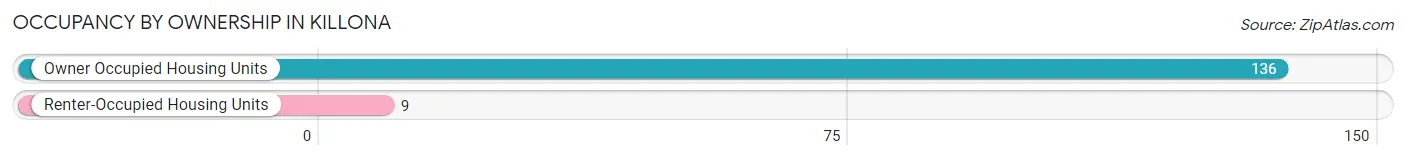
| Occupancy | # Housing Units | % Housing Units |
| Owner Occupied Housing Units | 136 | 93.8% |
| Renter-Occupied Housing Units | 9 | 6.2% |
| Total Occupied Housing Units | 145 | 100.0% |
Occupancy by Household Size in Killona
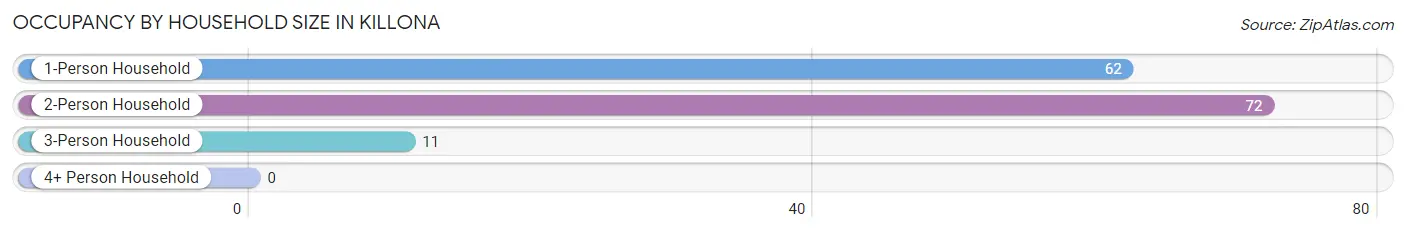
| Household Size | # Housing Units | % Housing Units |
| 1-Person Household | 62 | 42.8% |
| 2-Person Household | 72 | 49.7% |
| 3-Person Household | 11 | 7.6% |
| 4+ Person Household | 0 | 0.0% |
| Total Housing Units | 145 | 100.0% |
Occupancy by Ownership by Household Size in Killona
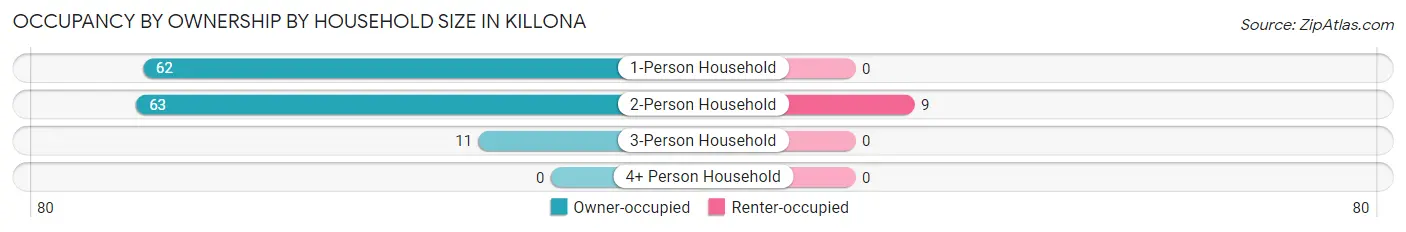
| Household Size | Owner-occupied | Renter-occupied |
| 1-Person Household | 62 (100.0%) | 0 (0.0%) |
| 2-Person Household | 63 (87.5%) | 9 (12.5%) |
| 3-Person Household | 11 (100.0%) | 0 (0.0%) |
| 4+ Person Household | 0 (0.0%) | 0 (0.0%) |
| Total Housing Units | 136 (93.8%) | 9 (6.2%) |
Occupancy by Educational Attainment in Killona
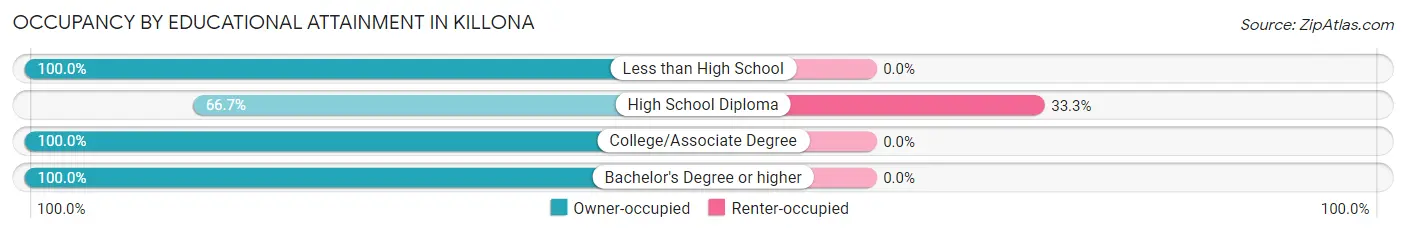
| Household Size | Owner-occupied | Renter-occupied |
| Less than High School | 19 (100.0%) | 0 (0.0%) |
| High School Diploma | 18 (66.7%) | 9 (33.3%) |
| College/Associate Degree | 73 (100.0%) | 0 (0.0%) |
| Bachelor's Degree or higher | 26 (100.0%) | 0 (0.0%) |
Occupancy by Age of Householder in Killona
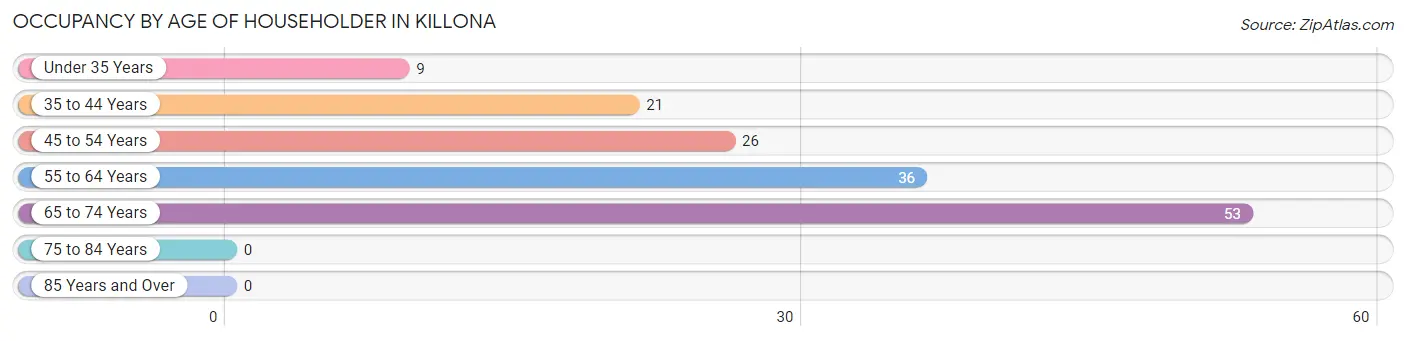
| Age Bracket | # Households | % Households |
| Under 35 Years | 9 | 6.2% |
| 35 to 44 Years | 21 | 14.5% |
| 45 to 54 Years | 26 | 17.9% |
| 55 to 64 Years | 36 | 24.8% |
| 65 to 74 Years | 53 | 36.5% |
| 75 to 84 Years | 0 | 0.0% |
| 85 Years and Over | 0 | 0.0% |
| Total | 145 | 100.0% |
Housing Finances in Killona
Median Income by Occupancy in Killona
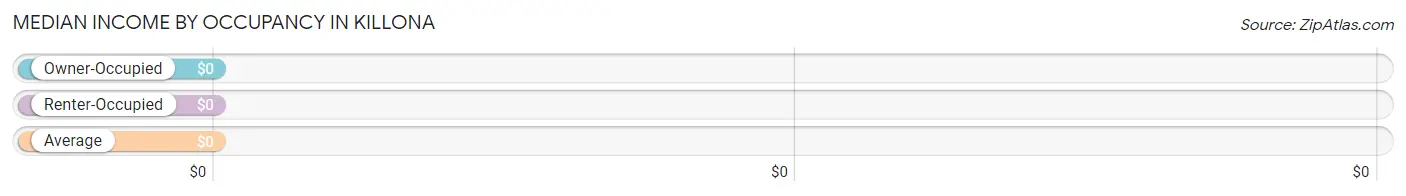
| Occupancy Type | # Households | Median Income |
| Owner-Occupied | 136 (93.8%) | $0 |
| Renter-Occupied | 9 (6.2%) | $0 |
| Average | 145 (100.0%) | $0 |
Occupancy by Householder Income Bracket in Killona
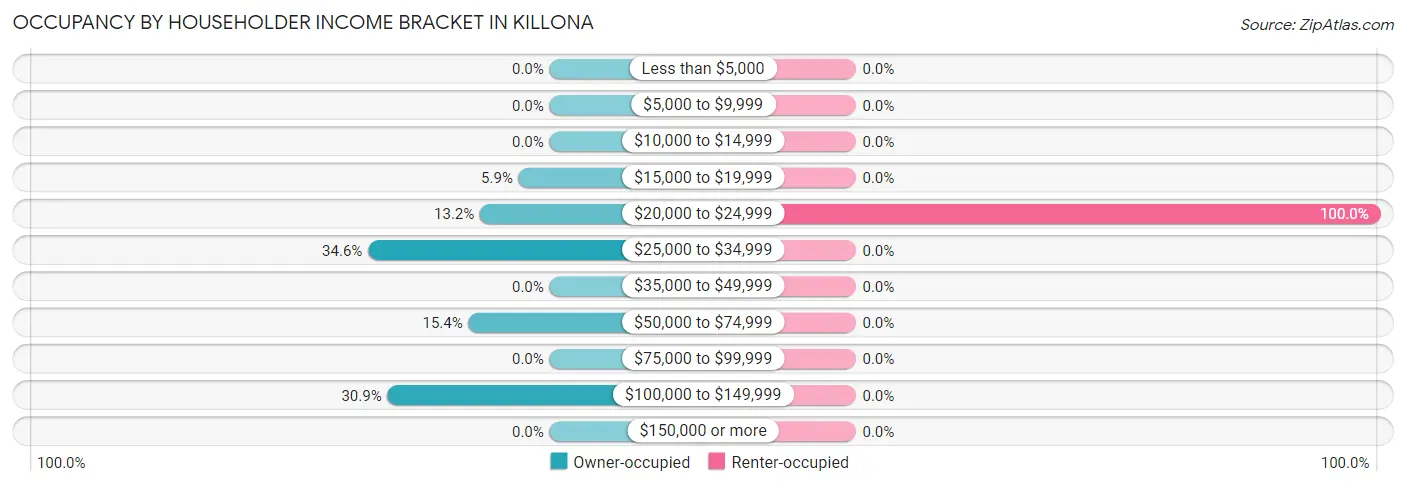
| Income Bracket | Owner-occupied | Renter-occupied |
| Less than $5,000 | 0 (0.0%) | 0 (0.0%) |
| $5,000 to $9,999 | 0 (0.0%) | 0 (0.0%) |
| $10,000 to $14,999 | 0 (0.0%) | 0 (0.0%) |
| $15,000 to $19,999 | 8 (5.9%) | 0 (0.0%) |
| $20,000 to $24,999 | 18 (13.2%) | 9 (100.0%) |
| $25,000 to $34,999 | 47 (34.6%) | 0 (0.0%) |
| $35,000 to $49,999 | 0 (0.0%) | 0 (0.0%) |
| $50,000 to $74,999 | 21 (15.4%) | 0 (0.0%) |
| $75,000 to $99,999 | 0 (0.0%) | 0 (0.0%) |
| $100,000 to $149,999 | 42 (30.9%) | 0 (0.0%) |
| $150,000 or more | 0 (0.0%) | 0 (0.0%) |
| Total | 136 (100.0%) | 9 (100.0%) |
Monthly Housing Cost Tiers in Killona
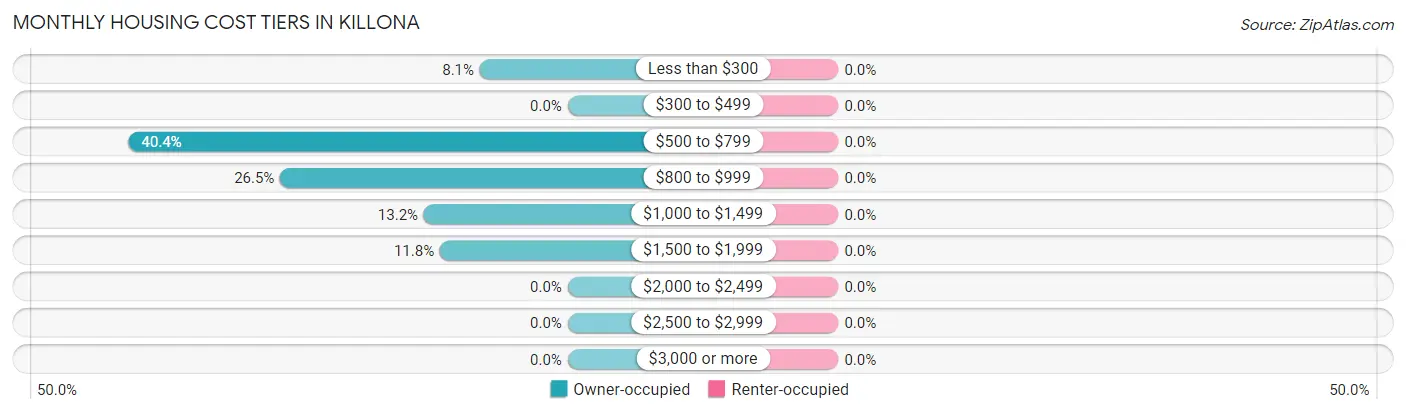
| Monthly Cost | Owner-occupied | Renter-occupied |
| Less than $300 | 11 (8.1%) | 0 (0.0%) |
| $300 to $499 | 0 (0.0%) | 0 (0.0%) |
| $500 to $799 | 55 (40.4%) | 0 (0.0%) |
| $800 to $999 | 36 (26.5%) | 0 (0.0%) |
| $1,000 to $1,499 | 18 (13.2%) | 0 (0.0%) |
| $1,500 to $1,999 | 16 (11.8%) | 0 (0.0%) |
| $2,000 to $2,499 | 0 (0.0%) | 0 (0.0%) |
| $2,500 to $2,999 | 0 (0.0%) | 0 (0.0%) |
| $3,000 or more | 0 (0.0%) | 0 (0.0%) |
| Total | 136 (100.0%) | 9 (100.0%) |
Physical Housing Characteristics in Killona
Housing Structures in Killona
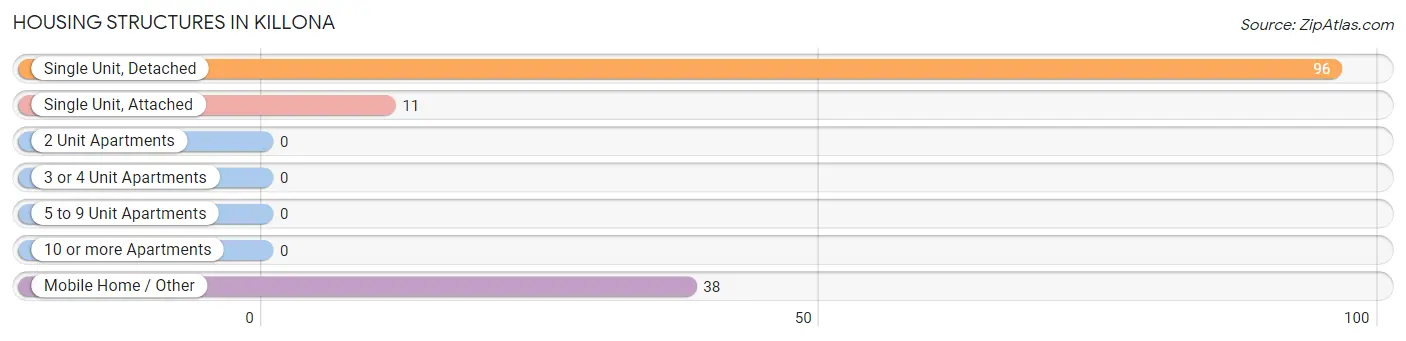
| Structure Type | # Housing Units | % Housing Units |
| Single Unit, Detached | 96 | 66.2% |
| Single Unit, Attached | 11 | 7.6% |
| 2 Unit Apartments | 0 | 0.0% |
| 3 or 4 Unit Apartments | 0 | 0.0% |
| 5 to 9 Unit Apartments | 0 | 0.0% |
| 10 or more Apartments | 0 | 0.0% |
| Mobile Home / Other | 38 | 26.2% |
| Total | 145 | 100.0% |
Housing Structures by Occupancy in Killona
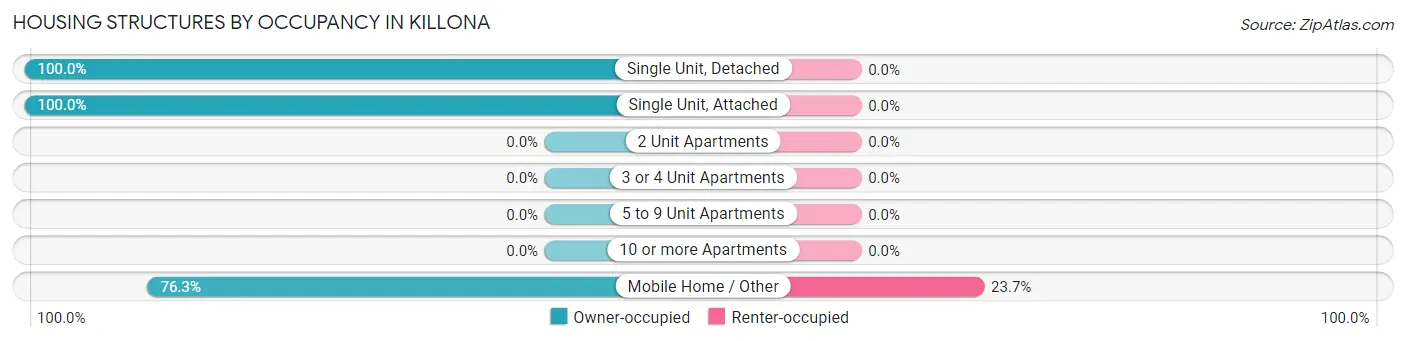
| Structure Type | Owner-occupied | Renter-occupied |
| Single Unit, Detached | 96 (100.0%) | 0 (0.0%) |
| Single Unit, Attached | 11 (100.0%) | 0 (0.0%) |
| 2 Unit Apartments | 0 (0.0%) | 0 (0.0%) |
| 3 or 4 Unit Apartments | 0 (0.0%) | 0 (0.0%) |
| 5 to 9 Unit Apartments | 0 (0.0%) | 0 (0.0%) |
| 10 or more Apartments | 0 (0.0%) | 0 (0.0%) |
| Mobile Home / Other | 29 (76.3%) | 9 (23.7%) |
| Total | 136 (93.8%) | 9 (6.2%) |
Housing Structures by Number of Rooms in Killona
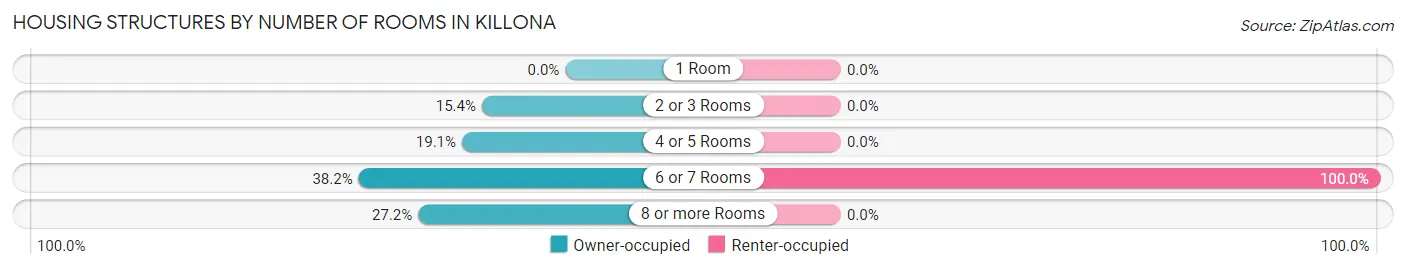
| Number of Rooms | Owner-occupied | Renter-occupied |
| 1 Room | 0 (0.0%) | 0 (0.0%) |
| 2 or 3 Rooms | 21 (15.4%) | 0 (0.0%) |
| 4 or 5 Rooms | 26 (19.1%) | 0 (0.0%) |
| 6 or 7 Rooms | 52 (38.2%) | 9 (100.0%) |
| 8 or more Rooms | 37 (27.2%) | 0 (0.0%) |
| Total | 136 (100.0%) | 9 (100.0%) |
Housing Structure by Heating Type in Killona
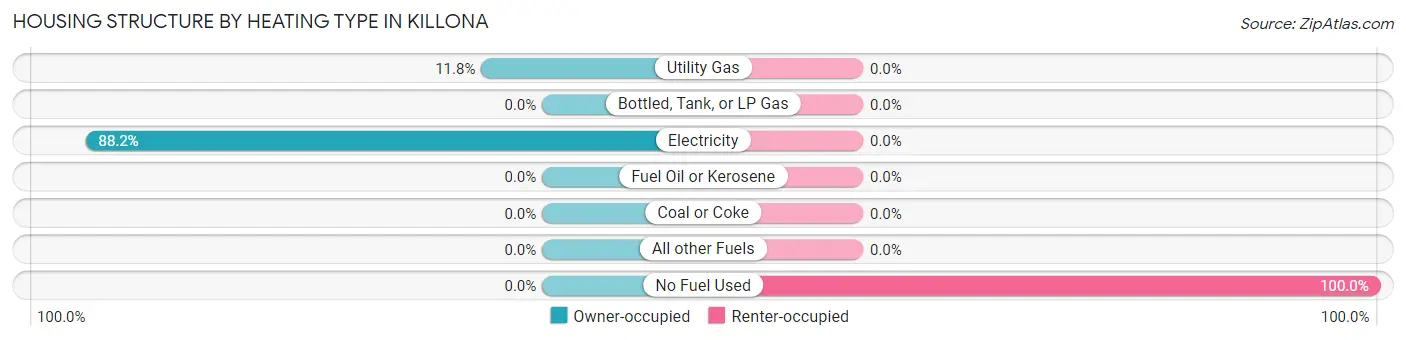
| Heating Type | Owner-occupied | Renter-occupied |
| Utility Gas | 16 (11.8%) | 0 (0.0%) |
| Bottled, Tank, or LP Gas | 0 (0.0%) | 0 (0.0%) |
| Electricity | 120 (88.2%) | 0 (0.0%) |
| Fuel Oil or Kerosene | 0 (0.0%) | 0 (0.0%) |
| Coal or Coke | 0 (0.0%) | 0 (0.0%) |
| All other Fuels | 0 (0.0%) | 0 (0.0%) |
| No Fuel Used | 0 (0.0%) | 9 (100.0%) |
| Total | 136 (100.0%) | 9 (100.0%) |
Household Vehicle Usage in Killona
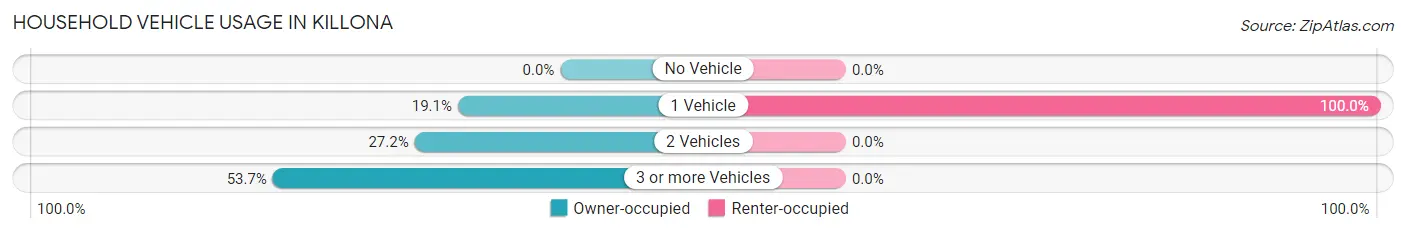
| Vehicles per Household | Owner-occupied | Renter-occupied |
| No Vehicle | 0 (0.0%) | 0 (0.0%) |
| 1 Vehicle | 26 (19.1%) | 9 (100.0%) |
| 2 Vehicles | 37 (27.2%) | 0 (0.0%) |
| 3 or more Vehicles | 73 (53.7%) | 0 (0.0%) |
| Total | 136 (100.0%) | 9 (100.0%) |
Real Estate & Mortgages in Killona
Real Estate and Mortgage Overview in Killona
| Characteristic | Without Mortgage | With Mortgage |
| Housing Units | 102 | 34 |
| Median Property Value | $271,200 | $0 |
| Median Household Income | - | - |
| Monthly Housing Costs | $642 | $0 |
| Real Estate Taxes | - | - |
Property Value by Mortgage Status in Killona
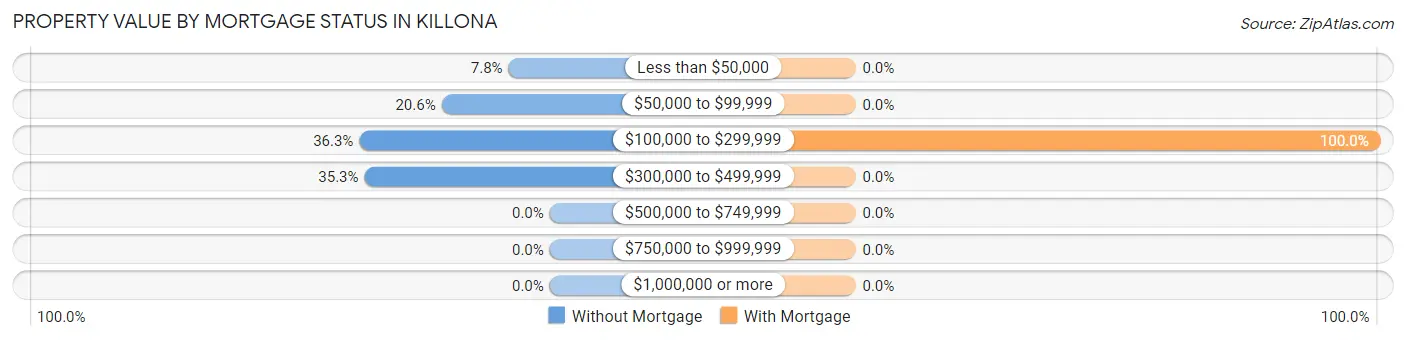
| Property Value | Without Mortgage | With Mortgage |
| Less than $50,000 | 8 (7.8%) | 0 (0.0%) |
| $50,000 to $99,999 | 21 (20.6%) | 0 (0.0%) |
| $100,000 to $299,999 | 37 (36.3%) | 34 (100.0%) |
| $300,000 to $499,999 | 36 (35.3%) | 0 (0.0%) |
| $500,000 to $749,999 | 0 (0.0%) | 0 (0.0%) |
| $750,000 to $999,999 | 0 (0.0%) | 0 (0.0%) |
| $1,000,000 or more | 0 (0.0%) | 0 (0.0%) |
| Total | 102 (100.0%) | 34 (100.0%) |
Household Income by Mortgage Status in Killona
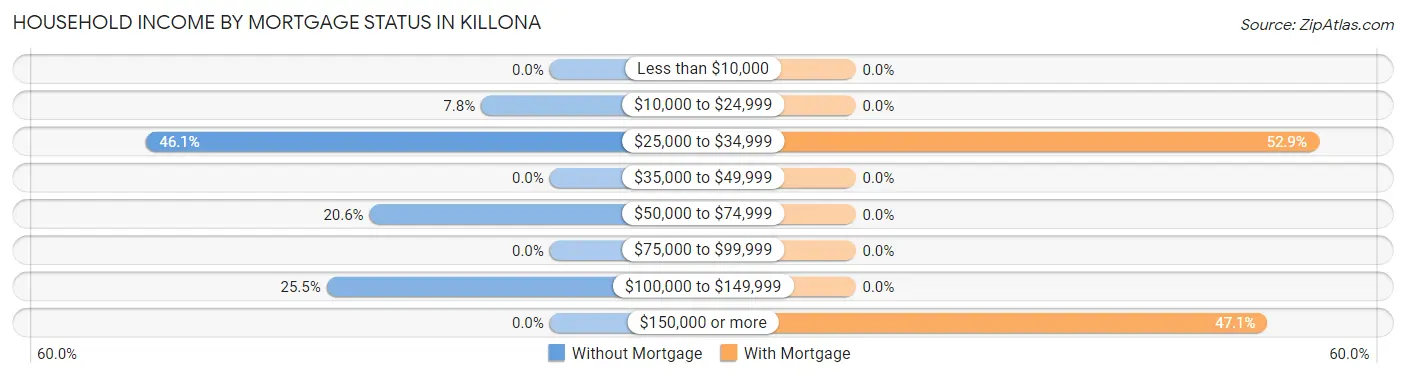
| Household Income | Without Mortgage | With Mortgage |
| Less than $10,000 | 0 (0.0%) | 0 (0.0%) |
| $10,000 to $24,999 | 8 (7.8%) | 0 (0.0%) |
| $25,000 to $34,999 | 47 (46.1%) | 18 (52.9%) |
| $35,000 to $49,999 | 0 (0.0%) | 0 (0.0%) |
| $50,000 to $74,999 | 21 (20.6%) | 0 (0.0%) |
| $75,000 to $99,999 | 0 (0.0%) | 0 (0.0%) |
| $100,000 to $149,999 | 26 (25.5%) | 0 (0.0%) |
| $150,000 or more | 0 (0.0%) | 16 (47.1%) |
| Total | 102 (100.0%) | 34 (100.0%) |
Property Value to Household Income Ratio in Killona
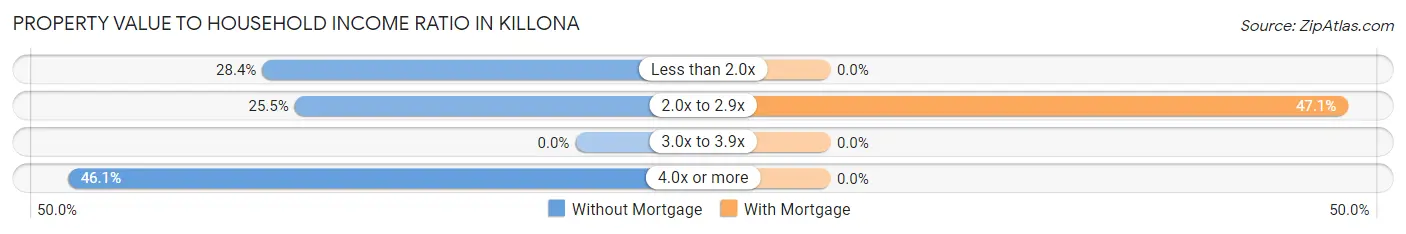
| Value-to-Income Ratio | Without Mortgage | With Mortgage |
| Less than 2.0x | 29 (28.4%) | 0 (0.0%) |
| 2.0x to 2.9x | 26 (25.5%) | 16 (47.1%) |
| 3.0x to 3.9x | 0 (0.0%) | 0 (0.0%) |
| 4.0x or more | 47 (46.1%) | 0 (0.0%) |
| Total | 102 (100.0%) | 34 (100.0%) |
Real Estate Taxes by Mortgage Status in Killona
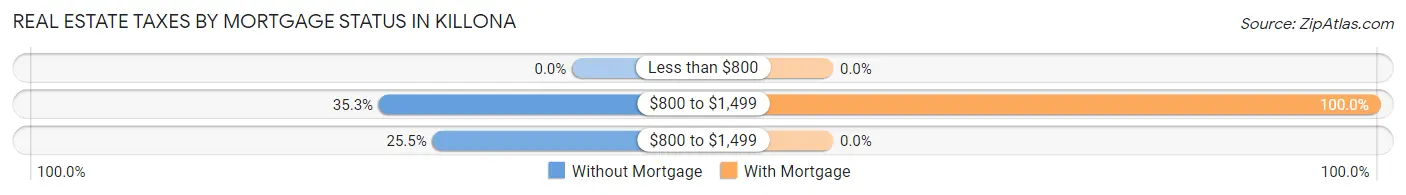
| Property Taxes | Without Mortgage | With Mortgage |
| Less than $800 | 0 (0.0%) | 0 (0.0%) |
| $800 to $1,499 | 36 (35.3%) | 34 (100.0%) |
| $800 to $1,499 | 26 (25.5%) | 0 (0.0%) |
| Total | 102 (100.0%) | 34 (100.0%) |
Health & Disability in Killona
Health Insurance Coverage by Age in Killona
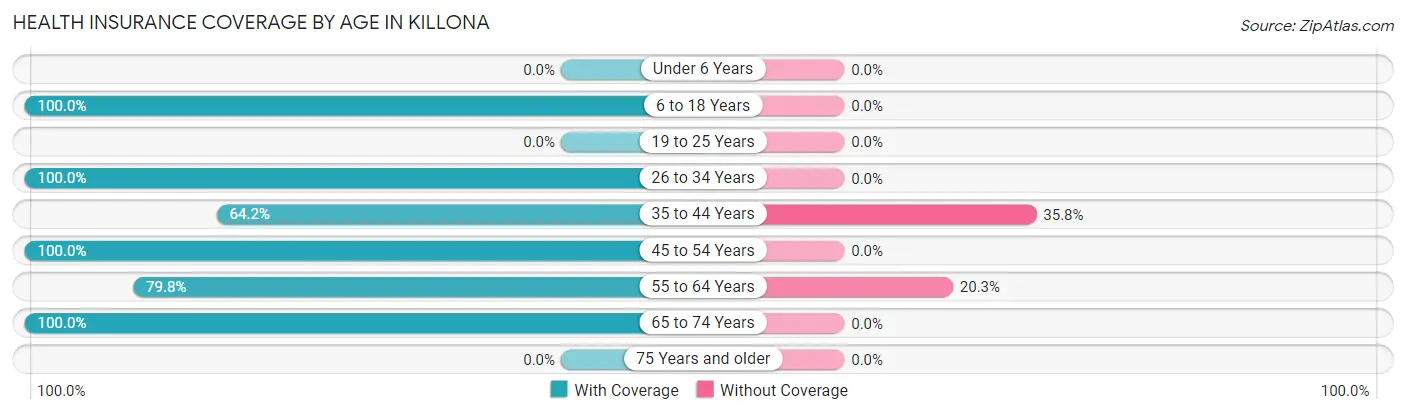
| Age Bracket | With Coverage | Without Coverage |
| Under 6 Years | 0 (0.0%) | 0 (0.0%) |
| 6 to 18 Years | 12 (100.0%) | 0 (0.0%) |
| 19 to 25 Years | 0 (0.0%) | 0 (0.0%) |
| 26 to 34 Years | 9 (100.0%) | 0 (0.0%) |
| 35 to 44 Years | 43 (64.2%) | 24 (35.8%) |
| 45 to 54 Years | 42 (100.0%) | 0 (0.0%) |
| 55 to 64 Years | 63 (79.7%) | 16 (20.3%) |
| 65 to 74 Years | 53 (100.0%) | 0 (0.0%) |
| 75 Years and older | 0 (0.0%) | 0 (0.0%) |
| Total | 222 (84.7%) | 40 (15.3%) |
Health Insurance Coverage by Citizenship Status in Killona
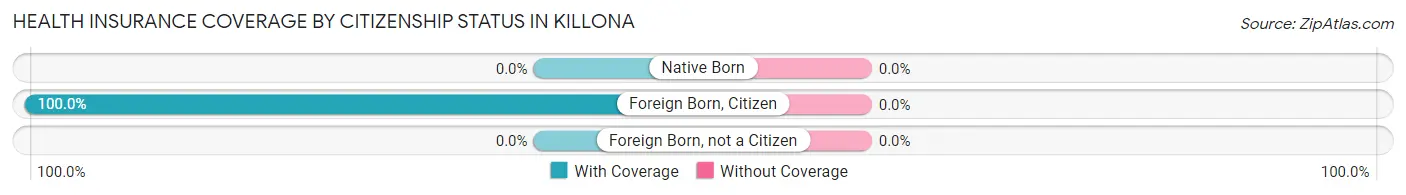
| Citizenship Status | With Coverage | Without Coverage |
| Native Born | 0 (0.0%) | 0 (0.0%) |
| Foreign Born, Citizen | 12 (100.0%) | 0 (0.0%) |
| Foreign Born, not a Citizen | 0 (0.0%) | 0 (0.0%) |
Health Insurance Coverage by Household Income in Killona
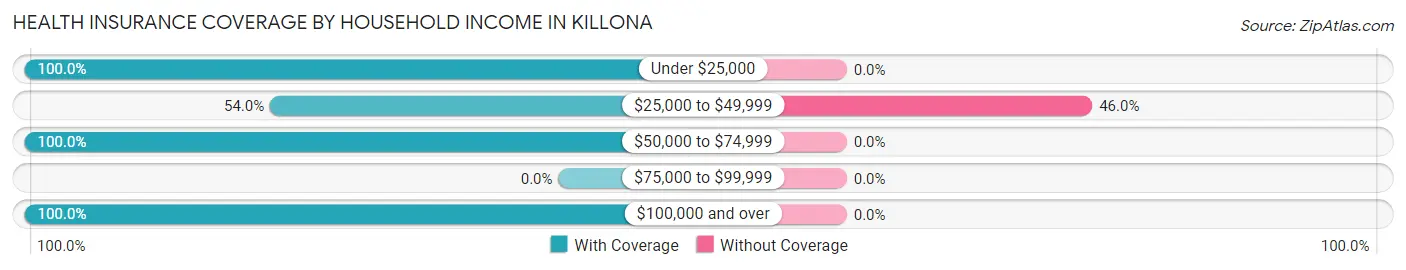
| Household Income | With Coverage | Without Coverage |
| Under $25,000 | 47 (100.0%) | 0 (0.0%) |
| $25,000 to $49,999 | 47 (54.0%) | 40 (46.0%) |
| $50,000 to $74,999 | 43 (100.0%) | 0 (0.0%) |
| $75,000 to $99,999 | 0 (0.0%) | 0 (0.0%) |
| $100,000 and over | 85 (100.0%) | 0 (0.0%) |
Public vs Private Health Insurance Coverage by Age in Killona
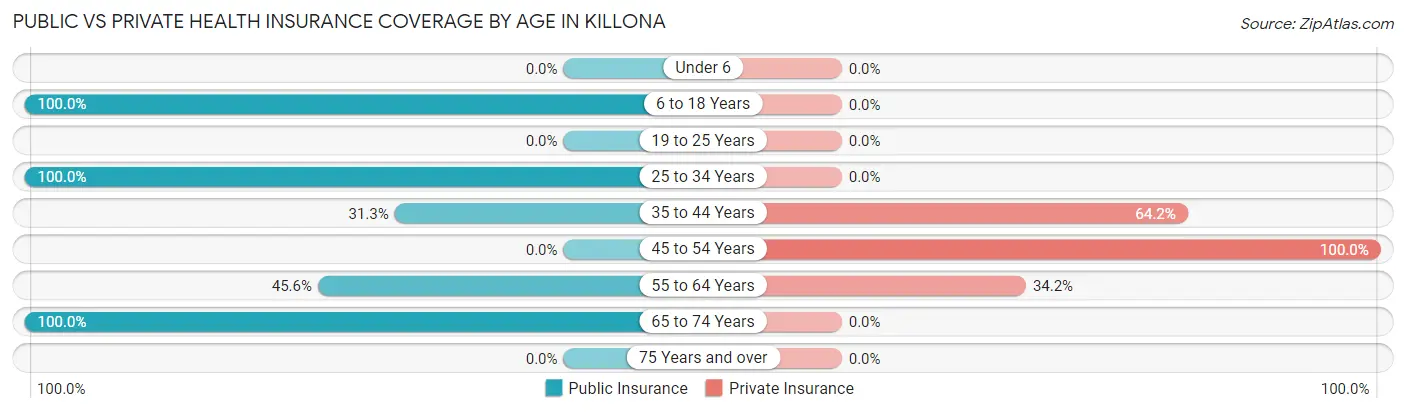
| Age Bracket | Public Insurance | Private Insurance |
| Under 6 | 0 (0.0%) | 0 (0.0%) |
| 6 to 18 Years | 12 (100.0%) | 0 (0.0%) |
| 19 to 25 Years | 0 (0.0%) | 0 (0.0%) |
| 25 to 34 Years | 9 (100.0%) | 0 (0.0%) |
| 35 to 44 Years | 21 (31.3%) | 43 (64.2%) |
| 45 to 54 Years | 0 (0.0%) | 42 (100.0%) |
| 55 to 64 Years | 36 (45.6%) | 27 (34.2%) |
| 65 to 74 Years | 53 (100.0%) | 0 (0.0%) |
| 75 Years and over | 0 (0.0%) | 0 (0.0%) |
| Total | 131 (50.0%) | 112 (42.7%) |
Disability Status by Sex by Age in Killona
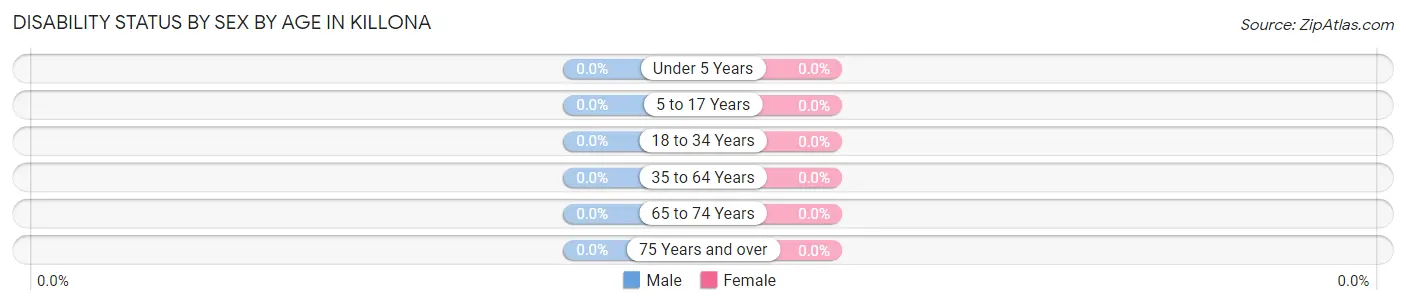
| Age Bracket | Male | Female |
| Under 5 Years | 0 (0.0%) | 0 (0.0%) |
| 5 to 17 Years | 0 (0.0%) | 0 (0.0%) |
| 18 to 34 Years | 0 (0.0%) | 0 (0.0%) |
| 35 to 64 Years | 0 (0.0%) | 0 (0.0%) |
| 65 to 74 Years | 0 (0.0%) | 0 (0.0%) |
| 75 Years and over | 0 (0.0%) | 0 (0.0%) |
Disability Class by Sex by Age in Killona
Disability Class: Hearing Difficulty
| Age Bracket | Male | Female |
| Under 5 Years | 0 (0.0%) | 0 (0.0%) |
| 5 to 17 Years | 0 (0.0%) | 0 (0.0%) |
| 18 to 34 Years | 0 (0.0%) | 0 (0.0%) |
| 35 to 64 Years | 0 (0.0%) | 0 (0.0%) |
| 65 to 74 Years | 0 (0.0%) | 0 (0.0%) |
| 75 Years and over | 0 (0.0%) | 0 (0.0%) |
Disability Class: Vision Difficulty
| Age Bracket | Male | Female |
| Under 5 Years | 0 (0.0%) | 0 (0.0%) |
| 5 to 17 Years | 0 (0.0%) | 0 (0.0%) |
| 18 to 34 Years | 0 (0.0%) | 0 (0.0%) |
| 35 to 64 Years | 0 (0.0%) | 0 (0.0%) |
| 65 to 74 Years | 0 (0.0%) | 0 (0.0%) |
| 75 Years and over | 0 (0.0%) | 0 (0.0%) |
Disability Class: Cognitive Difficulty
| Age Bracket | Male | Female |
| 5 to 17 Years | 0 (0.0%) | 0 (0.0%) |
| 18 to 34 Years | 0 (0.0%) | 0 (0.0%) |
| 35 to 64 Years | 0 (0.0%) | 0 (0.0%) |
| 65 to 74 Years | 0 (0.0%) | 0 (0.0%) |
| 75 Years and over | 0 (0.0%) | 0 (0.0%) |
Disability Class: Ambulatory Difficulty
| Age Bracket | Male | Female |
| 5 to 17 Years | 0 (0.0%) | 0 (0.0%) |
| 18 to 34 Years | 0 (0.0%) | 0 (0.0%) |
| 35 to 64 Years | 0 (0.0%) | 0 (0.0%) |
| 65 to 74 Years | 0 (0.0%) | 0 (0.0%) |
| 75 Years and over | 0 (0.0%) | 0 (0.0%) |
Disability Class: Self-Care Difficulty
| Age Bracket | Male | Female |
| 5 to 17 Years | 0 (0.0%) | 0 (0.0%) |
| 18 to 34 Years | 0 (0.0%) | 0 (0.0%) |
| 35 to 64 Years | 0 (0.0%) | 0 (0.0%) |
| 65 to 74 Years | 0 (0.0%) | 0 (0.0%) |
| 75 Years and over | 0 (0.0%) | 0 (0.0%) |
Technology Access in Killona
Computing Device Access in Killona
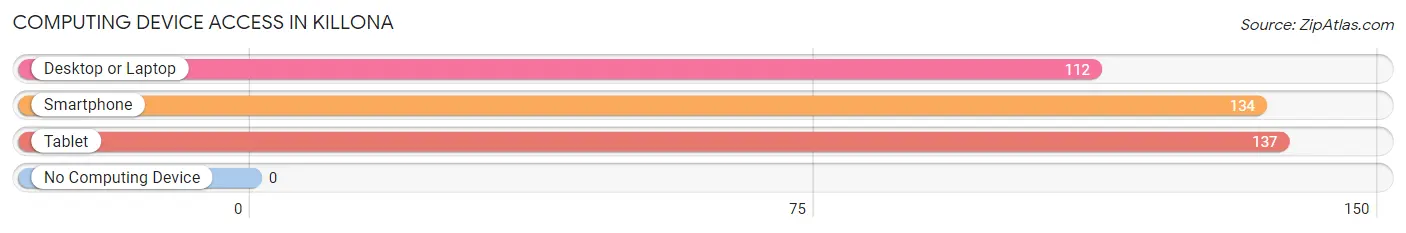
| Device Type | # Households | % Households |
| Desktop or Laptop | 112 | 77.2% |
| Smartphone | 134 | 92.4% |
| Tablet | 137 | 94.5% |
| No Computing Device | 0 | 0.0% |
| Total | 145 | 100.0% |
Internet Access in Killona
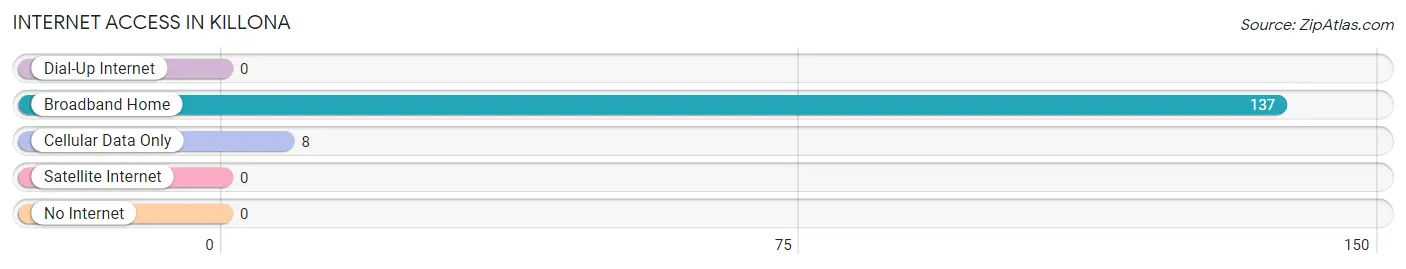
| Internet Type | # Households | % Households |
| Dial-Up Internet | 0 | 0.0% |
| Broadband Home | 137 | 94.5% |
| Cellular Data Only | 8 | 5.5% |
| Satellite Internet | 0 | 0.0% |
| No Internet | 0 | 0.0% |
| Total | 145 | 100.0% |
Killona Summary
Killona is a small unincorporated community located in St. Charles Parish, Louisiana. It is situated along the Mississippi River, approximately 25 miles west of New Orleans. The population of Killona was estimated to be 1,845 in the year 2000.
History
The area that is now known as Killona was first settled by Native Americans in the late 1700s. The first European settlers arrived in the early 1800s, and the town was officially established in 1820. The town was named after the Killona Plantation, which was owned by the prominent local family of the same name.
The town grew steadily throughout the 19th century, and by the early 20th century, it had become a thriving agricultural community. The town was home to several cotton plantations, as well as a number of small businesses.
In the 1950s, the town began to decline as the local economy shifted away from agriculture. Many of the town’s residents moved away in search of better opportunities elsewhere.
Geography
Killona is located in St. Charles Parish, Louisiana, approximately 25 miles west of New Orleans. The town is situated along the Mississippi River, and is bordered by the towns of Luling and Boutte to the north, and Des Allemands to the south.
The town is located in a flat, low-lying area, and is prone to flooding during periods of heavy rain. The town is located in a humid subtropical climate zone, and experiences hot, humid summers and mild winters.
Economy
The economy of Killona is largely based on agriculture. The town is home to several cotton plantations, as well as a number of small businesses. The town is also home to a number of industrial plants, including a chemical plant and a paper mill.
The town is also home to a number of small retail stores, restaurants, and other businesses. The town is served by a number of local banks, and is home to a branch of the St. Charles Parish Library.
Demographics
The population of Killona was estimated to be 1,845 in the year 2000. The town is predominantly white, with a small African American population. The town is also home to a small Hispanic population.
The median household income in Killona is $37,000, and the median home value is $90,000. The town has a poverty rate of 17.5%, and the unemployment rate is 6.2%.
Conclusion
Killona is a small unincorporated community located in St. Charles Parish, Louisiana. It is situated along the Mississippi River, approximately 25 miles west of New Orleans. The population of Killona was estimated to be 1,845 in the year 2000. The town is predominantly white, with a small African American population. The town is also home to a small Hispanic population. The economy of Killona is largely based on agriculture, and the town is home to several cotton plantations, as well as a number of small businesses. The town is also home to a number of industrial plants, including a chemical plant and a paper mill. The median household income in Killona is $37,000, and the median home value is $90,000. The town has a poverty rate of 17.5%, and the unemployment rate is 6.2%.
Common Questions
What is Per Capita Income in Killona?
Per Capita income in Killona is $33,454.
What is Inequality or Gini Index in Killona?
Inequality or Gini Index in Killona is 0.39.
What is the Total Population of Killona?
Total Population of Killona is 262.
What is the Total Male Population of Killona?
Total Male Population of Killona is 105.
What is the Total Female Population of Killona?
Total Female Population of Killona is 157.
What is the Ratio of Males per 100 Females in Killona?
There are 66.88 Males per 100 Females in Killona.
What is the Ratio of Females per 100 Males in Killona?
There are 149.52 Females per 100 Males in Killona.
What is the Median Population Age in Killona?
Median Population Age in Killona is 57.0 Years.
What is the Average Family Size in Killona
Average Family Size in Killona is 2.1 People.
What is the Average Household Size in Killona
Average Household Size in Killona is 1.8 People.
How Large is the Labor Force in Killona?
There are 125 People in the Labor Forcein in Killona.
What is the Percentage of People in the Labor Force in Killona?
50.0% of People are in the Labor Force in Killona.
What is the Unemployment Rate in Killona?
Unemployment Rate in Killona is 7.2%.