Zip Codes with the Lowest Poverty Level Among Children Under the Age of 5 in Nevada
RELATED REPORTS & OPTIONS
Lowest Poverty | Child 0-5
Nevada
Compare Zip Codes
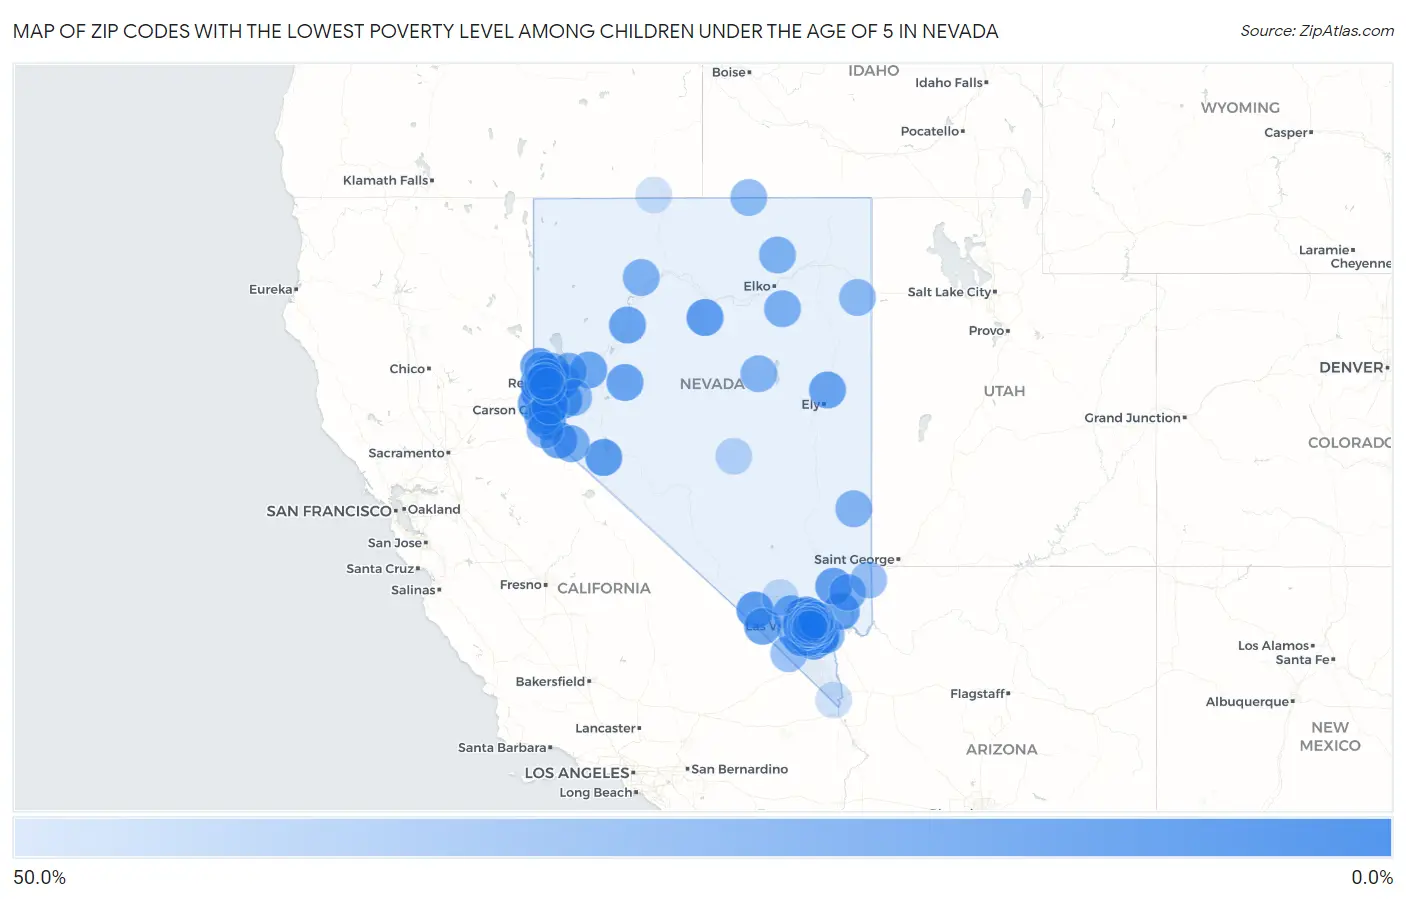
Map of Zip Codes with the Lowest Poverty Level Among Children Under the Age of 5 in Nevada
50.0%
0.0%
Zip Codes with the Lowest Poverty Level Among Children Under the Age of 5 in Nevada
| Zip Code | Child Poverty | vs State | vs National | |
| 1. | 89084 | 1.5% | 18.2%(-16.8)#1 | 18.1%(-16.6)#503 |
| 2. | 89511 | 1.7% | 18.2%(-16.5)#2 | 18.1%(-16.3)#670 |
| 3. | 89403 | 3.1% | 18.2%(-15.1)#3 | 18.1%(-14.9)#1,591 |
| 4. | 89060 | 3.3% | 18.2%(-14.9)#4 | 18.1%(-14.7)#1,713 |
| 5. | 89074 | 3.5% | 18.2%(-14.7)#5 | 18.1%(-14.6)#1,815 |
| 6. | 89509 | 3.6% | 18.2%(-14.6)#6 | 18.1%(-14.5)#1,869 |
| 7. | 89415 | 3.6% | 18.2%(-14.6)#7 | 18.1%(-14.4)#1,906 |
| 8. | 89085 | 4.1% | 18.2%(-14.1)#8 | 18.1%(-14.0)#2,240 |
| 9. | 89044 | 4.2% | 18.2%(-14.0)#9 | 18.1%(-13.8)#2,368 |
| 10. | 89011 | 4.4% | 18.2%(-13.8)#10 | 18.1%(-13.7)#2,471 |
| 11. | 89135 | 4.4% | 18.2%(-13.8)#11 | 18.1%(-13.6)#2,502 |
| 12. | 89149 | 4.5% | 18.2%(-13.8)#12 | 18.1%(-13.6)#2,522 |
| 13. | 89820 | 4.5% | 18.2%(-13.7)#13 | 18.1%(-13.5)#2,575 |
| 14. | 89423 | 4.7% | 18.2%(-13.6)#14 | 18.1%(-13.4)#2,673 |
| 15. | 89141 | 5.9% | 18.2%(-12.3)#15 | 18.1%(-12.1)#3,552 |
| 16. | 89521 | 6.1% | 18.2%(-12.1)#16 | 18.1%(-12.0)#3,648 |
| 17. | 89410 | 6.3% | 18.2%(-11.9)#17 | 18.1%(-11.8)#3,805 |
| 18. | 89040 | 6.7% | 18.2%(-11.5)#18 | 18.1%(-11.3)#4,107 |
| 19. | 89025 | 7.4% | 18.2%(-10.9)#19 | 18.1%(-10.7)#4,512 |
| 20. | 89508 | 7.4% | 18.2%(-10.8)#20 | 18.1%(-10.7)#4,526 |
| 21. | 89301 | 7.7% | 18.2%(-10.5)#21 | 18.1%(-10.4)#4,708 |
| 22. | 89031 | 7.7% | 18.2%(-10.5)#22 | 18.1%(-10.4)#4,744 |
| 23. | 89081 | 7.8% | 18.2%(-10.4)#23 | 18.1%(-10.3)#4,791 |
| 24. | 89436 | 8.0% | 18.2%(-10.2)#24 | 18.1%(-10.1)#4,930 |
| 25. | 89434 | 8.5% | 18.2%(-9.67)#25 | 18.1%(-9.52)#5,288 |
| 26. | 89451 | 8.6% | 18.2%(-9.62)#26 | 18.1%(-9.47)#5,319 |
| 27. | 89419 | 8.7% | 18.2%(-9.50)#27 | 18.1%(-9.35)#5,414 |
| 28. | 89178 | 8.7% | 18.2%(-9.48)#28 | 18.1%(-9.33)#5,427 |
| 29. | 89406 | 8.8% | 18.2%(-9.41)#29 | 18.1%(-9.26)#5,478 |
| 30. | 89523 | 8.9% | 18.2%(-9.32)#30 | 18.1%(-9.17)#5,535 |
| 31. | 89441 | 8.9% | 18.2%(-9.29)#31 | 18.1%(-9.14)#5,551 |
| 32. | 89701 | 9.1% | 18.2%(-9.12)#32 | 18.1%(-8.97)#5,658 |
| 33. | 89002 | 9.3% | 18.2%(-8.89)#33 | 18.1%(-8.74)#5,829 |
| 34. | 89048 | 9.5% | 18.2%(-8.71)#34 | 18.1%(-8.56)#5,942 |
| 35. | 89148 | 9.8% | 18.2%(-8.46)#35 | 18.1%(-8.31)#6,106 |
| 36. | 89408 | 9.8% | 18.2%(-8.41)#36 | 18.1%(-8.26)#6,140 |
| 37. | 89123 | 9.9% | 18.2%(-8.36)#37 | 18.1%(-8.21)#6,165 |
| 38. | 89134 | 10.8% | 18.2%(-7.37)#38 | 18.1%(-7.22)#6,742 |
| 39. | 89166 | 11.7% | 18.2%(-6.47)#39 | 18.1%(-6.32)#7,296 |
| 40. | 89117 | 11.8% | 18.2%(-6.44)#40 | 18.1%(-6.29)#7,324 |
| 41. | 89130 | 12.0% | 18.2%(-6.25)#41 | 18.1%(-6.10)#7,433 |
| 42. | 89128 | 12.1% | 18.2%(-6.09)#42 | 18.1%(-5.94)#7,536 |
| 43. | 89032 | 12.3% | 18.2%(-5.91)#43 | 18.1%(-5.76)#7,634 |
| 44. | 89052 | 12.3% | 18.2%(-5.89)#44 | 18.1%(-5.74)#7,647 |
| 45. | 89012 | 13.2% | 18.2%(-5.05)#45 | 18.1%(-4.90)#8,136 |
| 46. | 89120 | 13.3% | 18.2%(-4.95)#46 | 18.1%(-4.80)#8,190 |
| 47. | 89021 | 13.3% | 18.2%(-4.91)#47 | 18.1%(-4.76)#8,209 |
| 48. | 89444 | 14.2% | 18.2%(-4.05)#48 | 18.1%(-3.90)#8,719 |
| 49. | 89144 | 14.3% | 18.2%(-3.96)#49 | 18.1%(-3.81)#8,764 |
| 50. | 89431 | 14.3% | 18.2%(-3.91)#50 | 18.1%(-3.76)#8,854 |
| 51. | 89139 | 14.4% | 18.2%(-3.85)#51 | 18.1%(-3.70)#8,873 |
| 52. | 89131 | 14.4% | 18.2%(-3.79)#52 | 18.1%(-3.64)#8,901 |
| 53. | 89442 | 14.5% | 18.2%(-3.72)#53 | 18.1%(-3.57)#8,941 |
| 54. | 89705 | 15.1% | 18.2%(-3.14)#54 | 18.1%(-2.99)#9,249 |
| 55. | 89506 | 15.5% | 18.2%(-2.72)#55 | 18.1%(-2.57)#9,496 |
| 56. | 89815 | 15.6% | 18.2%(-2.65)#56 | 18.1%(-2.50)#9,526 |
| 57. | 89147 | 15.9% | 18.2%(-2.32)#57 | 18.1%(-2.17)#9,699 |
| 58. | 89129 | 16.3% | 18.2%(-1.88)#58 | 18.1%(-1.73)#9,931 |
| 59. | 89801 | 16.4% | 18.2%(-1.79)#59 | 18.1%(-1.64)#9,992 |
| 60. | 89015 | 16.7% | 18.2%(-1.49)#60 | 18.1%(-1.34)#10,153 |
| 61. | 89445 | 17.3% | 18.2%(-0.919)#61 | 18.1%(-0.770)#10,389 |
| 62. | 89042 | 17.6% | 18.2%(-0.655)#62 | 18.1%(-0.506)#10,496 |
| 63. | 89005 | 18.3% | 18.2%(+0.102)#63 | 18.1%(+0.251)#10,865 |
| 64. | 89014 | 18.4% | 18.2%(+0.197)#64 | 18.1%(+0.346)#10,908 |
| 65. | 89316 | 18.9% | 18.2%(+0.656)#65 | 18.1%(+0.805)#11,111 |
| 66. | 89183 | 19.1% | 18.2%(+0.937)#66 | 18.1%(+1.09)#11,234 |
| 67. | 89460 | 19.2% | 18.2%(+1.00)#67 | 18.1%(+1.15)#11,270 |
| 68. | 89429 | 19.3% | 18.2%(+1.10)#68 | 18.1%(+1.25)#11,316 |
| 69. | 89107 | 20.1% | 18.2%(+1.86)#69 | 18.1%(+2.01)#11,685 |
| 70. | 89433 | 20.6% | 18.2%(+2.43)#70 | 18.1%(+2.58)#11,927 |
| 71. | 89118 | 20.8% | 18.2%(+2.57)#71 | 18.1%(+2.72)#11,984 |
| 72. | 89113 | 20.8% | 18.2%(+2.62)#72 | 18.1%(+2.77)#12,014 |
| 73. | 89142 | 21.0% | 18.2%(+2.74)#73 | 18.1%(+2.89)#12,056 |
| 74. | 89883 | 21.1% | 18.2%(+2.86)#74 | 18.1%(+3.01)#12,115 |
| 75. | 89832 | 21.7% | 18.2%(+3.53)#75 | 18.1%(+3.68)#12,379 |
| 76. | 89503 | 22.1% | 18.2%(+3.88)#76 | 18.1%(+4.03)#12,520 |
| 77. | 89122 | 22.2% | 18.2%(+4.00)#77 | 18.1%(+4.15)#12,559 |
| 78. | 89146 | 22.3% | 18.2%(+4.10)#78 | 18.1%(+4.25)#12,630 |
| 79. | 89706 | 24.5% | 18.2%(+6.28)#79 | 18.1%(+6.43)#13,491 |
| 80. | 89086 | 24.5% | 18.2%(+6.28)#80 | 18.1%(+6.43)#13,493 |
| 81. | 89502 | 24.6% | 18.2%(+6.43)#81 | 18.1%(+6.58)#13,542 |
| 82. | 89019 | 25.0% | 18.2%(+6.79)#82 | 18.1%(+6.94)#13,643 |
| 83. | 89027 | 25.3% | 18.2%(+7.12)#83 | 18.1%(+7.27)#13,801 |
| 84. | 89119 | 25.7% | 18.2%(+7.52)#84 | 18.1%(+7.67)#13,942 |
| 85. | 89121 | 26.8% | 18.2%(+8.58)#85 | 18.1%(+8.73)#14,302 |
| 86. | 89145 | 27.3% | 18.2%(+9.12)#86 | 18.1%(+9.26)#14,475 |
| 87. | 89108 | 28.1% | 18.2%(+9.89)#87 | 18.1%(+10.0)#14,724 |
| 88. | 89512 | 28.8% | 18.2%(+10.6)#88 | 18.1%(+10.7)#14,958 |
| 89. | 89104 | 30.9% | 18.2%(+12.7)#89 | 18.1%(+12.8)#15,548 |
| 90. | 89103 | 33.2% | 18.2%(+15.0)#90 | 18.1%(+15.1)#16,123 |
| 91. | 89156 | 33.8% | 18.2%(+15.5)#91 | 18.1%(+15.7)#16,314 |
| 92. | 89110 | 34.6% | 18.2%(+16.4)#92 | 18.1%(+16.5)#16,504 |
| 93. | 89049 | 36.0% | 18.2%(+17.8)#93 | 18.1%(+17.9)#16,847 |
| 94. | 89115 | 38.6% | 18.2%(+20.4)#94 | 18.1%(+20.5)#17,385 |
| 95. | 89018 | 38.9% | 18.2%(+20.7)#95 | 18.1%(+20.8)#17,441 |
| 96. | 89029 | 41.2% | 18.2%(+23.0)#96 | 18.1%(+23.1)#17,865 |
| 97. | 89030 | 41.2% | 18.2%(+23.0)#97 | 18.1%(+23.1)#17,876 |
| 98. | 89106 | 41.6% | 18.2%(+23.4)#98 | 18.1%(+23.5)#17,938 |
| 99. | 89421 | 42.1% | 18.2%(+23.9)#99 | 18.1%(+24.0)#18,033 |
| 100. | 89169 | 42.2% | 18.2%(+24.0)#100 | 18.1%(+24.1)#18,044 |
1
2Common Questions
What are the Top 10 Zip Codes with the Lowest Poverty Level Among Children Under the Age of 5 in Nevada?
Top 10 Zip Codes with the Lowest Poverty Level Among Children Under the Age of 5 in Nevada are:
What zip code has the Lowest Poverty Level Among Children Under the Age of 5 in Nevada?
89084 has the Lowest Poverty Level Among Children Under the Age of 5 in Nevada with 1.5%.
What is the Poverty Level Among Children Under the Age of 5 in the State of Nevada?
Poverty Level Among Children Under the Age of 5 in Nevada is 18.2%.
What is the Poverty Level Among Children Under the Age of 5 in the United States?
Poverty Level Among Children Under the Age of 5 in the United States is 18.1%.