Zip Codes with the Lowest Poverty Level Among Children Under the Age of 5 in New Hampshire
RELATED REPORTS & OPTIONS
Lowest Poverty | Child 0-5
New Hampshire
Compare Zip Codes
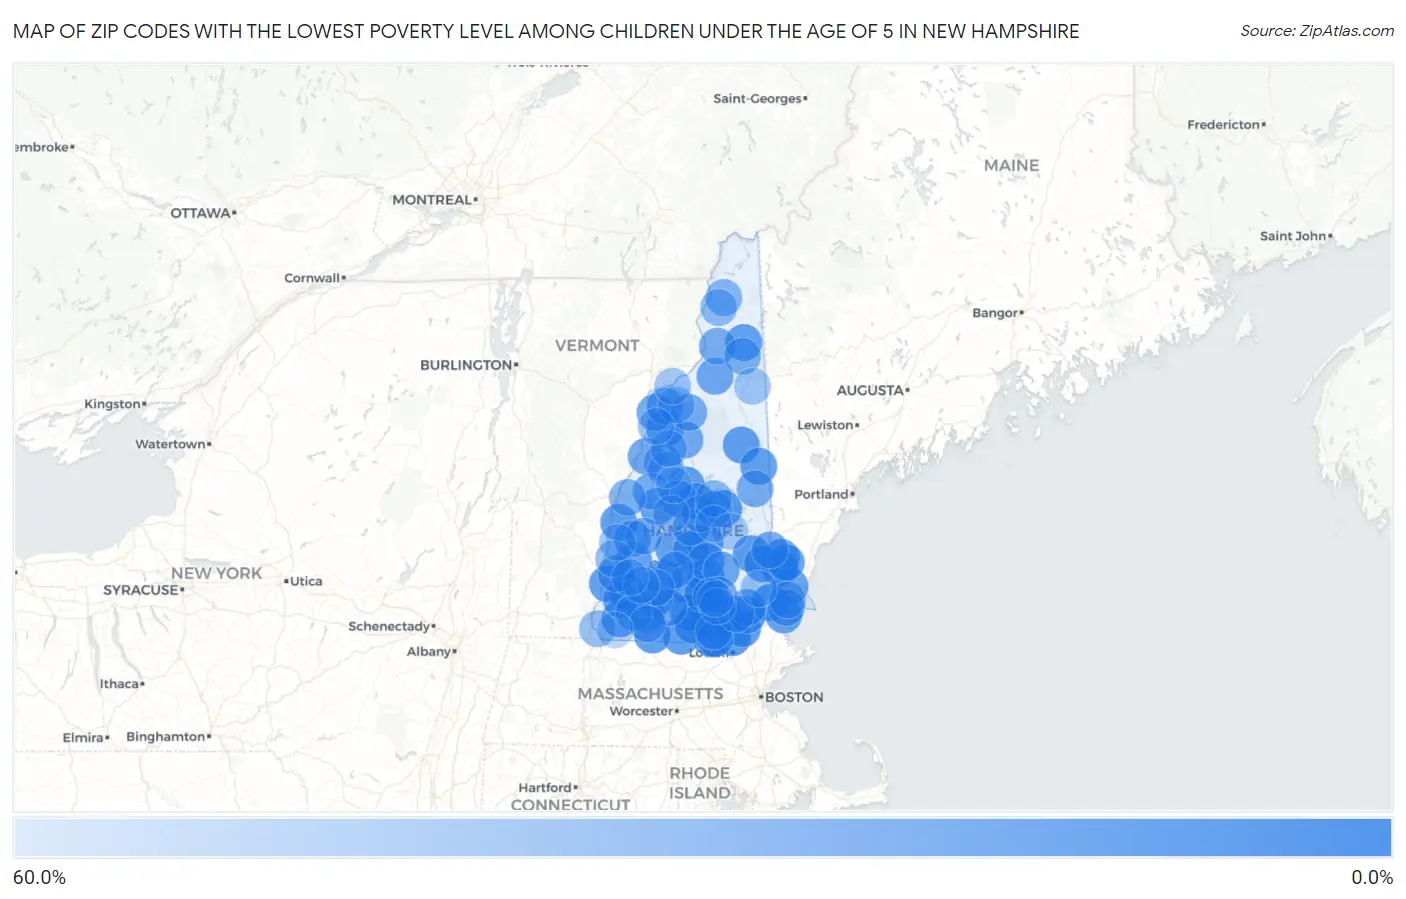
Map of Zip Codes with the Lowest Poverty Level Among Children Under the Age of 5 in New Hampshire
60.0%
0.0%
Zip Codes with the Lowest Poverty Level Among Children Under the Age of 5 in New Hampshire
| Zip Code | Child Poverty | vs State | vs National | |
| 1. | 03076 | 0.96% | 9.4%(-8.41)#1 | 18.1%(-17.1)#257 |
| 2. | 03053 | 1.0% | 9.4%(-8.37)#2 | 18.1%(-17.1)#277 |
| 3. | 03833 | 1.7% | 9.4%(-7.71)#3 | 18.1%(-16.4)#625 |
| 4. | 03884 | 1.7% | 9.4%(-7.70)#4 | 18.1%(-16.4)#630 |
| 5. | 03304 | 1.7% | 9.4%(-7.63)#5 | 18.1%(-16.3)#675 |
| 6. | 03054 | 2.0% | 9.4%(-7.37)#6 | 18.1%(-16.1)#838 |
| 7. | 03249 | 2.2% | 9.4%(-7.17)#7 | 18.1%(-15.9)#971 |
| 8. | 03878 | 2.8% | 9.4%(-6.54)#8 | 18.1%(-15.2)#1,388 |
| 9. | 03244 | 3.2% | 9.4%(-6.18)#9 | 18.1%(-14.9)#1,638 |
| 10. | 03820 | 3.3% | 9.4%(-6.03)#10 | 18.1%(-14.7)#1,733 |
| 11. | 03264 | 3.5% | 9.4%(-5.84)#11 | 18.1%(-14.5)#1,839 |
| 12. | 03048 | 3.8% | 9.4%(-5.58)#12 | 18.1%(-14.3)#2,019 |
| 13. | 03110 | 3.9% | 9.4%(-5.52)#13 | 18.1%(-14.2)#2,069 |
| 14. | 03079 | 4.0% | 9.4%(-5.37)#14 | 18.1%(-14.1)#2,183 |
| 15. | 03745 | 4.4% | 9.4%(-4.93)#15 | 18.1%(-13.6)#2,509 |
| 16. | 03031 | 4.5% | 9.4%(-4.92)#16 | 18.1%(-13.6)#2,521 |
| 17. | 03281 | 4.5% | 9.4%(-4.87)#17 | 18.1%(-13.6)#2,559 |
| 18. | 03608 | 4.7% | 9.4%(-4.67)#18 | 18.1%(-13.4)#2,696 |
| 19. | 03057 | 4.8% | 9.4%(-4.61)#19 | 18.1%(-13.3)#2,731 |
| 20. | 03818 | 4.9% | 9.4%(-4.52)#20 | 18.1%(-13.2)#2,795 |
| 21. | 03444 | 4.9% | 9.4%(-4.44)#21 | 18.1%(-13.1)#2,861 |
| 22. | 03461 | 5.0% | 9.4%(-4.37)#22 | 18.1%(-13.1)#2,898 |
| 23. | 03446 | 5.0% | 9.4%(-4.33)#23 | 18.1%(-13.0)#2,938 |
| 24. | 03062 | 5.3% | 9.4%(-4.06)#24 | 18.1%(-12.7)#3,105 |
| 25. | 03055 | 5.7% | 9.4%(-3.67)#25 | 18.1%(-12.4)#3,391 |
| 26. | 03278 | 6.7% | 9.4%(-2.71)#26 | 18.1%(-11.4)#4,035 |
| 27. | 03588 | 6.8% | 9.4%(-2.56)#27 | 18.1%(-11.2)#4,159 |
| 28. | 03836 | 7.1% | 9.4%(-2.23)#28 | 18.1%(-10.9)#4,372 |
| 29. | 03224 | 7.3% | 9.4%(-2.03)#29 | 18.1%(-10.7)#4,503 |
| 30. | 03874 | 7.4% | 9.4%(-2.01)#30 | 18.1%(-10.7)#4,518 |
| 31. | 03045 | 8.0% | 9.4%(-1.41)#31 | 18.1%(-10.1)#4,888 |
| 32. | 03605 | 8.5% | 9.4%(-0.924)#32 | 18.1%(-9.61)#5,225 |
| 33. | 03448 | 8.5% | 9.4%(-0.900)#33 | 18.1%(-9.59)#5,243 |
| 34. | 03240 | 8.8% | 9.4%(-0.602)#34 | 18.1%(-9.29)#5,448 |
| 35. | 03825 | 9.2% | 9.4%(-0.174)#35 | 18.1%(-8.86)#5,751 |
| 36. | 03801 | 9.3% | 9.4%(-0.037)#36 | 18.1%(-8.73)#5,841 |
| 37. | 03869 | 9.4% | 9.4%(-0.022)#37 | 18.1%(-8.71)#5,852 |
| 38. | 03785 | 9.7% | 9.4%(+0.303)#38 | 18.1%(-8.39)#6,064 |
| 39. | 03841 | 9.7% | 9.4%(+0.348)#39 | 18.1%(-8.34)#6,088 |
| 40. | 03303 | 10.0% | 9.4%(+0.586)#40 | 18.1%(-8.10)#6,226 |
| 41. | 03256 | 10.4% | 9.4%(+1.07)#41 | 18.1%(-7.62)#6,520 |
| 42. | 03222 | 10.9% | 9.4%(+1.53)#42 | 18.1%(-7.15)#6,779 |
| 43. | 03431 | 10.9% | 9.4%(+1.55)#43 | 18.1%(-7.14)#6,789 |
| 44. | 03842 | 11.0% | 9.4%(+1.61)#44 | 18.1%(-7.08)#6,828 |
| 45. | 03602 | 11.1% | 9.4%(+1.74)#45 | 18.1%(-6.95)#6,897 |
| 46. | 03235 | 11.4% | 9.4%(+1.99)#46 | 18.1%(-6.70)#7,068 |
| 47. | 03301 | 11.8% | 9.4%(+2.45)#47 | 18.1%(-6.24)#7,346 |
| 48. | 03773 | 12.6% | 9.4%(+3.18)#48 | 18.1%(-5.51)#7,801 |
| 49. | 03275 | 12.8% | 9.4%(+3.38)#49 | 18.1%(-5.30)#7,896 |
| 50. | 03873 | 12.9% | 9.4%(+3.50)#50 | 18.1%(-5.19)#7,965 |
| 51. | 03583 | 12.9% | 9.4%(+3.53)#51 | 18.1%(-5.16)#7,988 |
| 52. | 03282 | 13.4% | 9.4%(+4.07)#52 | 18.1%(-4.62)#8,314 |
| 53. | 03867 | 13.6% | 9.4%(+4.20)#53 | 18.1%(-4.49)#8,387 |
| 54. | 03060 | 13.6% | 9.4%(+4.20)#54 | 18.1%(-4.49)#8,388 |
| 55. | 03777 | 13.7% | 9.4%(+4.35)#55 | 18.1%(-4.34)#8,470 |
| 56. | 03740 | 13.8% | 9.4%(+4.42)#56 | 18.1%(-4.27)#8,506 |
| 57. | 03064 | 14.3% | 9.4%(+4.91)#57 | 18.1%(-3.78)#8,780 |
| 58. | 03449 | 14.3% | 9.4%(+4.91)#58 | 18.1%(-3.78)#8,805 |
| 59. | 03242 | 14.6% | 9.4%(+5.18)#59 | 18.1%(-3.51)#8,968 |
| 60. | 03047 | 15.4% | 9.4%(+6.01)#60 | 18.1%(-2.68)#9,428 |
| 61. | 03262 | 15.4% | 9.4%(+6.01)#61 | 18.1%(-2.68)#9,434 |
| 62. | 03782 | 15.7% | 9.4%(+6.34)#62 | 18.1%(-2.35)#9,602 |
| 63. | 03741 | 15.8% | 9.4%(+6.42)#63 | 18.1%(-2.27)#9,636 |
| 64. | 03104 | 16.3% | 9.4%(+6.97)#64 | 18.1%(-1.72)#9,942 |
| 65. | 03585 | 17.4% | 9.4%(+8.02)#65 | 18.1%(-0.671)#10,430 |
| 66. | 03580 | 17.9% | 9.4%(+8.48)#66 | 18.1%(-0.206)#10,645 |
| 67. | 03038 | 18.3% | 9.4%(+8.89)#67 | 18.1%(+0.197)#10,849 |
| 68. | 03864 | 18.6% | 9.4%(+9.20)#68 | 18.1%(+0.509)#10,978 |
| 69. | 03455 | 19.4% | 9.4%(+9.98)#69 | 18.1%(+1.29)#11,339 |
| 70. | 03452 | 19.7% | 9.4%(+10.3)#70 | 18.1%(+1.66)#11,500 |
| 71. | 03582 | 19.8% | 9.4%(+10.5)#71 | 18.1%(+1.76)#11,549 |
| 72. | 03440 | 21.2% | 9.4%(+11.8)#72 | 18.1%(+3.12)#12,140 |
| 73. | 03269 | 21.4% | 9.4%(+12.1)#73 | 18.1%(+3.37)#12,243 |
| 74. | 03570 | 21.5% | 9.4%(+12.1)#74 | 18.1%(+3.43)#12,282 |
| 75. | 03766 | 22.3% | 9.4%(+12.9)#75 | 18.1%(+4.20)#12,609 |
| 76. | 03102 | 23.1% | 9.4%(+13.7)#76 | 18.1%(+5.00)#12,924 |
| 77. | 03230 | 24.3% | 9.4%(+14.9)#77 | 18.1%(+6.22)#13,421 |
| 78. | 03464 | 25.0% | 9.4%(+15.6)#78 | 18.1%(+6.94)#13,666 |
| 79. | 03576 | 25.3% | 9.4%(+15.9)#79 | 18.1%(+7.24)#13,793 |
| 80. | 03103 | 26.3% | 9.4%(+16.9)#80 | 18.1%(+8.25)#14,125 |
| 81. | 03246 | 26.9% | 9.4%(+17.5)#81 | 18.1%(+8.83)#14,332 |
| 82. | 03253 | 28.7% | 9.4%(+19.3)#82 | 18.1%(+10.7)#14,946 |
| 83. | 03603 | 29.4% | 9.4%(+20.0)#83 | 18.1%(+11.3)#15,132 |
| 84. | 03597 | 29.4% | 9.4%(+20.0)#84 | 18.1%(+11.3)#15,147 |
| 85. | 03266 | 30.1% | 9.4%(+20.8)#85 | 18.1%(+12.1)#15,362 |
| 86. | 03451 | 31.0% | 9.4%(+21.6)#86 | 18.1%(+12.9)#15,564 |
| 87. | 03279 | 31.2% | 9.4%(+21.9)#87 | 18.1%(+13.2)#15,656 |
| 88. | 03586 | 33.3% | 9.4%(+24.0)#88 | 18.1%(+15.3)#16,200 |
| 89. | 03774 | 34.8% | 9.4%(+25.5)#89 | 18.1%(+16.8)#16,569 |
| 90. | 03862 | 35.4% | 9.4%(+26.0)#90 | 18.1%(+17.4)#16,696 |
| 91. | 03456 | 35.7% | 9.4%(+26.3)#91 | 18.1%(+17.7)#16,781 |
| 92. | 03561 | 36.1% | 9.4%(+26.8)#92 | 18.1%(+18.1)#16,878 |
| 93. | 03743 | 36.3% | 9.4%(+26.9)#93 | 18.1%(+18.2)#16,918 |
| 94. | 03042 | 38.2% | 9.4%(+28.8)#94 | 18.1%(+20.2)#17,305 |
| 95. | 03581 | 40.0% | 9.4%(+30.6)#95 | 18.1%(+21.9)#17,633 |
| 96. | 03837 | 41.6% | 9.4%(+32.2)#96 | 18.1%(+23.5)#17,942 |
| 97. | 03220 | 46.4% | 9.4%(+37.1)#97 | 18.1%(+28.4)#18,688 |
| 98. | 03101 | 48.5% | 9.4%(+39.1)#98 | 18.1%(+30.4)#18,913 |
| 99. | 03470 | 51.7% | 9.4%(+42.3)#99 | 18.1%(+33.7)#19,306 |
| 100. | 03241 | 59.4% | 9.4%(+50.0)#100 | 18.1%(+41.3)#19,936 |
Common Questions
What are the Top 10 Zip Codes with the Lowest Poverty Level Among Children Under the Age of 5 in New Hampshire?
Top 10 Zip Codes with the Lowest Poverty Level Among Children Under the Age of 5 in New Hampshire are:
What zip code has the Lowest Poverty Level Among Children Under the Age of 5 in New Hampshire?
03076 has the Lowest Poverty Level Among Children Under the Age of 5 in New Hampshire with 0.96%.
What is the Poverty Level Among Children Under the Age of 5 in the State of New Hampshire?
Poverty Level Among Children Under the Age of 5 in New Hampshire is 9.4%.
What is the Poverty Level Among Children Under the Age of 5 in the United States?
Poverty Level Among Children Under the Age of 5 in the United States is 18.1%.