Zip Codes with the Lowest Poverty Level Among Children Under the Age of 5 in Wisconsin
RELATED REPORTS & OPTIONS
Lowest Poverty | Child 0-5
Wisconsin
Compare Zip Codes
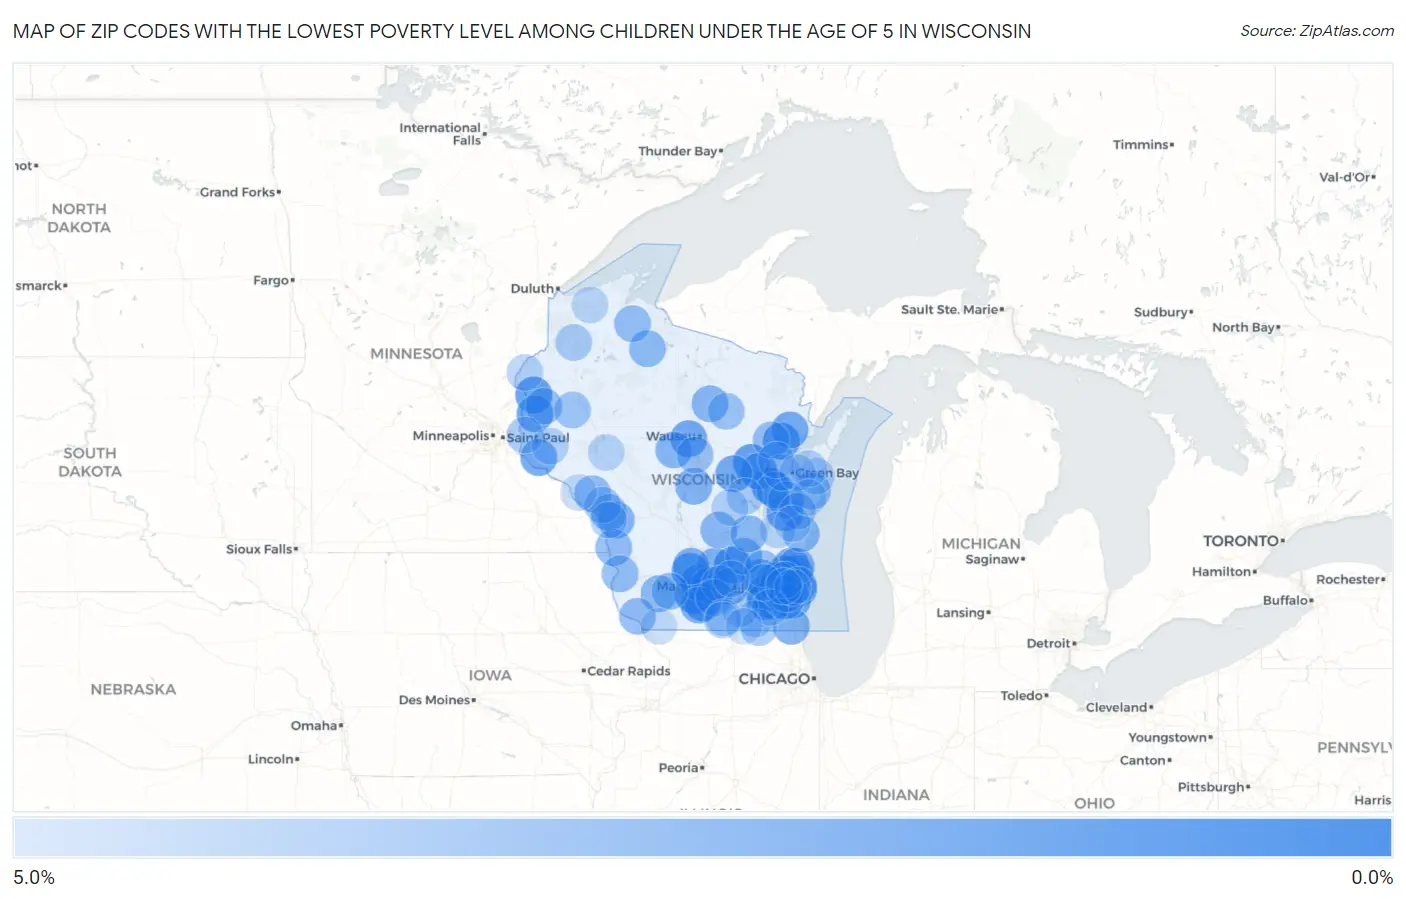
Map of Zip Codes with the Lowest Poverty Level Among Children Under the Age of 5 in Wisconsin
5.0%
0.0%
Zip Codes with the Lowest Poverty Level Among Children Under the Age of 5 in Wisconsin
| Zip Code | Child Poverty | vs State | vs National | |
| 1. | 53572 | 0.17% | 14.9%(-14.7)#1 | 18.1%(-17.9)#6 |
| 2. | 53925 | 0.48% | 14.9%(-14.4)#2 | 18.1%(-17.6)#56 |
| 3. | 54154 | 0.52% | 14.9%(-14.4)#3 | 18.1%(-17.5)#66 |
| 4. | 54913 | 0.54% | 14.9%(-14.3)#4 | 18.1%(-17.5)#72 |
| 5. | 53508 | 0.74% | 14.9%(-14.1)#5 | 18.1%(-17.3)#147 |
| 6. | 54929 | 0.81% | 14.9%(-14.1)#6 | 18.1%(-17.3)#177 |
| 7. | 54824 | 0.81% | 14.9%(-14.1)#7 | 18.1%(-17.2)#183 |
| 8. | 53202 | 0.87% | 14.9%(-14.0)#8 | 18.1%(-17.2)#213 |
| 9. | 53583 | 0.92% | 14.9%(-14.0)#9 | 18.1%(-17.1)#236 |
| 10. | 54170 | 1.1% | 14.9%(-13.7)#10 | 18.1%(-16.9)#350 |
| 11. | 53149 | 1.2% | 14.9%(-13.7)#11 | 18.1%(-16.9)#371 |
| 12. | 53014 | 1.3% | 14.9%(-13.6)#12 | 18.1%(-16.8)#404 |
| 13. | 54026 | 1.3% | 14.9%(-13.6)#13 | 18.1%(-16.8)#408 |
| 14. | 54448 | 1.3% | 14.9%(-13.6)#14 | 18.1%(-16.8)#415 |
| 15. | 54112 | 1.4% | 14.9%(-13.5)#15 | 18.1%(-16.7)#458 |
| 16. | 53092 | 1.4% | 14.9%(-13.5)#16 | 18.1%(-16.7)#464 |
| 17. | 54962 | 1.4% | 14.9%(-13.5)#17 | 18.1%(-16.7)#469 |
| 18. | 54011 | 1.4% | 14.9%(-13.4)#18 | 18.1%(-16.6)#498 |
| 19. | 53022 | 1.5% | 14.9%(-13.4)#19 | 18.1%(-16.6)#506 |
| 20. | 53036 | 1.5% | 14.9%(-13.4)#20 | 18.1%(-16.6)#507 |
| 21. | 53528 | 1.5% | 14.9%(-13.4)#21 | 18.1%(-16.6)#532 |
| 22. | 53012 | 1.6% | 14.9%(-13.3)#22 | 18.1%(-16.5)#568 |
| 23. | 53132 | 1.6% | 14.9%(-13.2)#23 | 18.1%(-16.4)#610 |
| 24. | 53029 | 1.7% | 14.9%(-13.2)#24 | 18.1%(-16.4)#647 |
| 25. | 53118 | 1.7% | 14.9%(-13.1)#25 | 18.1%(-16.3)#673 |
| 26. | 53911 | 1.8% | 14.9%(-13.1)#26 | 18.1%(-16.3)#683 |
| 27. | 54140 | 1.8% | 14.9%(-13.1)#27 | 18.1%(-16.3)#706 |
| 28. | 53705 | 1.8% | 14.9%(-13.0)#28 | 18.1%(-16.2)#727 |
| 29. | 53104 | 1.8% | 14.9%(-13.0)#29 | 18.1%(-16.2)#733 |
| 30. | 53119 | 2.0% | 14.9%(-12.9)#30 | 18.1%(-16.1)#795 |
| 31. | 53574 | 2.0% | 14.9%(-12.9)#31 | 18.1%(-16.1)#801 |
| 32. | 53228 | 2.0% | 14.9%(-12.9)#32 | 18.1%(-16.0)#844 |
| 33. | 54494 | 2.0% | 14.9%(-12.9)#33 | 18.1%(-16.0)#848 |
| 34. | 53578 | 2.1% | 14.9%(-12.8)#34 | 18.1%(-16.0)#880 |
| 35. | 54669 | 2.1% | 14.9%(-12.8)#35 | 18.1%(-16.0)#906 |
| 36. | 53024 | 2.1% | 14.9%(-12.8)#36 | 18.1%(-15.9)#916 |
| 37. | 53531 | 2.1% | 14.9%(-12.7)#37 | 18.1%(-15.9)#928 |
| 38. | 53089 | 2.3% | 14.9%(-12.6)#38 | 18.1%(-15.8)#1,012 |
| 39. | 53949 | 2.3% | 14.9%(-12.6)#39 | 18.1%(-15.8)#1,024 |
| 40. | 54435 | 2.3% | 14.9%(-12.6)#40 | 18.1%(-15.8)#1,035 |
| 41. | 54484 | 2.4% | 14.9%(-12.5)#41 | 18.1%(-15.7)#1,069 |
| 42. | 53916 | 2.4% | 14.9%(-12.5)#42 | 18.1%(-15.7)#1,077 |
| 43. | 53919 | 2.4% | 14.9%(-12.5)#43 | 18.1%(-15.7)#1,080 |
| 44. | 53526 | 2.4% | 14.9%(-12.5)#44 | 18.1%(-15.7)#1,085 |
| 45. | 53085 | 2.4% | 14.9%(-12.5)#45 | 18.1%(-15.6)#1,113 |
| 46. | 54514 | 2.5% | 14.9%(-12.4)#46 | 18.1%(-15.6)#1,149 |
| 47. | 54228 | 2.5% | 14.9%(-12.4)#47 | 18.1%(-15.6)#1,172 |
| 48. | 54110 | 2.6% | 14.9%(-12.2)#48 | 18.1%(-15.4)#1,254 |
| 49. | 53072 | 2.7% | 14.9%(-12.2)#49 | 18.1%(-15.4)#1,271 |
| 50. | 54612 | 2.7% | 14.9%(-12.2)#50 | 18.1%(-15.4)#1,272 |
| 51. | 54632 | 2.7% | 14.9%(-12.2)#51 | 18.1%(-15.4)#1,302 |
| 52. | 53820 | 2.7% | 14.9%(-12.1)#52 | 18.1%(-15.3)#1,319 |
| 53. | 53150 | 2.7% | 14.9%(-12.1)#53 | 18.1%(-15.3)#1,325 |
| 54. | 53533 | 2.8% | 14.9%(-12.1)#54 | 18.1%(-15.3)#1,368 |
| 55. | 54855 | 2.8% | 14.9%(-12.1)#55 | 18.1%(-15.3)#1,371 |
| 56. | 54626 | 2.8% | 14.9%(-12.1)#56 | 18.1%(-15.2)#1,379 |
| 57. | 54636 | 2.8% | 14.9%(-12.1)#57 | 18.1%(-15.2)#1,381 |
| 58. | 53151 | 2.9% | 14.9%(-12.0)#58 | 18.1%(-15.2)#1,403 |
| 59. | 54001 | 2.9% | 14.9%(-12.0)#59 | 18.1%(-15.2)#1,419 |
| 60. | 54124 | 2.9% | 14.9%(-12.0)#60 | 18.1%(-15.2)#1,439 |
| 61. | 54455 | 3.0% | 14.9%(-11.8)#61 | 18.1%(-15.0)#1,538 |
| 62. | 54245 | 3.1% | 14.9%(-11.8)#62 | 18.1%(-15.0)#1,558 |
| 63. | 53059 | 3.2% | 14.9%(-11.7)#63 | 18.1%(-14.9)#1,626 |
| 64. | 54424 | 3.2% | 14.9%(-11.7)#64 | 18.1%(-14.8)#1,657 |
| 65. | 54733 | 3.3% | 14.9%(-11.6)#65 | 18.1%(-14.8)#1,686 |
| 66. | 54630 | 3.4% | 14.9%(-11.5)#66 | 18.1%(-14.7)#1,759 |
| 67. | 53718 | 3.4% | 14.9%(-11.5)#67 | 18.1%(-14.7)#1,763 |
| 68. | 53575 | 3.4% | 14.9%(-11.5)#68 | 18.1%(-14.6)#1,783 |
| 69. | 54016 | 3.5% | 14.9%(-11.4)#69 | 18.1%(-14.6)#1,803 |
| 70. | 53051 | 3.5% | 14.9%(-11.3)#70 | 18.1%(-14.5)#1,850 |
| 71. | 53066 | 3.6% | 14.9%(-11.3)#71 | 18.1%(-14.5)#1,857 |
| 72. | 53115 | 3.7% | 14.9%(-11.2)#72 | 18.1%(-14.4)#1,921 |
| 73. | 53184 | 3.7% | 14.9%(-11.2)#73 | 18.1%(-14.4)#1,923 |
| 74. | 54859 | 3.8% | 14.9%(-11.1)#74 | 18.1%(-14.3)#2,005 |
| 75. | 54155 | 3.8% | 14.9%(-11.1)#75 | 18.1%(-14.3)#2,009 |
| 76. | 54940 | 3.8% | 14.9%(-11.1)#76 | 18.1%(-14.3)#2,011 |
| 77. | 53563 | 3.9% | 14.9%(-11.0)#77 | 18.1%(-14.2)#2,088 |
| 78. | 53211 | 3.9% | 14.9%(-11.0)#78 | 18.1%(-14.2)#2,095 |
| 79. | 54216 | 3.9% | 14.9%(-11.0)#79 | 18.1%(-14.1)#2,105 |
| 80. | 53537 | 3.9% | 14.9%(-10.9)#80 | 18.1%(-14.1)#2,130 |
| 81. | 54650 | 4.0% | 14.9%(-10.9)#81 | 18.1%(-14.1)#2,135 |
| 82. | 53559 | 4.0% | 14.9%(-10.9)#82 | 18.1%(-14.1)#2,166 |
| 83. | 54970 | 4.0% | 14.9%(-10.9)#83 | 18.1%(-14.1)#2,168 |
| 84. | 54217 | 4.1% | 14.9%(-10.8)#84 | 18.1%(-14.0)#2,215 |
| 85. | 54767 | 4.1% | 14.9%(-10.7)#85 | 18.1%(-13.9)#2,282 |
| 86. | 53576 | 4.1% | 14.9%(-10.7)#86 | 18.1%(-13.9)#2,283 |
| 87. | 54162 | 4.2% | 14.9%(-10.7)#87 | 18.1%(-13.9)#2,331 |
| 88. | 54840 | 4.2% | 14.9%(-10.6)#88 | 18.1%(-13.8)#2,370 |
| 89. | 54742 | 4.3% | 14.9%(-10.6)#89 | 18.1%(-13.8)#2,415 |
| 90. | 54820 | 4.3% | 14.9%(-10.5)#90 | 18.1%(-13.7)#2,447 |
| 91. | 53057 | 4.5% | 14.9%(-10.4)#91 | 18.1%(-13.6)#2,527 |
| 92. | 53020 | 4.5% | 14.9%(-10.4)#92 | 18.1%(-13.6)#2,545 |
| 93. | 54311 | 4.5% | 14.9%(-10.4)#93 | 18.1%(-13.6)#2,553 |
| 94. | 54622 | 4.5% | 14.9%(-10.3)#94 | 18.1%(-13.5)#2,590 |
| 95. | 53120 | 4.7% | 14.9%(-10.2)#95 | 18.1%(-13.4)#2,678 |
| 96. | 53803 | 4.7% | 14.9%(-10.2)#96 | 18.1%(-13.4)#2,688 |
| 97. | 54214 | 4.8% | 14.9%(-10.1)#97 | 18.1%(-13.3)#2,742 |
| 98. | 53213 | 4.8% | 14.9%(-10.1)#98 | 18.1%(-13.3)#2,755 |
| 99. | 53525 | 4.8% | 14.9%(-10.1)#99 | 18.1%(-13.2)#2,774 |
| 100. | 53045 | 4.9% | 14.9%(-10.0)#100 | 18.1%(-13.2)#2,798 |
Common Questions
What are the Top 10 Zip Codes with the Lowest Poverty Level Among Children Under the Age of 5 in Wisconsin?
Top 10 Zip Codes with the Lowest Poverty Level Among Children Under the Age of 5 in Wisconsin are:
What zip code has the Lowest Poverty Level Among Children Under the Age of 5 in Wisconsin?
53572 has the Lowest Poverty Level Among Children Under the Age of 5 in Wisconsin with 0.17%.
What is the Poverty Level Among Children Under the Age of 5 in the State of Wisconsin?
Poverty Level Among Children Under the Age of 5 in Wisconsin is 14.9%.
What is the Poverty Level Among Children Under the Age of 5 in the United States?
Poverty Level Among Children Under the Age of 5 in the United States is 18.1%.