Zip Codes with the Lowest Poverty Level Among Children Under the Age of 5 in Maine
RELATED REPORTS & OPTIONS
Lowest Poverty | Child 0-5
Maine
Compare Zip Codes
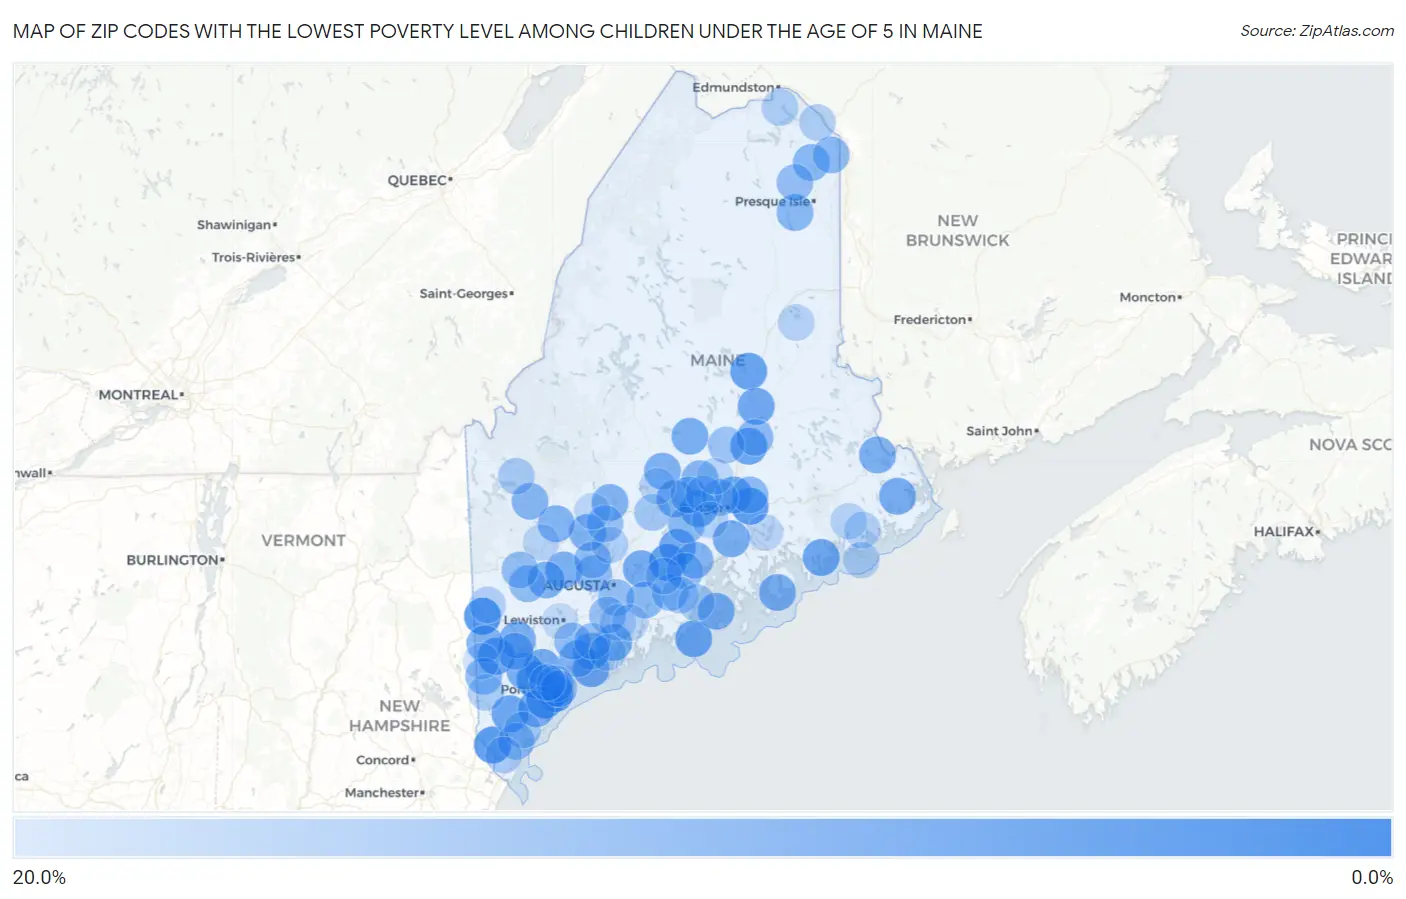
Map of Zip Codes with the Lowest Poverty Level Among Children Under the Age of 5 in Maine
20.0%
0.0%
Zip Codes with the Lowest Poverty Level Among Children Under the Age of 5 in Maine
| Zip Code | Child Poverty | vs State | vs National | |
| 1. | 04074 | 0.57% | 14.4%(-13.8)#1 | 18.1%(-17.5)#83 |
| 2. | 04037 | 1.0% | 14.4%(-13.3)#2 | 18.1%(-17.0)#296 |
| 3. | 03901 | 1.6% | 14.4%(-12.7)#3 | 18.1%(-16.5)#600 |
| 4. | 04038 | 1.8% | 14.4%(-12.5)#4 | 18.1%(-16.2)#722 |
| 5. | 04428 | 1.9% | 14.4%(-12.4)#5 | 18.1%(-16.1)#776 |
| 6. | 04106 | 2.3% | 14.4%(-12.1)#6 | 18.1%(-15.8)#1,021 |
| 7. | 04941 | 2.4% | 14.4%(-11.9)#7 | 18.1%(-15.7)#1,103 |
| 8. | 04041 | 3.0% | 14.4%(-11.4)#8 | 18.1%(-15.1)#1,498 |
| 9. | 04854 | 3.6% | 14.4%(-10.7)#9 | 18.1%(-14.4)#1,910 |
| 10. | 04430 | 3.7% | 14.4%(-10.6)#10 | 18.1%(-14.4)#1,959 |
| 11. | 04002 | 4.0% | 14.4%(-10.4)#11 | 18.1%(-14.1)#2,134 |
| 12. | 04680 | 4.2% | 14.4%(-10.2)#12 | 18.1%(-13.9)#2,340 |
| 13. | 04475 | 4.3% | 14.4%(-10.0)#13 | 18.1%(-13.7)#2,451 |
| 14. | 04079 | 4.5% | 14.4%(-9.88)#14 | 18.1%(-13.6)#2,537 |
| 15. | 04473 | 4.5% | 14.4%(-9.81)#15 | 18.1%(-13.5)#2,584 |
| 16. | 04986 | 4.5% | 14.4%(-9.81)#16 | 18.1%(-13.5)#2,587 |
| 17. | 04457 | 4.6% | 14.4%(-9.79)#17 | 18.1%(-13.5)#2,607 |
| 18. | 04419 | 5.0% | 14.4%(-9.39)#18 | 18.1%(-13.1)#2,871 |
| 19. | 04102 | 5.3% | 14.4%(-9.08)#19 | 18.1%(-12.8)#3,086 |
| 20. | 04358 | 5.3% | 14.4%(-9.04)#20 | 18.1%(-12.8)#3,102 |
| 21. | 04062 | 5.4% | 14.4%(-8.93)#21 | 18.1%(-12.6)#3,187 |
| 22. | 04416 | 5.5% | 14.4%(-8.81)#22 | 18.1%(-12.5)#3,269 |
| 23. | 04072 | 5.6% | 14.4%(-8.78)#23 | 18.1%(-12.5)#3,307 |
| 24. | 04628 | 5.7% | 14.4%(-8.64)#24 | 18.1%(-12.3)#3,411 |
| 25. | 04853 | 5.9% | 14.4%(-8.47)#25 | 18.1%(-12.2)#3,520 |
| 26. | 04953 | 6.1% | 14.4%(-8.27)#26 | 18.1%(-12.0)#3,650 |
| 27. | 04679 | 6.2% | 14.4%(-8.20)#27 | 18.1%(-11.9)#3,703 |
| 28. | 04084 | 6.2% | 14.4%(-8.14)#28 | 18.1%(-11.9)#3,740 |
| 29. | 04253 | 6.3% | 14.4%(-8.05)#29 | 18.1%(-11.8)#3,824 |
| 30. | 04579 | 6.3% | 14.4%(-8.00)#30 | 18.1%(-11.7)#3,840 |
| 31. | 04481 | 6.4% | 14.4%(-7.97)#31 | 18.1%(-11.7)#3,868 |
| 32. | 04055 | 6.4% | 14.4%(-7.92)#32 | 18.1%(-11.6)#3,896 |
| 33. | 04694 | 6.7% | 14.4%(-7.69)#33 | 18.1%(-11.4)#4,036 |
| 34. | 04220 | 6.8% | 14.4%(-7.60)#34 | 18.1%(-11.3)#4,113 |
| 35. | 04011 | 6.8% | 14.4%(-7.58)#35 | 18.1%(-11.3)#4,123 |
| 36. | 04930 | 7.0% | 14.4%(-7.34)#36 | 18.1%(-11.1)#4,294 |
| 37. | 04955 | 7.2% | 14.4%(-7.12)#37 | 18.1%(-10.8)#4,437 |
| 38. | 04032 | 7.4% | 14.4%(-6.94)#38 | 18.1%(-10.6)#4,555 |
| 39. | 04029 | 7.5% | 14.4%(-6.81)#39 | 18.1%(-10.5)#4,631 |
| 40. | 04010 | 7.8% | 14.4%(-6.53)#40 | 18.1%(-10.2)#4,807 |
| 41. | 04950 | 7.9% | 14.4%(-6.46)#41 | 18.1%(-10.2)#4,839 |
| 42. | 04984 | 7.9% | 14.4%(-6.46)#42 | 18.1%(-10.2)#4,847 |
| 43. | 04427 | 8.2% | 14.4%(-6.19)#43 | 18.1%(-9.90)#5,013 |
| 44. | 04915 | 8.2% | 14.4%(-6.13)#44 | 18.1%(-9.84)#5,055 |
| 45. | 04966 | 8.5% | 14.4%(-5.86)#45 | 18.1%(-9.57)#5,251 |
| 46. | 04348 | 8.8% | 14.4%(-5.60)#46 | 18.1%(-9.31)#5,442 |
| 47. | 04932 | 8.8% | 14.4%(-5.53)#47 | 18.1%(-9.24)#5,492 |
| 48. | 04757 | 8.8% | 14.4%(-5.51)#48 | 18.1%(-9.22)#5,509 |
| 49. | 04736 | 8.9% | 14.4%(-5.42)#49 | 18.1%(-9.13)#5,553 |
| 50. | 04488 | 9.1% | 14.4%(-5.26)#50 | 18.1%(-8.97)#5,670 |
| 51. | 04750 | 9.2% | 14.4%(-5.19)#51 | 18.1%(-8.90)#5,730 |
| 52. | 04047 | 9.2% | 14.4%(-5.17)#52 | 18.1%(-8.88)#5,740 |
| 53. | 04411 | 9.2% | 14.4%(-5.12)#53 | 18.1%(-8.83)#5,767 |
| 54. | 04493 | 9.3% | 14.4%(-5.05)#54 | 18.1%(-8.76)#5,818 |
| 55. | 04355 | 9.4% | 14.4%(-4.90)#55 | 18.1%(-8.61)#5,910 |
| 56. | 04222 | 9.9% | 14.4%(-4.49)#56 | 18.1%(-8.20)#6,166 |
| 57. | 04289 | 10.0% | 14.4%(-4.35)#57 | 18.1%(-8.06)#6,244 |
| 58. | 04352 | 10.0% | 14.4%(-4.35)#58 | 18.1%(-8.06)#6,248 |
| 59. | 04090 | 10.1% | 14.4%(-4.28)#59 | 18.1%(-7.99)#6,310 |
| 60. | 04219 | 10.2% | 14.4%(-4.15)#60 | 18.1%(-7.86)#6,383 |
| 61. | 04862 | 10.3% | 14.4%(-4.07)#61 | 18.1%(-7.78)#6,436 |
| 62. | 04346 | 10.3% | 14.4%(-4.01)#62 | 18.1%(-7.72)#6,466 |
| 63. | 04786 | 10.5% | 14.4%(-3.83)#63 | 18.1%(-7.54)#6,567 |
| 64. | 04952 | 10.7% | 14.4%(-3.69)#64 | 18.1%(-7.40)#6,657 |
| 65. | 04957 | 10.9% | 14.4%(-3.46)#65 | 18.1%(-7.17)#6,772 |
| 66. | 04103 | 11.0% | 14.4%(-3.37)#66 | 18.1%(-7.08)#6,825 |
| 67. | 04357 | 11.3% | 14.4%(-3.05)#67 | 18.1%(-6.76)#7,033 |
| 68. | 04101 | 11.3% | 14.4%(-3.03)#68 | 18.1%(-6.74)#7,051 |
| 69. | 04401 | 11.5% | 14.4%(-2.88)#69 | 18.1%(-6.59)#7,132 |
| 70. | 04086 | 11.6% | 14.4%(-2.77)#70 | 18.1%(-6.48)#7,188 |
| 71. | 04453 | 11.8% | 14.4%(-2.59)#71 | 18.1%(-6.30)#7,315 |
| 72. | 04967 | 12.9% | 14.4%(-1.50)#72 | 18.1%(-5.21)#7,953 |
| 73. | 04043 | 13.0% | 14.4%(-1.33)#73 | 18.1%(-5.04)#8,054 |
| 74. | 04847 | 13.2% | 14.4%(-1.17)#74 | 18.1%(-4.88)#8,146 |
| 75. | 04843 | 13.5% | 14.4%(-0.856)#75 | 18.1%(-4.57)#8,346 |
| 76. | 03908 | 13.8% | 14.4%(-0.570)#76 | 18.1%(-4.28)#8,494 |
| 77. | 04970 | 13.8% | 14.4%(-0.560)#77 | 18.1%(-4.27)#8,504 |
| 78. | 04949 | 14.0% | 14.4%(-0.318)#78 | 18.1%(-4.03)#8,658 |
| 79. | 04456 | 14.3% | 14.4%(-0.068)#79 | 18.1%(-3.78)#8,794 |
| 80. | 04095 | 14.3% | 14.4%(-0.068)#80 | 18.1%(-3.78)#8,809 |
| 81. | 04772 | 14.6% | 14.4%(+0.230)#81 | 18.1%(-3.48)#8,986 |
| 82. | 04785 | 14.6% | 14.4%(+0.253)#82 | 18.1%(-3.46)#8,995 |
| 83. | 04963 | 15.0% | 14.4%(+0.618)#83 | 18.1%(-3.09)#9,193 |
| 84. | 04648 | 15.2% | 14.4%(+0.798)#84 | 18.1%(-2.91)#9,298 |
| 85. | 04051 | 15.4% | 14.4%(+1.03)#85 | 18.1%(-2.68)#9,431 |
| 86. | 04611 | 15.4% | 14.4%(+1.03)#86 | 18.1%(-2.68)#9,446 |
| 87. | 04444 | 15.5% | 14.4%(+1.12)#87 | 18.1%(-2.59)#9,489 |
| 88. | 04530 | 15.6% | 14.4%(+1.29)#88 | 18.1%(-2.41)#9,571 |
| 89. | 04747 | 15.8% | 14.4%(+1.44)#89 | 18.1%(-2.27)#9,644 |
| 90. | 04971 | 15.9% | 14.4%(+1.51)#90 | 18.1%(-2.20)#9,687 |
| 91. | 04342 | 16.0% | 14.4%(+1.70)#91 | 18.1%(-2.01)#9,781 |
| 92. | 04623 | 16.1% | 14.4%(+1.72)#92 | 18.1%(-1.99)#9,799 |
| 93. | 04224 | 16.3% | 14.4%(+1.99)#93 | 18.1%(-1.72)#9,945 |
| 94. | 04605 | 16.6% | 14.4%(+2.20)#94 | 18.1%(-1.51)#10,059 |
| 95. | 04535 | 16.7% | 14.4%(+2.31)#95 | 18.1%(-1.40)#10,121 |
| 96. | 04092 | 16.8% | 14.4%(+2.44)#96 | 18.1%(-1.27)#10,172 |
| 97. | 04911 | 17.0% | 14.4%(+2.61)#97 | 18.1%(-1.10)#10,234 |
| 98. | 04449 | 17.1% | 14.4%(+2.72)#98 | 18.1%(-0.990)#10,279 |
| 99. | 04068 | 17.2% | 14.4%(+2.89)#99 | 18.1%(-0.821)#10,359 |
| 100. | 04210 | 17.7% | 14.4%(+3.30)#100 | 18.1%(-0.410)#10,549 |
Common Questions
What are the Top 10 Zip Codes with the Lowest Poverty Level Among Children Under the Age of 5 in Maine?
Top 10 Zip Codes with the Lowest Poverty Level Among Children Under the Age of 5 in Maine are:
What zip code has the Lowest Poverty Level Among Children Under the Age of 5 in Maine?
04074 has the Lowest Poverty Level Among Children Under the Age of 5 in Maine with 0.57%.
What is the Poverty Level Among Children Under the Age of 5 in the State of Maine?
Poverty Level Among Children Under the Age of 5 in Maine is 14.4%.
What is the Poverty Level Among Children Under the Age of 5 in the United States?
Poverty Level Among Children Under the Age of 5 in the United States is 18.1%.